
What Is the Environmental Impact of Wine Entering Global Value Chains? Studying the Evolution of CO2 Emissions from the Export of Spanish Denomination of Origin Wines

 , , and
Abstract
:1. Introduction
2. Denominations of Origin as a Differentiation System
3. Materials and Methods
4. Results and Discussion
5. Conclusions
Author Contributions
Funding
Conflicts of Interest
Appendix A

Appendix B

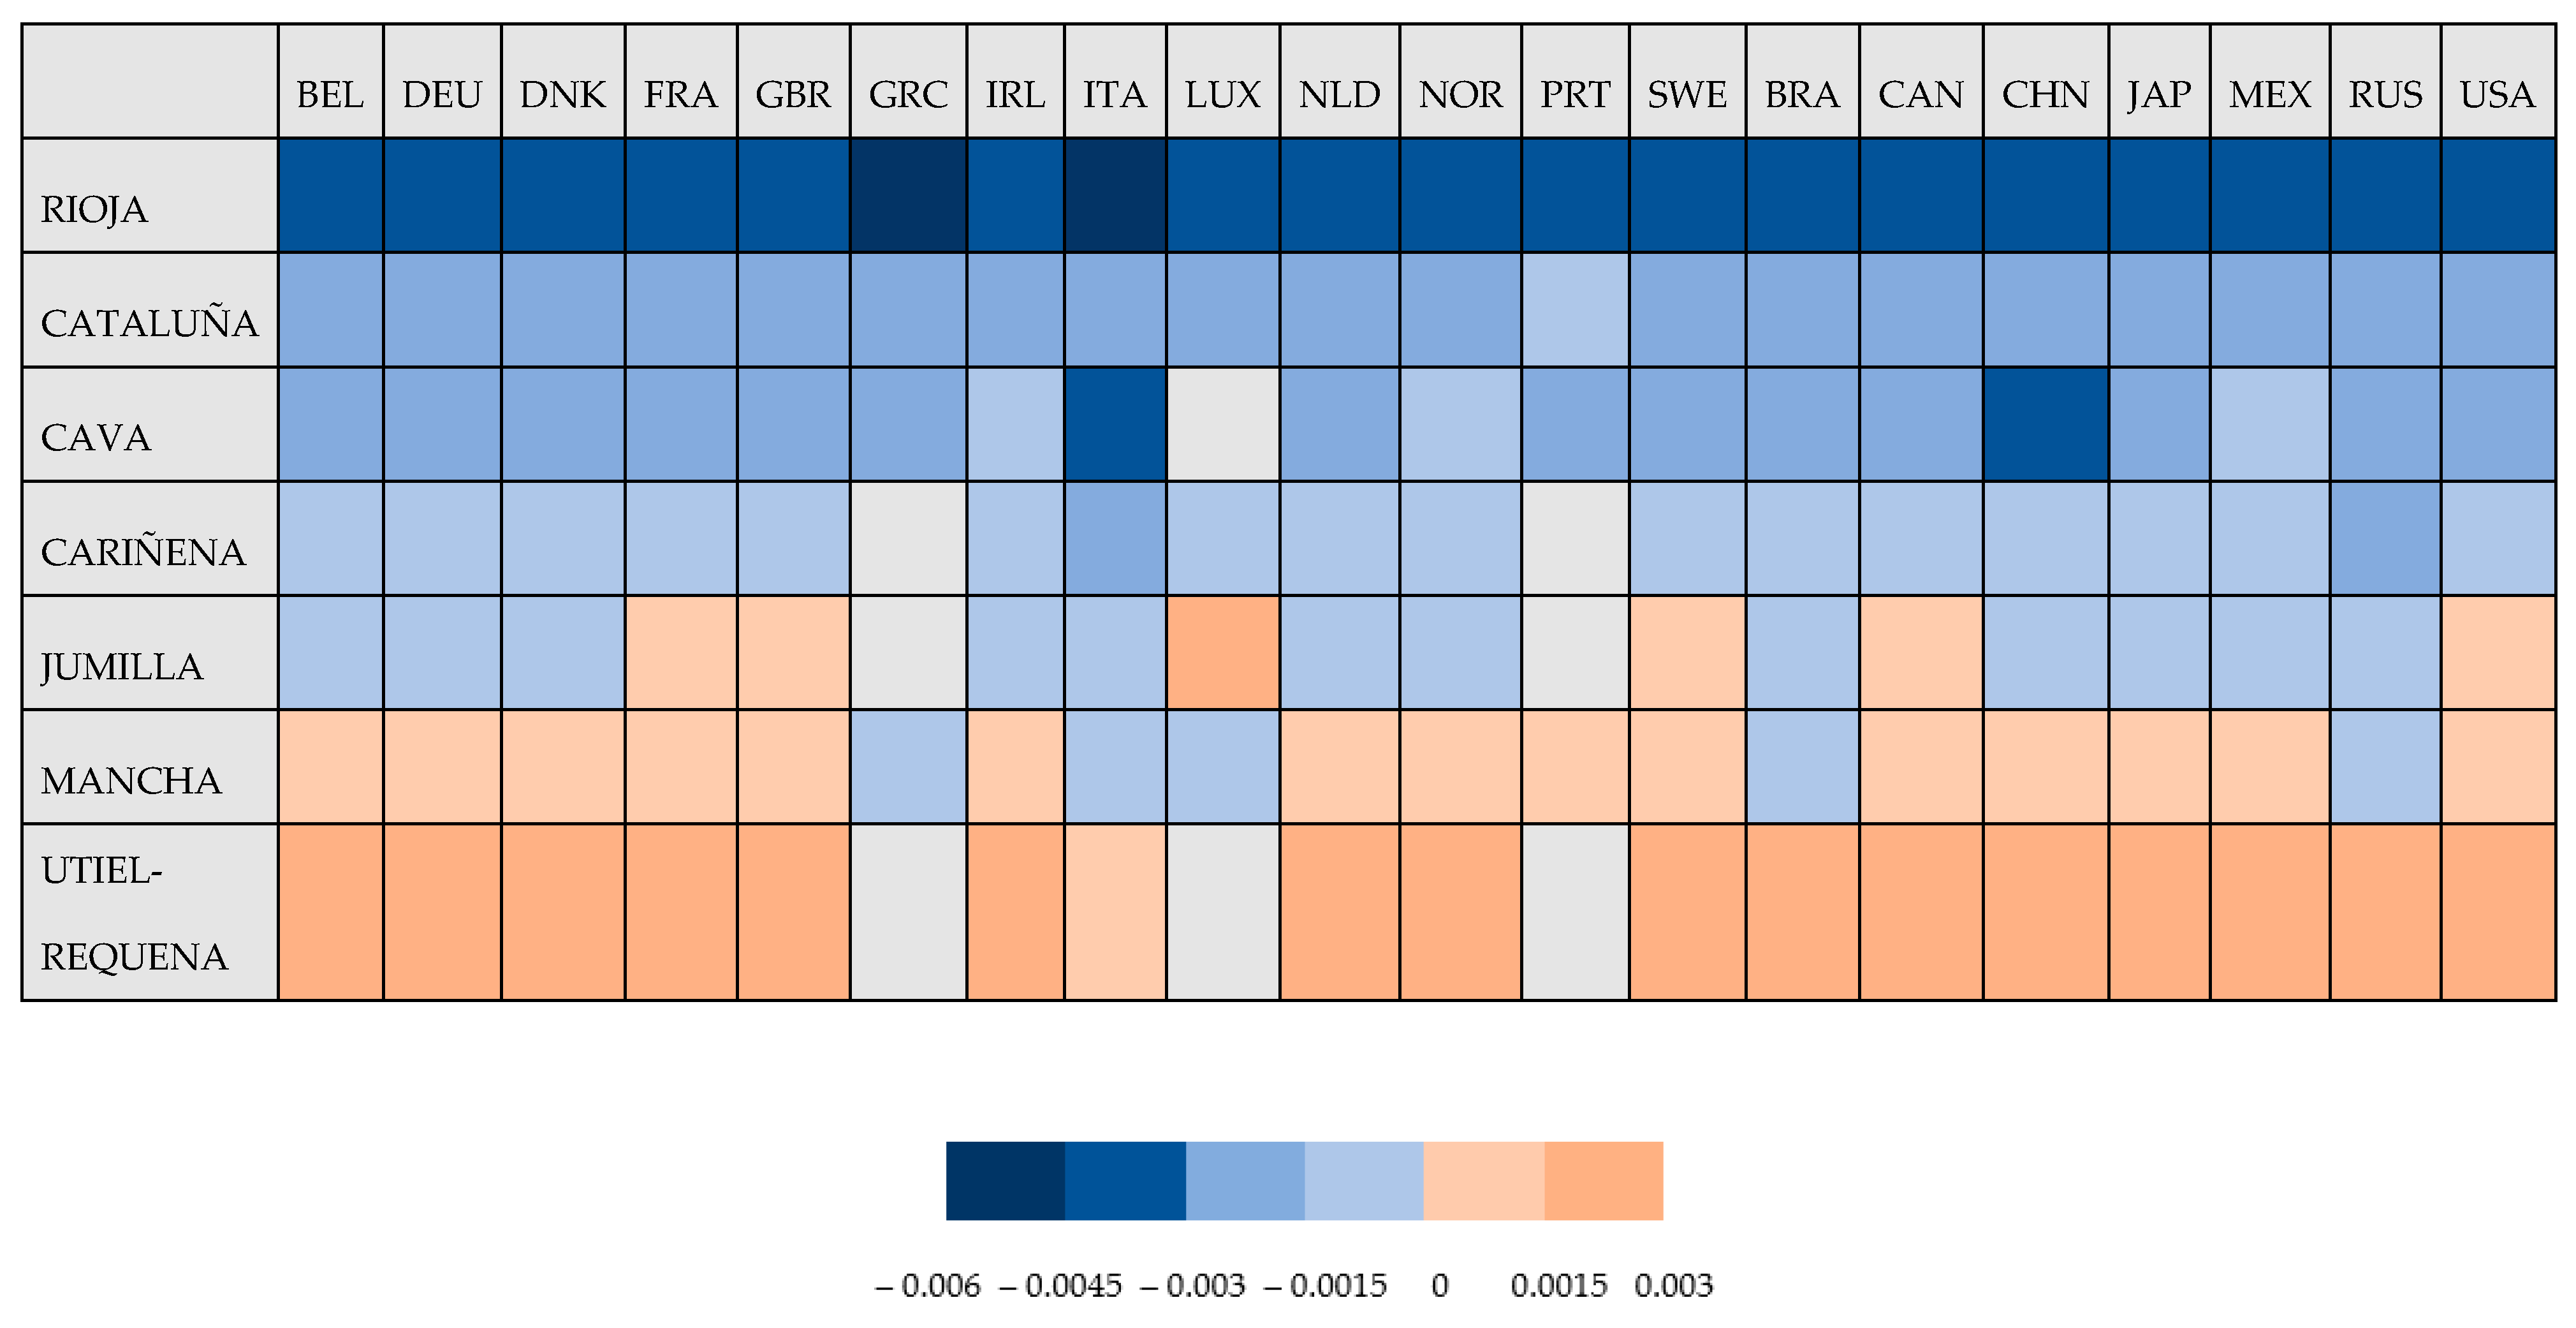
| BEL | DEU | DNK | FRA | GBR | GRC | IRL | ITA | LUX | NLD | NOR | PRT | SWE | BRA | CAN | CHN | JAP | MEX | RUS | USA | |
| RIOJA | −3.4 × 10⁻⁵ | −3.3 × 10⁻⁵ | −3.4 × 10⁻⁵ | −3.2 × 10⁻⁵ | −3.3 × 10⁻⁵ | −5.4 × 10⁻⁵ | −3.4 × 10⁻⁵ | −5.3 × 10⁻⁵ | −4.1 × 10⁻⁵ | −3.4 × 10⁻⁵ | −3.3 × 10⁻⁵ | −3.0 × 10⁻⁵ | −3.3 × 10⁻⁵ | −3.6 × 10⁻⁵ | −3.2 × 10⁻⁵ | −3.8 × 10⁻⁵ | −3.4 × 10⁻⁵ | −3.8 × 10⁻⁵ | −3.9 × 10⁻⁵ | −3.3 × 10⁻⁵ |
| CATALUÑA | −1.7 × 10⁻⁵ | −1.6 × 10⁻⁵ | −1.7 × 10⁻⁵ | −1.5 × 10⁻⁵ | −1.6 × 10⁻⁵ | −2.9 × 10⁻⁵ | −1.7 × 10⁻⁵ | −2.9 × 10⁻⁵ | −2.2 × 10⁻⁵ | −1.6 × 10⁻⁵ | −1.6 × 10⁻⁵ | −1.3 × 10⁻⁵ | −1.6 × 10⁻⁵ | −1.7 × 10⁻⁵ | −1.6 × 10⁻⁵ | −1.9 × 10⁻⁵ | −1.6 × 10⁻⁵ | −1.9 × 10⁻⁵ | −2.0 × 10⁻⁵ | −1.6 × 10⁻⁵ |
| CAVA | −2.4 × 10⁻⁵ | −2.5 × 10⁻⁵ | −2.2 × 10⁻⁵ | −2.2 × 10⁻⁵ | −2.5 × 10⁻⁵ | −1.9 × 10⁻⁵ | −1.3 × 10⁻⁵ | −3.8 × 10⁻⁵ | NA * | −2.5 × 10⁻⁵ | −1.4 × 10⁻⁵ | −2.7 × 10⁻⁵ | −2.5 × 10⁻⁵ | −2.2 × 10⁻⁵ | −2.1 × 10⁻⁵ | −3.2 × 10⁻⁵ | −2.3 × 10⁻⁵ | −1.0 × 10⁻⁵ | −2.7 × 10⁻⁵ | −2.7 × 10⁻⁵ |
| CARIÑENA | −1.2 × 10⁻⁵ | −1.2 × 10⁻⁵ | −1.2 × 10⁻⁵ | −1.1 × 10⁻⁵ | −1.2 × 10⁻⁵ | NA * | −1.2 × 10⁻⁵ | −2.0 × 10⁻⁵ | −1.5 × 10⁻⁵ | −1.2 × 10⁻⁵ | −1.2 × 10⁻⁵ | NA * | −1.1 × 10⁻⁵ | −8.7 × 10⁻⁶ | −1.1 × 10⁻⁵ | −5.9 × 10⁻⁶ | −1.2 × 10⁻⁵ | −1.4 × 10⁻⁵ | −1.7 × 10⁻⁵ | −1.1 × 10⁻⁵ |
| JUMILLA | −2.3 × 10⁻⁷ | −6.5 × 10⁻⁸ | −3.6 × 10⁻⁷ | 6.3 × 10⁻⁷ | 5.9 × 10⁻⁸ | NA * | −6.3 × 10⁻⁷ | −8.3 × 10⁻⁶ | 1.5 × 10⁻⁵ | −7.3 × 10⁻⁸ | −1.6 × 10⁻⁷ | NA * | 2.3 × 10⁻⁷ | −5.3 × 10⁻⁷ | 3.2 × 10⁻⁷ | −3.1 × 10⁻⁶ | −1.2 × 10⁻⁷ | −1.6 × 10⁻⁶ | −2.0 × 10⁻⁶ | 1.6 × 10⁻⁷ |
| MANCHA | 1.6 × 10⁻⁶ | 1.8 × 10⁻⁶ | 1.8 × 10⁻⁶ | 2.3 × 10⁻⁶ | 1.9 × 10⁻⁶ | −8.7 × 10⁻⁶ | 1.8× 10⁻⁶ | −5.6 × 10⁻⁶ | −3.1 × 10⁻⁶ | 1.6 × 10⁻⁶ | 1.7 × 10⁻⁶ | 3.7 × 10⁻⁶ | 2.2 × 10⁻⁶ | −2.4 × 10⁻⁷ | 2.2 × 10⁻⁶ | 2.1 × 10⁻⁶ | 1.6 × 10⁻⁶ | 1.2 × 10⁻⁷ | −3.4 × 10⁻⁷ | 2.0 × 10⁻⁶ |
| UTIEL-REQUENA | 1.8 × 10⁻⁵ | 1.8 × 10⁻⁵ | 1.8 × 10⁻⁵ | 1.9 × 10⁻⁵ | 1.9 × 10⁻⁵ | NA* | 1.8 × 10⁻⁵ | 8.1 × 10⁻⁶ | NA* | 1.8 × 10⁻⁵ | 1.8 × 10⁻⁵ | NA * | 1.9 × 10⁻⁵ | 1.6 × 10⁻⁵ | 1.9 × 10⁻⁵ | 1.6 × 10⁻⁵ | 1.8 × 10⁻⁵ | 1.6 × 10⁻⁵ | 1.6 × 10⁻⁵ | 1.9 × 10⁻⁵ |
References
- Williams, J.N.; Hollander, A.D.; O’Geen, A.T.; Thrupp, L.A.; Hanifin, R.; Steenwerth, K.; McGourty, G.; Jackson, L.E. Assessment of carbon in woody plants and soil across a vineyard-woodland landscape. Carbon Balance Manag. 2011, 6, 11. [Google Scholar] [CrossRef] [Green Version]
- Albrecht, A.; Kandji, S.T. Carbon sequestration in tropical agroforestry systems. Agric. Ecosyst. Environ. 2003, 99, 15–27. [Google Scholar] [CrossRef]
- Hergoualc’H, K.; Verchot, L. Stocks and fluxes of carbon associated with land use change in Southeast Asian tropical peatlands: A review. Glob. Biogeochem. Cycles 2011, 25, 1–13. [Google Scholar] [CrossRef] [Green Version]
- Murdiyarso, D.; van Noordwijk, M.; Wasrin, U.; Tomich, T.; Gillison, A. Environmental benefits and sustainable land-use options in the Jambi transect, Sumatra. J. Veg. Sci. 2002, 13, 429–438. [Google Scholar] [CrossRef]
- Brunori, E.; Farina, R.; Biasi, R. Sustainable viticulture: The carbon-sink function of the vineyard agro-ecosystem. Agric. Ecosyst. Environ. 2016, 223, 10–21. [Google Scholar] [CrossRef]
- Tezza, L.; Vendrame, N.; Pitacco, A. Disentangling the carbon budget of a vineyard: The role of soil management. Agric. Ecosyst. Environ. 2019, 272, 52–62. [Google Scholar] [CrossRef]
- Asbjornsen, H.; Hernandez-Santana, V.; Liebman, M.; Bayala, J.; Chen, J.; Helmers, M.; Ong, C.K.; Schulte, L.A. Targeting perennial vegetation in agricultural landscapes for enhancing ecosystem services. Renew. Agric. Food Syst. 2014, 29, 101–125. [Google Scholar] [CrossRef] [Green Version]
- Williams, J.N.; Morandé, J.A.; Vaghti, M.G.; Medellín-Azuara, J.; Viers, J.H. Ecosystem services in vineyard landscapes: A focus on aboveground carbon storage and accumulation. Carbon Balance Manag. 2020, 15, 1–10. [Google Scholar] [CrossRef]
- Biasi, R.; Barbera, G.; Marino, E.; Brunori, E.; Nieddu, G. Viticulture as crucial cropping system for counteracting the desertification of coastal land. In XXVIII International Horticultural Congress on Science and Horticulture for People (IHC2010); Acta Horticulturae: Lisboa, Portugal, 2010. [Google Scholar]
- Russell, A.; Battaglene, T. Trends in Environmental Assurance in Key Australian Wine Export Markets; Wine Makers Federation of Australia: Kent Town, Australia, 2007. [Google Scholar]
- Barber, N.; Taylor, C.; Strick, S. Wine consumers’ environmental knowledge and attitudes: Influence on willingness to purchase. Int. J. Wine Res. 2009, 1, 59–72. [Google Scholar] [CrossRef] [Green Version]
- Gabzdylova, B.; Raffensperger, J.F.; Castka, P. Sustainability in the New Zealand wine industry: Drivers, stakeholders and practices. J. Clean. Prod. 2009, 17, 992–998. [Google Scholar] [CrossRef]
- Ene, S.A.; Teodosiu, C.; Robu, B.; Volf, I. Water footprint assessment in the winemaking industry: A case study for a Romanian medium size production plant. J. Clean. Prod. 2013, 43, 122–135. [Google Scholar] [CrossRef]
- Weinzettel, J.; Vačkářů, D.; Medková, H. Potential net primary production footprint of agriculture: A global trade analysis. J. Ind. Ecol. 2019, 23, 1133–1142. [Google Scholar] [CrossRef]
- Smith, P.; Bustamante, M.; Ahammad, H.; Clark, H.; Dong, H.; Elsiddig, E.A.; Haberl, H.; Harper, R.; House, J.; Jafari, M.; et al. Agriculture, forestry and other land use (AFOLU). In Climate Change 2014: Mitigation of Climate Change: Contribution of Working Group III to the Fifth Assessment Report of the Intergovernmental Panel on Climate Change; Edenhofer, O., Pichs-Madruga, R., Sokona, Y., Farahani, E., Kadner, S., Seyboth, K., Adler, A., Baum, I., Brunner, S., Eickemeier, P., et al., Eds.; Cambridge University Press: Cambridge, UK, 2014; pp. 811–922. [Google Scholar]
- Foley, J.A.; Ramankutty, N.; Brauman, K.A.; Cassidy, E.A.; Gerber, J.S.; Johnston, M.; Mueller, N.D.; O’Connell, C.; Ray, D.K.; West, P.C.; et al. Solutions for a cultivated planet. Nature 2011, 478, 337–342. [Google Scholar] [CrossRef] [PubMed] [Green Version]
- Tscharntke, T.; Clough, Y.; Wanger, T.C.; Jackson, L.; Motzke, I.; Perfecto, I.; Vandermeer, J.; Whitbread, A. Global food security, biodiversity conservation and the future of agricultural intensification. Biol. Conserv. 2012, 151, 53–59. [Google Scholar] [CrossRef]
- Paiola, A.; Assandri, G.; Brambilla, M.; Zottini, M.; Pedrini, P.; Nascimbene, J. Exploring the potential of vineyards for biodiversity conservation and delivery of biodiversity-mediated ecosystem services: A global-scale systematic review. Sci. Total. Environ. 2020, 706, 135839. [Google Scholar] [CrossRef] [PubMed]
- Green, R.E.; Cornell, S.J.; Scharlemann, J.P.W.; Balmford, A. Farming and the Fate of Wild Nature. Science 2005, 307, 550–555. [Google Scholar] [CrossRef] [PubMed] [Green Version]
- Katayama, N.; Bouam, I.; Koshida, C.; Baba, Y.G. Biodiversity and yield under different land-use types in orchard/vineyard landscapes: A meta-analysis. Biol. Conserv. 2019, 229, 125–133. [Google Scholar] [CrossRef]
- Winter, S.; Bauer, T.; Strauss, P.; Kratschmer, S.; Paredes, D.; Popescu, D.M.; Landa, B.; Guzmán, G.; Gómez, J.A.; Guernion, M.; et al. Effects of vegetation management intensity on biodiversity and ecosystem services in vineyards: A meta-analysis. J. Appl. Ecol. 2018, 55, 2484–2495. [Google Scholar] [CrossRef] [PubMed] [Green Version]
- Mace, G.M.; Reyers, B.; Alkemade, R.; Biggs, R.; Chapin, F.S.; Cornell, S.; Díaz, S.; Jennings, S.; Leadley, P.; Mumby, P.; et al. Approaches to defining a planetary boundary for biodiversity. Glob. Environ. Chang. 2014, 28, 289–297. [Google Scholar] [CrossRef]
- Rockström, J.; Steffen, W.; Noone, K.; Persson, A.; Chapin, F.S.; Lambin, E.F.; Lenton, T.M.; Scheffer, M.; Folke, C.; Schellnhuber, H.J.; et al. A safe operating space for humanity. Nature 2009, 461, 472–475. [Google Scholar] [CrossRef]
- Caraveli, H. A comparative analysis on intensification and extensification in mediterranean agriculture: Dilemmas for LFAs policy. J. Rural Stud. 2000, 16, 231–242. [Google Scholar] [CrossRef]
- Alexander, P.; Rounsevell, M.; Dislich, C.; Dodson, J.R.; Engström, K.; Moran, D. Drivers for global agricultural land use change: The nexus of diet, population, yield and bioenergy. Glob. Environ. Chang. 2015, 35, 138–147. [Google Scholar] [CrossRef] [Green Version]
- Tilman, D.; Balzer, C.; Hill, J.; Befort, B.L. Global food demand and the sustainable intensification of agriculture. Proc. Natl. Acad. Sci. USA 2011, 108, 20260–20264. [Google Scholar] [CrossRef] [PubMed] [Green Version]
- Ray, D.K.; Mueller, N.D.; West, P.; Foley, J.A. Yield Trends Are Insufficient to Double Global Crop Production by 2050. PLoS ONE 2013, 8, e66428. [Google Scholar] [CrossRef] [PubMed] [Green Version]
- Horner, R.; Nadvi, K. Global value chains and the rise of the Global South: Unpacking twenty-first century polycentric trade. Glob. Netw. 2017, 18, 207–237. [Google Scholar] [CrossRef] [Green Version]
- Bolea, L.; Duarte, R.; Sánchez-Chóliz, J. Exploring carbon emissions and international inequality in a globalized world: A multiregional-multisectoral perspective. Resour. Conserv. Recycl. 2020, 152, 104516. [Google Scholar] [CrossRef]
- Wiedmann, T.; Lenzen, M. Environmental and social footprints of international trade. Nat. Geosci. 2018, 11, 314–321. [Google Scholar] [CrossRef]
- López, L.A.L.; Cadarso, M.Á.; Ortiz, M. La huella de carbono del comercio internacional español. ICE, Revista de Economía 2020, 913, 141–165. [Google Scholar] [CrossRef]
- Avetisyan, M. Impacts of global carbon pricing on international trade, modal choice and emissions from international transport. Energy Econ. 2018, 76, 532–548. [Google Scholar] [CrossRef]
- IPCC Climate Change. Mitigation of Climate Change. Contribution of Working Group III to the Fifth Assessment Report of the Intergovernmental Panel on Climate Change Cambridge; University Press: Cambridge, UK; New York, NY, USA, 2014. [Google Scholar]
- Cholette, S.; Venkat, K. The energy and carbon intensity of wine distribution: A study of logistical options for delivering wine to consumers. J. Clean. Prod. 2009, 17, 1401–1413. [Google Scholar] [CrossRef]
- Colman, T.; Päster, P. Red, white, and ‘green’: The cost of greenhouse gas emissions in the global wine trade. J. Wine Res. 2009, 20, 15–26. [Google Scholar] [CrossRef]
- Point, E.; Tyedmers, P.; Naugler, C. Life cycle environmental impacts of wine production and consumption in Nova Scotia, Canada. J. Clean. Prod. 2012, 27, 11–20. [Google Scholar] [CrossRef]
- Neto, B.; Dias, A.C.; Machado, M. Life cycle assessment of the supply chain of a Portuguese wine: From viticulture to distribution. Int. J. Life Cycle Assess. 2013, 18, 590–602. [Google Scholar] [CrossRef]
- Atkin, T.; Gilinsky, A.; Newton, S.K. Environmental strategy: Does it lead to competitive advantage in US wine industry? Int. J. Wine Bus. Res. 2012, 24, 115–133. [Google Scholar] [CrossRef]
- Christ, K.L.; Burritt, R.L. Critical environmental concerns in wine production: An integrative review. J. Clean. Prod. 2013, 53, 232–242. [Google Scholar] [CrossRef]
- Maicas, S.; Mateo, J.J. Sustainability of Wine Production. Sustainability 2020, 12, 559. [Google Scholar] [CrossRef] [Green Version]
- Marshall, R.S.; Cordano, M.; Silverman, M. Exploring individual and institutional drivers of proactive environmentalism in the US Wine industry. Bus. Strat. Environ. 2005, 14, 92–109. [Google Scholar] [CrossRef]
- Smyth, M.; Nesbitt, A. Energy and English wine production: A review of energy use and benchmarking. Energy Sustain. Dev. 2014, 23, 85–91. [Google Scholar] [CrossRef]
- Vázquez-Rowe, I.; Rugani, B.; Benetto, E. Tapping carbon footprint variations in the European wine sector. J. Clean. Prod. 2013, 43, 146–155. [Google Scholar] [CrossRef]
- Gilinsky, A., Jr.; Newton, S.K.; Vega, R.F. Sustainability in the global wine industry: Concepts and cases. Agric. Agric. Sci. Procedia 2016, 8, 37–49. [Google Scholar] [CrossRef] [Green Version]
- Santiago-Brown, I.; Jerram, C.; Metcalfe, A.; Collins, C. What Does Sustainability Mean? Knowledge Gleaned from Applying Mixed Methods Research to Wine Grape Growing. J. Mix. Methods Res. 2015, 9, 232–251. [Google Scholar] [CrossRef]
- Chiusano, L.; Cerutti, A.; Cravero, M.C.; Bruun, S.; Gerbi, V. An Industrial Ecology approach to solve wine surpluses problem: The case study of an Italian winery. J. Clean. Prod. 2015, 91, 56–63. [Google Scholar] [CrossRef]
- Corbo, C.; Lamastra, L.; Capri, E. From Environmental to Sustainability Programs: A Review of Sustainability Initiatives in the Italian Wine Sector. Sustainability 2014, 6, 2133–2159. [Google Scholar] [CrossRef] [Green Version]
- Remaud, H.; Muelles, S.; Chvyl, P.; Lockshin, L. Do Australian wine consumers value organic wine? In Proceedings of the 4th International Conference of the Academy of Wine Business Research, Siena, Italy, 17–19 July 2008. [Google Scholar]
- Forbes, S.L.; Cohen, D.A.; Cullen, R.; Wratten, S.D.; Fountain, J. Consumer attitudes regarding environmentally sustainable wine: An exploratory study of the New Zealand marketplace. J. Clean. Prod. 2009, 17, 1195–1199. [Google Scholar] [CrossRef] [Green Version]
- Bruwer, J.; Alant, K. The hedonic nature of wine tourism consumption: An experiential view. Int. J. Wine Bus. Res. 2009, 21, 235–257. [Google Scholar] [CrossRef] [Green Version]
- Bonn, M.A.; Cronin, J.J., Jr.; Cho, M. Do environmental sustainable practices of organic wine suppliers affect consumers’ behavioral intentions? The moderating role of trust. Cornell Hosp. Q. 2016, 57, 21–37. [Google Scholar] [CrossRef]
- Pomarici, E.; Vecchio, R. Millennial generation attitudes to sustainable wine: An exploratory study on Italian consumers. J. Clean. Prod. 2014, 66, 537–545. [Google Scholar] [CrossRef]
- Dressler, M.; Paunović, I. Towards a conceptual framework for sustainable business models in the food and beverage industry. Br. Food J. 2019, 122, 1421–1435. [Google Scholar] [CrossRef]
- Pullman, M.E.; Maloni, M.J.; Dillard, J. Sustainability Practices in Food Supply Chains: How is Wine Different? J. Wine Res. 2010, 21, 35–56. [Google Scholar] [CrossRef]
- Szolnoki, G. A cross-cultural comparison of sustainability in the wine-industry. J. Clean. Prod. 2013, 53, 243–251. [Google Scholar] [CrossRef]
- Berghoef, N.; Dodds, R. Potential for sustainability eco-labeling in Ontario’s wine industry. Int. J. Wine Bus. Res. 2011, 23, 298–317. [Google Scholar] [CrossRef]
- Zucca, G.; Smith, D.E.; Mitry, D.J. Sustainable viticulture and winery practices in California: What is it, and do customers care. Int. J. Wine Res. 2009, 2, 189–194. [Google Scholar]
- Vecchio, R. Determinants of willingness-to-pay for sustainable wine: Evidence from experimental auctions. Wine Econ. Policy 2013, 2, 85–92. [Google Scholar] [CrossRef] [Green Version]
- D’Souza, C.; Taghian, M.; Lamb, P. An empirical study on the influence of environmental labels on consumers. Corp. Commun. Int. J. 2006, 11, 162–173. [Google Scholar] [CrossRef] [Green Version]
- Schäufele, I.; Hamm, U. Consumers’ perceptions, preferences and willingness-to-pay for wine with sustainability characteristics: A review. J. Clean. Prod. 2017, 147, 379–394. [Google Scholar] [CrossRef]
- Szolnoki, G.; Hauck, K. Analysis of German wine consumers’ preferences for organic and non-organic wines. BFJ 2020, 122, 2077–2087. [Google Scholar] [CrossRef]
- Pomarici, E.; Vecchio, R.; Mariani, A. Wineries’ Perception of Sustainability Costs and Benefits: An Exploratory Study in California. Sustainability 2015, 7, 16164–16174. [Google Scholar] [CrossRef] [Green Version]
- Sogari, G.; Mora, C.; Menozzi, D. Factors driving sustainable choice: The case of wine. Br. Food J. 2016, 118, 632–646. [Google Scholar] [CrossRef]
- Galbreath, J.; Charles, D.; Oczkowski, E. The Drivers of Climate Change Innovations: Evidence from the Australian Wine Industry. J. Bus. Ethic 2016, 135, 217–231. [Google Scholar] [CrossRef]
- Soosay, C.; Fearne, A.; Dent, B. Sustainable value chain: A case study of Oxford Landing. Supply Chain Manag. 2012, 17, 68–77. [Google Scholar] [CrossRef]
- Evans, P.B. Embedded Autonomy: States and Industrial Transformation; Princeton University Press: Princeton, NJ, USA, 2012. [Google Scholar] [CrossRef]
- Richter, B.; Hanf, J. Cooperatives in the Wine Industry: Sustainable Management Practices and Digitalisation. Sustainability 2021, 13, 5543. [Google Scholar] [CrossRef]
- Annunziata, E.; Pucci, T.; Frey, M.; Zanni, L. The role of organizational capabilities in attaining corporate sustainability practices and economic performance: Evidence from Italian wine industry. J. Clean. Prod. 2018, 171, 1300–1311. [Google Scholar] [CrossRef]
- Grimstad, S. Developing a framework for examining business-driven sustainability initiatives with relevance to wine tourism clusters. Int. J. Wine Bus. Res. 2011, 23, 62–82. [Google Scholar] [CrossRef]
- Signori, P.; Flint, D.J.; Golicic, S.L. Constrained innovation on sustainability in the global wine industry. J. Wine Res. 2017, 28, 71–90. [Google Scholar] [CrossRef]
- Hull, C.E.; Rothenberg, S. Firm performance: The interactions of corporate social performance with innovation and industry differentiation. Strat. Manag. J. 2008, 29, 781–789. [Google Scholar] [CrossRef]
- Broccardo, L.; Zicari, A. Sustainability as a driver for value creation: A business model analysis of small and medium entreprises in the Italian wine sector. J. Clean. Prod. 2020, 259, 120852. [Google Scholar] [CrossRef]
- Schaltegger, S.; Lüdeke-Freund, F.; Hansen, E.G. Business cases for sustainability: The role of business model innovation for corporate sustainability. Int. J. Innov. Sustain. Dev. 2012, 6, 95–119. [Google Scholar] [CrossRef]
- Zhang, N.; Lin, X.; Yu, Y.; Yu, Y. Do green behaviors improve corporate value? An empirical study in China. J. Clean. Prod. 2020, 246, 119014. [Google Scholar] [CrossRef]
- Dressler, M.; Paunovic, I. A Typology of Winery SME Brand Strategies with Implications for Sustainability Communication and Co-Creation. Sustainability 2021, 13, 805. [Google Scholar] [CrossRef]
- Nilssen, R.; Bick, G.; Abratt, R. Comparing the relative importance of sustainability as a consumer purchase criterion of food and clothing in the retail sector. J. Brand Manag. 2018, 26, 71–83. [Google Scholar] [CrossRef]
- Castro, V.A.; Giraldi, J.D.M.E. Shared brands and sustainable competitive advantage in the Brazilian wine sector. Int. J. Wine Bus. Res. 2018, 30, 243–259. [Google Scholar] [CrossRef]
- Rinaldi, S.; Bonamente, E.; Scrucca, F.; Merico, M.C.; Asdrubali, F.; Cotana, F. Water and Carbon Footprint of Wine: Methodology Review and Application to a Case Study. Sustainability 2016, 8, 621. [Google Scholar] [CrossRef] [Green Version]
- Iannone, R.; Miranda, S.; Riemma, S.; De Marco, I. Improving environmental performances in wine production by a life cycle assessment analysis. J. Clean. Prod. 2016, 111, 172–180. [Google Scholar] [CrossRef]
- Scrucca, F.; Bonamente, E.; Rinaldi, S. Carbon Footprint in the Wine Industry. In Environmental Carbon Footprints; Muthu, S.S., Ed.; Butterworth-Heinemann: Oxford, UK, 2018; pp. 161–196. [Google Scholar]
- Aivazidou, E.; Tsolakis, N. A water footprint review of Italian wine: Drivers, barriers, and practices for sustainable stewardship. Water 2020, 12, 369. [Google Scholar] [CrossRef] [Green Version]
- Bonamente, E.; Scrucca, F.; Rinaldi, S.; Merico, M.C.; Asdrubali, F.; Lamastra, L. Environmental impact of an Italian wine bottle: Carbon and water footprint assessment. Sci. Total. Environ. 2016, 560–561, 274–283. [Google Scholar] [CrossRef] [PubMed]
- Dede, D.; Didaskalou, E.; Bersimis, S.; Georgakellos, D. A Statistical Framework for Assessing Environmental Performance of Quality Wine Production. Sustainability 2020, 12, 10246. [Google Scholar] [CrossRef]
- Zamagni, A. Life cycle sustainability assessment. Int. J. Life Cycle Assess. 2012, 17, 373–376. [Google Scholar] [CrossRef] [Green Version]
- Falcone, G.; De Luca, A.I.; Stillitano, T.; Strano, A.; Romeo, G.; Gulisano, G. Assessment of Environmental and Economic Impacts of Vine-Growing Combining Life Cycle Assessment, Life Cycle Costing and Multicriterial Analysis. Sustainability 2016, 8, 793. [Google Scholar] [CrossRef] [Green Version]
- Arzoumanidis, I.; Raggi, A.; Petti, L. Considerations When Applying Simplified LCA Approaches in the Wine Sector. Sustainability 2014, 6, 5018–5028. [Google Scholar] [CrossRef] [Green Version]
- Hermann, B.; Kroeze, C.; Jawjit, W. Assessing environmental performance by combining life cycle assessment, multi-criteria analysis and environmental performance indicators. J. Clean. Prod. 2007, 15, 1787–1796. [Google Scholar] [CrossRef] [Green Version]
- Rowland-Jones, R.; Pryde, M.; Cresser, M. An evaluation of current environmental management systems as indicators of environmental performance. Manag. Environ. Qual. Int. J. 2005, 16, 211–219. [Google Scholar] [CrossRef]
- Gierling, F.; Blanke, M. Carbon reduction strategies for regionally produced and consumed wine: From farm to fork. J. Environ. Manag. 2021, 278, 111453. [Google Scholar] [CrossRef] [PubMed]
- Peters, G.P.; Hertwich, E. CO2 Embodied in International Trade with Implications for Global Climate Policy. Environ. Sci. Technol. 2008, 42, 1401–1407. [Google Scholar] [CrossRef] [PubMed] [Green Version]
- Arjen, Y.; Hoekstra, T.; Wiedmann, O. Humanity’s unsustainable environmental footprint. Science 2014, 344, 1114. [Google Scholar] [CrossRef]
- Ayuda, M.-I.; Esteban, E.; Martín-Retortillo, M.; Pinilla, V. The Blue Water Footprint of the Spanish Wine Industry: 1935–2015. Water 2020, 12, 1872. [Google Scholar] [CrossRef]
- Duarte, R.; Pinilla, V.; Serrano, A. The Spanish Food Industry on Global Supply Chains and Its Impact on Water Resources. Water 2014, 7, 132–152. [Google Scholar] [CrossRef] [Green Version]
- Duarte, R.; Pinilla, V.; Serrano, A. Long Term Drivers of Global Virtual Water Trade: A Trade Gravity Approach for 1965–2010. Ecol. Econ. 2019, 156, 318–326. [Google Scholar] [CrossRef]
- Török, Á.; Jantyik, L.; Maró, Z.; Moir, H. Understanding the Real-World Impact of Geographical Indications: A Critical Review of the Empirical Economic Literature. Sustainability 2020, 12, 9434. [Google Scholar] [CrossRef]
- Lučić, S. EU trademarks for wine which contains indications of geographical origin. Ekon. Poljopr. 2018, 65, 715–729. [Google Scholar] [CrossRef]
- López-Bayón, S.; Fernández-Barcala, M.; González-Díaz, M. In search of agri-food quality for wine: Is it enough to join a geographical indication? Agribusiness 2020, 36, 568–590. [Google Scholar] [CrossRef]
- Deconinck, C.; Swinnen, J. The political Economy of Geographical Indications; Working Paper 174; American Association of Wine Economist: New York, NY, USA, 2014. [Google Scholar]
- Meloni, G.; Swinnen, J. Trade and Terroir: The Political Economy of the World’s First Geographical Indications; Working Paper 225; American Association of Wine Economist: New York, NY, USA, 2018. [Google Scholar]
- Belmin, R.; Casabianca, F.; Meynard, J.M. Contribution of transition theory to the study of geographical indications. Environ. Innov. Soc. Transit. 2018, 27, 32–47. [Google Scholar] [CrossRef]
- Allaire, G.; Sylvander, B. Globalization and Geographical Indications. In Geographical Indications and Globalization in Agrofood Supply Chains; Sylvander, B., Barham, E., Eds.; CABI Books: Wallingford, UK, 2011. [Google Scholar]
- Addor, F.; Grazioli, A. Geographical Indications beyond Wines and Spirits. J. World Intellect. Prop. 2005, 5, 865–897. [Google Scholar] [CrossRef]
- Belletti, G. Origin labelled products, reputation and heterogeneity of firms. In The Socio-Economics of Origin Labelled Products in Agro-Food Supply Chains: Spatial, Institutional and Co-Ordination Aspects; Sylvander, B., Barjolle, D., Arfini, F., Eds.; Series Actes et Communications; INRA: Paris, France, 1999; pp. 239–260. [Google Scholar]
- Dogana, B.; Gokovalib, U. Geographical indications: The aspects of rural development and marketing through the traditional products. Procedia Soc. Behav. Sci. 2012, 62, 761–765. [Google Scholar] [CrossRef] [Green Version]
- Sylvander, B.; Allaire, G.; Belletti, G.; Marescotti, A.; Barjolle, D.; Thévenod-Mottet, E.; Tregear, A. Qualité, origine et globalisation: Justifications générales et contextes nationaux, le cas des indications géographiques. Rev. Can. Sci. Régionales 2006, 29, 43–54. [Google Scholar]
- Thévenod-Mottet, E. Geographical indications and biodiversity. In Agriculture, Biodiversity and Markets: Livelihoods and Agroecology in Comparative Perspective; Lockie, S., Carpenter, D., Eds.; Earthscam: London, UK, 2010. [Google Scholar]
- Martini, A.; Frederichi, F.; Rosini, G.; Fattal, B.; Katzenelson, E.; Federici, F. A new approach to the study of yeast ecology on natural substrates. Can. J. Microbiol. 1980, 26, 856–859. [Google Scholar] [CrossRef]
- Cordero-Bueso, G.; Arroyo, T.; Serrano, A.; Tello, J.; Aporta, I.; Vélez, M.D.; Valero, E. Influence of the farming system and vine variety on yeast communities associated with grape berries. Int. J. Food Microbiol. 2011, 145, 132–139. [Google Scholar] [CrossRef]
- Longo, E.; Cansado, J.; Agrelo, D.; Villa, T.G. Effect of climatic conditions on yeast diversity in grape musts from northwest Spain. Am. J. Enol. Vitic. 1991, 42, 141–144. [Google Scholar]
- Jackson, D.I.; Lombard, P.B. Environmental and management practices affecting grape composition and wine quality-a review. Am. J. Enol. Vitic. 1993, 44, 409–430. [Google Scholar]
- Haeck, C.; Meloni, G.; Swinnen, J. The Value of Terroir: A Historical Analysis of the Bordeaux and Champagne Geographical Indications; Working Paper 234; American Association of Wine Economist: New York, NY, USA, 2018. [Google Scholar]
- Costanigro, M.; Scozzafava, G.; Casini, L. Vertical Differentiation, Perceptions Restructuring, and Wine Choices: The Case of the Gran Selezione in Chianti Wines; Working paper 211; American Association of Wine Economist: New York, NY, USA, 2017. [Google Scholar]
- Cross, R.; Plantinga, A.J.; Stanvis, R.N. Terroir in the new world: Hedonic estimation of vineyard sales price in California. J. Wine Econ. 2017, 12, 282–301. [Google Scholar] [CrossRef] [Green Version]
- Bartlett, G. An Empirical Analysis of the Effect of Sub-Divisions of American Viticultural Areas on Wine Prices: A Hedonic Study of Napa Valley. J. Wine Econ. 2020, 15, 312–329. [Google Scholar]
- Viju, C.; Yeung, M.T.; Kerr, W.A. Geographical Indications, Barriers to Market Access and Preferential Trade Agreements; Commissioned Paper; Canadian Agricultural Trade Policy and Competitiveness Research Network: Ottawa, Canada, 2012. [Google Scholar]
- Galbreath, J. Drivers of Green Innovations: Evidence from the Wine Industry; Working Paper 217; American Association of Wine Economist: New York, NY, USA, 2017. [Google Scholar]
- Yi-Ming, W.; Meng, J.; Guan, D.; Shan, Y.; Song, M.; Wei, Y.-M.; Liu, Z.; Hubacek, K. Chinese CO2 emission flows have reversed since the global financial crisis. Nat. Commun. 2017, 8, 1–10. [Google Scholar] [CrossRef]
- Wang, Q.; Hubacek, K.; Feng, K.; Guo, L.; Zhang, K.; Xue, J.; Liang, Q.-M. Distributional impact of carbon pricing in Chinese provinces. Energy Econ. 2019, 81, 327–340. [Google Scholar] [CrossRef] [Green Version]
- Meng, B.; Liu, Y.; Andrew, R.; Zhou, M.; Hubacek, K.; Xue, J.; Peters, G.; Gao, Y. More than half of China’s CO2 emissions are from micro, small and medium-size enterprises. Appl. Energy 2018, 230, 712–725. [Google Scholar] [CrossRef]
- Timmer, M.P.; Dietzenbacher, E.; Los, B.; Stehrer, R.; De Vries, G.J. An Illustrated User Guide to the World Input-Output Database: The Case of Global Automotive Production. Rev. Int. Econ. 2015, 23, 575–605. [Google Scholar] [CrossRef]
- Ministerio de Agricultura, Pesca y Alimentación (MAPA). Datos de Las Denominaciones de Origen Protegidas de Vinos (DOPs). Available online: https://www.mapa.gob.es/es/alimentacion/temas/calidaddiferenciada/informedops2017-2018modif_tcm30-513739.pdf (accessed on 12 January 2021).


Publisher’s Note: MDPI stays neutral with regard to jurisdictional claims in published maps and institutional affiliations. |
© 2021 by the authors. Licensee MDPI, Basel, Switzerland. This article is an open access article distributed under the terms and conditions of the Creative Commons Attribution (CC BY) license (https://creativecommons.org/licenses/by/4.0/).
Share and Cite
Castillo-Valero, J.S.; Carrasco, I.; Carchano, M.; Córcoles, C. What Is the Environmental Impact of Wine Entering Global Value Chains? Studying the Evolution of CO2 Emissions from the Export of Spanish Denomination of Origin Wines. Foods 2021, 10, 1664. https://0-doi-org.brum.beds.ac.uk/10.3390/foods10071664
Castillo-Valero JS, Carrasco I, Carchano M, Córcoles C. What Is the Environmental Impact of Wine Entering Global Value Chains? Studying the Evolution of CO2 Emissions from the Export of Spanish Denomination of Origin Wines. Foods. 2021; 10(7):1664. https://0-doi-org.brum.beds.ac.uk/10.3390/foods10071664
Chicago/Turabian StyleCastillo-Valero, Juan Sebastián, Inmaculada Carrasco, Marcos Carchano, and Carmen Córcoles. 2021. "What Is the Environmental Impact of Wine Entering Global Value Chains? Studying the Evolution of CO2 Emissions from the Export of Spanish Denomination of Origin Wines" Foods 10, no. 7: 1664. https://0-doi-org.brum.beds.ac.uk/10.3390/foods10071664