
Enzyme-Assisted Extraction of Fish Oil from Whole Fish and by-Products of Baltic Herring (Clupea harengus membras)


Abstract
:
1. Introduction
2. Materials and Methods
2.1. Raw Materials and Chemicals
2.2. Enzyme-Assisted Extraction
2.3. Solvent Extraction
2.4. Yield
2.5. Peroxide Value
2.6. p-Anisidine Value
2.7. Fatty Acid Analysis
2.8. Volatile Analysis
2.9. Statistical Methods
3. Results and Discussion
3.1. Yield
3.2. Fatty Acid Composition
3.3. Oxidation
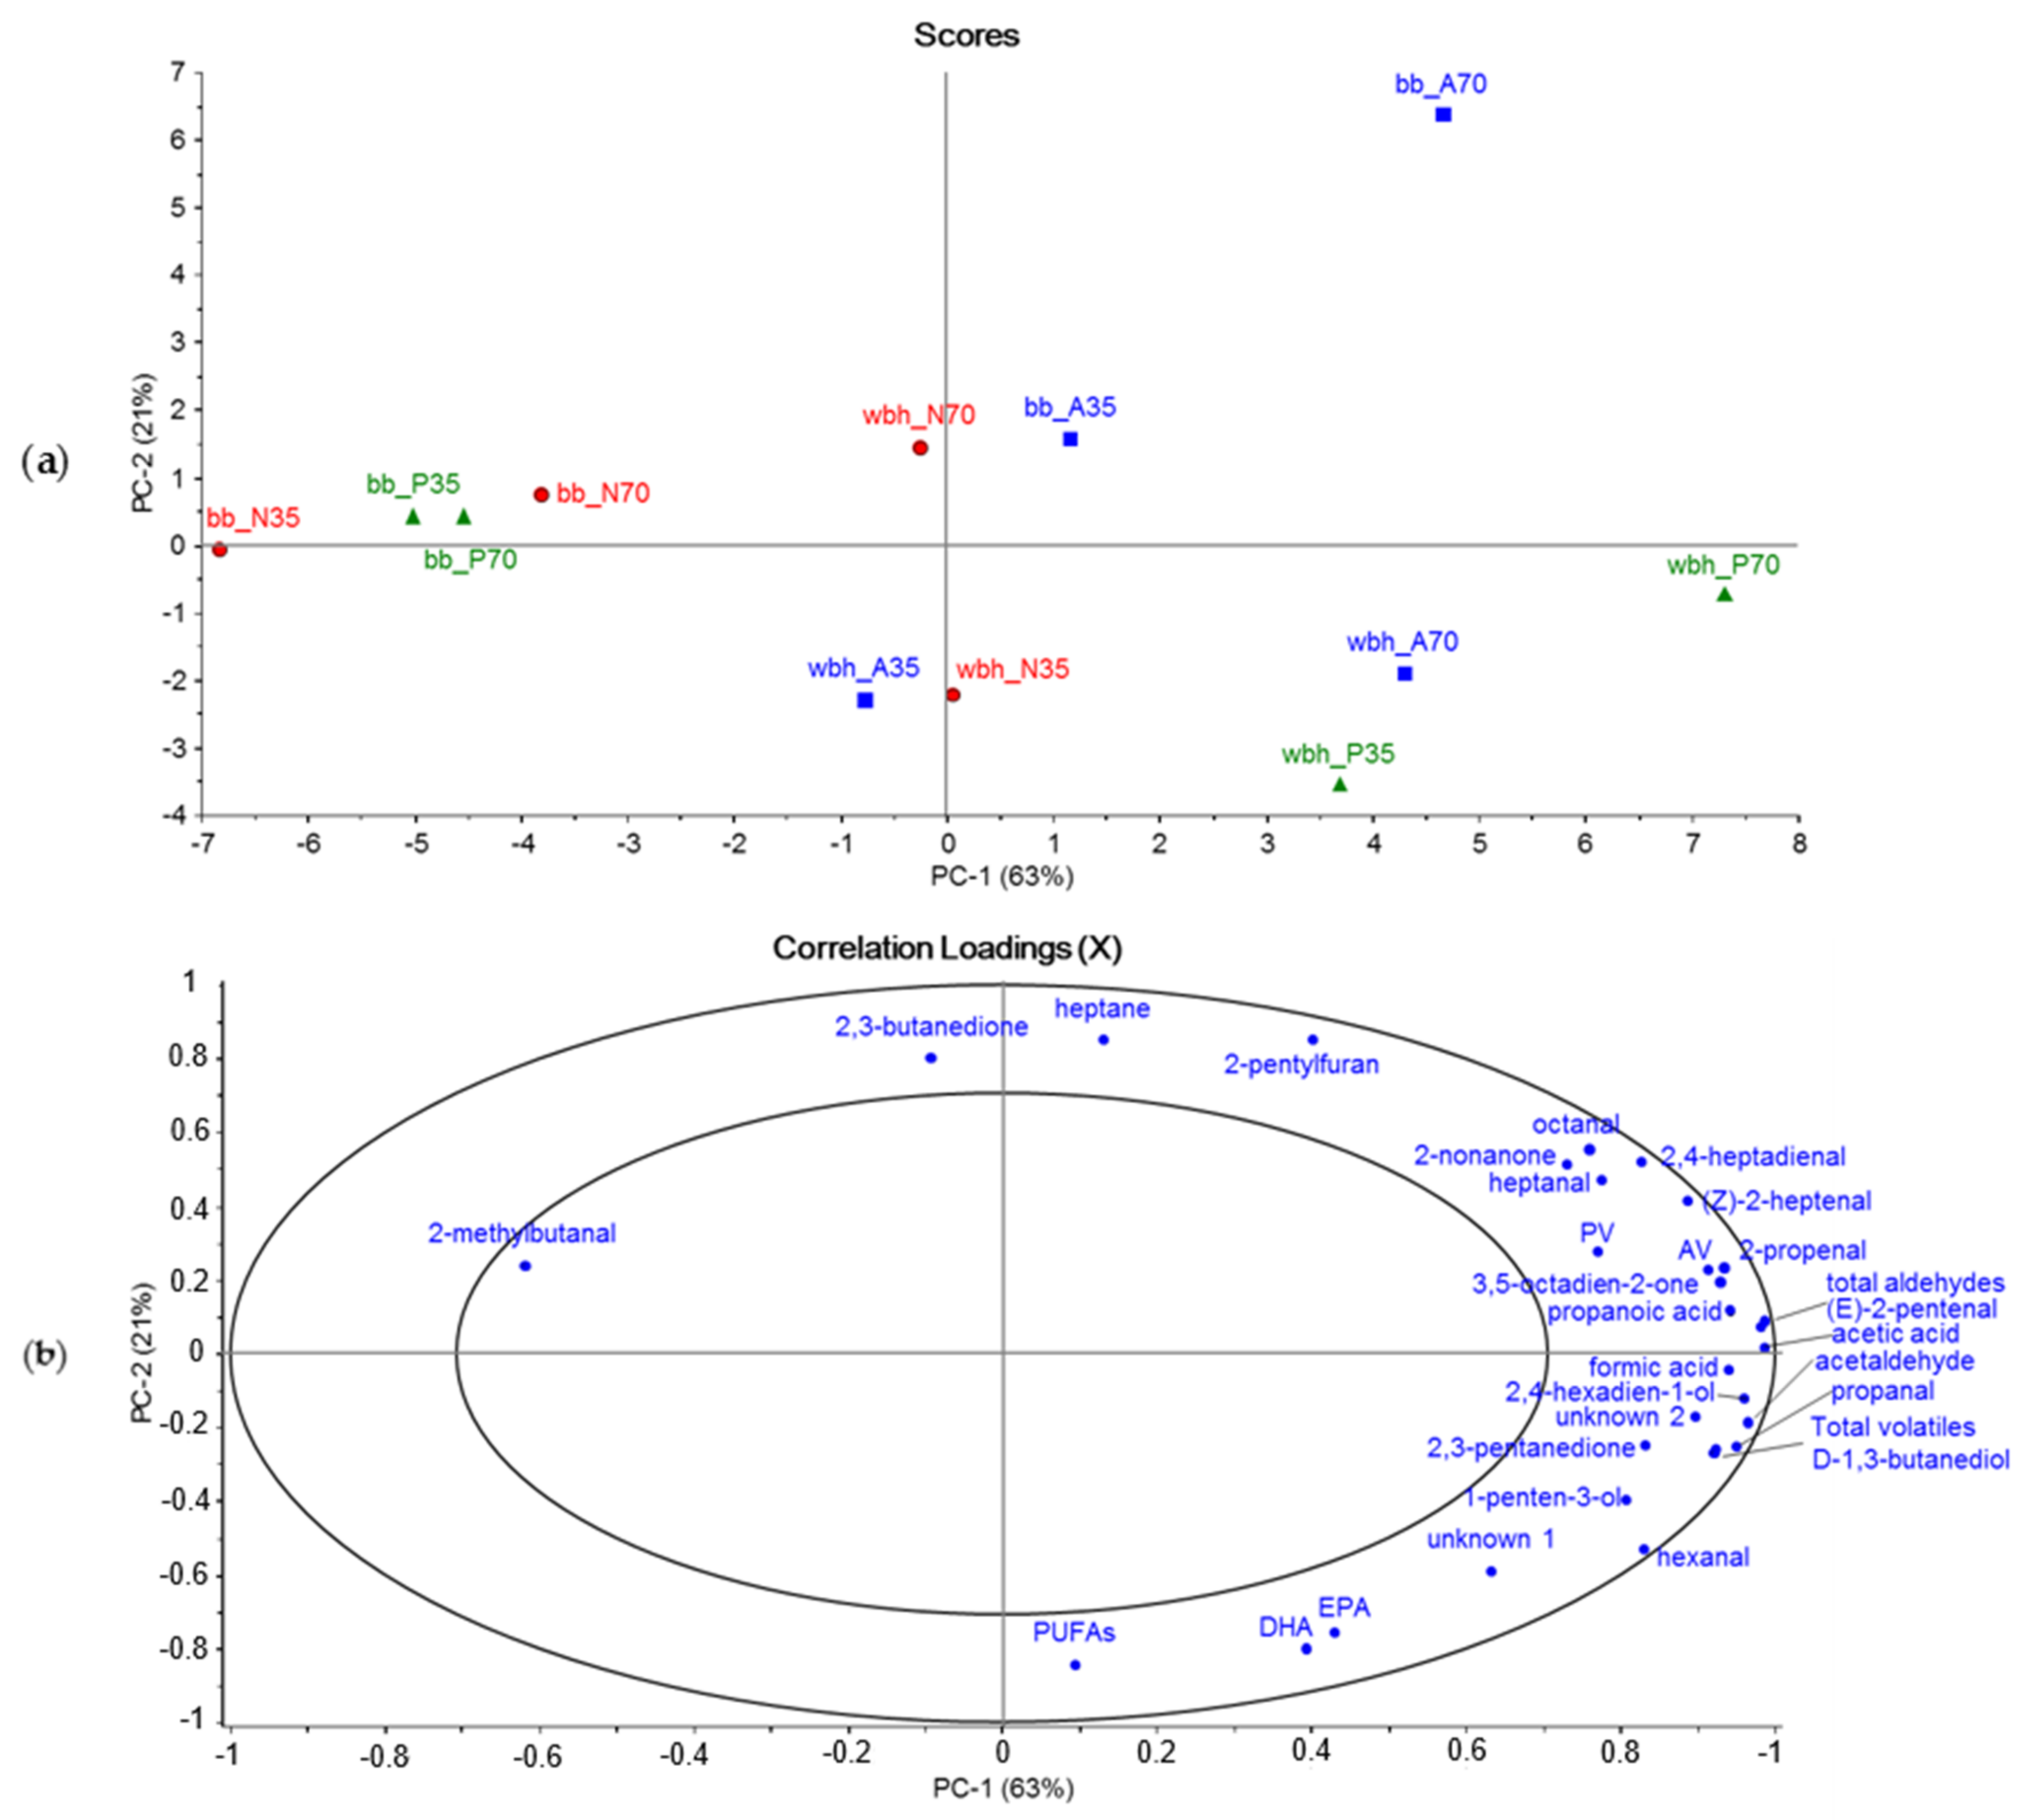
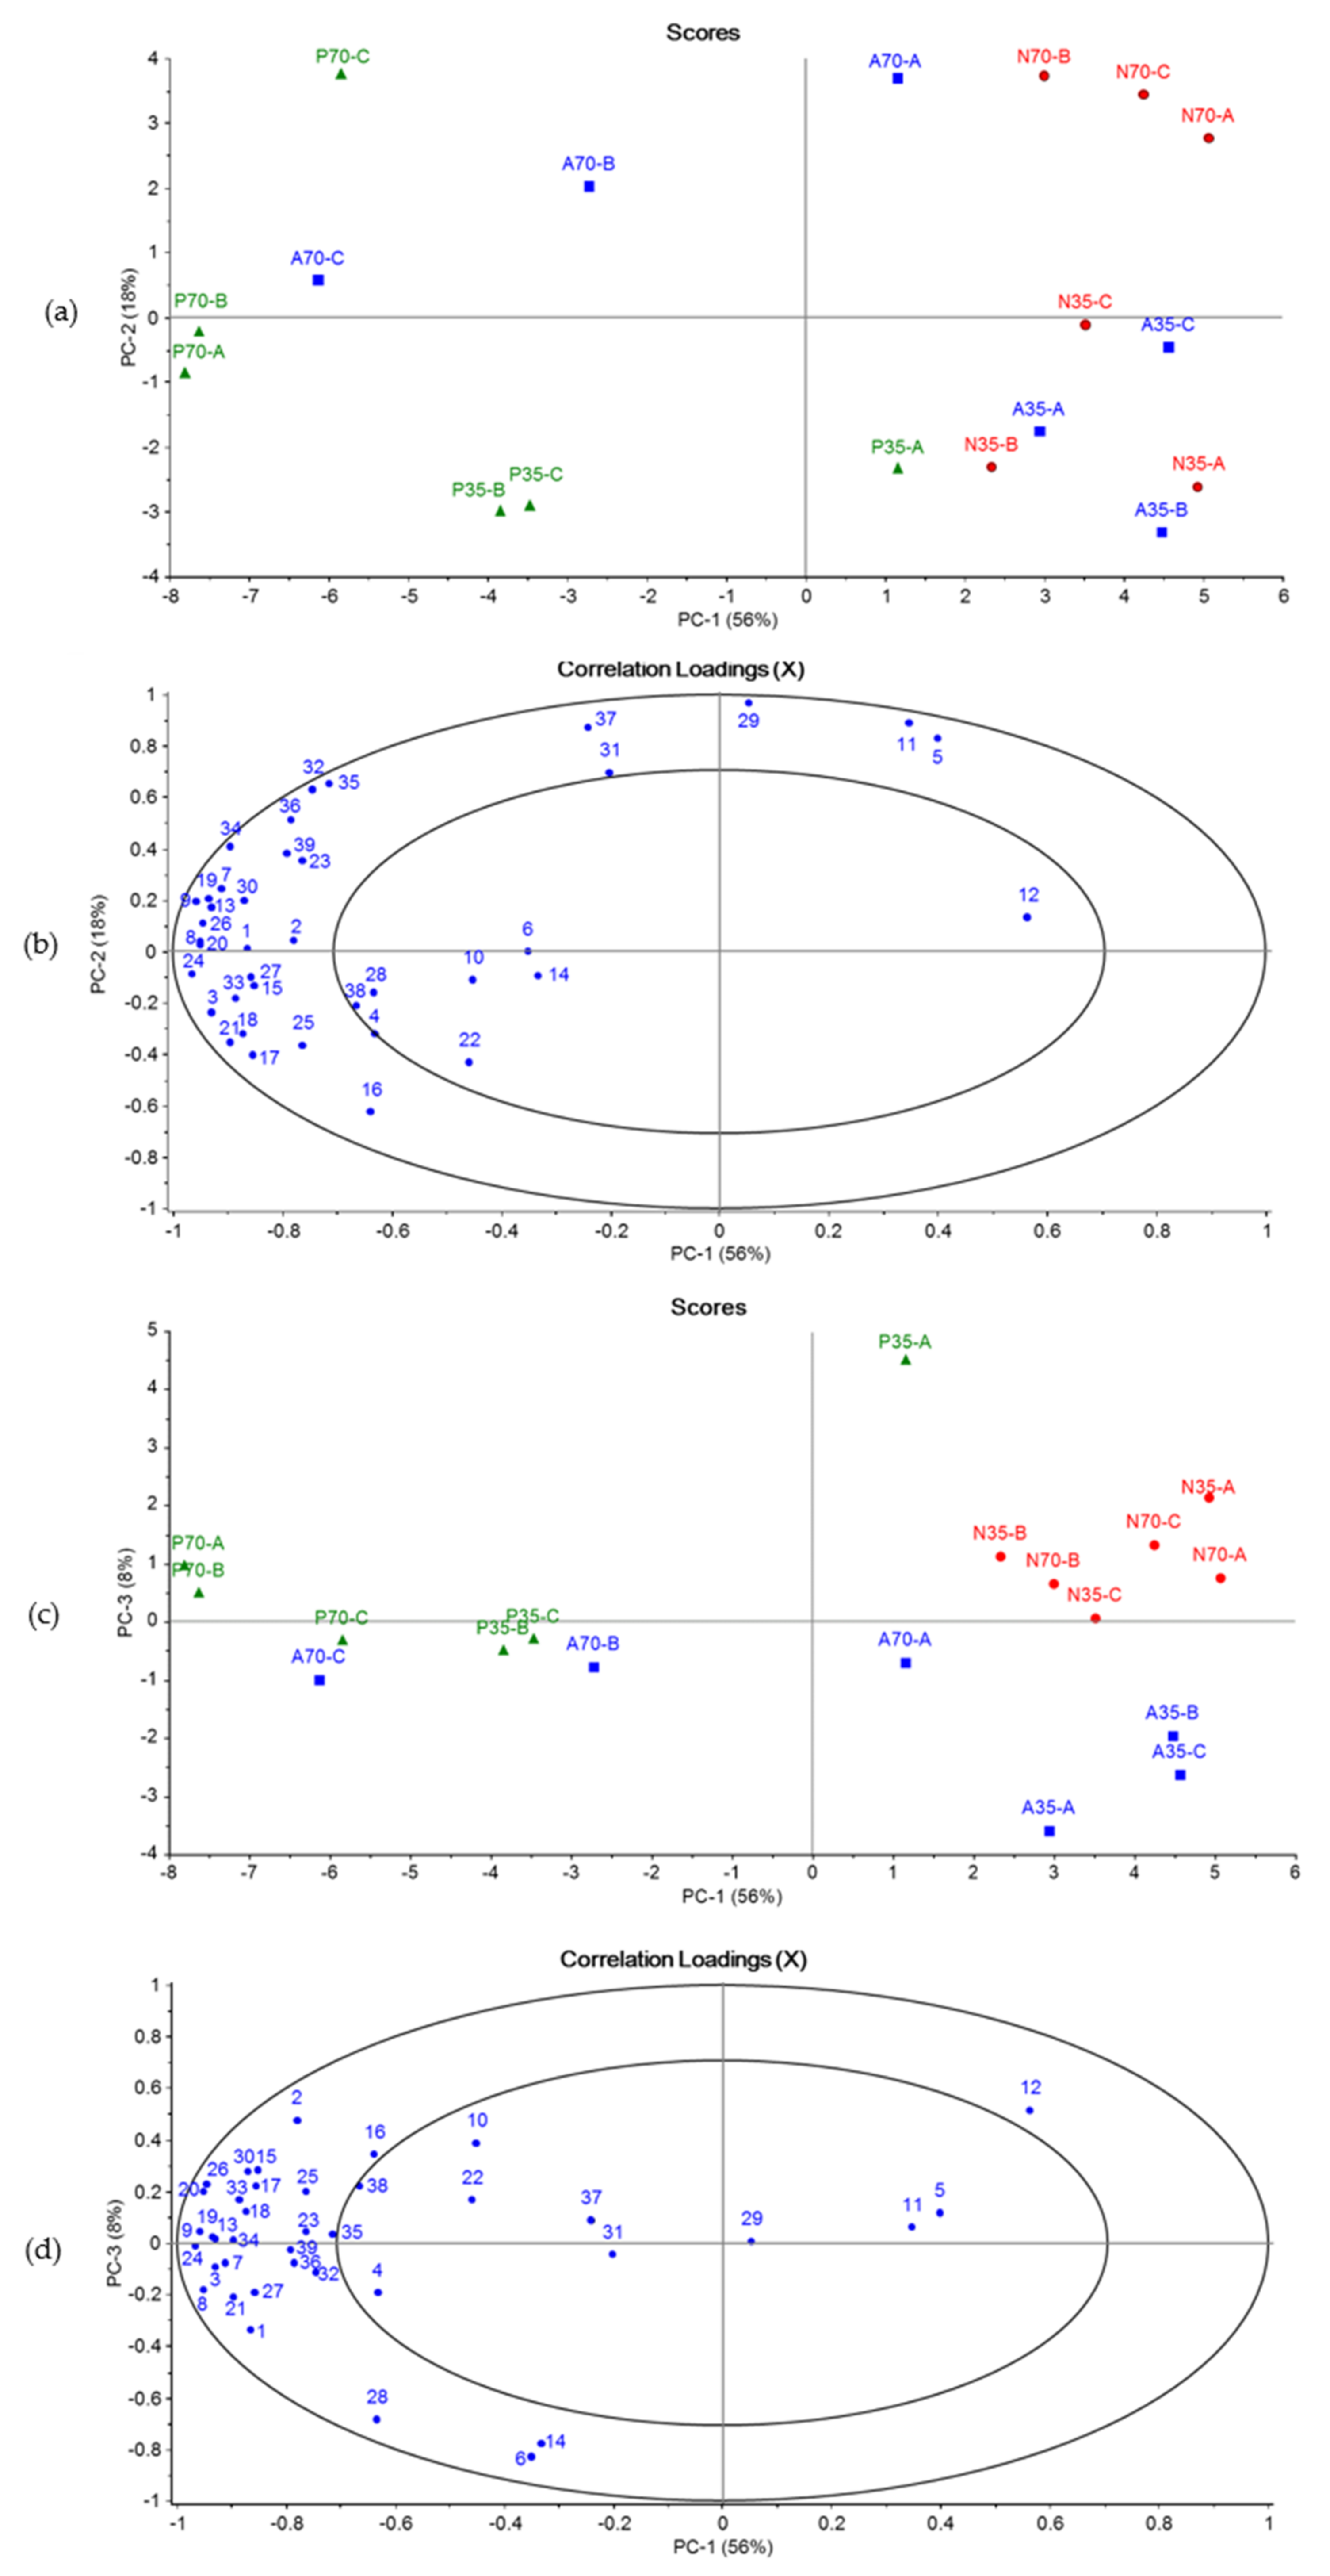
3.4. Volatiles
4. Conclusions
Author Contributions
Funding
Data Availability Statement
Acknowledgments
Conflicts of Interest
Appendix A


References
- Natural Resources Institute Finland Kalamarkkinat ja kalan kulutus. Available online: https://www.luke.fi/tietoa-luonnonvaroista/kalat-ja-kalatalous/kalamarkkinat-ja-kalan-kulutus/ (accessed on 25 June 2020).
- Commission Regulation (EC) No 1881/2006 of 19 December 2006 Setting Maximum Levels for Certain Contaminants in Foodstuffs. Available online: https://eur-lex.europa.eu/eli/reg/2006/1881/oj (accessed on 28 July 2021).
- Finnish Institute for Health and Welfare Itämeren Silakoiden Dioksiinipitoisuudet Ovat Edelleen Vähentyneet—Yhä Suuremmat Silakat Kelpaavat Vientiin—Tiedote—THL. Available online: https://thl.fi/fi/-/itameren-silakoiden-dioksiinipitoisuudet-ovat-edelleen-vahentyneet-yha-suuremmat-silakat-kelpaavat-vientiin (accessed on 18 April 2020).
- Pro Kala Silakkaa Syömällä Voimme Tukea Suomalaista Työtä. Available online: https://prokala.fi/silakkaa-syomalla-voimme-tukea-suomalaista-tyota/ (accessed on 25 June 2020).
- Aro, T.; Tahvonen, R.; Mattila, T.; Nurmi, J.; Sivonen, T.; Kallio, H. Effects of Season and Processing on Oil Content and Fatty Acids of Baltic Herring (Clupea harengus membras). J. Agric. Food Chem. 2000, 48, 6085–6093. [Google Scholar] [CrossRef] [PubMed]
- Tuomisto, J.T.; Niittynen, M.; Turunen, A.; Ung-Lanki, S.; Kiviranta, H.; Harjunpää, H.; Vuorinen, P.J.; Rokka, M.; Ritvanen, T.; Hallikainen, A. Itämeren silakka ravintona—Hyöty-haitta-analyysi. Eviran Tutkimuksia 2015, 1, 1–56. [Google Scholar]
- Ghasemi Fard, S.; Wang, F.; Sinclair, A.J.; Elliott, G.; Turchini, G.M. How Does High DHA Fish Oil Affect Health? A Systematic Review of Evidence. Crit. Rev. Food Sci. Nutr. 2019, 59, 1684–1727. [Google Scholar] [CrossRef] [PubMed] [Green Version]
- Mousa, S.A.; Swanson, D.; Block, R. Omega-3 Fatty Acids EPA and DHA: Health Benefits Throughout Life. Am. Soc. Nutr. 2012, 3, 1–7. [Google Scholar]
- FAO. The State of World Fisheries and Aquaculture 2018: Meeting the Sustainable Development Goals; The State of World Fisheries and Aquaculture (SOFIA); FAO: Rome, Italy, 2018; ISBN 978-92-5-130562-1. [Google Scholar]
- Marsol-Vall, A.; Aitta, E.; Guo, Z.; Yang, B. Green Technologies for Production of Oils Rich in N-3 Polyunsaturated Fatty Acids from Aquatic Sources. Crit. Rev. Food Sci. Nutr. 2021, 1–21. [Google Scholar] [CrossRef]
- Halim, N.R.A.; Yusof, H.M.; Sarbon, N.M. Functional and Bioactive Properties of Fish Protein Hydolysates and Peptides: A Comprehensive Review. Trends Food Sci. Technol. 2016, 51, 24–33. [Google Scholar] [CrossRef]
- Sahena, F.; Zaidul, I.S.M.; Jinap, S.; Jahurul, M.H.A.; Khatib, A.; Norulaini, N.A.N. Extraction of Fish Oil from the Skin of Indian Mackerel Using Supercritical Fluids. J. Food Eng. 2010, 99, 63–69. [Google Scholar] [CrossRef]
- Asaduzzaman, A.K.M.; Chun, B.-S. Recovery of Functional Materials with Thermally Stable Antioxidative Properties in Squid Muscle Hydrolyzates by Subcritical Water. J. Food Sci. Technol. 2015, 52, 793–802. [Google Scholar] [CrossRef] [Green Version]
- Mbatia, B.; Adlercreutz, D.; Adlercreutz, P.; Mahadhy, A.; Mulaa, F.; Mattiasson, B. Enzymatic Oil Extraction and Positional Analysis of ω-3 Fatty Acids in Nile Perch and Salmon Heads. Process Biochem. 2010, 45, 815–819. [Google Scholar] [CrossRef]
- Rai, A.; R, J.; Hathwar, S.; Nm, S.; Bhaskar, N.; Baskaran, V. Application of Native Lactic Acid Bacteria (LAB) for Fermentative Recovery of Lipids and Proteins from Fish Processing Wastes: Bioactivities of Fermentation Products. J. Aquat. Food Prod. Technol. 2011, 20, 32–44. [Google Scholar] [CrossRef]
- Domínguez-Vega, E.; García, M.C.; Crego, A.L.; Marina, M.L. First Approach Based on Direct Ultrasonic Assisted Enzymatic Digestion and Capillary-High Performance Liquid Chromatography for the Peptide Mapping of Soybean Proteins. J. Chromatogr. A 2010, 1217, 6443–6448. [Google Scholar] [CrossRef]
- Rahimi, M.A.; Omar, R.; Ethaib, S.; Mazlina, M.K.S.; Biak, D.R.A.; Aisyah, R.N. Microwave-Assisted Extraction of Lipid from Fish Waste. IOP Conf. Ser. Mater. Sci. Eng. 2017, 206, 012096. [Google Scholar] [CrossRef]
- Hathwar, S.C.; Bijinu, B.; Rai, A.K.; Narayan, B. Simultaneous Recovery of Lipids and Proteins by Enzymatic Hydrolysis of Fish Industry Waste Using Different Commercial Proteases. Appl. Biochem. Biotechnol. 2011, 164, 115–124. [Google Scholar] [CrossRef] [PubMed]
- Slizyte, R.; Mozuraityte, R.; Remman, T.; Rustad, T. Two-stage Processing of Salmon Backbones to Obtain High-quality Oil and Proteins. Int. J. Food Sci. Technol. 2018, 53. [Google Scholar] [CrossRef]
- Marmon, S. Protein Isolation from Herring (Clupea harengus) Using the PH-Shift Process. Ph.D. Thesis, Chalmers University of Technology, Göteborg, Sweden, 2012. [Google Scholar]
- Ozogul, Y.; Ucar, Y.; Takadaş, F.; Durmus, M.; Köşker, A.R.; Polat, A. Comparision of Green and Conventional Extraction Methods on Lipid Yield and Fatty Acid Profiles of Fish Species. Eur. J. Lipid Sci. Technol. 2018, 120, 1800107. [Google Scholar] [CrossRef]
- Christie, W.W. A Simple Procedure for Rapid Transmethylation of Glycerolipids and Cholesteryl Esters. J. Lipid Res. 1982, 23, 1072–1075. [Google Scholar] [CrossRef]
- Keinänen, M.; Käkelä, R.; Ritvanen, T.; Myllylä, T.; Pönni, J.; Vuorinen, P.J. Fatty Acid Composition of Sprat (Sprattus sprattus) and Herring (Clupea harengus) in the Baltic Sea as Potential Prey for Salmon (Salmo salar). Helgol. Mar. Res. 2017, 71, 4. [Google Scholar] [CrossRef] [Green Version]
- Rajasilta, M.; Hänninen, J.; Laaksonen, L.; Laine, P.; Suomela, J.-P.; Vuorinen, I.; Mäkinen, K. Influence of Environmental Conditions, Population Density, and Prey Type on the Lipid Content in Baltic Herring (Clupea harengus membras) from the Northern Baltic Sea. Can. J. Fish. Aquat. Sci. 2019, 76, 576–585. [Google Scholar] [CrossRef]
- Głowacz-Różyńska, A.; Tynek, M.; Malinowska-Pańczyk, E.; Martysiak-Żurowska, D.; Pawłowicz, R.; Kołodziejska, I. Comparison of Oil Yield and Quality Obtained by Different Extraction Procedures from Salmon (Salmo salar) Processing Byproducts: “Cold” Extraction of Fish Oil. Eur. J. Lipid Sci. Technol. 2016, 118, 1759–1767. [Google Scholar] [CrossRef]
- Iberahim, N.I.; Hamzah, Z.; Yin, Y.J.; Sohaimi, K.S.A. Extraction and Characterization of Omega-3 Fatty Acid from Catfish Using Enzymatic Hydrolysis Technique. MATEC Web Conf. 2018, 187, 01005. [Google Scholar] [CrossRef]
- Vv, R.; Ghaly, A.; Brooks, M.; Budge, S. Extraction of Oil from Mackerel Fish Processing Waste Using Alcalase Enzyme. J. Bioprocess. Biotech. 2013, 3, 2. [Google Scholar]
- Šližyte, R.; Daukšas, E.; Falch, E.; Storrø, I.; Rustad, T. Yield and Composition of Different Fractions Obtained after Enzymatic Hydrolysis of Cod (Gadus morhua) by-Products. Process Biochem. 2005, 40, 1415–1424. [Google Scholar] [CrossRef]
- Szlinder-Richert, J.; Usydus, Z.; Wyszyński, M.; Adamczyk, M. Variation in Fat Content and Fatty-Acid Composition of the Baltic Herring Clupea Harengus Membras. J. Fish Biol. 2010, 77, 585–599. [Google Scholar] [CrossRef]
- Damerau, A.; Kakko, T.; Tian, Y.; Tuomasjukka, S.; Sandell, M.; Hopia, A.; Yang, B. Effect of Supercritical CO2 Plant Extract and Berry Press Cakes on Stability and Consumer Acceptance of Frozen Baltic Herring (Clupea harengus membras) Mince. Food Chem. 2020, 332, 127385. [Google Scholar] [CrossRef]
- Linko, R.R.; Kaitaranta, J.K.; Vuorela, R. Comparison of the Fatty Acids in Baltic Herring and Available Plankton Feed. Comp. Biochem. Physiol. Part B Comp. Biochem. 1985, 82, 699–705. [Google Scholar] [CrossRef]
- Simopoulos, A.P. The Importance of the Ratio of Omega-6/Omega-3 Essential Fatty Acids. Biomed. Pharmacother. 2002, 56, 365–379. [Google Scholar] [CrossRef]
- Russo, G.L. Dietary N−6 and N−3 Polyunsaturated Fatty Acids: From Biochemistry to Clinical Implications in Cardiovascular Prevention. Biochem. Pharmacol. 2009, 77, 937–946. [Google Scholar] [CrossRef]
- FAO. Codex Alimentarius Commission Standard for Fish Oil CXS 329-2017; Food and Agriculture Organization of the United Nations WHO: Rome, Italy, 2017. [Google Scholar]
- Damerau, A.; Ahonen, E.; Kortesniemi, M.; Puganen, A.; Tarvainen, M.; Linderborg, K.M. Evaluation of the Composition and Oxidative Status of Omega-3 Fatty Acid Supplements on the Finnish Market Using NMR and SPME-GC–MS in Comparison with Conventional Methods. Food Chem. 2020, 330, 127194. [Google Scholar] [CrossRef] [PubMed]
- Phung, A.S.; Bannenberg, G.; Vigor, C.; Reversat, G.; Oger, C.; Roumain, M.; Galano, J.-M.; Durand, T.; Muccioli, G.G.; Ismail, A.; et al. Chemical Compositional Changes in Over-Oxidized Fish Oils. Foods 2020, 9, 1501. [Google Scholar] [CrossRef] [PubMed]
- Rahmani-Manglano, N.; González-Sánchez, I.; García-Moreno, P.; Espejo-Carpio, F.J.; Jacobsen, C.; Guadix, E. Development of Fish Oil-Loaded Microcapsules Containing Whey Protein Hydrolysate as Film-Forming Material for Fortification of Low-Fat Mayonnaise. Foods 2020, 9, 545. [Google Scholar] [CrossRef]
- Aro, T.; Tahvonen, R.; Koskinen, L.; Kallio, H. Volatile Compounds of Baltic Herring Analysed by Dynamic Headspace Sampling–Gas Chromatography–Mass Spectrometry. Eur. Food Res. Technol. 2003, 216, 483–488. [Google Scholar] [CrossRef]
- Aidos, I.; Jacobsen, C.; Jensen, B.; Luten, J.B.; van der Padt, A.; Boom, R.M. Volatile Oxidation Products Formed in Crude Herring Oil under Accelerated Oxidative Conditions. Eur. J. Lipid Sci. Technol. 2002, 104, 808–818. [Google Scholar] [CrossRef]
- Ma, R.; Liu, X.; Tian, H.; Han, B.; Li, Y.; Tang, C.; Zhu, K.; Li, C.; Meng, Y. Odor-Active Volatile Compounds Profile of Triploid Rainbow Trout with Different Marketable Sizes. Aquac. Rep. 2020, 17, 100312. [Google Scholar] [CrossRef]
- Medina, I.; Satué-Gracia, M.T.; Frankel, E.N. Static Headspace Gas Chromatographic Analyses to Determine Oxidation of Fish Muscle Lipids during Thermal Processing. J. Am. Oil Chem. Soc. 1999, 76, 231–236. [Google Scholar] [CrossRef]
- Lapsongphon, N.; Yongsawatdigul, J.; Cadwallader, K.R. Identification and Characterization of the Aroma-Impact Components of Thai Fish Sauce. J. Agric. Food Chem. 2015, 63, 2628–2638. [Google Scholar] [CrossRef] [PubMed]
- Tao, N.-P.; Wu, R.; Zhou, P.-G.; Gu, S.-Q.; Wu, W. Characterization of Odor-Active Compounds in Cooked Meat of Farmed Obscure Puffer (Takifugu obscurus) Using Gas Chromatography–Mass Spectrometry–Olfactometry. J. Food Drug Anal. 2014, 22, 431–438. [Google Scholar] [CrossRef] [PubMed]
- Turchini, G.M.; Mentasti, T.; Caprino, F.; Panseri, S.; Moretti, V.M.; Valfrè, F. Effects of Dietary Lipid Sources on Flavour Volatile Compounds of Brown Trout (Salmo trutta L.) Fillet. J. Appl. Ichthyol. 2004, 20, 71–75. [Google Scholar] [CrossRef]
- Vidal, N.P.; Manzanos, M.J.; Goicoechea, E.; Guillén, M.D. Farmed and Wild Sea Bass (Dicentrarchus labrax) Volatile Metabolites: A Comparative Study by SPME-GC/MS. J. Sci. Food Agric. 2016, 96, 1181–1193. [Google Scholar] [CrossRef] [PubMed]


| Solvent Extraction g | Alcalase | Neutrase | Protamex | ||||
|---|---|---|---|---|---|---|---|
| 35 min g/% | 70 min g/% | 35 min g/% | 70 min g/% | 35 min g/% | 70 min g/% | ||
| Pre-test (whole fish) | 4.89 ± 1.28 | 2.24 ± 0.56/45.8 | - | 2.11 ± 0.25/43.1 | - | 2.47 ± 0.71/50.5 | - |
| Whole fish * | 9.00 ± 0.46 | 4.09/45.4 | 3.85/42.8 | 5.39/59.9 | 6.25/69.4 | 4.52/50.2 | 6.08/67.6 |
| By-products * | 9.46 ± 0.23 | 4.57/48.3 | 5.13/54.2 | 5.17/54.7 | 5.44/57.5 | 4.57/48.3 | 6.14/64.9 |
| 2-Way ANOVA | Solvent Extraction | Alcalase | Neutrase | Protamex | ||||||
|---|---|---|---|---|---|---|---|---|---|---|
| Fatty Acid | Enzyme | Time | E × T | 35 min | 70 min | 35 min | 70 min | 35 min | 70 min | |
| 14:0 | ** | n | ** | 6.56 ± 0.17 c,d | 6.74 ± 0.06 d | 6.18 ± 0.05 b | 6.55 ± 0.10 c,d | 6.31 ± 0.08 b,c | 5.76 ± 0.11 a | 6.52 ± 0.12 c,d |
| 14:1(n-5) | ** | ** | ** | 0.15 ± 0.01 a | 0.72 ± 0.00 e | 0.71 ± 0.00 e | 0.83 ± 0.02 f | 0.65 ± 0.01 d | 0.49 ± 0.01 b | 0.55 ± 0.04 c |
| 16:0 | ** | n | n | 17.77 ± 0.10 a | 17.62 ± 0.15 a | 17.81 ± 0.11 a | 17.92 ± 0.06 a,b | 18.20 ± 0.22 c | 18.43 ± 0.27 c | 18.30 ± 0.29 b,c |
| 16:1(n-7) | ** | n | ** | 5.27 ± 0.12 c | 4.93 ± 0.03 b | 4.61 ± 0.05 a | 4.60 ± 0.03 a | 4.61 ± 0.06 a | 4.73 ± 0.07 a,b | 4.89 ± 0.05 b |
| 17:1(n-8) | n | n | * | 0.31 ± 0.01 a,b | 0.29 ± 0.02 a | 0.40 ± 0.03 c | 0.33 ± 0.01 a,b | 0.32 ± 0.01 a,b | 0.36 ± 0.01 b,c | 0.33 ± 0.07 a.b |
| 18:0 | ** | ** | ** | 1.24 ± 0.02 c,d | 1.15 ± 0.01 a | 1.31 ± 0.01 e | 1.27 ± 0.00 d | 1.21 ± 0.02 b,c | 1.39 ± 0.01 f | 1.19 ± 0.02 b |
| 18:1(n-9)t | n | n | * | 0.01 ± 0.02 a | 0.05 ± 0.02 b,c | 0.07 ± 0.00 c | 0.04 ± 0.01 a.b,c | 0.05 ± 0.02 b,c | 0.07 ± 0.01 c | 0.03 ± 0.00 a,b |
| 18:1(n-9)c | n | * | ** | 25.22 ± 0.10 d | 25.22 ± 0.11 c,d | 23.55 ± 0.08 a | 23.31 ± 0.05 a | 24.64 ± 0.22 b,c | 23.70 ± 0.31 a | 24.79 ± 0.21 b |
| 18:1(n-7) | n | n | * | 2.66 ± 0.02 c | 2.51 ± 0.00 a | 2.55 ± 0.02 a,b | 2.58 ± 0.01 a,b | 2.51 ± 0.03 a | 2.63 ± 0.01 b,c | 2.54 ± 0.08 a |
| 18:2(n-6)t | n | n | n | 0.08 ± 0.01 a | 0.41 ± 0.02 b,c | 0.36 ± 0.02 b,c | 0.46 ± 0.12 c | 0.42 ± 0.03 b,c | 0.34 ± 0.01 b | 0.40 ± 0.01 b,c |
| 18:2(n-6)c | n | n | ** | 4.29 ± 0.03 a | 4.62 ± 0.04 b | 4.94 ± 0.03 c | 4.70 ± 0.03 b | 5.00 ± 0.05 c | 5.09 ± 0.12 c | 4.58 ± 0.12 b |
| 18:3(n-6) | n | n | * | 0.12 ± 0.00 a | 0.15 ± 0.01 a,b | 0.17 ± 0.00 b | 0.17 ± 0.01 b | 0.12 ± 0.04 a | 0.16 ± 0.01 a,b | 0.16 ± 0.00 a,b |
| 18:3(n-3) | n | n | n | 2.39 ± 0.03 a,b | 2.48 ± 0.03 a,b | 2.97 ± 0.04 b | 2.83 ± 0.01 a,b | 2.63 ± 0.02 a | 2.96 ± 0.08 b | 2.55 ± 0.03 a,b |
| 18:4(n-3) | * | * | ** | 2.32 ± 0.01 a | 2.59 ± 0.03 b,c | 2.77 ± 0.01 d | 2.74 ± 0.02 d | 2.48 ± 0.03 b | 2.81 ± 0.08 d | 2.62 ± 0.08 c |
| 20:0 | n | n | n | 0.16 ± 0.01 | 0.13 ± 0.01 | 0.17 ± 0.02 | 0.17 ± 0.03 | 0.14 ± 0.04 | 0.16 ± 0.02 | 0.15 ± 0.03 |
| 20:1(n-9) | ** | ** | ** | 2.22 ± 0.02 c | 2.34 ± 0.01 d | 2.08 ± 0.01 b | 2.23 ± 0.02 c | 2.34 ± 0.01 d | 1.94 ± 0.04 a | 2.36 ± 0.02 d |
| 20:1(n-11) | * | * | ** | 0.31 ± 0.00 b | 0.35 ± 0.01 c,d | 0.30 ± 0.01 b | 0.33 ± 0.02 b,c | 0.35 ± 0.00 d | 0.28 ± 0.01 a | 0.36 ± 0.01 d |
| 20:2(n-6) | ** | ** | ** | 1.52 ± 0.02 a | 1.78 ± 0.02 d | 1.69 ± 0.02 c | 1.71 ± 0.01 c | 1.88 ± 0.02 e | 1.61 ± 0.03 b | 1.82 ± 0.04 d |
| 20:3(n-6) | * | n | n | 0.00 ± 0.00 a | 0.04 ± 0.02 b | 0.05 ± 0.02 b | 0.08 ± 0.01.c | 0.05 ± 0.02 b | 0.04 ± 0.00 b | 0.04 ± 0.00 b |
| 20:4(n-6) | * | n | ** | 0.46 ± 0.01 c,d | 0.38 ± 0.03 a | 0.45 ± 0.01 c,d | 0.43 ± 0.01 b,c | 0.39 ± 0.01 a | 0.48 ± 0.02 d | 0.40 ± 0.02 a.b |
| 20:3(n-3) | ** | ** | ** | 1.07 ± 0.02 a | 1.26 ± 0.02 c | 1.16 ± 0.01 b | 1.20 ± 0.01 b | 1.31 ± 0.02 d | 1.10 ± 0.02 a | 1.31 ± 0.03 c,d |
| 20:4(n-3) | ** | * | ** | 1.50 ± 0.03 a | 1.75 ± 0.02 c | 1.59 ± 0.01 b | 1.73 ± 0.01 c | 1.77 ± 0.03 c | 1.53 ± 0.03 a,b | 1.78 ± 0.05 c |
| 20:5(n-3) | * | ** | ** | 6.46 ± 0.08 b | 6.11 ± 0.06 a | 6.93 ± 0.03 c | 6.74 ± 0.03 b,c | 6.06 ± 0.09 a | 7.33 ± 0.20 d | 6.06 ± 0.16 a |
| 22:0 | n | * | * | 0.08 ± 0.00 a,b | 0.09 ± 0.01 a,b | 0.09 ± 0.01 a,b,c | 0.09 ± 0.01 b,c | 0.07 ± 0.02 a,b | 0.11 ± 0.01 c | 0.07 ± 0.01 a |
| 22:1(n-9) | * | n | ** | 0.41 ± 0.01 a | 0.49 ± 0.01 c | 0.45 ± 0.00 b | 0.49 ± 0.01 c | 0.49 ± 0.01 c | 0.42 ± 0.03 a | 0.48 ± 0.02 c |
| 22:1(n-11) | n | n | n | 0.06 ± 0.01 | 0.08 ± 0.01 | 0.08 ± 0.00 | 0.08 ± 0.01 | 0.06 ± 0.00 | 0.07 ± 0.01 | 0.08 ± 0.03 |
| 22:2(n-6) | n | * | * | 0.63 ± 0.03 a | 0.86 ± 0.02 c,d | 0.80 ± 0.01 b,c | 0.84 ± 0.02 c,d | 0.91 ± 0.10 d | 0.70 ± 0.02 a,b | 0.91 ± 0.03 d |
| 22:3(n-3) | n | n | n | 0.20 ± 0.02 | 0.22 ± 0.03 | 0.24± 0.01 | 0.22 ± 0.03 | 0.19 ± 0.01 | 0.24 ± 0.01 | 0.21 ± 0.03 |
| 22:4(n-6) | * | * | * | 0.69 ± 0.01 a,b | 0.76 ± 0.02 b,c,d | 0.75 ± 0.03 b,c | 0.76 ± 0.02 b.c,d | 0.84 ± 0.02 d | 0.65 ± 0.08 a | 0.81 ± 0.04 c,d |
| 22:5(n-3) | n | n | n | 0.88 ± 0.02 | 0.89 ± 0.01 | 0.91 ± 0.01 | 0.91 ± 0.01 | 0.91 ± 0.02 | 0.88 ± 0.01 | 0.92 ± 0.05 |
| 22:6(n-3) | * | * | ** | 11.50 ± 0.11 d | 9.68 ± 0.10 a | 10.73 ± 0.05 c | 10.23 ± 0.04 b | 9.45 ± 0.15 a | 10.76 ± 0.29 c | 9.43 ± 0.27 a |
| 24:1(n-9) | n | n | n | 1.51 ± 0.32 | 1.08 ± 0.06 | 1.12 ± 0.05 | 1.06 ± 0.07 | 1.21 ± 0.13 | 1.13 ± 0.08 | 1.11 ± 0.17 |
| 24:4(n-3) | ** | ** | ** | 1.38 ± 0.17 a,b | 1.60 ± 0.03 b,c,d | 1.47 ± 0.07 a,b,c | 1.70 ± 0.02 c,d | 1.75 ± 0.04 d | 1.20 ± 0.02 a | 1.61 ± 0.04 b,c,d |
| 24:5(n-3) | ** | n | * | 0.54 ± 0.02 a,b | 0.63 ± 0.07 b,c | 0.54 ± 0.03 a,b | 0.67 ± 0.04 c | 0.68 ± 0.05 c | 0.46 ± 0.02 a | 0.61 ± 0.04 b,c |
| SFA | * | n | n | 25.81 ± 0.26 | 25.72 ± 0.24 | 25.56 ± 0.17 | 26.02 ± 0.07 | 25.93 ± 0.32 | 25.84 ± 0.39 | 26.23 ± 0.44 |
| MUFA | n | * | ** | 38.14 ± 0.28 b | 38.06 ± 0.18 b | 35.92 ± 0.10 a | 35.86 ± 0.03 a | 37.25 ± 0.29 b | 35.83 ± 0.53 a | 37.56 ± 0.44 b |
| PUFA | n | n | ** | 36.04 ± 0.29 a | 36.2 ± 0.40 a | 38.52 ± 0.27 b | 38.13 ± 0.07 b | 36.83 ± 0.56 a | 38.33 ± 0.91 b | 36.21 ± 0.89 b |
| n-3 | n | * | ** | 28.25 ± 0.25 b,c | 27.21 ± 0.30 a,b | 29.31 ± 0.17 c | 28.97 ± 0.07 c | 27.23 ± 0.38 a | 29.27 ± 0.71 c | 27.09 ± 0.69 a,b |
| n-6 | * | * | n | 7.79 ± 0.05 a | 9.01 ± 0.10 b | 9.21 ± 0.10 b | 9.16 ± 0.12 b | 9.60 ± 0.21 c | 9.06 ± 0.22 b | 9.12 ± 0.20 b |
| 2-Way ANOVA | Solvent Extraction | Alcalase | Neutrase | Protamex | ||||||
|---|---|---|---|---|---|---|---|---|---|---|
| Fatty Acid | Enzyme | Time | E × T | 35 min | 70 min | 35 min | 70 min | 35 min | 70 min | |
| 14:0 | n | n | n | 6.69 ± 0.09 | 6.53 ± 0.03 | 6.82 ± 0.86 | 6.29 ± 0.13 | 6.94 ± 0.11 | 6.55 ± 0.04 | 6.58 ± 0.02 |
| 14:1(n-5) | * | * | ** | 0.17 ± 0.01 a | 0.61 ± 0.04 c,d | 0.56 ± 0.09 c | 0.41 ± 0.05 b | 0.68 ± 0.03 d | 0.68 ± 0.03 d | 0.69 ± 0.02 d |
| 16:0 | n | n | n | 18.39 ± 0.09 | 17.95 ± 0.06 | 19.35 ± 2.37 | 18.32 ± 0.13 | 18.71 ± 0.50 | 17.79 ± 0.04 | 17.76 ± 0.01 |
| 16:1(n-7) | ** | ** | ** | 4.79 ± 0.06 b | 5.06 ± 0.01 c | 5.38 ± 0.08 d | 4.55 ± 0.01 a | 4.88 ± 0.02 b | 4.82 ± 0.01 b | 4.89 ± 0.01 b |
| 17:1(n-8) | n | n | n | 0.29 ± 0.02 a | 0.35 ± 0.03 a,b | 0.36 ± 0.03 b | 0.30 ± 0.05 a,b | 0.34 ± 0.01 a,b | 0.30 ± 0.01 a,b | 0.34 ± 0.04 a,b |
| 18:0 | n | n | n | 1.18 ± 0.01 a | 1.35 ± 0.01 a,b | 1.39 ± 0.15 a.b | 1.21 ± 0.00 a | 1.46 ± 0.22 b | 1.27 ± 0.00 a,b | 1.21 ± 0.00 a |
| 18:1(n-9)t | n | n | * | 0.00 ± 0.00 a | 0.06 ± 0.02 b,c | 0.05 ± 0.01 b | 0.04 ± 0.02 a.b | 0.09 ± 0.03 c | 0.06 ± 0.01 b,c | 0.05 ± 0.01 b,c |
| 18:1(n-9)c | n | n | n | 24.97 ± 0.21 | 25.10 ± 0.05 | 25.51 ± 1.09 | 25.25 ± 0.11 | 24.98 ± 0.17 | 24.83 ± 0.01 | 24.65 ± 0.04 |
| 18:1(n-7) | * | n | n | 2.56 ± 0.02 a | 2.60 ± 0.01 a,b | 2.68 ± 0.12 b | 2.55 ± 0.02 a | 2.60 ± 0.03 a,b | 2.55 ± 0.00 a | 2.55 ± 0.01 a |
| 18:2(n-6)t | n | n | n | 0.12 ± 0.01 a | 0.41 ± 0.01 b | 0.42 ± 0.03 b | 0.42 ± 0.01 b | 0.52 ± 0.07 c | 0.42 ± 0.05 b | 0.41 ± 0.01 b |
| 18:2(n-6)c | n | n | n | 4.53 ± 0.04 | 4.69 ± 0.01 | 4.40 ± 0.63 | 4.81 ± 0.05 | 4.56 ± 0.05 | 4.78 ± 0.01 | 4.80 ± 0.01 |
| 18:3(n-6) | n | n | n | 0.11 ± 0.00 a | 0.15 ± 0.00 b | 0.16 ± 0.02 b | 0.15 ± 0.00 b | 0.15 ± 0.02 b | 0.17 ± 0.01 b | 0.16 ± 0.01 b |
| 18:3(n-3) | n | n | n | 2.35 ± 0.06 a,b | 2.53 ± 0.05 b | 2.19 ± 0.32 a | 2.39 ± 0.03 a,b | 2.35 ± 0.07 a,b | 2.42 ± 0.02 a,b | 2.50 ± 0.07 b |
| 18:4(n-3) | n | n | n | 2.10 ± 0.07 a | 2.42 ± 0.01 b | 2.26 ± 0.29 a,b | 2.42 ± 0.02 b | 2.34 ± 0.03 a,b | 2.51 ± 0.00 b | 2.47 ± 0.01 b |
| 20:0 | n | n | n | 0.15 ± 0.01 | 0.16 ± 0.01 | 0.17 ± 0.02 | 0.15 ± 0.04 | 0.16 ± 0.02 | 0.15 ± 0.01 | 0.14 ± 0.01 |
| 20:1(n-9) | * | n | * | 2.53 ± 0.08 a,b | 2.40 ± 0.01 a | 2.49 ± 0.11 a,b | 2.59 ± 0.01 b | 2.50 ± 0.01 a,b | 2.42 ± 0.00 a | 2.45 ± 0.01 a,b |
| 20:1(n-11) | n | n | * | 0.38 ± 0.01 a,b | 0.37 ± 0.01 a | 0.39 ± 0.02 a,b | 0.40 ± 0.00 b | 0.39 ± 0.01 a,b | 0.38 ± 0.02 a,b | 0.40 ± 0.00 a,b |
| 20:2(n-6) | * | n | n | 1.94 ± 0.02 b,c | 1.77 ± 0.02 a,b | 1.72 ± 0.23 a | 2.00 ± 0.04 c | 1.85 ± 0.05 a,b,c | 1.86 ± 0.01 a,b,c | 1.94 ± 0.02 b,c |
| 20:3(n-6) | n | n | n | 0.00 ± 0.00 a | 0.04 ± 0.02 b | 0.05 ± 0.01 b | 0.04 ± 0.01.b | 0.02 ± 0.01 a,b | 0.05 ± 0.01 b | 0.04 ± 0.01 b |
| 20:4(n-6) | n | n | n | 0.38 ± 0.01 a,b | 0.38 ± 0.02 a,b | 0.33 ± 0.04 a,b | 0.34 ± 0.01 a,b | 0.33 ± 0.03 a | 0.39 ± 0.05 b | 0.37 ± 0.01 a,b |
| 20:3(n-3) | * | n | n | 1.43 ± 0.02 c,d | 1.25 ± 0.01 a,b | 1.18 ± 0.16 a | 1.46 ± 0.02 d | 1.30 ± 0.03 a,b,c | 1.31 ± 0.03 a,b,c | 1.37 ± 0.01 b,c,d |
| 20:4(n-3) | n | n | n | 1.66 ± 0.02 a | 1.77 ± 0.03 a,b | 1.67 ± 0.25 a | 1.92 ± 0.03 b | 1.80 ± 0.05 a,b | 1.81 ± 0.02 a,b | 1.85 ± 0.00 a,b |
| 20:5(n-3) | n | n | n | 5.62 ± 0.18 | 5.83 ± 0.01 | 5.36 ± 0.76 | 5.53 ± 0.06 | 5.35 ± 0.10 | 5.87 ± 0.01 | 5.88 ± 0.01 |
| 22:0 | n | n | n | 0.07 ± 0.01 a,b | 0.08 ± 0.01 a,b | 0.09 ± 0.02 b | 0.08 ± 0.01 a,b | 0.06 ± 0.01 a | 0.08 ± 0.00 a,b | 0.08 ± 0.02 a,b |
| 22:1(n-9) | * | n | * | 0.52 ± 0.02 | 0.51 ± 0.00 | 0.53 ± 0.01 | 0.55 ± 0.00 | 0.53 ± 0.01 | 0.53 ± 0.02 | 0.52 ± 0.01 |
| 22:1(n-11) | n | n | n | 0.08 ± 0.01 | 0.09 ± 0.01 | 0.09 ± 0.01 | 0.09 ± 0.00 | 0.08 ± 0.01 | 0.08 ± 0.00 | 0.08 ± 0.02 |
| 22:2(n-6) | n | n | n | 1.00 ± 0.02 a,b | 0.92 ± 0.00 a | 0.94 ± 0.12 a,b | 1.05 ± 0.03 b | 0.96 ± 0.04 a,b | 0.97 ± 0.04 a,b | 1.01 ± 0.02 a,b |
| 22:3(n-3) | n | n | n | 0.21 ± 0.02 | 0.22 ± 0.01 | 0.23 ± 0.09 | 0.19 ± 0.02 | 0.22 ± 0.03 | 0.20 ± 0.03 | 0.20 ± 0.01 |
| 22:4(n-6) | * | n | n | 0.99 ± 0.02 c | 0.78 ± 0.03 a | 0.78 ± 0.12 a | 0.94 ± 0.01 b.c | 0.81 ± 0.08 a | 0.83 ± 0.02 a.b | 0.88 ± 0.01 a,b,c |
| 22:5(n-3) | n | n | n | 0.95 ± 0.01 | 0.92 ± 0.01 | 0.78 ± 0.12 | 0.96 ± 0.02 | 0.88 ± 0.02 | 0.93 ± 0.02 | 0.95 ± 0.02 |
| 22:6(n-3) | n | n | n | 9.26 ± 0.34 | 9.18 ± 0.05 | 8.27 ± 1.39 | 8.76 ± 0.09 | 8.48 ± 0.13 | 9.28 ± 0.03 | 9.03 ± 0.03 |
| 24:1(n-9) | n | n | * | 1.70 ± 0.43 | 1.18 ± 0.04 | 1.10 ± 0.01 | 1.07 ± 0.01 | 1.20 ± 0.02 | 1.14 ± 0.07 | 1.09 ± 0.07 |
| 24:4(n-3) | * | n | n | 2.09 ± 0.32 | 1.67 ± 0.04 | 1.64 ± 0.19 | 2.01 ± 0.03 | 1.82 ± 0.09 | 1.80 ± 0.03 | 1.91 ± 0.05 |
| 24:5(n-3) | * | n | n | 0.79 ± 0.04 b | 0.65 ± 0.04 a,b | 0.63 ± 0.09 a | 0.78 ± 0.07 b | 0.66 ± 0.03 a,b | 0.77 ± 0.06 a,b | 0.75 ± 0.08 a,b |
| SFA | n | n | n | 26.48 ± 0.17 | 26.06 ± 0.06 | 27.81 ± 3.41 | 26.05 ± 0.26 | 27.34 ± 0.67 | 25.84 ± 0.08 | 25.77 ± 0.04 |
| MUFA | * | n | n | 38.00 ± 0.66 | 38.35 ± 0.04 | 39.15 ± 1.29 | 37.79 ± 0.10 | 38.26 ± 0.22 | 37.79 ± 0.06 | 37.72 ± 0.10 |
| PUFA | n | n | n | 35.52 ± 0.75 | 35.59 ± 0.02 | 33.04 ± 4.69 | 36.16 ± 0.24 | 34.40 ± 0.72 | 36.37 ± 0.05 | 36.51 ± 0.11 |
| n-3 | n | n | n | 26.45 ± 0.74 | 26.43 ± 0.04 | 24.25 ± 3.56 | 26.41 ± 0.30 | 25.20 ± 0.48 | 26.90 ± 0.06 | 26.89 ± 0.11 |
| n-6 | n | n | n | 9.07 ± 0.05 a,b | 9.16 ± 0.03 a,b | 8.78 ± 1.14 a | 9.75 ± 0.05 b | 9.21 ± 0.25 a,b | 9.47 ± 0.01 a,b | 9.62 ± 0.03 a,b |
| Alcalase | Neutrase | Protamex | ||||
|---|---|---|---|---|---|---|
| 35 min | 70 min | 35 min | 70 min | 35 min | 70 min | |
| Whole fish | ||||||
| AV | 11.10 ± 0.61 a | 16.87 ± 2.77 b,c | 16.91 ± 0.78 b,c | 15.25 ± 0.03 a,b | 21.08 ± 1.31 c,d | 25.84 ± 0.54 d |
| PV | 22.95 ± 1.92 a | 53.66 ± 6.90 b | 54.44 ± 7.27 b | 43.65 ± 2.89 b | 57.58 ± 6.50 b | 75.65 ± 7.40 c |
| TOTOX | 54.88 | 124.19 | 125.80 | 102.56 | 136.23 | 177.14 |
| By-products | ||||||
| AV | 16.34 ± 0.37 b,c | 25.88 ± 5.80 c | 5.60 ± 1.14 a | 13.35 ± 0.29 a,b | 12.05 ± 0.30 a,b | 9.94 ± 0.03 a,b |
| PV | 49.67 ± 1.53 c | 68.43 ± 1.01 d | 23.56 ± 0.19 a | 52.05 ± 2.00 c | 35.21 ± 0.68 b | 36.77 ± 0.64 b |
| TOTOX | 115.69 | 162.74 | 52.72 | 117.44 | 82.46 | 83.48 |
| Compound Number | Compound | Identification Method | RT (min) | RI 1 |
|---|---|---|---|---|
| 1 | Acetaldehyde | STD | 6.51 | |
| 2 | 2-Propenal | MS | 9.79 | |
| 3 | Propanal | STD | 9.97 | |
| 4 | Butanal | STD | 14.55 | 638 |
| 5 | 2,3-Butanedione | MS | 14.64 | 640 |
| 6 | Unknown 1 | - | 14.84 | 644 |
| 7 | Formic acid | MS | 15.96 | 667 |
| 8 | 1,3-Butanediol | MS | 14.64 | 676 |
| 9 | Acetic acid | STD | 17.44 | 696 |
| 10 | 3-Methylbutanal | MS | 17.67 | 700 |
| 11 | Heptane | STD | 17.84 | 704 |
| 12 | 2-Methylbutanal | MS | 18.05 | 709 |
| 13 | (Z)-2-Butenal | MS | 18.13 | 711 |
| 14 | 2-Ethylfuran | STD | 18.85 | 727 |
| 15 | 1-Penten-3-one | MS | 19.31 | 738 |
| 16 | 1-Penten-3-ol | STD | 19.44 | 741 |
| 17 | 2,3-Pentanedione | MS | 19.68 | 746 |
| 18 | Cyclopentanol | MS | 19.73 | 747 |
| 19 | Propanoic acid | MS | 21.67 | 787 |
| 20 | (E)-2-Pentenal | STD | 22.41 | 801 |
| 21 | Hexanal | STD | 24.44 | 851 |
| 22 | 2-Methyl-4-pentenal | MS | 24.48 | 852 |
| 23 | 3-Hexanol | MS | 25.71 | 880 |
| 24 | 2,4-Hexadien-1-ol | MS | 26.84 | 905 |
| 25 | (E)-2-Hexenal | STD | 27.37 | 920 |
| 26 | Heptanal | STD | 28.69 | 954 |
| 27 | (E,E)-2,4-Hexadienal | STD | 30.05 | 988 |
| 28 | Unknown 2 | - | 30.58 | 1002 |
| 29 | 2-Pentylfuran | STD | 31.23 | 1020 |
| 30 | (Z)-2-Heptenal | MS | 31.48 | 1027 |
| 31 | (E)-2-(2-Pentenyl)furan | MS | 31.72 | 1034 |
| 32 | Octanal | STD | 32.55 | 1058 |
| 33 | Hexanoic acid | MS | 32.62 | 1060 |
| 34 | (E,Z)-2,4-Heptadienal | MS | 33.22 | 1076 |
| 35 | (E,E)-2,4-Heptadienal | MS | 33.81 | 1091 |
| 36 | (E,E)-3,5-Octadien-2-one | MS | 35.57 | 1146 |
| 37 | 2-Nonanone | MS | 35.73 | 1151 |
| 38 | Nonanal | STD | 36.08 | 1161 |
| 39 | 5-Ethyl-2(5H)-furanone | MS | 36.45 | 1173 |
| 40 | (E,E)-3,5-Octadien-2-one | MS | 36.52 | 1175 |
| 41 | Nonanoic acid | MS | 41.94 | 1334 |
Publisher’s Note: MDPI stays neutral with regard to jurisdictional claims in published maps and institutional affiliations. |
© 2021 by the authors. Licensee MDPI, Basel, Switzerland. This article is an open access article distributed under the terms and conditions of the Creative Commons Attribution (CC BY) license (https://creativecommons.org/licenses/by/4.0/).
Share and Cite
Aitta, E.; Marsol-Vall, A.; Damerau, A.; Yang, B. Enzyme-Assisted Extraction of Fish Oil from Whole Fish and by-Products of Baltic Herring (Clupea harengus membras). Foods 2021, 10, 1811. https://0-doi-org.brum.beds.ac.uk/10.3390/foods10081811
Aitta E, Marsol-Vall A, Damerau A, Yang B. Enzyme-Assisted Extraction of Fish Oil from Whole Fish and by-Products of Baltic Herring (Clupea harengus membras). Foods. 2021; 10(8):1811. https://0-doi-org.brum.beds.ac.uk/10.3390/foods10081811
Chicago/Turabian StyleAitta, Ella, Alexis Marsol-Vall, Annelie Damerau, and Baoru Yang. 2021. "Enzyme-Assisted Extraction of Fish Oil from Whole Fish and by-Products of Baltic Herring (Clupea harengus membras)" Foods 10, no. 8: 1811. https://0-doi-org.brum.beds.ac.uk/10.3390/foods10081811