
Prediction in the Dynamics and Spoilage of Shewanella putrefaciens in Bigeye Tuna (Thunnus obesus) by Gas Sensors Stored at Different Refrigeration Temperatures


Abstract
:
1. Introduction
2. Materials and Methods
2.1. Bacterial Strains and Cultural Conditions
2.2. Sample Preparation and Inoculation
2.3. Physicochemical Analysis
2.4. Microbiological Analysis and Growth Curve Fitting
2.4.1. Primary Models
2.4.2. Secondary Models
2.5. E-Nose Analysis
2.6. Headspace Solid Phase Microextraction Gas Chromatography/Mass Spectrometry (SPME-GC/MS) Analysis
2.7. Statistical Analysis
3. Results and Discussion
3.1. TVB-N and TMA
3.2. pH and EC
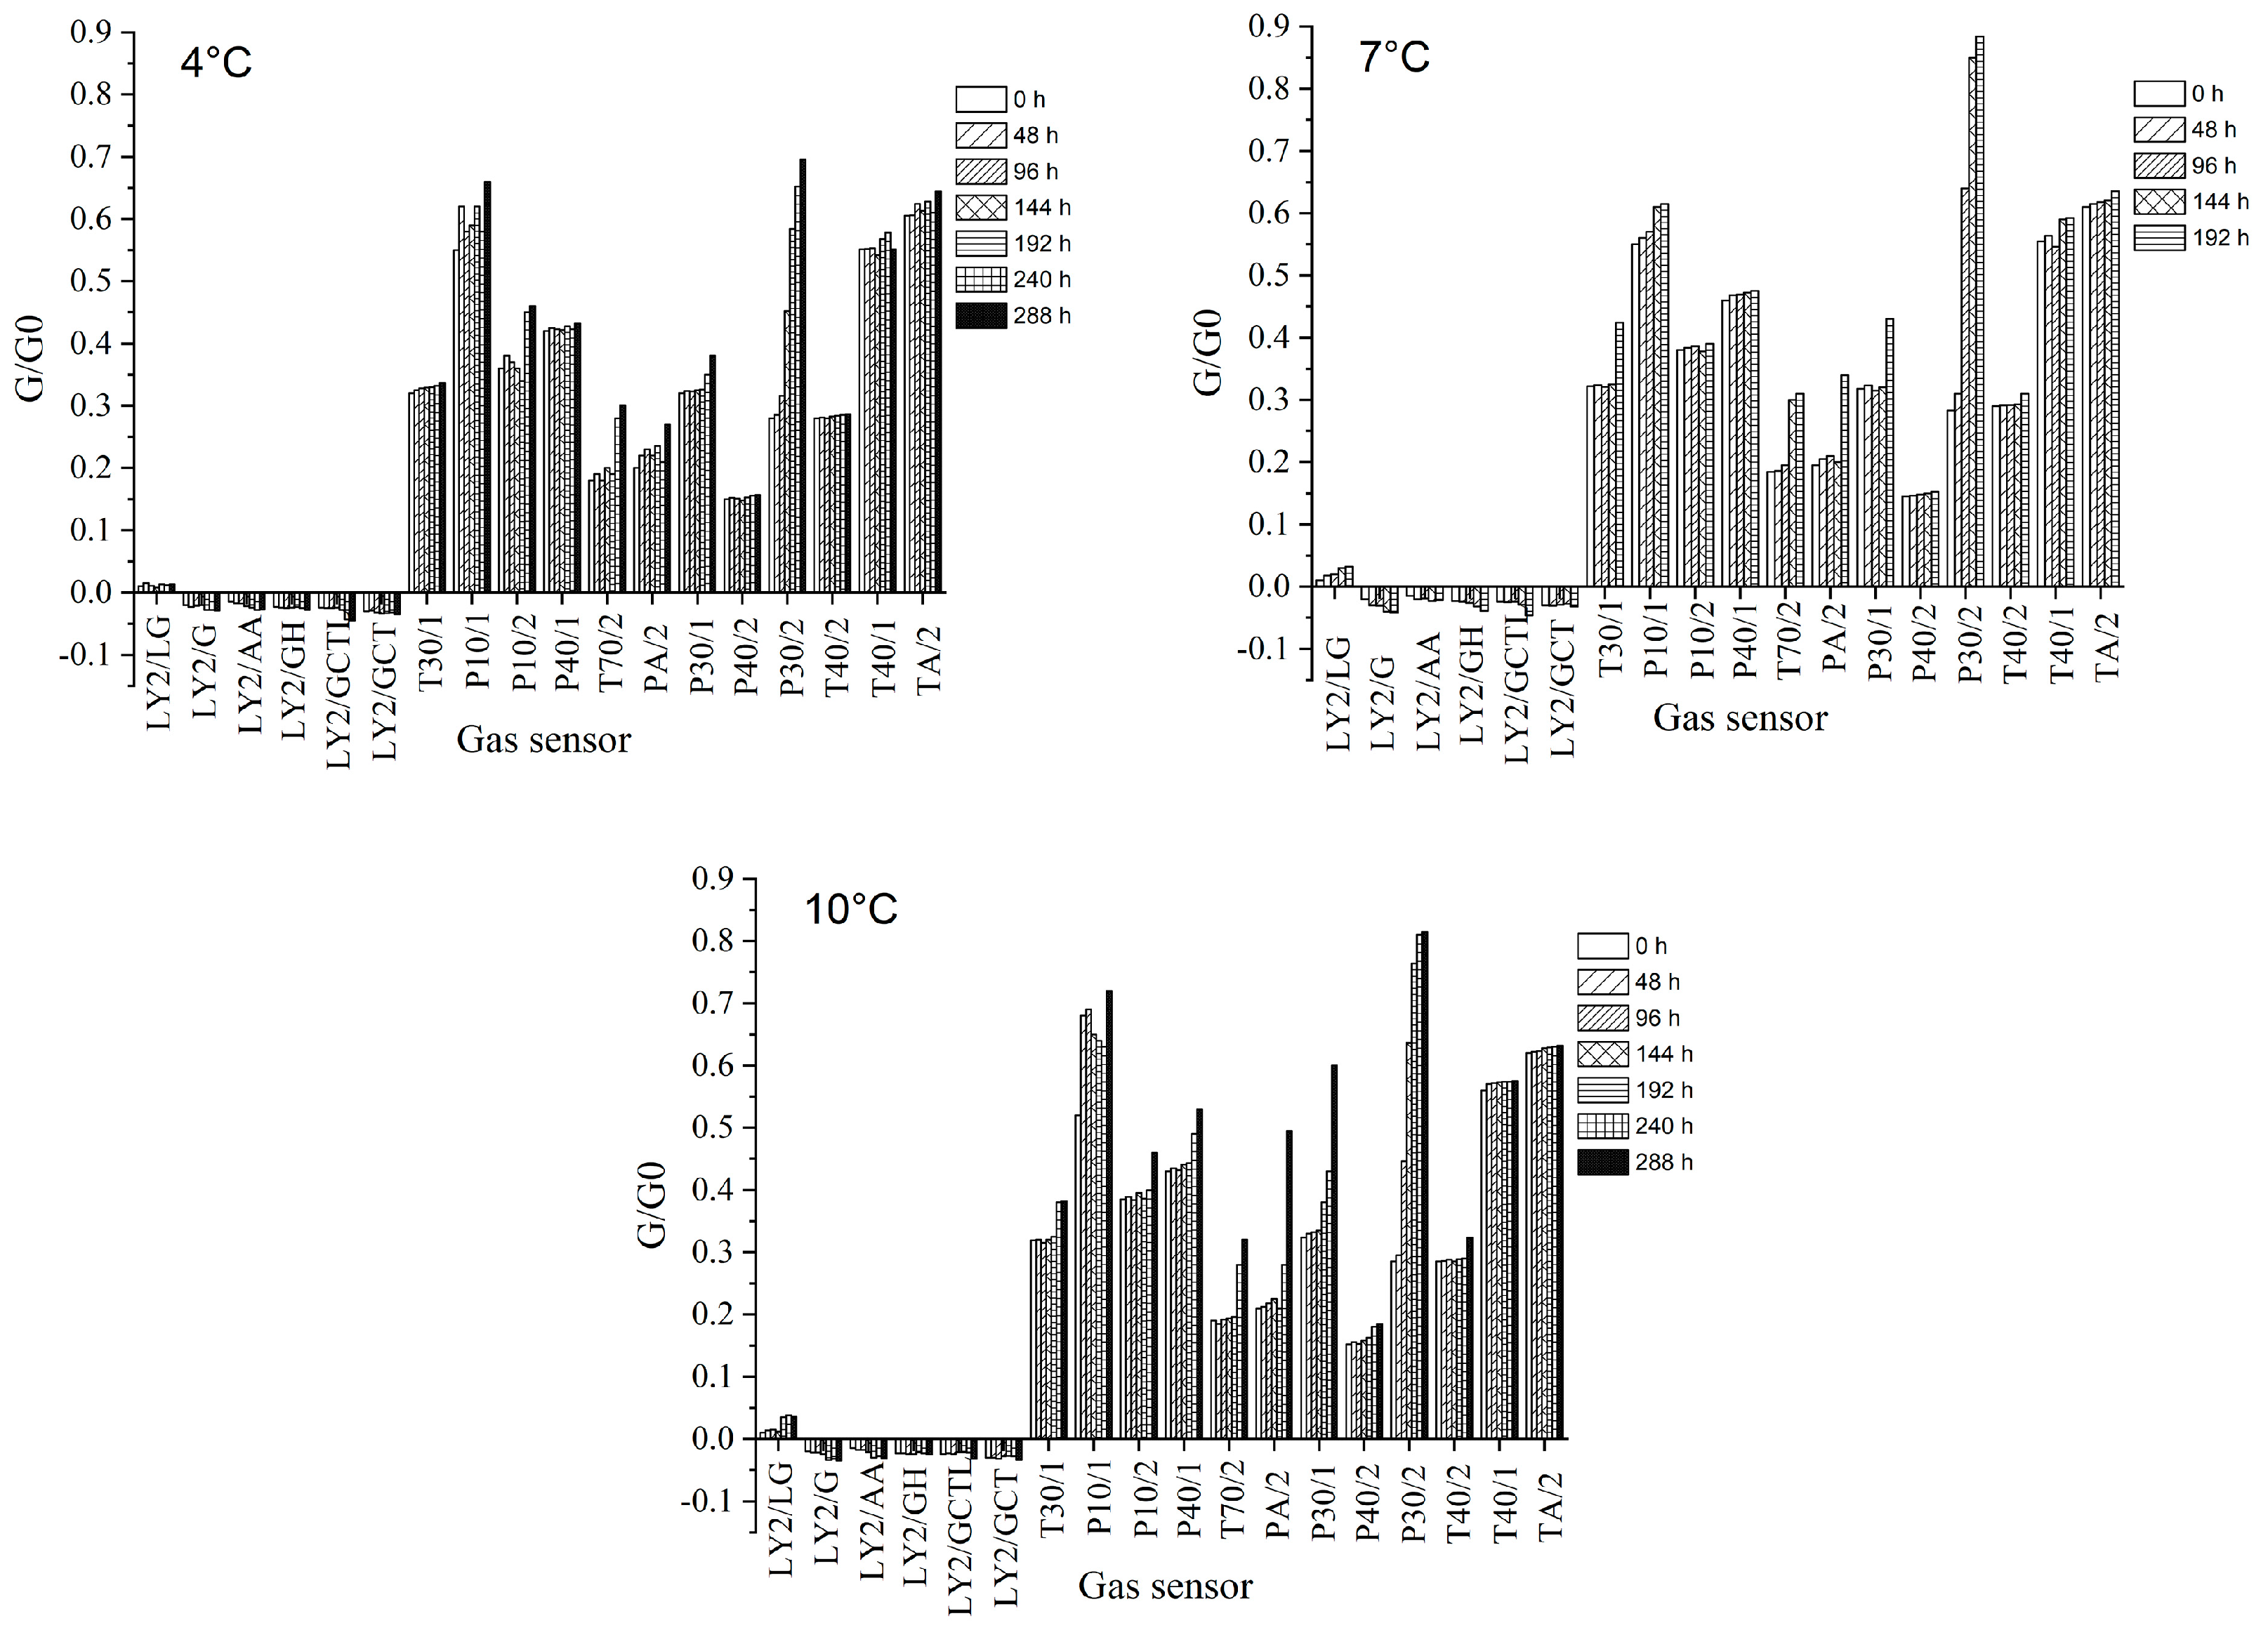
3.3. Results of the E-Nose Analysis
3.4. Dynamic Growth of S. putrefaciens in Tuna
3.5. Modeling the Kinetics of S. putrefaciens in Tuna with E-Nose Sensors
3.6. Prediction of the Spoilage of S. putrefaciens in Tuna
3.7. Volatile Compounds in Tuna Samples According to HS-SPME/GC-MS
3.8. Relationship between E-Nose Results and VOCs
4. Conclusions
Author Contributions
Funding
Institutional Review Board Statement
Informed Consent Statement
Data Availability Statement
Acknowledgments
Conflicts of Interest
References
- Kaewprachu, P.; Osako, K.; Benjakul, S.; Suthiluk, P.; Rawdkuen, S. Shelf life extension for Bluefin tuna slices (Thunnus thynnus) wrapped with myofibrillar protein film incorporated with catechin-Kradon extract. Food Control 2017, 79, 333–343. [Google Scholar] [CrossRef]
- Rossi, S.; Lee, C.; Ellis, P.; Pivarnik, L. Biogenic amines formation in bigeye tuna steaks and whole skipjack tuna. J. Food Sci. 2002, 67, 2056–2060. [Google Scholar] [CrossRef]
- Ruiz-Capillas, C.; Moral, A. Sensory and biochemical aspects of quality of whole bigeye tuna (Thunnus obesus) during bulk storage in controlled atmospheres. Food Chem. 2005, 89, 347–354. [Google Scholar] [CrossRef]
- Parlapani, F.F.; Mallouchos, A.; Haroutounian, S.A.; Boziaris, I.S. Microbiological spoilage and investigation of volatile profile during storage of sea bream fillets under various conditions. Int. J. Food Microbiol. 2014, 189, 153–163. [Google Scholar] [CrossRef] [PubMed]
- Wright, M.H.; Shalom, J.; Matthews, B.; Greene, A.C.; Cock, I.E. Terminalia ferdinandiana Exell: Extracts inhibit Shewanella spp. growth and prevent fish spoilage. Food Microbiol. 2019, 78, 114–122. [Google Scholar] [CrossRef] [PubMed] [Green Version]
- Lee, B.-H.; Wu, S.-C.; Shen, T.-L.; Hsu, Y.-Y.; Chen, C.-H.; Hsu, W.-H. The applications of Lactobacillus plantarum-derived extracellular vesicles as a novel natural antibacterial agent for improving quality and safety in tuna fish. Food Chem. 2021, 340, 128104. [Google Scholar] [CrossRef]
- Grande-Tovar, C.D.; Serio, A.; Delgado-Ospina, J.; Paparella, A.; Rossi, C.; Chaves-López, C. Chitosan films incorporated with Thymus capitatus essential oil: Mechanical properties and antimicrobial activity against degradative bacterial species isolated from tuna (Thunnus sp.) and swordfish (Xiphias gladius). J. Food Sci. Technol. 2018, 55, 4256–4265. [Google Scholar] [CrossRef] [PubMed]
- Serio, A.; Fusella, G.C.; Lopez, C.C.; Sacchetti, G.; Paparella, A. A survey on bacteria isolated as hydrogen sulfide-producers from marine fish. Food Control 2014, 39, 111–118. [Google Scholar] [CrossRef]
- Itoh, D.; Koyachi, E.; Yokokawa, M.; Murata, Y.; Murata, M.; Suzuki, H. Microdevice for on-site fish freshness checking based onk-value measurement. Anal. Chem. 2013, 85, 10962–10968. [Google Scholar] [CrossRef]
- Liu, X.; Huang, Z.; Jia, S.; Zhang, J.; Li, K.; Luo, Y. The roles of bacteria in the biochemical changes of chill-stored bighead carp (Aristichthys nobilis): Proteins degradation, biogenic amines accumulation, volatiles production, and nucleotides catabolism. Food Chem. 2018, 255, 174–181. [Google Scholar] [CrossRef]
- Odeyemi, O.A.; Burke, C.M.; Bolch, C.C.; Stanley, R. Seafood spoilage microbiota and associated volatile organic compounds at different storage temperatures and packaging conditions. Int. J. Food Microbiol. 2018, 280, 87–99. [Google Scholar] [CrossRef]
- Wang, X.-Y.; Xie, J. Study on the volatile organic compounds and its correlation with water dynamics of bigeye tuna (Thunnus obesus) during cold storage. Molecules 2019, 24, 3119. [Google Scholar] [CrossRef] [PubMed] [Green Version]
- Wu, L.; Pu, H.; Sun, D.-W. Novel techniques for evaluating freshness quality attributes of fish: A review of recent developments. Trends Food Sci. Technol. 2019, 83, 259–273. [Google Scholar] [CrossRef]
- Rasekh, M.; Karami, H.; Wilson, A.; Gancarz, M. Classification and identification of essential oils from herbs and fruits based on a MOS electronic-nose technology. Chemosensors 2021, 9, 142. [Google Scholar] [CrossRef]
- Semeano, A.T.; Maffei, D.F.; Palma, S.; Li, R.W.; Franco, B.D.; Roque, A.C.; Gruber, J. Tilapia fish microbial spoilage monitored by a single optical gas sensor. Food Control 2018, 89, 72–76. [Google Scholar] [CrossRef] [PubMed]
- Luan, L.; Fu, S.; Yuan, C.; Ishimura, G.; Chen, S.; Chen, J.; Hu, Y. Combined effect of superchilling and tea polyphenols on the preservation quality of hairtail (Trichiurus haumela). Int. J. Food Prop. 2017, 20, S992–S1001. [Google Scholar] [CrossRef] [Green Version]
- Heising, J.; Bartels, P.; van Boekel, M.; Dekker, M. Non-destructive sensing of the freshness of packed cod fish using conductivity and pH electrodes. J. Food Eng. 2014, 124, 80–85. [Google Scholar] [CrossRef]
- Sun, J.; Zhang, R.; Zhang, Y.; Liang, Q.; Li, G.; Yang, N.; Xu, P.; Guo, J. Classifying fish freshness according to the relationship between EIS parameters and spoilage stages. J. Food Eng. 2018, 219, 101–110. [Google Scholar] [CrossRef]
- Yao, L.; Luo, Y.; Sun, Y.; Shen, H. Establishment of kinetic models based on electrical conductivity and freshness indictors for the forecasting of crucian carp (Carassius carassius) freshness. J. Food Eng. 2011, 107, 147–151. [Google Scholar] [CrossRef]
- Song, Y.; Liu, L.; Shen, H.; You, J.; Luo, Y. Effect of sodium alginate-based edible coating containing different anti-oxidants on quality and shelf life of refrigerated bream (Megalobrama amblycephala). Food Control 2011, 22, 608–615. [Google Scholar] [CrossRef]
- Wang, X.-Y.; Xie, J. Growth kinetics and spoilage potential of co-culturing acinetobacter johnsonii and pseudomonas fluorescens from bigeye tuna (Thunnus obesus) during refrigerated storage. Curr. Microbiol. 2020, 77, 1637–1646. [Google Scholar] [CrossRef]
- Dyer, W.J. Amines in Fish Muscle: I. Colorimetric determination of trimethylamine as the picrate salt. J. Fish. Res. Board Can. 1945, 6d, 351–358. [Google Scholar] [CrossRef]
- Qian, Y.-F.; Xie, J.; Yang, S.-P.; Wu, W.-H.; Xiong, Q.; Gao, Z.-L. In vivo study of spoilage bacteria on polyphenoloxidase activity and melanosis of modified atmosphere packaged Pacific white shrimp. Food Chem. 2014, 155, 126–131. [Google Scholar] [CrossRef]
- Gibson, A.M.; Bratchell, N.; Roberts, T.A. The effect of sodium chloride and temperature on the rate and extent of growth of Clostridium botulinum type A in pasteurized pork slurry. J. Appl. Bacteriol. 1987, 62, 479–490. [Google Scholar] [CrossRef]
- Li, D.; Zhang, J.; Song, S.; Feng, L.; Luo, Y. Influence of heat processing on the volatile organic compounds and microbial diversity of salted and vacuum-packaged silver carp (Hypophthalmichthys molitrix) fillets during storage. Food Microbiol. 2018, 72, 73–81. [Google Scholar] [CrossRef] [PubMed]
- Li, Y.; Jia, S.; Hong, H.; Zhang, L.; Zhuang, S.; Sun, X.; Liu, X.; Luo, Y. Assessment of bacterial contributions to the biochemical changes of chill-stored blunt snout bream (Megalobrama amblycephala) fillets: Protein degradation and volatile organic compounds accumulation. Food Microbiol. 2020, 91, 103495. [Google Scholar] [CrossRef]
- Sofra, C.; Tsironi, T.; Taoukis, P.S. Modeling the effect of pre-treatment with nisin enriched osmotic solution on the shelf life of chilled vacuum packed tuna. J. Food Eng. 2018, 216, 125–131. [Google Scholar] [CrossRef]
- Lyu, F.; Gao, F.; Ding, Y. Effects of gamma radiation combined with cinnamon oil on qualities of smoked salmon slices inoculated with Shewanella putrefaciens. Food Sci. Nutr. 2018, 6, 806–813. [Google Scholar] [CrossRef] [PubMed] [Green Version]
- Feng, X.; Ng, V.K.; Mikš-Krajnik, M.; Yang, H. Effects of fish gelatin and tea polyphenol coating on the spoilage and degradation of myofibril in fish fillet during cold storage. Food Bioprocess Technol. 2017, 10, 89–102. [Google Scholar] [CrossRef]
- Shen, S.; Jiang, Y.; Liu, X.; Luo, Y.; Gao, L. Quality assessment of rainbow trout (Oncorhynchus mykiss) fillets during super chilling and chilled storage. J. Food Sci. Technol. 2015, 52, 5204–5211. [Google Scholar] [CrossRef] [PubMed] [Green Version]
- Shi, C.; Yang, X.; Han, S.; Fan, B.; Zhao, Z.; Wu, X.; Qian, J. Nondestructive prediction of tilapia fillet freshness during storage at different temperatures by integrating an electronic nose and tongue with radial basis function neural networks. Food Bioprocess Technol. 2018, 11, 1840–1852. [Google Scholar] [CrossRef]
- Sun, J.; Wang, Q.J.; Huang, J.; Hou, Y.D.; Chen, Y.F.; Su, X.R. Influence of heating temperature on the development of volatile compounds in bigeye tuna meat (Thunnus obesus) as assessed by E-nose and SPME-GC/MS. Int. Food Res. J. 2013, 20, 3077–3083. [Google Scholar]
- Medveďová, A.; Šipošová, P.; Mančušková, T.; Valík, L. The effect of salt and temperature on the growth of fresco culture. Fermentation 2018, 5, 2. [Google Scholar] [CrossRef] [Green Version]
- Gu, X.; Feng, L.; Zhu, J.; Li, Y.; Tu, K.; Dong, Q.; Pan, L. Application of gas sensors for modelling the dynamic growth of Pseudomonas in pork stored at different temperatures. Meat Sci. 2021, 171, 108282. [Google Scholar] [CrossRef] [PubMed]
- Yang, Z.-Q.; Tao, X.-Y.; Zhang, H.; Rao, S.-Q.; Gao, L.; Pan, Z.-M.; Jiao, X.-A. Isolation and characterization of virulent phages infecting Shewanella baltica and Shewanella putrefaciens, and their application for biopreservation of chilled channel catfish (Ictalurus punctatus). Int. J. Food Microbiol. 2019, 292, 107–117. [Google Scholar] [CrossRef] [PubMed]
- Taoukis, P.S.; Koutsoumanis, K.; Nychas, G.J.E. Use of time-temperature integrators and predictive modelling for shelf life control of chilled fish under dynamic storage conditions. Int. J. Food Microbiol. 1999, 53, 21–31. [Google Scholar] [CrossRef] [Green Version]
- Tango, C.N.; Khan, I.; Park, Y.S.; Oh, D.H. Growth of Staphylococcus aureus in cooked ready-to-eat ground fish as affected by inoculum size and potassium sorbate as food preservative. LWT Food Sci. Technol. 2016, 71, 400–408. [Google Scholar] [CrossRef]
- Ding, T.; Liao, X.-Y.; Dong, Q.-L.; Xuan, X.-T.; Chen, S.-G.; Ye, X.-Q.; Liu, D.-H. Predictive modeling of microbial single cells: A review. Crit. Rev. Food Sci. Nutr. 2018, 58, 711–725. [Google Scholar] [CrossRef] [PubMed]
- Wang, H.; Hu, Z.; Long, F.; Guo, C.; Yuan, Y.; Yue, T. Early detection of Zygosaccharomyces rouxii—Spawned spoilage in apple juice by electronic nose combined with chemometrics. Int. J. Food Microbiol. 2016, 217, 68–78. [Google Scholar] [CrossRef] [PubMed]
- Feng, H.; Zhang, M.; Liu, P.; Liu, Y.; Zhang, X. Evaluation of IoT-enabled monitoring and electronic nose spoilage detection for salmon freshness during cold storage. Foods 2020, 9, 1579. [Google Scholar] [CrossRef] [PubMed]
- Zhu, S.; Luo, Y.; Hong, H.; Feng, L.; Shen, H. Correlation between electrical conductivity of the gutted fish body and the quality of bighead carp (Aristichthys nobilis) heads stored at 0 and 3 °C. Food Bioprocess Technol. 2013, 6, 3068–3075. [Google Scholar] [CrossRef]
- Shi, C.; Cui, J.; Luo, Y.; Zhu, S.; Zhou, Z. Post-mortem changes of silver carp (Hypophthalmichthys Molitrix) stored at 0 °C assessed by electrical conductivity. Int. J. Food Prop. 2015, 18, 415–425. [Google Scholar] [CrossRef] [Green Version]
- Huang, X.-C.; Yuan, Y.-H.; Wang, X.-Y.; Jiang, F.-H.; Yue, T.-L. Application of electronic nose in tandem with chemometric analysis for detection of Alicyclobacillus acidoterrestris-spawned spoilage in apple juice beverage. Food Bioprocess Technol. 2015, 8, 1295–1304. [Google Scholar] [CrossRef]
- Prabhakar, P.K.; Vatsa, S.; Srivastav, P.P.; Pathak, S.S. A comprehensive review on freshness of fish and assessment: Analytical methods and recent innovations. Food Res. Int. 2020, 133, 109157. [Google Scholar] [CrossRef] [PubMed]
- Edirisinghe, R.K.; Graffham, A.J.; Taylor, S.J. Characterisation of the volatiles of yellowfin tuna (Thunnus albacares) during storage by solid phase microextraction and GC–MS and their relationship to fish quality parameters. Int. J. Food Sci. Technol. 2007, 42, 1139–1147. [Google Scholar] [CrossRef]
- Zhang, Q.; Ding, Y.; Gu, S.; Zhu, S.; Zhou, X.; Ding, Y. Identification of changes in volatile compounds in dry-cured fish during storage using HS-GC-IMS. Food Res. Int. 2020, 137, 109339. [Google Scholar] [CrossRef] [PubMed]
- Ercolini, D.; Russo, F.; Nasi, A.; Ferranti, P.; Villani, F. Mesophilic and psychrotrophic bacteria from meat and their spoilage potential in vitro and in beef. Appl. Environ. Microbiol. 2009, 75, 1990–2001. [Google Scholar] [CrossRef] [Green Version]
- Zhang, Y.; Ma, X.; Dai, Z. Comparison of nonvolatile and volatile compounds in raw, cooked, and canned yellowfin tuna (Thunnus albacores). J. Food Process. Preserv. 2019, 43, e14111. [Google Scholar] [CrossRef]
- Wang, H.; Liu, X.; Zhang, Y.; Lu, H.; Xu, Q.; Shi, C.; Luo, Y. Spoilage potential of three different bacteria isolated from spoiled grass carp (Ctenopharyngodon idellus) fillets during storage at 4 °C. LWT Food Sci. Technol. 2017, 81, 10–17. [Google Scholar] [CrossRef]


| Fitted Models | T/°C | Equations | λe (h) | μmaxe (h−1) | No | Nmax | R2 | RMSE |
|---|---|---|---|---|---|---|---|---|
| Gompertz | 4 | f(x) = 2.276 + 6.222 × exp(−exp(0.07551/6.222 × (68.8 − x) + 1)) | 68.8 | 0.02778 | 2.276 | 8.498 | 0.997 | 0.101 |
| 7 | f(x) = 3.292 + 7.149 × exp(−exp(0.1375/7.149 × (42.67 − x) + 1)) | 42.67 | 0.05059 | 3.292 | 10.441 | 0.994 | 0.1387 | |
| 10 | f(x) = 3.252 + 6.331 × exp(−exp(0.2/6.331 × (24.36 − x) + 1)) | 24.36 | 0.07358 | 3.252 | 9.583 | 0.986 | 0.283 | |
| Logistic | 4 | f(x) = 3.053+5.783/(1 + exp(0.02028 × (166.6 − x))) | 166.6 | 0.02028 | 3.053 | 8.836 | 0.998 | 0.0763 |
| 7 | f(x) = 3.092 + 6.657/(1 + exp(0.03285 × (105.9 − x))) | 105.9 | 0.03285 | 3.092 | 9.749 | 0.999 | 0.0654 | |
| 10 | f(x) = 2.83 + 6.48/(1 + exp(0.04478 × (63.6 − x))) | 63.6 | 0.04478 | 2.83 | 9.31 | 0.985 | 0.167 |
| Model | T/°C | Equations | Training Set | Testing Set | Sensor | CFU | r | ||||
|---|---|---|---|---|---|---|---|---|---|---|---|
| Rc2 | RMSEc | Rp2 | RMSEpc | λs (h) | μmaxs (h−1) | λe (h) | μmaxe (h−1) | ||||
| Gompertz | 4 | f(x) = 0.280 + 0.401 × exp(−exp(0.0102/0.4023 × (90.05 − x) + 1)) | 0.978 | 0.0261 | 0.968 | 0.0307 | 90.05 | 0.003753 | 68.8 | 0.02778 | 0.986 |
| 7 | f(x) = 0.282 + 0.6125 × exp(−exp(0.0229/0.6125 × (52.27 − x) + 1)) | 0.994 | 0.0208 | 0.985 | 0.0334 | 52.27 | 0.008425 | 42.67 | 0.05059 | 0.976 | |
| 10 | f(x) = 0.2872 + 0.509 × exp(−exp(0.03126/0.509 × (40.51 − x) + 1)) | 0.983 | 0.0341 | 0.987 | 0.0324 | 40.51 | 0.01150 | 24.36 | 0.07358 | 0.986 | |
| Logistic | 4 | f(x) = 0.2598 + 0.4307/(1 + exp(0.03033 × (156.50 − x))) | 0.971 | 0.0315 | 0.965 | 0.0329 | 156.50 | 0.03033 | 166.6 | 0.02028 | 0.996 |
| 7 | f(x) = 0.2352 + 0.658/(1 + exp(0.03812 × (95.24 − x))) | 0.977 | 0.0472 | 0.963 | 0.0613 | 95.24 | 0.03812 | 105.9 | 0.03285 | 0.995 | |
| 10 | f(x) = 0.2629 + 0.5553/(1 + exp(0.04864 × (60.36 − x))) | 0.978 | 0.0391 | 0.987 | 0.0301 | 60.36 | 0.04864 | 63.6 | 0.04478 | 0.999 | |
| Indicators | Temperatures (°C) | PLS without EC Values | PLS with EC Values | ||||||
|---|---|---|---|---|---|---|---|---|---|
| Calibration Set | Validation Set | Calibration Set | Validation Set | ||||||
| Rc2 | RMSEc | Rv2 | RMSEv | Rc2 | RMSEc | Rv2 | RMSEv | ||
| TVB-N (mg/100 g) | 4 | 0.9713 | 0.9327 | 0.9775 | 0.8673 | 0.9812 | 0.7519 | 0.9902 | 0.6448 |
| TMA (mg/100 g) | 0.99 | 0.1932 | 0.9862 | 0.2425 | 0.9905 | 0.189 | 0.988 | 0.2237 | |
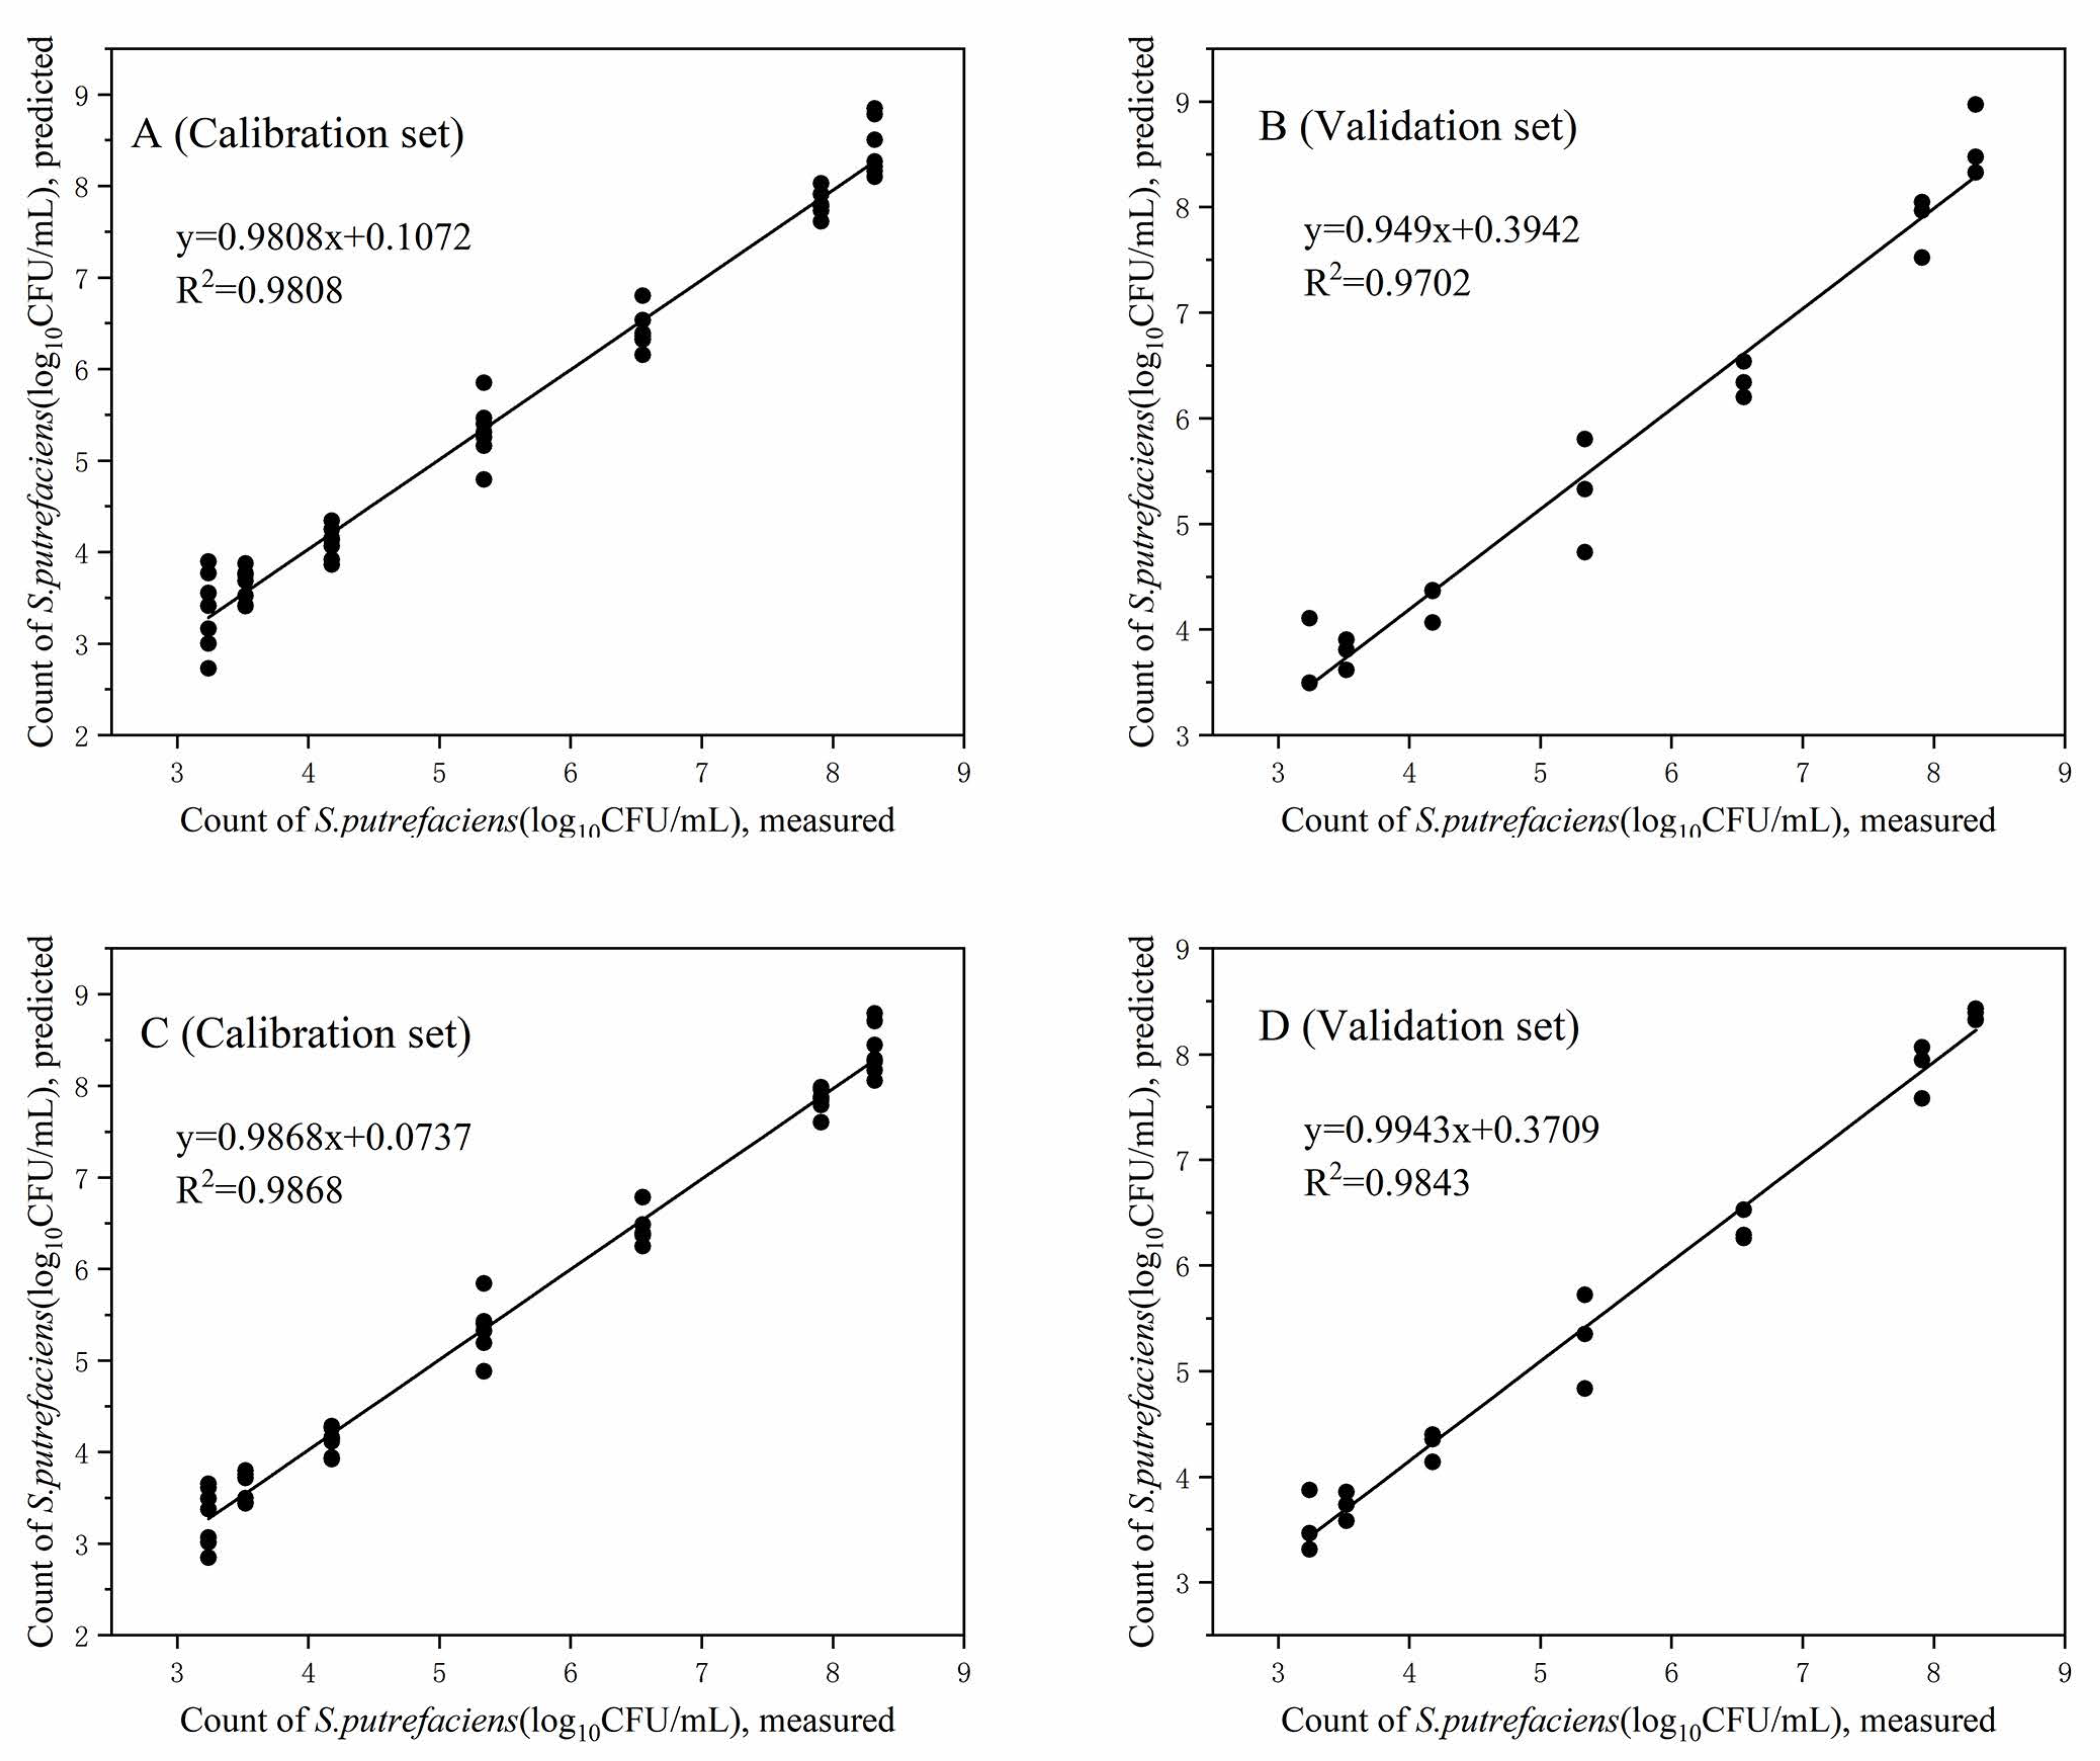
| TNS (log10 CFU/mL) | 0.9808 | 0.2679 | 0.9702 | 0.3589 | 0.9868 | 0.222 | 0.9843 | 0.2653 | |
| TVB-N (mg/100 g) | 7 | 0.9874 | 0.6461 | 0.9863 | 0.6981 | 0.9925 | 0.4966 | 0.9919 | 0.5053 |
| TMA (mg/100 g) | 0.9956 | 0.1418 | 0.9851 | 0.322 | 0.9962 | 0.1326 | 0.9966 | 0.1292 | |
| TNS (log10 CFU/mL) | 0.9956 | 0.1594 | 0.9923 | 0.225 | 0.9957 | 0.1565 | 0.995 | 0.1742 | |
| TVB-N (mg/100 g) | 10 | 0.9932 | 0.5411 | 0.9896 | 0.6755 | 0.9958 | 0.4485 | 0.9963 | 0.4214 |
| TMA (mg/100 g) | 0.9897 | 0.276 | 0.9871 | 0.3478 | 0.9876 | 0.3020 | 0.9826 | 0.3837 | |
| TNS (log10 CFU/mL) | 0.9857 | 0.2735 | 0.969 | 0.4185 | 0.9963 | 0.1396 | 0.9864 | 0.2705 | |
| VOCs | Relative Concentration (Area 10−6) | ||||||||
|---|---|---|---|---|---|---|---|---|---|
| Day 0 | Day 4–4 | Day 8–4 | Day 12–4 | CK 12–4 | Day 2–10 | Day 4–10 | Day 6–10 | CK 6–10 | |
| Alcohols | |||||||||
| 1-Penten-3-ol | 3.01 ± 1.13 | 3.56 ± 0.56 | 3.89 ± 1.36 | 4.65 ± 1.98 | 4.54 ± 0.64 | 6.89 ± 0.98 | 8.99 ± 2.36 | 9.29 ± 1.99 | 7.98 ± 2.36 |
| 1-Octen-3-ol | 7.28 ± 1.86 | 21.69 ± 0.98 | 20.79 ± 3.25 | 46.13 ± 6.56 | 20.36 ± 2.56 | 18.61 ± 0.56 | 35.79 ± 2.11 | 66.98 ± 5.24 | 35.98 ± 4.65 |
| Ethanol | 9.65 ± 1.23 | 1.23 ± 0.21 | ND | ND | ND | 2.23 ± 0.56 | ND | ND | ND |
| 1-Hexanol | 12.56 ± 0.33 | 6.22 ± 0.65 | 2.12 ± 0.32 | ND | 1.36 ± 0.05 | 3.56 ± 0.65 | ND | ND | 2.98 ± 0.06 |
| (3-Methyl-oxiran-2-yl)-methanol | ND | 0.66 ± 0.23 | 0.68 ± 0.24 | 1.65 ± 0.66 | 0.12 ± 0.04 | ND | 2.38 ± 0.56 | 3.01 ± 0.21 | 0.22 ± 0.08 |
| 2-Hexen-1-ol, (Z)- | ND | 0.54 ± 0.04 | 1.89 ± 0.03 | 5.65 ± 0.69 | ND | ND | 2.32 ± 0.05 | 9.28 ± 0.32 | ND |
| 2-Nonen-1-ol | 0.4 ± 0.02 | 1.25 ± 0.11 | 0.65 ± 0.01 | 0.33 ± 0.02 | 0.43 ± 0.03 | 0.54 ± 0.06 | 1.56 ± 0.02 | 0.51 ± 0.03 | 0.36 ± 0.02 |
| Aldehydes | |||||||||
| Hexanal | 7.86 ± 0.65 | 19.23 ± 1.89 | 33.21 ± 3.12 | 64.93 ± 5.36 | 13.54 ± 2.36 | 22.52 ± 1.35 | 35.26 ± 3.22 | 71.26 ± 5.62 | 21.22 ± 2.56 |
| Heptanal | 4.22 ± 0.12 | 4.12 ± 0.63 | 9.52 ± 1.32 | 5.24 ± 0.97 | 3.22 ± 0.86 | 8.79 ± 1.22 | 1.23 ± 0.06 | 3.54 ± 0.07 | 1.98 ± 0.21 |
| Nonanal | 2.21 ± 0.08 | 2.28 ± 0.21 | 4.60 ± 0.11 | 8.21 ± 0.99 | 3.21 ± 0.07 | 18.47 ± 2.36 | 12.11 ± 2.65 | 15.89 ± 3.06 | 11.21 ± 2.10 |
| Propanal | 2.35 ± 0.09 | 5.61 ± 0.46 | 7.22 ± 1.23 | 6.11 ± 0.12 | 2.12 ± 0.33 | 5.31 ± 0.22 | 4.33 ± 1.11 | 6.85 ± 0.64 | 5.11 ± 0.21 |
| 2-Decenal, (E) | ND | 3.12 ± 0.18 | 2.47 ± 0.21 | 1.56 ± 0.06 | ND | ND | 0.43 ± 0.05 | 2.55 ± 0.65 | 0.35 ± 0.05 |
| 2-Nonanal, (E)- | ND | 0.22 ± 0.03 | 3.56 ± 0.24 | 4.54 ± 0.68 | 3.72 ± 0.21 | 0.31 ± 0.05 | 5.33 ± 0.98 | 5.99 ± 1.33 | 3.56 ± 0.09 |
| 2-Dodecanal, (E)- | ND | ND | 1.263 ± 0.05 | 2.112 ± 0.32 | 4.6 ± 0.23 | 5.68 ± 1.22 | 4.22 ± 0.09 | 3.68 ± 1.21 | 2.23 ± 0.21 |
| Decanal | 0.65 ± 0.02 | 1.36 ± 0.05 | ND | ND | 2.55 ± 0.65 | 1.55 ± 0.96 | 2.36 ± 0.12 | 1.32 ± 0.08 | 1.86 ± 0.09 |
| Octanal | 3.86 ± 0.33 | 1.69 ± 0.35 | 0.98 ± 0.04 | 9.98 ± 2.65 | 2.65 ± 0.22 | 1.98 ± 0.21 | 5.65 ± 0.69 | 3.23 ± 0.93 | 5.36 ± 0.97 |
| 4-Heptanal, (Z)- | ND | 0.09 ± 0.01 | 0.98 ± 0.09 | 6.22 ± 1.23 | 0.28 ± 0.02 | 0.18 ± 0.04 | 2.32 ± 0.26 | 1.69 ± 0.66 | 0.56 ± 0.08 |
| Ketones | |||||||||
| 2,3-Octanedione | ND | ND | 0.85 ± 0.15 | 1.7 ± 0.56 | ND | 0.08 ± 0.01 | 1.23 ± 1.23 | 2.56 ± 1.56 | ND |
| 2,3-Pentanedione | 0.04 ± 0.01 | 0.06 ± 0.02 | 0.03 ± 0.01 | 1.56 ± 0.05 | 1.78 ± 0.58 | 2.53 ± 0.04 | 1.03 ± 0.05 | 4.22 ± 1.86 | 3.29 ± 0.12 |
| 2-Nonanone | ND | ND | 0.06 ± 0.02 | 0.12 ± 0.04 | ND | ND | 0.08 ± 0.05 | 0.25 ± 0.08 | ND |
| 2-Undecanone | ND | ND | 0.75 ± 0.02 | 2.67 ± 0.66 | 0.96 ± 0.06 | ND | 1.19 ± 0.28 | 4.55 ± 1.32 | 1.89 ± 0.64 |
| 2-Heptanone | ND | ND | 0.12 ± 0.02 | 0.89 ± 0.13 | 0.06 ± 0.01 | ND | 1.35 ± 0.61 | 2.46 ± 0.05 | 0.09 ± 0.01 |
| Hydrocarbons | |||||||||
| Heptacosane | ND | ND | 1.23 ± 0.13 | 0.85 ± 0.04 | 2.35 ± 0.12 | 2.79 ± 0.13 | 0.46 ± 0.02 | 0.77 ± 0.07 | 1.23 ± 0.21 |
| Pentadecane | 2.23 ± 0.14 | 8.63 ± 1.36 | 4.62 ± 0.88 | 3.33 ± 0.21 | 3.26 ± 1.02 | 9.59 ± 1.33 | 4.35 ± 0.98 | 2.23 ± 0.29 | 1.9 ± 0.06 |
| Tetradecane | 4.23 ± 0.32 | 2.51 ± 0.11 | 0.56 ± 0.02 | ND | 1.03 ± 0.05 | 1.54 ± 0.21 | ND | ND | 0.81 ± 0.06 |
| Others | |||||||||
| Ethyl acetate | 5.03 ± 0.09 | 7.54 ± 1.32 | 3.21 ± 0.35 | 1.22 ± 0.35 | 2.13 ± 0.86 | 3.23 ± 0.78 | 0.77 ± 0.12 | 2.27 ± 0.65 | 1.22 ± 0.05 |
| Methylamine, N, N-dimethyl- | ND | ND | 3.31 ± 0.09 | 8.02 ± 1.04 | ND | 3.28 ± 0.39 | 10.65 ± 2.65 | 21.23 ± 4.65 | ND |
| Methoxy-phenyl-oxime | ND | ND | 0.64 ± 0.06 | 0.46 ± 0.03 | 0.11 ± 0.02 | ND | 0.83 ± 0.04 | 2.22 ± 0.25 | 0.23 ± 0.03 |
| Naphthalene | 0.07 ± 0.01 | 0.14 ± 0.02 | 0.08 ± 0.01 | 0.07 ± 0.02 | 0.12 ± 0.03 | 0.09 ± 0.01 | 0.16 ± 0.04 | 0.06 ± 0.01 | 0.16 ± 0.04 |
| Dimethyl disulfide | ND | ND | ND | 0.85 ± 0.06 | ND | ND | ND | 1.32 ± 0.31 | ND |
Publisher’s Note: MDPI stays neutral with regard to jurisdictional claims in published maps and institutional affiliations. |
© 2021 by the authors. Licensee MDPI, Basel, Switzerland. This article is an open access article distributed under the terms and conditions of the Creative Commons Attribution (CC BY) license (https://creativecommons.org/licenses/by/4.0/).
Share and Cite
Yi, Z.; Xie, J. Prediction in the Dynamics and Spoilage of Shewanella putrefaciens in Bigeye Tuna (Thunnus obesus) by Gas Sensors Stored at Different Refrigeration Temperatures. Foods 2021, 10, 2132. https://0-doi-org.brum.beds.ac.uk/10.3390/foods10092132
Yi Z, Xie J. Prediction in the Dynamics and Spoilage of Shewanella putrefaciens in Bigeye Tuna (Thunnus obesus) by Gas Sensors Stored at Different Refrigeration Temperatures. Foods. 2021; 10(9):2132. https://0-doi-org.brum.beds.ac.uk/10.3390/foods10092132
Chicago/Turabian StyleYi, Zhengkai, and Jing Xie. 2021. "Prediction in the Dynamics and Spoilage of Shewanella putrefaciens in Bigeye Tuna (Thunnus obesus) by Gas Sensors Stored at Different Refrigeration Temperatures" Foods 10, no. 9: 2132. https://0-doi-org.brum.beds.ac.uk/10.3390/foods10092132