
The Effect of Ferulic Acid-Grafted Chitosan (FA-g-CS) on the Transmembrane Transport of Anthocyanins by sGLT1 and GLUT2
Abstract
:1. Introduction
2. Materials and Methods
2.1. Materials and Reagents
2.2. Transmembrane Transport Studies of ANC
2.3. Cell Culture and Viability Assays
2.4. Cell Cytotoxicity Assay
2.5. RNA Interference
2.6. RNA Extraction and RT-PCR
2.7. Western Blot Assay
2.8. Immunofluorescence Staining
2.9. Molecular Docking
2.10. Statistical Analysis
3. Results
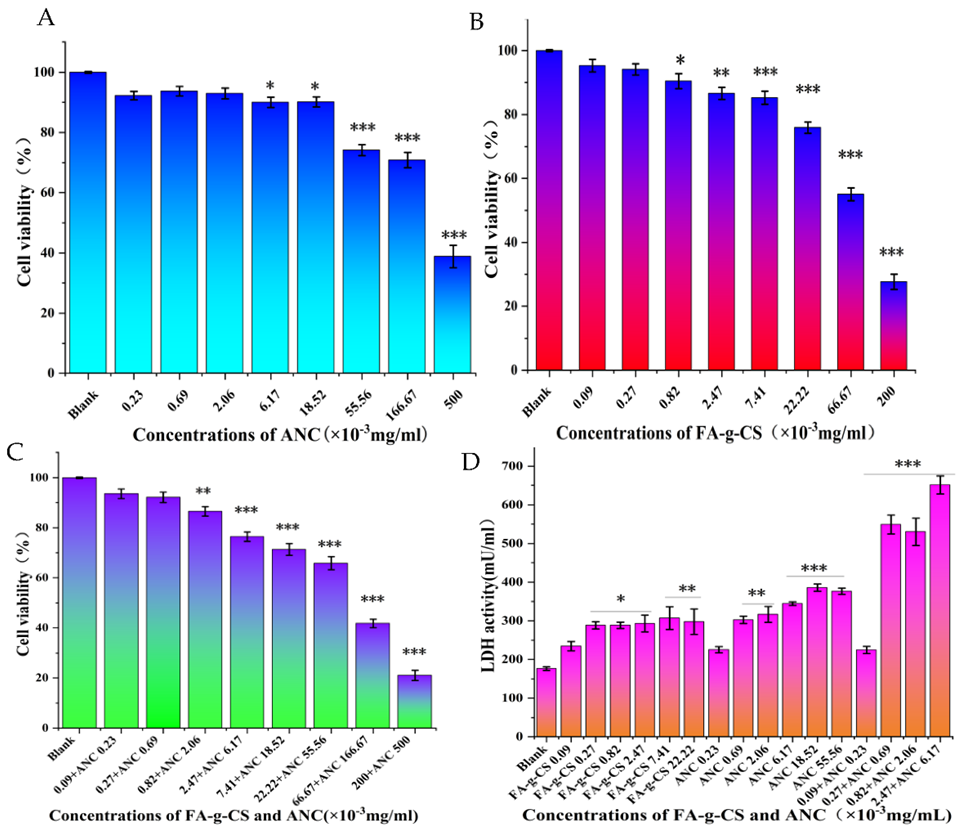
3.1. Cell Viability
3.2. Cell Cytotoxicity Assay
3.3. Transport of ANC across Caco-2 Cell Monoplayers
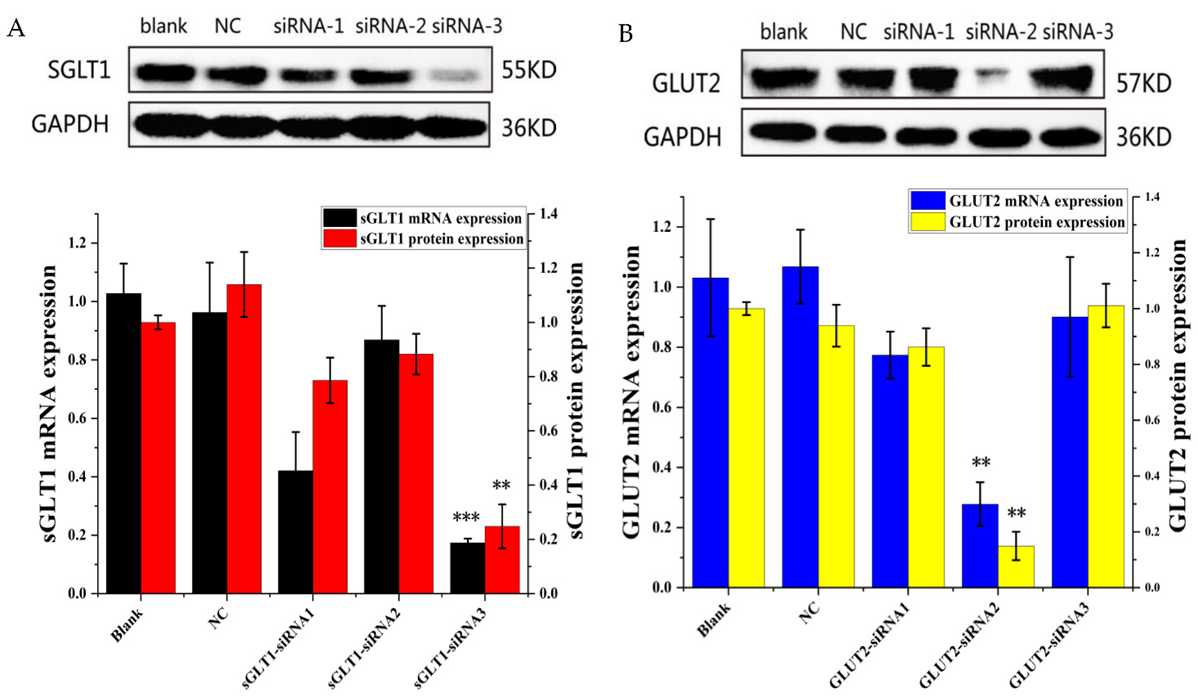
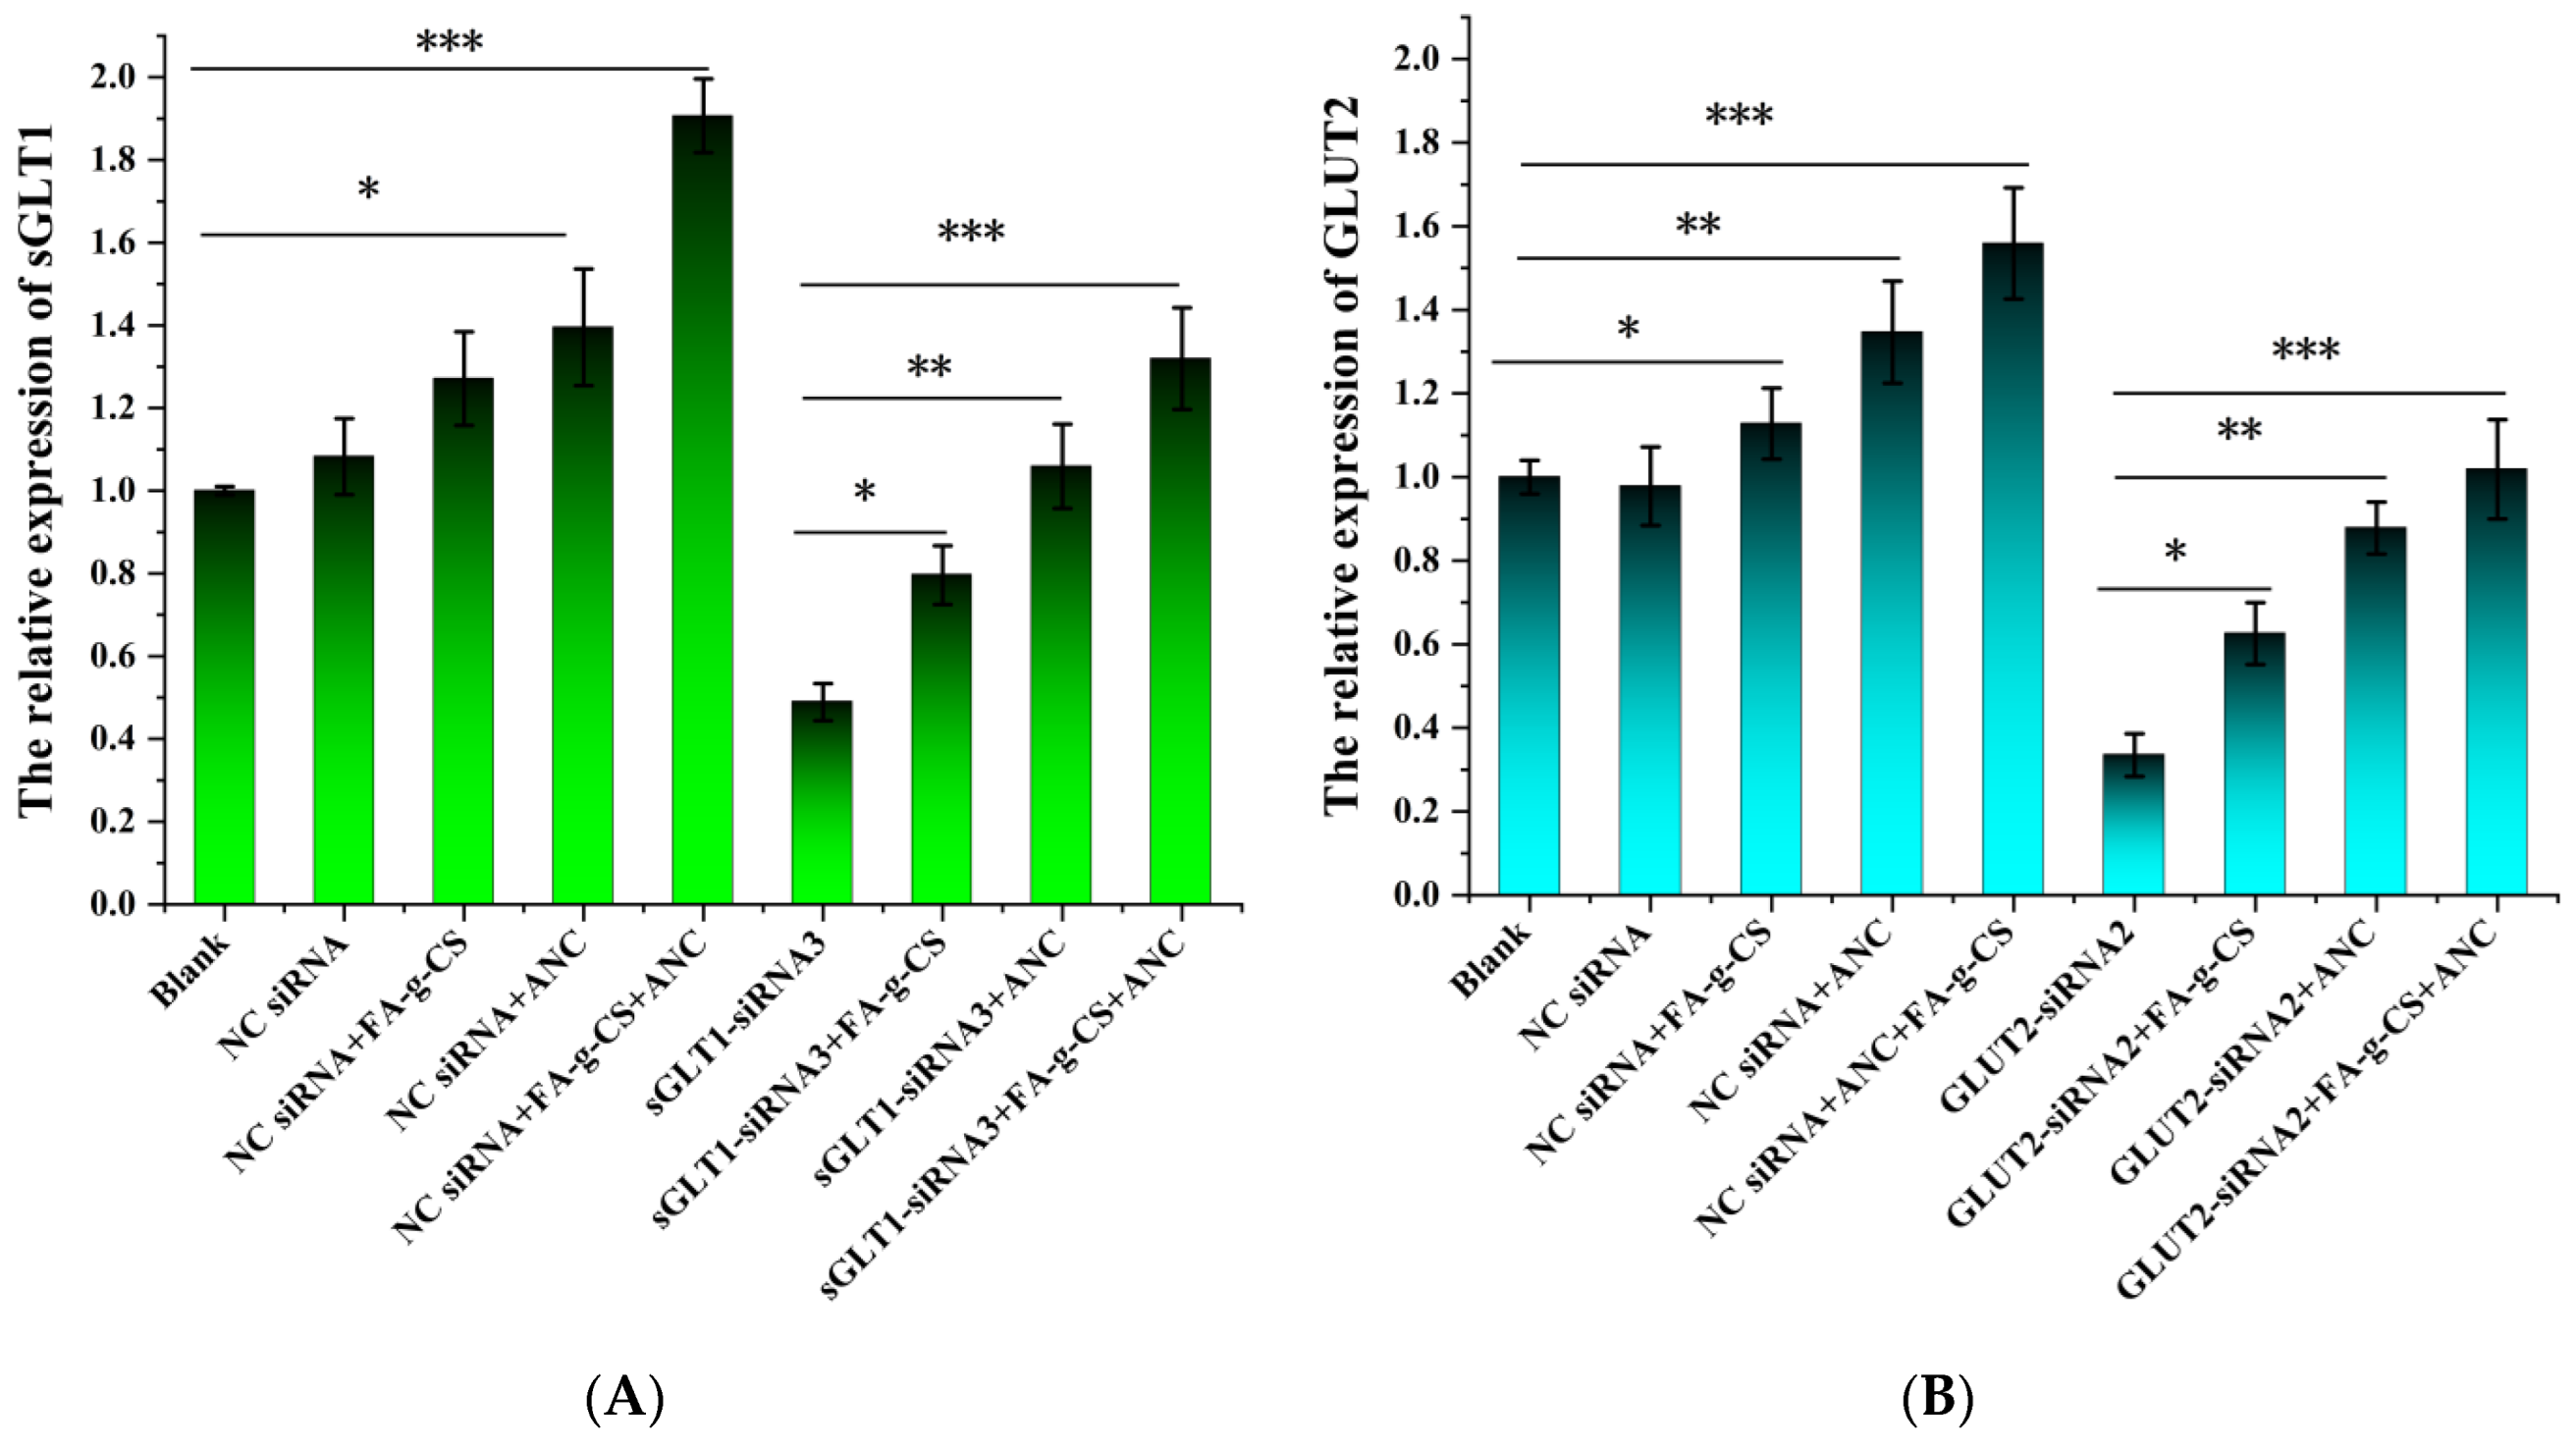
3.4. Effect of siRNA-Mediated Knockdown of sGLT1 and GLUT2 in Caco-2 Cells
3.5. Western Blot Analysis
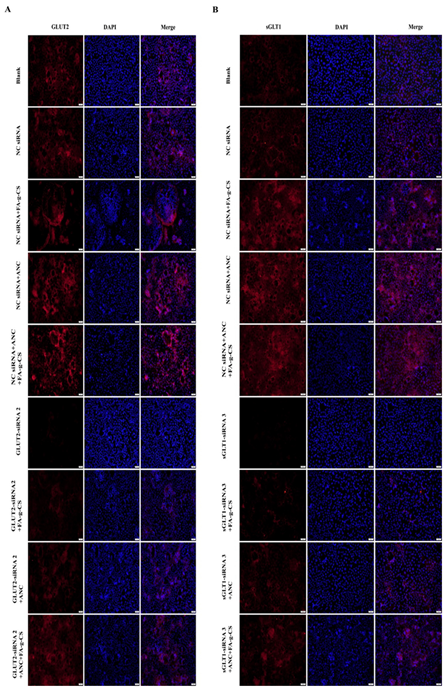
3.6. Immunofluorescence Staining
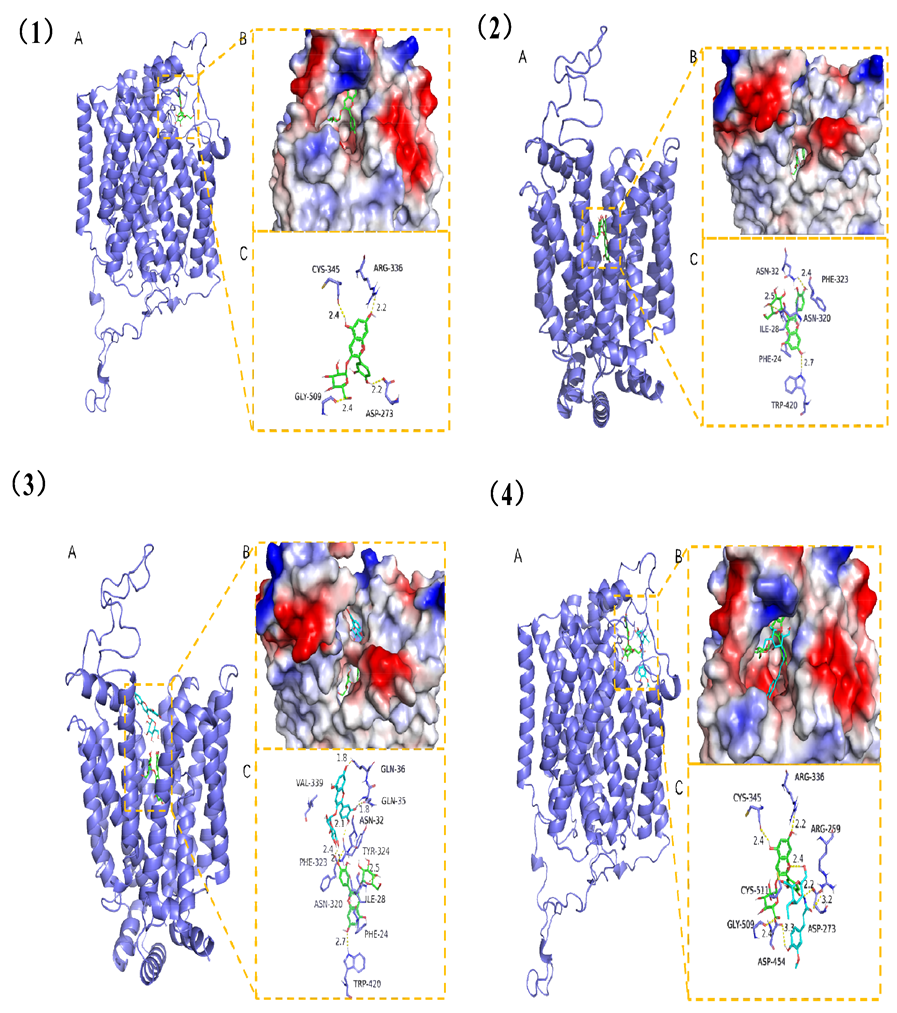
3.7. Molecular Docking of Chitosan and ANC on sGLT1 and GLUT2
4. Discussion
Author Contributions
Funding
Data Availability Statement
Conflicts of Interest
References
- Yang, M.; Koo, S.I.; Song, W.O.; Chun, O.K. Food matrix affecting anthocyanin bioavailability. Curr. Med. Chem. 2011, 18, 291–300. [Google Scholar] [CrossRef] [PubMed]
- Pojer, E.; Mattivi, F.; Johnson, D.; Stockley, C. The case for anthocyanin consumption to promote human health: A review. Compr. Rev. Food Sci. Food Saf. 2013, 12, 483–508. [Google Scholar] [CrossRef] [PubMed]
- Liu, J.; Zhou, H.; Song, L.; Yang, Z.; Qiu, M.; Wang, J.; Shi, S. Anthocyanins: Promising natural products with diverse pharmacological activities. Molecules 2021, 26, 3807. [Google Scholar] [CrossRef] [PubMed]
- Felgines, C.; Texier, O.; Besson, C.; Fraisse, D.; Lamaison, J.-L.; Rémésy, C. Blackberry anthocyanins are slightly bioavailable in rats. J. Nutr. 2002, 132, 1249–1253. [Google Scholar] [CrossRef] [Green Version]
- Castro-Acosta, M.L.; Lenihan-Geels, G.N.; Corpe, C.P.; Hall, W.L. Berries and anthocyanins: Promising functional food ingredients with postprandial glycaemia-lowering effects. Proc. Nutr. Soc. 2016, 75, 342–355. [Google Scholar] [CrossRef] [PubMed]
- Shi, M.; Bai, J.; Zhao, L.; Yu, X.; Liang, J.; Liu, Y.; Nord, W.; Li, Y. Co-loading and intestine-specific delivery of multiple antioxidants in pH-responsive microspheres based on TEMPO-oxidized polysaccharides. Carbohydr. Polym. 2017, 157, 858–865. [Google Scholar] [CrossRef]
- Tan, L.H.; Chan, L.W.; Heng, P.W. Alginate/starch composites as wall material to achieve microencapsulation with high oil loading. J. Microencapsul. 2009, 26, 263–271. [Google Scholar] [CrossRef] [PubMed]
- Amin, F.U.; Shah, S.A.; Badshah, H.; Khan, M.; Kim, M.O. Anthocyanins encapsulated by PLGA@PEG nanoparticles potentially improved its free radical scavenging capabilities via p38/JNK pathway against Abeta1-42-induced oxidative stress. J. Nanobiotechnol. 2017, 15, 12. [Google Scholar] [CrossRef] [PubMed] [Green Version]
- Gultekin-Ozguven, M.; Karadag, A.; Duman, S.; Ozkal, B.; Ozcelik, B. Fortification of dark chocolate with spray dried black mulberry (Morus nigra) waste extract encapsulated in chitosan-coated liposomes and bioaccessability studies. Food Chem. 2016, 201, 205–212. [Google Scholar] [CrossRef] [PubMed]
- McClements, D.J.; Xiao, H.; Demokritou, P. Physicochemical and colloidal aspects of food matrix effects on gastrointestinal fate of ingested inorganic nanoparticles. Adv. Colloid Interface Sci. 2017, 246, 165–180. [Google Scholar] [CrossRef]
- Zou, T.B.; Feng, D.; Song, G.; Li, H.W.; Tang, H.W.; Ling, W.H. The role of sodium-dependent glucose transporter 1 and glucose transporter 2 in the absorption of cyanidin-3-o-beta-glucoside in Caco-2 cells. Nutrients 2014, 6, 4165–4177. [Google Scholar] [CrossRef] [PubMed]
- Manzano, S.; Williamson, G. Polyphenols and phenolic acids from strawberry and apple decrease glucose uptake and transport by human intestinal Caco-2 cells. Mol. Nutr. Food Res. 2010, 54, 1773–1780. [Google Scholar] [CrossRef]
- Alzaid, F.; Cheung, H.M.; Preedy, V.R.; Sharp, P.A. Regulation of glucose transporter expression in human intestinal Caco-2 cells following exposure to an anthocyanin-rich berry extract. PLoS ONE 2013, 8, e78932. [Google Scholar] [CrossRef] [PubMed] [Green Version]
- Baron, G.; Altomare, A.; Regazzoni, L.; Redaelli, V.; Grandi, S.; Riva, A.; Morazzoni, P.; Mazzolari, A.; Carini, M.; Vistoli, G.; et al. Pharmacokinetic profile of bilberry anthocyanins in rats and the role of glucose transporters: LC-MS/MS and computational studies. J. Pharm. Biomed. Anal. 2017, 144, 112–121. [Google Scholar] [CrossRef] [PubMed]
- Walton, M.C.; McGhie, T.K.; Reynolds, G.W.; Hendriks, W.H. The flavonol quercetin-3-glucoside inhibits cyanidin-3-glucoside absorption in vitro. J. Agric. Food Chem. 2006, 54, 4913–4920. [Google Scholar] [CrossRef]
- Narasimhan, A.; Chinnaiyan, M.; Karundevi, B. Ferulic acid regulates hepatic GLUT2 gene expression in high fat and fructose-induced type-2 diabetic adult male rat. Eur. J. Pharmacol. 2015, 761, 391–397. [Google Scholar] [CrossRef] [PubMed]
- Malunga, L.N.; Eck, P.; Beta, T. Inhibition of Intestinal alpha-Glucosidase and Glucose Absorption by Feruloylated Arabinoxylan Mono- and Oligosaccharides from Corn Bran and Wheat Aleurone. J. Pharm. Biomed. Anal. 2016, 2016, 1932532. [Google Scholar] [CrossRef] [Green Version]
- Ma, Y.; Hou, C.-J.; Fa, H.-B.; Huo, D.-Q.; Yang, M. Synthesis and antioxidant property of hydroxycinnamoyl maltodextrin derivatives. Int. J. Food Sci. Technol. 2016, 51, 2450–2459. [Google Scholar] [CrossRef]
- Ma, Y.; Hou, C.J.; Wu, H.X.; Fa, H.B.; Li, J.J.; Shen, C.H.; Li, D.; Huo, D.Q. Synthesis of maltodextrin-grafted-cinnamic acid and evaluation on its ability to stabilize anthocyanins via microencapsulation. J. Microencapsul. 2016, 33, 554–562. [Google Scholar] [CrossRef] [PubMed]
- Hu, B.; Ma, F.; Yang, Y.; Xie, M.; Zhang, C.; Xu, Y.; Zeng, X. Antioxidant Nanocomplexes for Delivery of Epigallocatechin-3-gallate. J. Agric. Food Chem. 2016, 64, 3422–3429. [Google Scholar] [CrossRef] [PubMed]
- Kazachenko, A.S.; Akman, F.; Malyar, Y.N.; Issaoui, N.; Vasilieva, N.Y.; Karacharov, A.A. Synthesis optimization, DFT and physicochemical study of chitosan sulfates. JMoSt 2021, 1245, 131083. [Google Scholar] [CrossRef]
- Sousa, A.; Araujo, P.; Cruz, L.; Bras, N.F.; Mateus, N.; De Freitas, V. Evidence for copigmentation interactions between deoxyanthocyanidin derivatives (oaklins) and common copigments in wine model solutions. J. Agric. Food Chem. 2014, 62, 6995–7001. [Google Scholar] [CrossRef] [PubMed]
- Soodvilai, S.; Soodvilai, S.; Chatsudthipong, V.; Ngawhirunpat, T.; Rojanarata, T.; Opanasopit, P. Interaction of pharmaceutical excipients with organic cation transporters. Int. J. Pharm. 2017, 520, 14–20. [Google Scholar] [CrossRef] [PubMed]
- Li, C.; Fang, K.; He, W.; Li, K.; Jiang, Y.; Li, J. Evaluation of chitosan-ferulic acid microcapsules for sustained drug delivery: Synthesis, characterizations, and release kinetics in vitro. JMoSt 2021, 1227, 129353. [Google Scholar] [CrossRef]
- Soenen, S.J.; Himmelreich, U.; Nuytten, N.; De Cuyper, M. Cytotoxic effects of iron oxide nanoparticles and implications for safety in cell labelling. Biomaterials 2011, 32, 195–205. [Google Scholar] [CrossRef]
- Fotakis, G.; Timbrell, J.A. In vitro cytotoxicity assays: Comparison of LDH, neutral red, MTT and protein assay in hepatoma cell lines following exposure to cadmium chloride. Toxicol. Lett. 2006, 160, 171–177. [Google Scholar] [CrossRef]
- Redan, B.W.; Albaugh, G.P.; Charron, C.S.; Novotny, J.A.; Ferruzzi, M.G. Adaptation in Caco-2 Human Intestinal Cell Differentiation and Phenolic Transport with Chronic Exposure to Blackberry (Rubus sp.) Extract. J. Agric. Food Chem. 2017, 65, 2694–2701. [Google Scholar] [CrossRef]
- Livak, K.J.; Schmittgen, T.D. Analysis of relative gene expression data using real-time quantitative PCR and the 2(-Delta Delta C(T)) Method. Methods 2001, 25, 402–408. [Google Scholar] [CrossRef]
- Zhang, H.; Hassan, Y.I.; Renaud, J.; Liu, R.; Yang, C.; Sun, Y.; Tsao, R. Bioaccessibility, bioavailability, and anti-inflammatory effects of anthocyanins from purple root vegetables using mono- and co-culture cell models. Mol. Nutr. Food Res. 2017, 61, 1600928. [Google Scholar] [CrossRef]
- Zhang, H.; Kovacs-Nolan, J.; Kodera, T.; Eto, Y.; Mine, Y. γ-Glutamyl cysteine and γ-glutamyl valine inhibit TNF-α signaling in intestinal epithelial cells and reduce inflammation in a mouse model of colitis via allosteric activation of the calcium-sensing receptor. Biochim. Biophys. Acta Mol. Basis Dis. 2015, 1852, 792–804. [Google Scholar] [CrossRef]
- Nanashima, N.; Horie, K.; Maeda, H.; Tomisawa, T.; Kitajima, M.; Nakamura, T. Blackcurrant Anthocyanins Increase the Levels of Collagen, Elastin, and Hyaluronic Acid in Human Skin Fibroblasts and Ovariectomized Rats. Nutrients 2018, 10, 495. [Google Scholar] [CrossRef] [PubMed] [Green Version]
- Lv, Y.; Liang, Q.; Li, Y.; Liu, X.; Zhang, D.; Li, X. Study of the binding mechanism between hydroxytyrosol and bovine serum albumin using multispectral and molecular docking. Food Hydrocoll. 2022, 122, 107072. [Google Scholar] [CrossRef]
- Friesner, R.A.; Banks, J.L.; Murphy, R.B.; Halgren, T.A.; Klicic, J.J.; Mainz, D.T.; Repasky, M.P.; Knoll, E.H.; Shelley, M.; Perry, J.K.; et al. Glide: A new approach for rapid, accurate docking and scoring. 1. Method and assessment of docking accuracy. J. Med. Chem. 2004, 47, 1739–1749. [Google Scholar] [CrossRef] [PubMed]
- Li, D.; Wang, P.; Luo, Y.; Zhao, M.; Chen, F. Health benefits of anthocyanins and molecular mechanisms: Update from recent decade. Crit. Rev. Food Sci. Nutr. 2017, 57, 1729–1741. [Google Scholar] [CrossRef]
- Denaro, M.; Smeriglio, A.; De Francesco, C.; Xiao, J.; Cornara, L.; Trombetta, D. In vitro intestinal transport and anti-inflammatory properties of ideain across Caco-2 transwell model. Fitoterapia 2020, 146, 104723. [Google Scholar] [CrossRef]
- Felgines, C.; Talavéra, S.; Texier, O.; Besson, C.; Fogliano, V.; Lamaison, J.-L.; Fauci, L.L.; Galvano, G.; Rémésy, C.; Galvano, F. Absorption and metabolism of red orange juice anthocyanins in rats. Br. J. Nutr. 2007, 95, 898–904. [Google Scholar] [CrossRef] [Green Version]
- Sambuy, Y.; De, A.I.; Ranaldi, G.; Scarino, M.L.; Stammati, A.; Zucco, F. The Caco-2 cell line as a model of the intestinal barrier: Influence of cell and culture-related factors on Caco-2 cell functional characteristics. Cell Biol. Toxicol 2005, 21, 1–26. [Google Scholar] [CrossRef]
- Luo, X.; Wang, R.; Wang, J.; Li, Y.; Luo, H.; Chen, S.; Zeng, X.; Han, Z. Acylation of Anthocyanins and Their Applications in the Food Industry: Mechanisms and Recent Research Advances. Foods 2022, 11, 2166. [Google Scholar] [CrossRef]
- Toydemir, G.; Boyacioglu, D.; Capanoglu, E.; van der Meer, I.M.; Tomassen, M.M.; Hall, R.D.; Mes, J.J.; Beekwilder, J. Investigating the transport dynamics of anthocyanins from unprocessed fruit and processed fruit juice from sour cherry (Prunus cerasus L.) across intestinal epithelial cells. J. Agric. Food Chem. 2013, 61, 11434–11441. [Google Scholar] [CrossRef]
- Yang, F.F.; Zhou, J.; Hu, X.; Cong, Z.Q.; Liu, C.Y.; Pan, R.L.; Chang, Q.; Liu, X.M.; Liao, Y.H. Improving oral bioavailability of resveratrol by a UDP-glucuronosyltransferase inhibitory excipient-based self-microemulsion. Eur. J. Pharm. Sci. 2018, 114, 303–309. [Google Scholar] [CrossRef]
- Hochman, J.; Tang, C.; Prueksaritanont, T. Drug-drug interactions related to altered absorption and plasma protein binding: Theoretical and regulatory considerations, and an industry perspective. J. Pharm. Sci. 2015, 104, 916–929. [Google Scholar] [CrossRef] [PubMed]
- Sigurdson, G.T.; Atnip, A.; Bomser, J.; Giusti, M.M. Aglycone structures and glycosylations affect anthocyanin transport and uptake in human gastric epithelial (NCI-N87) cells. J. Food Compos. Anal. 2018, 65, 33–39. [Google Scholar] [CrossRef]


| Gene Name | RNA Sequence (5′-3′) |
|---|---|
| NC siRNA | UUCUCCGAACGUGUCACGUTT ACGUGACACGUUCGGAGAATT |
| sGLT1 siRNA-1 | GGACAGTGTTGAACGTCAATT TTGACGTTCAACACGTACCTT |
| sGLT1 siRNA-2 | GGGCCATATTCATCAATCTTT AGATTGATGAATATGGCCCTT |
| sGLT1 siRNA-3 | GGAGCGTATTGACCTGGATTT ATCCAGGTCAATACGCTCCTT |
| GLUT2 siRNA-1 | CAAACATTCTGTCATTAGTTT ACTAATGACAGAATGTTTGTT |
| GLUT2 siRNA-2 | CGGGCATTCTTATTAGTCATT TGACTAATAAGAATGCCCGTT |
| GLUT2 siRNA-3 | GTGCCATCTTCATGTCAGTTT ACTGACATGAAGATGGCACTT |
| Gene Name | RNA Sequence (5′-3′) | |
|---|---|---|
| GAPDH | Fw | TCAAGAAGGTGGTGAAGCAGG |
| Rv | TCAAAGGTGGAGGAGTGGGT | |
| SGLT1 | Fw | GCAATCACTGCCCTTTAC |
| Rv | TGTTGCCATCAGACACTATG | |
| GLUT2 | Fw | GCTACCGACAGCCTATTC |
| Rv | AAACAAACATCCCACTCA | |
| ANC Concentrations (×10−3 mg/mL) | Papp (×10−7 cm/s) | Papp (B→A)/ Papp (A→B) | Transport Efficiency A→B (%) without FA-g-CS | Transport Efficiency A→B (%) with FA-g-CS Co-Treatment | |
|---|---|---|---|---|---|
| B→A | A→B | ||||
| 0.05 | 3.78 ± 0.48 | 4.91 ± 0.58 | 0.77 | 0.81 | 1 |
| 0.10 | 7.19 ± 0.98 | 9.61 ± 0.48 | 0.75 | 1.15 | 2.1 |
| 0.15 | 19.35 ± 9.08 | 15.02 ± 5.23 | 1.29 | 1.18 | 2.3 |
| 0.20 | 14.78 ± 0.48 | 11.20 ± 1.08 | 1.32 | 0.96 | 1.65 |
| Concentrations of ANC at the Apical Side (×10−3 mg/mL) | Without FA-g-CS Co-Treatment, Concentrations of ANC at the Basolateral Side (×10−3 mg/mL) | In Presence of 0.05 × 10⁻³ mg/mL FA-g-CS, Concentrations of ANC at the Basolateral Side (×10−3 mg/mL) | ||||||
|---|---|---|---|---|---|---|---|---|
| 1 h | 2 h | 3 h | 4 h | 1 h | 2 h | 3 h | 4 h | |
| 0.05 | 0.0001 ± 0.00001 a | 0.0003 ± 0.00001 b | 0.0004 ± 0.00001 c | 0.0004 ± 0.00001 c | 0.0003 ± 0.00001 b | 0.0004 ± 0.00001 c | 0.0004 ± 0.00001 c | 0.0005 ± 0.00001 d |
| 0.10 | 0.0004 ± 0.00002 a | 0.0008 ± 0.00001 b | 0.0009 ± 0.00001 b | 0.0012 ± 0.00002 c | 0.0010 ± 0.0001 bc | 0.0010 ± 0.0002 bc | 0.0019 ± 0.0001 d | 0.0021 ± 0.0002 d |
| 0.15 | 0.0006 ± 0.00001 a | 0.0009 ± 0.00002 b | 0.0010 ± 0.0003 b | 0.0018 ± 0.00001 c | 0.0017 ± 0.0002 c | 0.0025 ± 0.0002 d | 0.0030 ± 0.0001 e | 0.0035 ± 0.0001 f |
| 0.20 | 0.0007 ± 0.00001 a | 0.001 ± 0.0002 b | 0.0012 ± 0.0001 b | 0.0019 ± 0.0001 c | 0.0020 ± 0.0001 c | 0.0023 ± 0.0002 d | 0.0032 ± 0.0001 e | 0.0033 ± 0.0001 e |
Publisher’s Note: MDPI stays neutral with regard to jurisdictional claims in published maps and institutional affiliations. |
© 2022 by the authors. Licensee MDPI, Basel, Switzerland. This article is an open access article distributed under the terms and conditions of the Creative Commons Attribution (CC BY) license (https://creativecommons.org/licenses/by/4.0/).
Share and Cite
Ma, Y.; Chen, X.; Diao, T.; Leng, Y.; Lai, X.; Wei, X. The Effect of Ferulic Acid-Grafted Chitosan (FA-g-CS) on the Transmembrane Transport of Anthocyanins by sGLT1 and GLUT2. Foods 2022, 11, 3299. https://0-doi-org.brum.beds.ac.uk/10.3390/foods11203299
Ma Y, Chen X, Diao T, Leng Y, Lai X, Wei X. The Effect of Ferulic Acid-Grafted Chitosan (FA-g-CS) on the Transmembrane Transport of Anthocyanins by sGLT1 and GLUT2. Foods. 2022; 11(20):3299. https://0-doi-org.brum.beds.ac.uk/10.3390/foods11203299
Chicago/Turabian StyleMa, Yi, Xiaojiao Chen, Tiwei Diao, Yinjiang Leng, Xiaoqin Lai, and Xin Wei. 2022. "The Effect of Ferulic Acid-Grafted Chitosan (FA-g-CS) on the Transmembrane Transport of Anthocyanins by sGLT1 and GLUT2" Foods 11, no. 20: 3299. https://0-doi-org.brum.beds.ac.uk/10.3390/foods11203299