1. Introduction
Tea polysaccharide (TPS) is the main bioactive component of tea, especially in low-grade tea, with a content from 0.8% to 1.5% [
1,
2,
3,
4,
5]. Many animal models and clinical studies have shown that tea polysaccharides are beneficial to human health, with antioxidant, antidiabetic, anti-inflammatory, and antitumor activity [
1,
6,
7,
8,
9].
Tea polysaccharide is one of the most important bioactive components in tea and has received increasing levels of attention because of its non-toxicities. The hypoglycemic activity of tea polysaccharides is the most important and researched function. Numerous studies have shown that the hypoglycemic mechanism of tea polysaccharides is mainly achieved by regulating the activity of key enzymes in glucose metabolism and protecting pancreatic islet cells to promote insulin secretion [
10]. Another prominent function of tea polysaccharides is antioxidant activity [
1,
3]. Antioxidant therapy to reverse the damage to tissue caused by oxidative stress has become a very effective strategy to prevent diabetes and its complications. Tea polysaccharides are now also believed to be able to be fermented by micro-organisms in the human intestine to produce products such as short-chain fatty acids (SCFAs), and these fermentation products interact with the intestinal flora to change the structure of the intestinal flora and affect the intestinal microecology [
11], thus changing the course of diseases such as diabetes.
The structure of polysaccharides determines their biological activity [
12]. The structure of tea polysaccharides can be divided into primary, secondary, tertiary, and quaternary structures, of which, secondary, tertiary, and quaternary structures are collectively referred to as advanced structures. The advanced structure is based on the primary structure [
13,
14]. The primary structure mainly includes the composition and arrangement order of the sugar groups, the connection of adjacent sugar groups, the anomeric carbon configuration, the presence or absence of branches in the sugar chain, and the position and length of the branch [
7,
15]. Compared with proteins and nucleic acids, the primary structure of polysaccharides is very complicated and is also the focus and difficulty of current research.
Takeo found that the polysaccharide extracted from tea with hypoglycemic activity was galactoglucan [
15]. The tea polysaccharide isolated by Chen et al. with hypoglycemic effects was an acid ternary glycoconjugate containing protein and nucleic acid [
16]. Wang et al. isolated protein-removing polysaccharides and demonstrated that they had a good stimulating effect on glucokinase [
17]. Lu et al. found that acidic tea polysaccharide from Huangshan Maofeng could improve the activity of antioxidant enzymes and reduce the formation of peroxides in the liver of mice, thus achieving a hepatoprotective effect [
18]. The combined literature shows that acidic tea polysaccharides have a wide range of biological activity. However, there are still only a few studies on the structure–activity relationship of tea polysaccharides.
Wuyi rock tea is one of the six major teas in China (black tea, green tea, oolong tea, yellow tea, white tea, and dark tea) commonly known as “oolong tea”. Wuyi rock tea was originally cultivated on Wuyi Mountain, located in the northern part of Fujian Province in southeastern China. Partly due to the unique climate and edatope of Wuyi Mountain, Wuyi rock tea is recognized as one of the most prestigious oolong teas due to its special savor and long-lasting fragrance, called the “rock bone floral fragrance” [
19,
20,
21].
Wuyi rock tea is a semifermented tea with production methods ranging between green tea and black tea. The primary processing technology of Wuyi rock tea is: 1. picking, 2. withering, 3. fine manipulation of green tea leaves, 4. water removal, 5. rolling, and 6. drying [
22,
23,
24,
25,
26]. The refining process technique of Wuyi rock tea is: 1. pick out the big stems and yellow leaves, 2. screen, 3. pick out the small stems and yellow leaves (relatively coarse and old leaves), 4. take the residue in its entirety, and then 5. use low-temperature long baking [
22,
23,
24,
25,
26].
According to the estimate, byproducts such as yellow leaves and other inclusions account for approximately 20% to 30% of the total amount of crude tea. Yellow leaves are produced because the leaves have a thick layer of wax, and the pigment is not oxidized easily during processing and finally turns yellow. For leaves without wax protection, the color darkens during processing. Due to the poor appearance and inclusion ratio and the poor taste and aroma, yellow leaves are generally sold in low-price batches or used on tea trees as fertilizer, which has a low utilization rate.
The content of the main pharmacological components (such as caffeine, tea polyphenols, etc.) in the tea decreases with the degree of coarseness, while the content of tea polysaccharides is the opposite. The coarser the tea leaves, the higher the tea polysaccharide content. Therefore, we suggest that yellow leaves of Wuyi rock tea could be treated as a potential resource for the development of polysaccharide antioxidants and hypoglycemic products [
1].
2. Materials and Methods
2.1. Extraction, Purification, and Identification of Purified Polysaccharide (CY)
The coarse tea of Wuyi rock tea (yellow leaves) was crushed into powder, and then 80% ethanol was added to remove fat-soluble ingredients. The crude polysaccharide was extracted with distilled water (1:30 solid/liquid ratio) and ultrasound-assisted extraction at 60 °C and 50 kHz for 2 h. The water extract was centrifuged (3000 rpm, 20 min, 20 °C) to collect the supernatant and then precipitated by the addition of 85% ethanol (4 °C, 24 h). The precipitate was collected through centrifugation (10,000 rpm, 20 min, 20 °C) and then freeze-dried to obtain the crude polysaccharide.
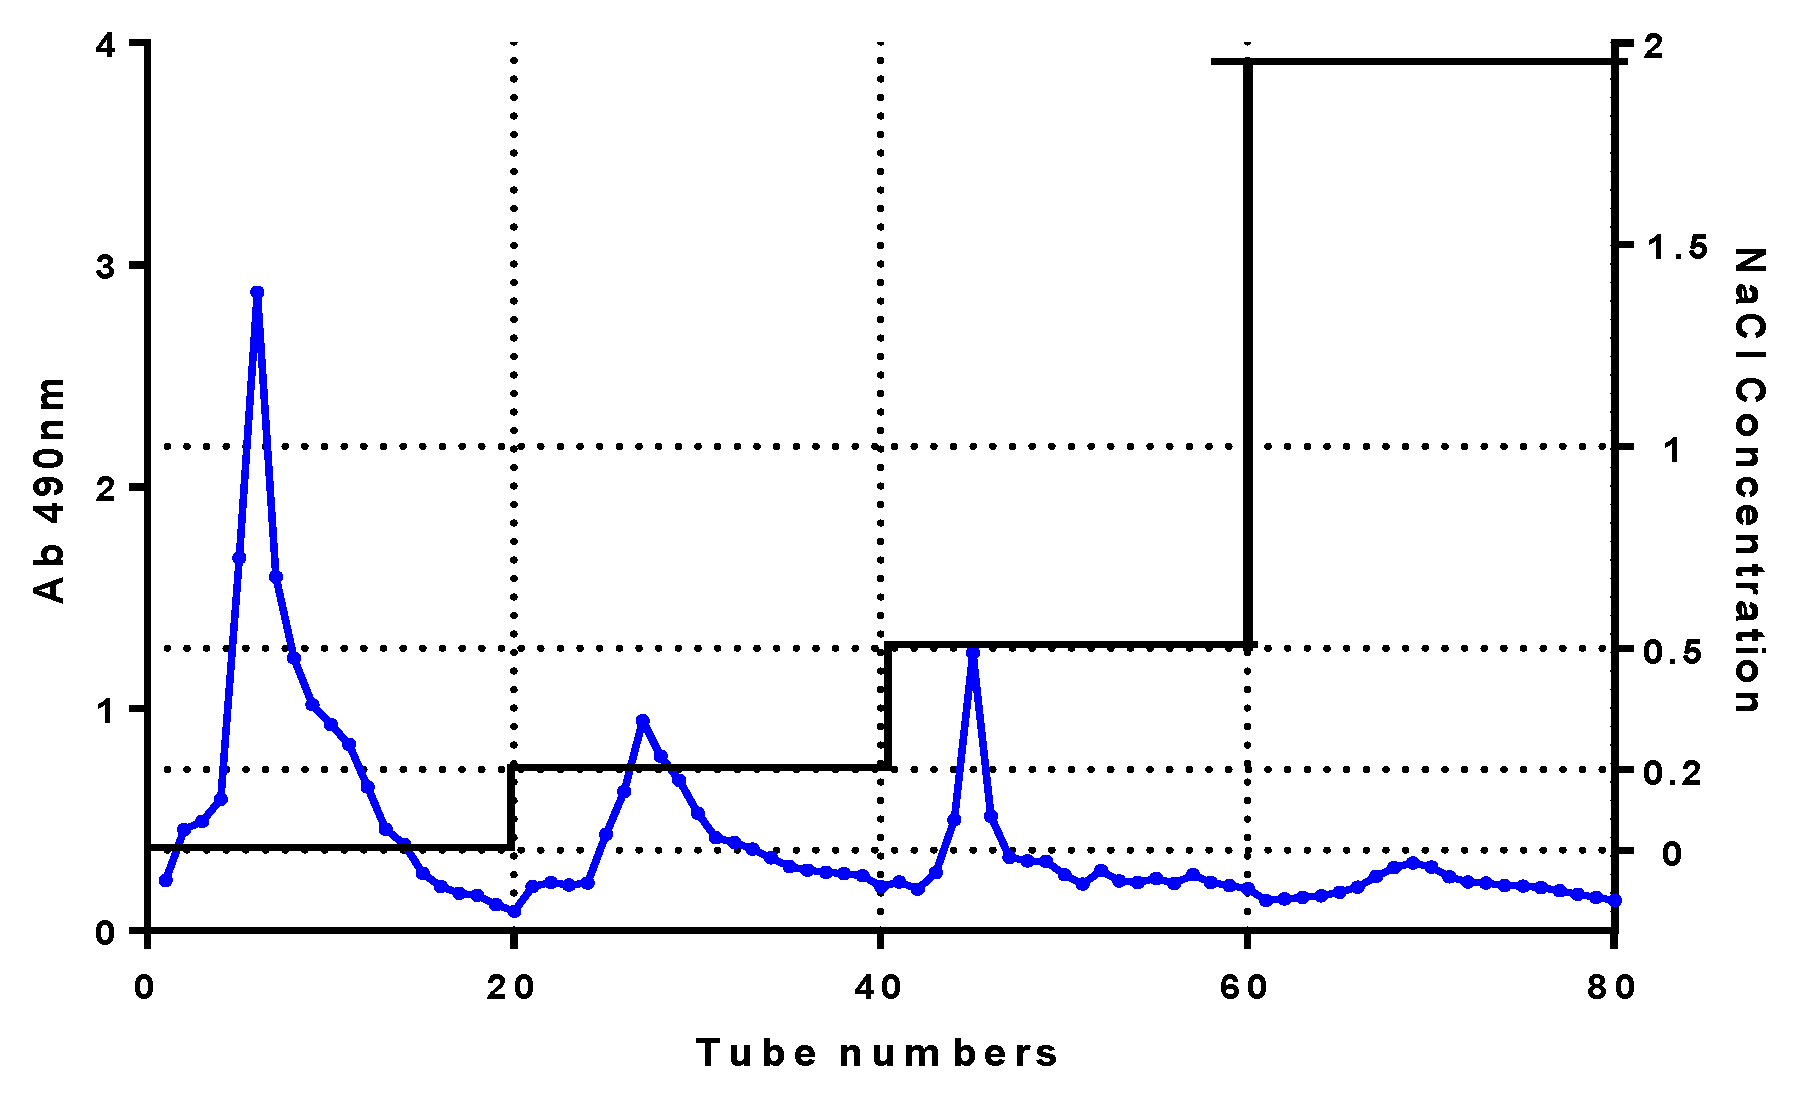
Crude polysaccharide (1 g) was dissolved with distilled water, heated, shaken well, and centrifuged at 12,000 rpm. The supernatant was added to a DEAE-52 cellulose chromatography column and then eluted at a 15 mL/min flow rate with distilled water and NaCl solution (0.2, 0.5, 2.0 mol/L sequentially). Eluent (4 mL) was collected in each tube. A completely separated fraction was gathered by measuring eluent absorbance at 490 nm according to the phenol–sulfuric acid method [
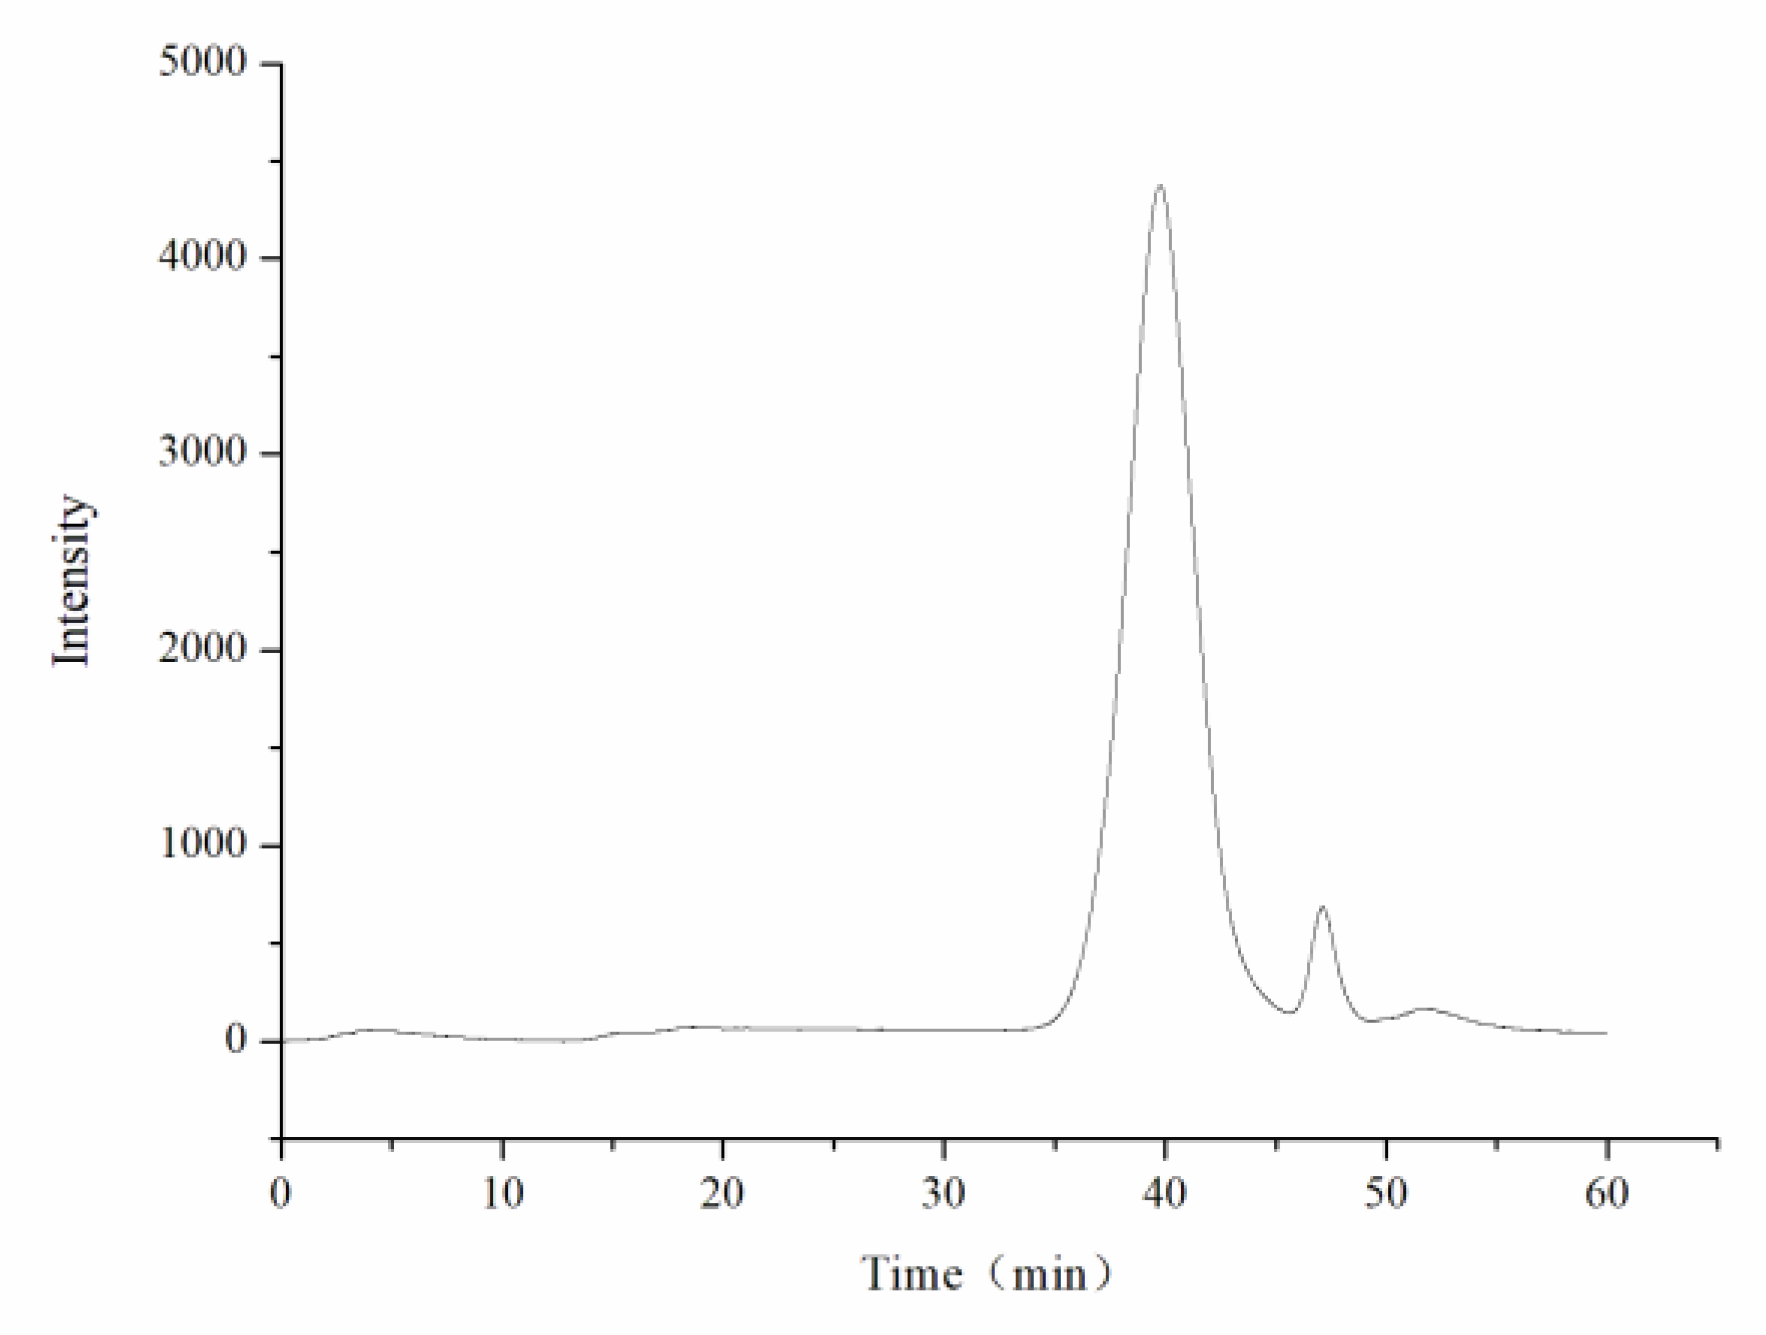
27]. The fractions were dialyzed (3500 Da molecular weight cutoff (MWCO)) and lyophilized. Then, the fraction solution (100 mg/3 mL) was centrifuged at 12,000 rpm for 10 min. The supernatant was further purified using distilled water at a flow rate of 0.5 mL/min through Superdex-200 (GE Healthcare Bio-Sciences Corp., Marlborough, MA, USA) with refractive index detector (Shodex RI-502; Shoko Co., Ltd., Kanagawa, Japan). After lyophilization, the purified polysaccharide named CY was obtained. The purity of CY measured was 91.3% using high-performance liquidchromatography (HPLC).
2.2. Molecular Weights and Monosaccharide Composition Measurement
The average molecular weights of CY were measured using a Shimadzu high-performance gel permeation chromatography (HPGPC) system equipped with a BRT105-104-102 (8 × 300) column and a Shimadzu RI-502 refractive index detector. The sample size was 20 μL, and 0.05 mol/L NaCl solution was used as the mobile phase at a flow rate of 0.6 mL/min. The column temperature was controlled at 40 °C during the operation. The standard curve was established with a dextran standard.
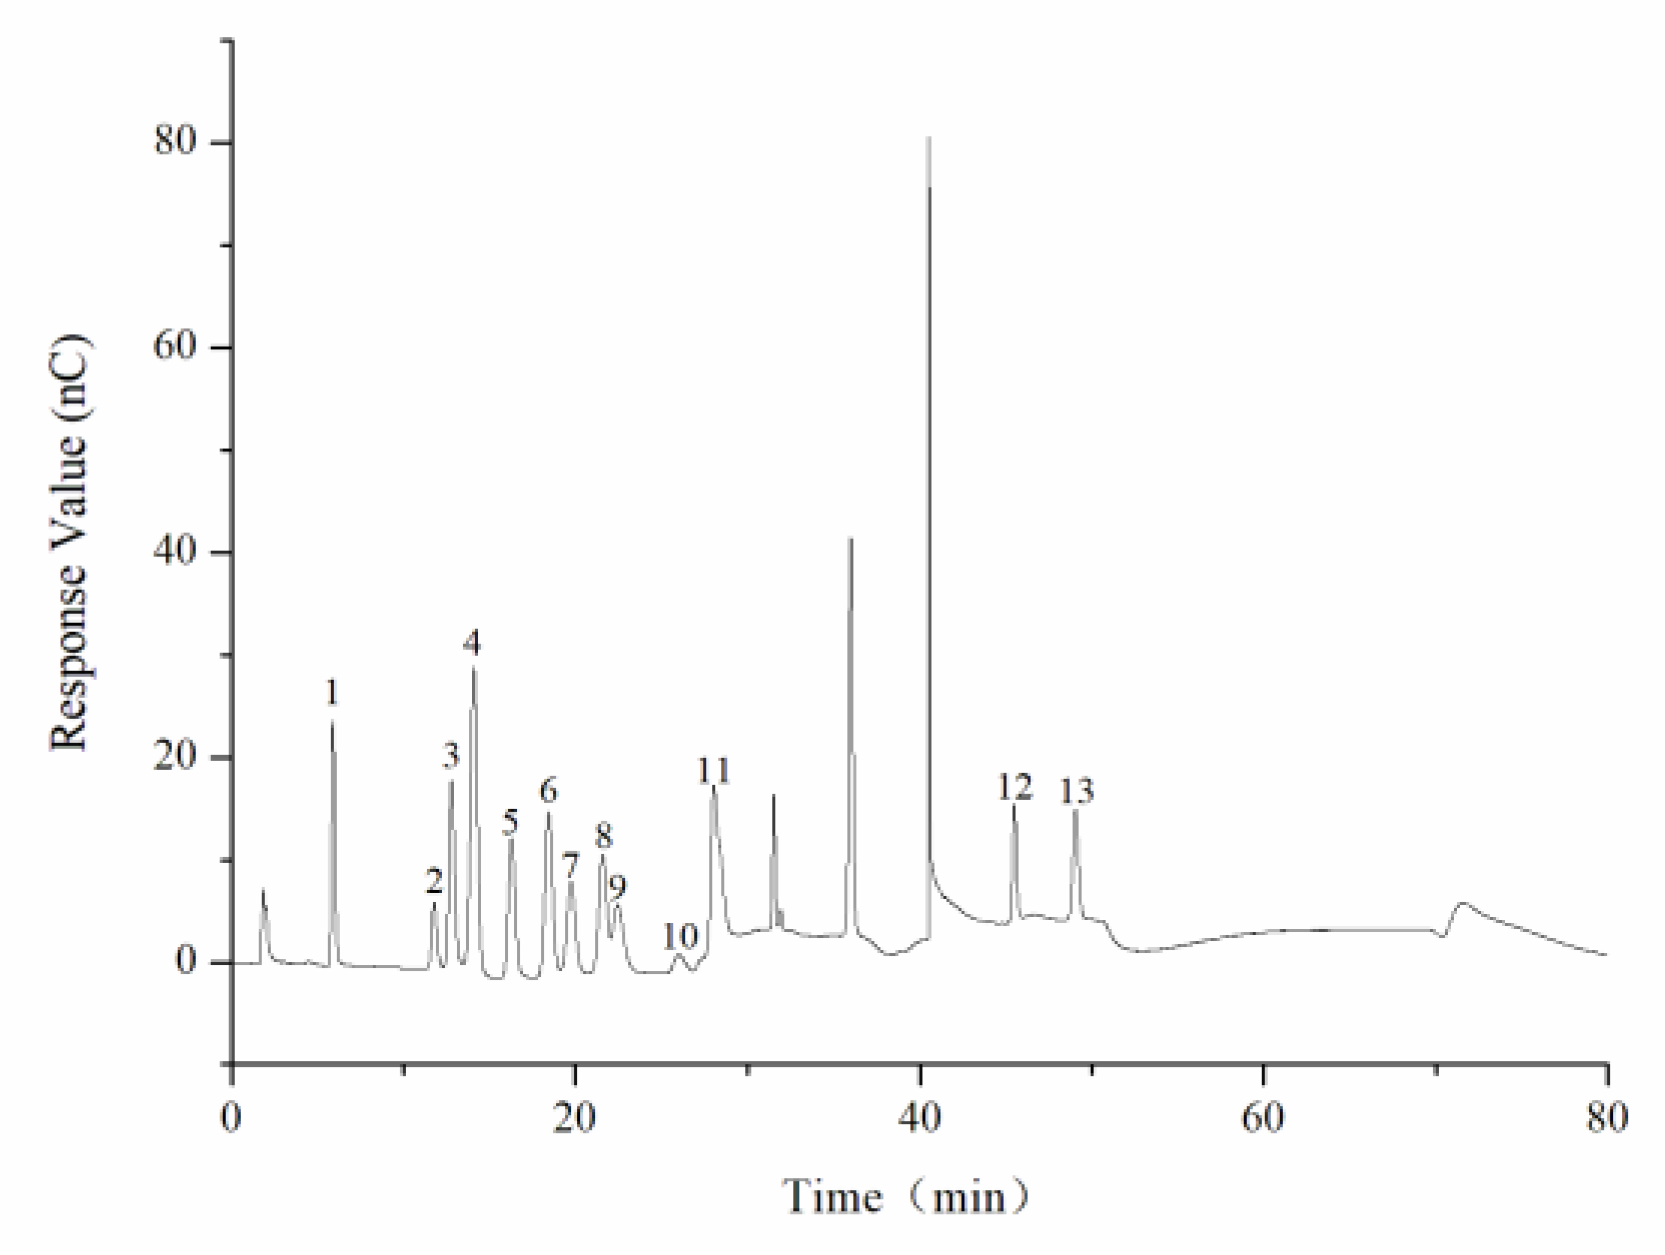
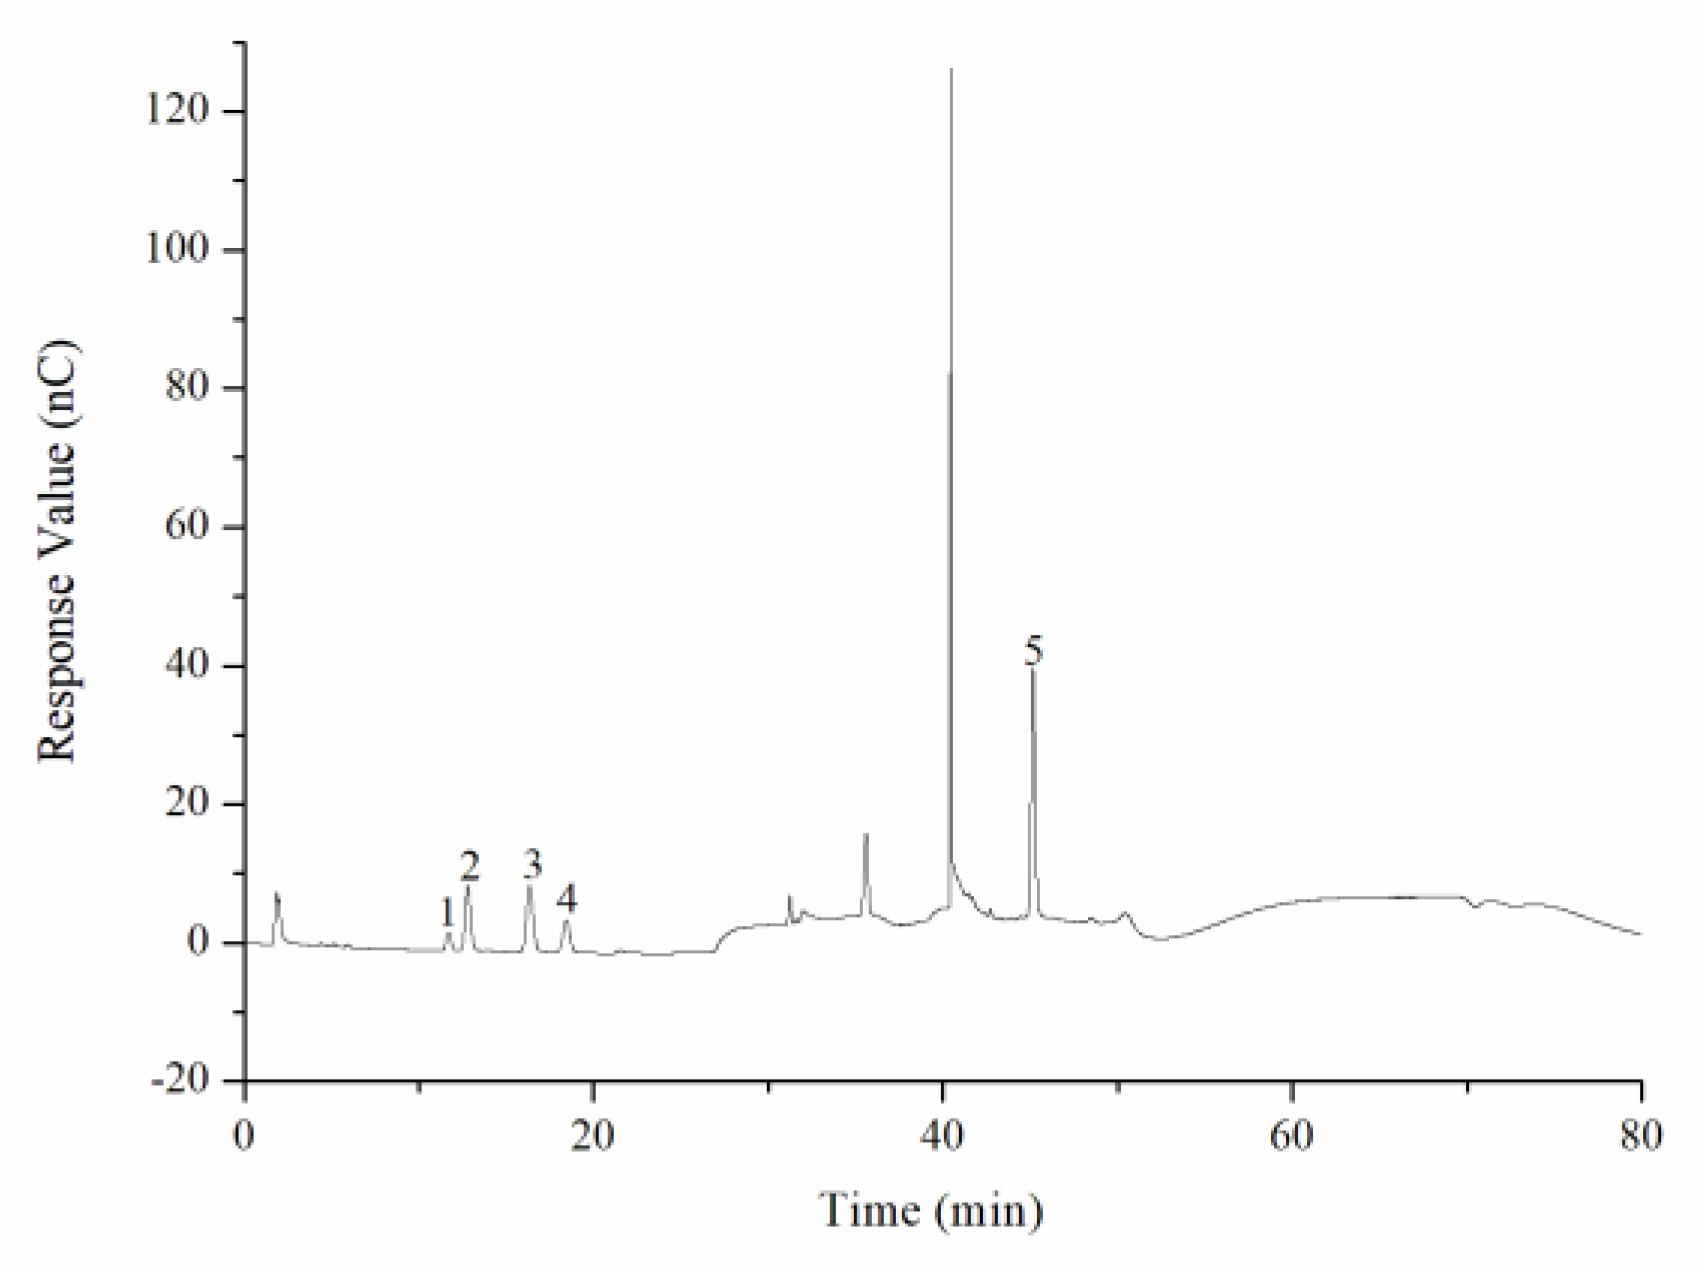
The monosaccharide composition of CY was determined by an ion spectrometer (ICS5000; Thermo Fisher Technology Co., Ltd., Waltham, MA, USA) with a DionexCarbopacTMPA20 chromatographic column (3 × 150) and an electrochemical detector. The sample size was 5 µL, and H2O, 250 mmol/L NaOH, 50 mmol/L NaOH, and 500 mmol/L NaOAC were used as the mobile phases at a flow rate of 0.3 mL/min. The column temperature was controlled at 30 °C during operation. The monosaccharide standards include fucose, rhamnose, arabinose, glucosamine hydrochloride, galactose, glucose, N-acetyl-d-glucosamine, xylose, mannose, fructose, ribose, galacturonic acid, and glucuronic acid.
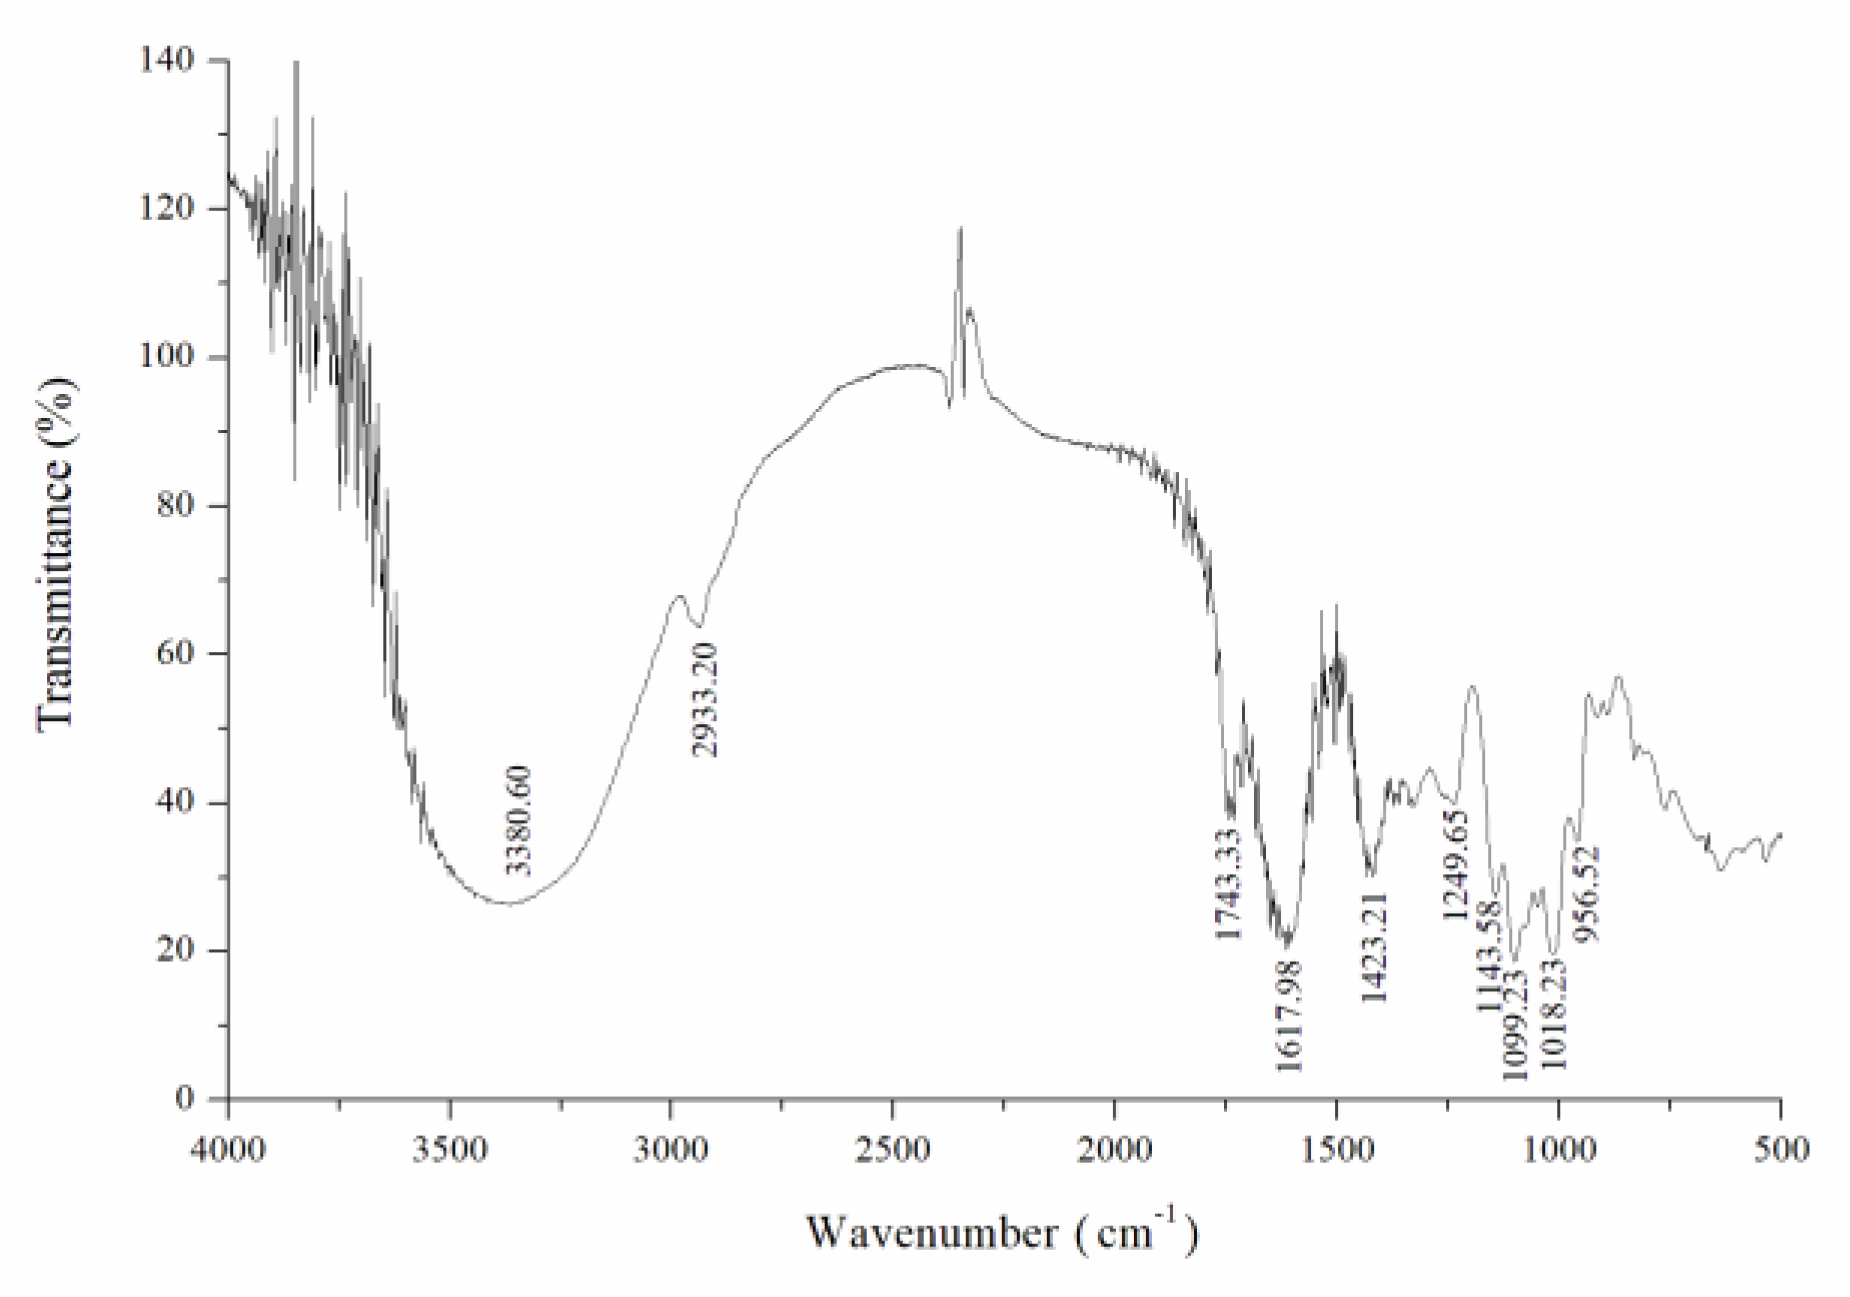
2.3. FTIR Spectroscopy Analysis
The CY sample was measured in the region of 4000–400 cm−1 by a Fourier transform infrared spectrometer (FTIR). The mixture (2 mg CY mixed with 200 mg KBr) was pressed into transparent sections by a cylindrical mold for FTIR analysis.
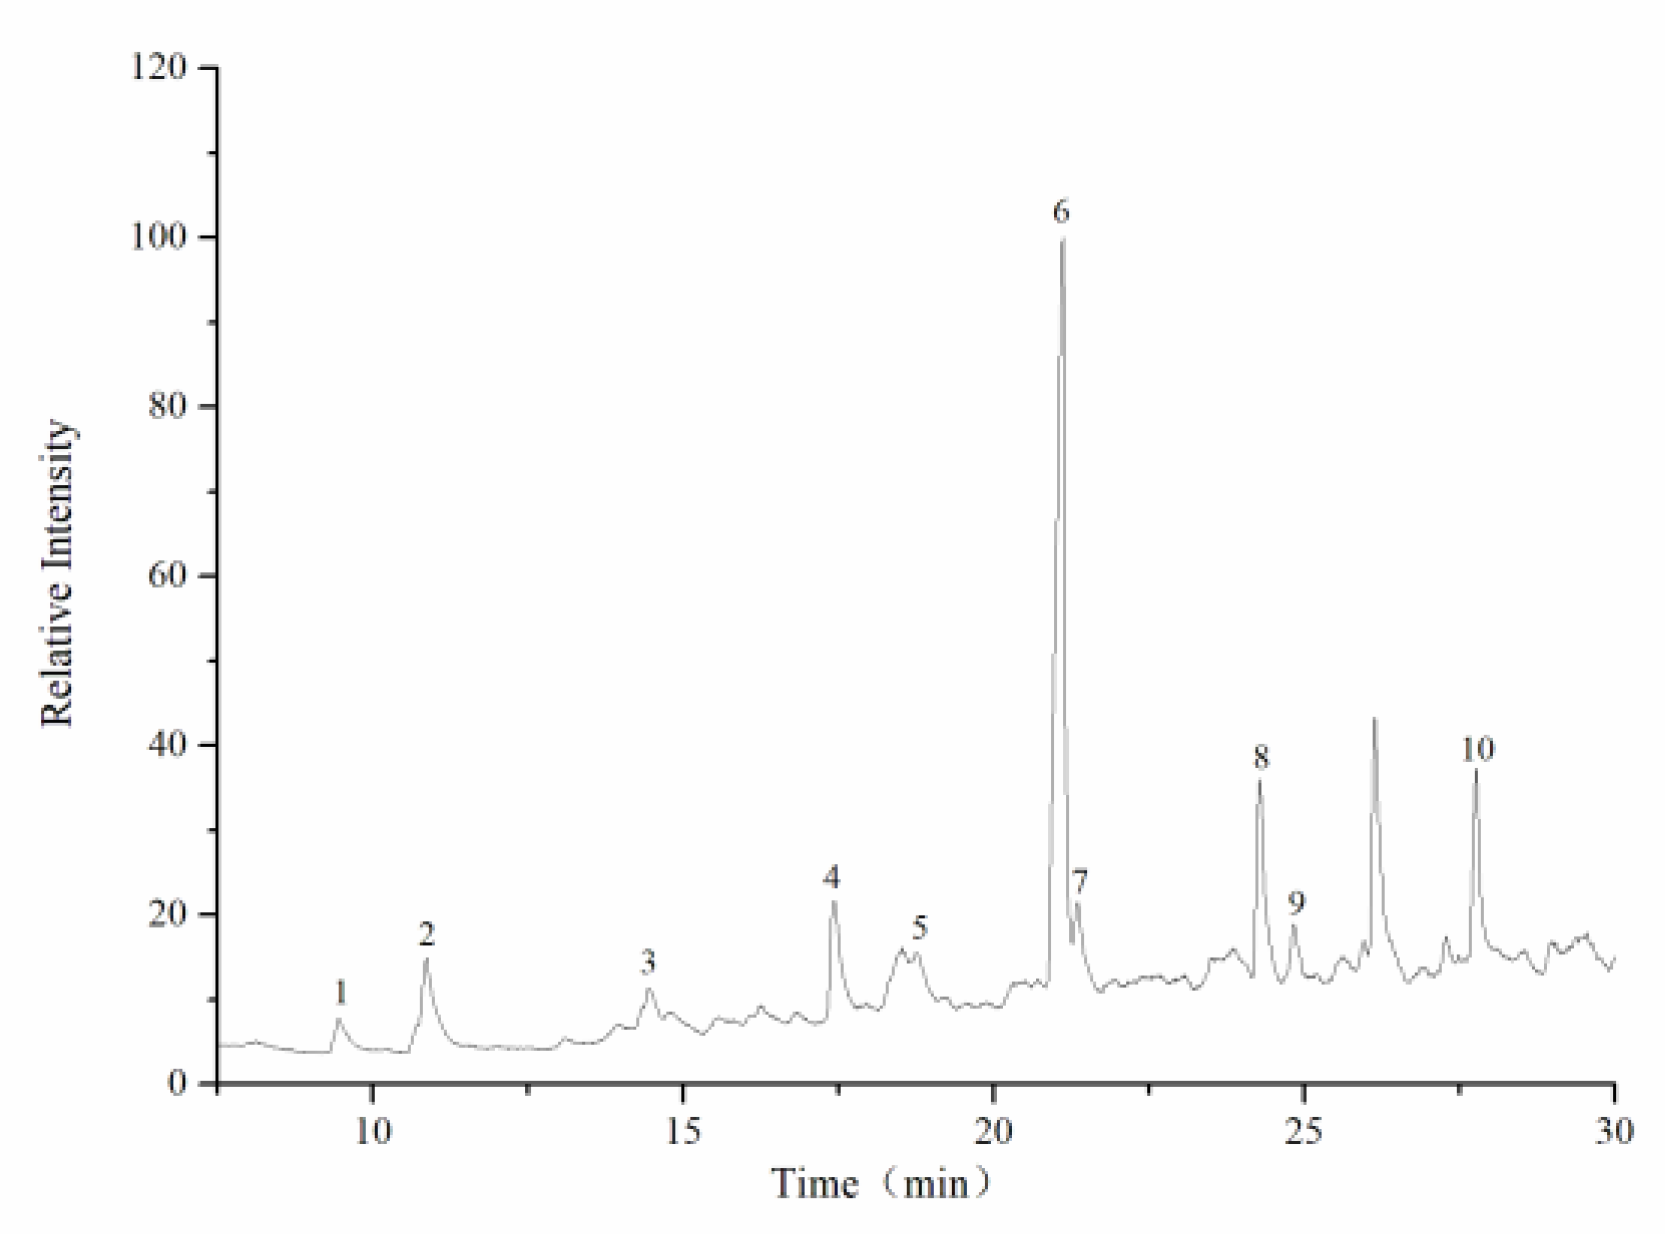
2.4. Glycosidic Linkage Type Analysis
Methylation and gas chromatography/mass spectrometry (GC/MS) analysis were performed according to the method described by Shi et al. [
28]. Briefly, 3 mg of dried CY was dissolved in 1 mL dried dimethyl sulfoxide (DMSO). Then, 20 mg of NaOH powder was added, and the mixture was dissolved under ultrasonic action. The methylation reaction was maintained for 1 h after the slow addition of CH
3I (1.0 mL) to the system. Then, 2.0 mL of ultrapure water was added to terminate the reaction. After the extraction of the methylated polysaccharide, 1 mL of 2 mol/L trifluoroacetic acid was added and hydrolyzed for 90 min. After drying, 2 mL of distilled water and 60 mg of sodium bromide were added, stirred at room temperature for 8 h, neutralized with glacial acetic acid, and dried at 101 °C. Finally, 1.0 mL of acetic anhydride was added, acetylated at 100 °C for 1 h, and cooled. The product was extracted with 3 mL of methylbenzene, depressurized, and dried three times to remove acetic anhydride. The product was transferred to 3 mL dichloromethane, a small amount of distilled water was added, and it was shaken well to remove the upper aqueous solution, repeated four times. The dichloromethane layer was dried by anhydrous sodium sulfate in a constant volume to 10 mL. The concentrated methylated alditol acetate derivatives were filtered through a 0.22 μm membrane for GC/MS analysis (GCMS-QP2010; Shimadzu Instruments Co., Ltd., Kyoto, Japan).
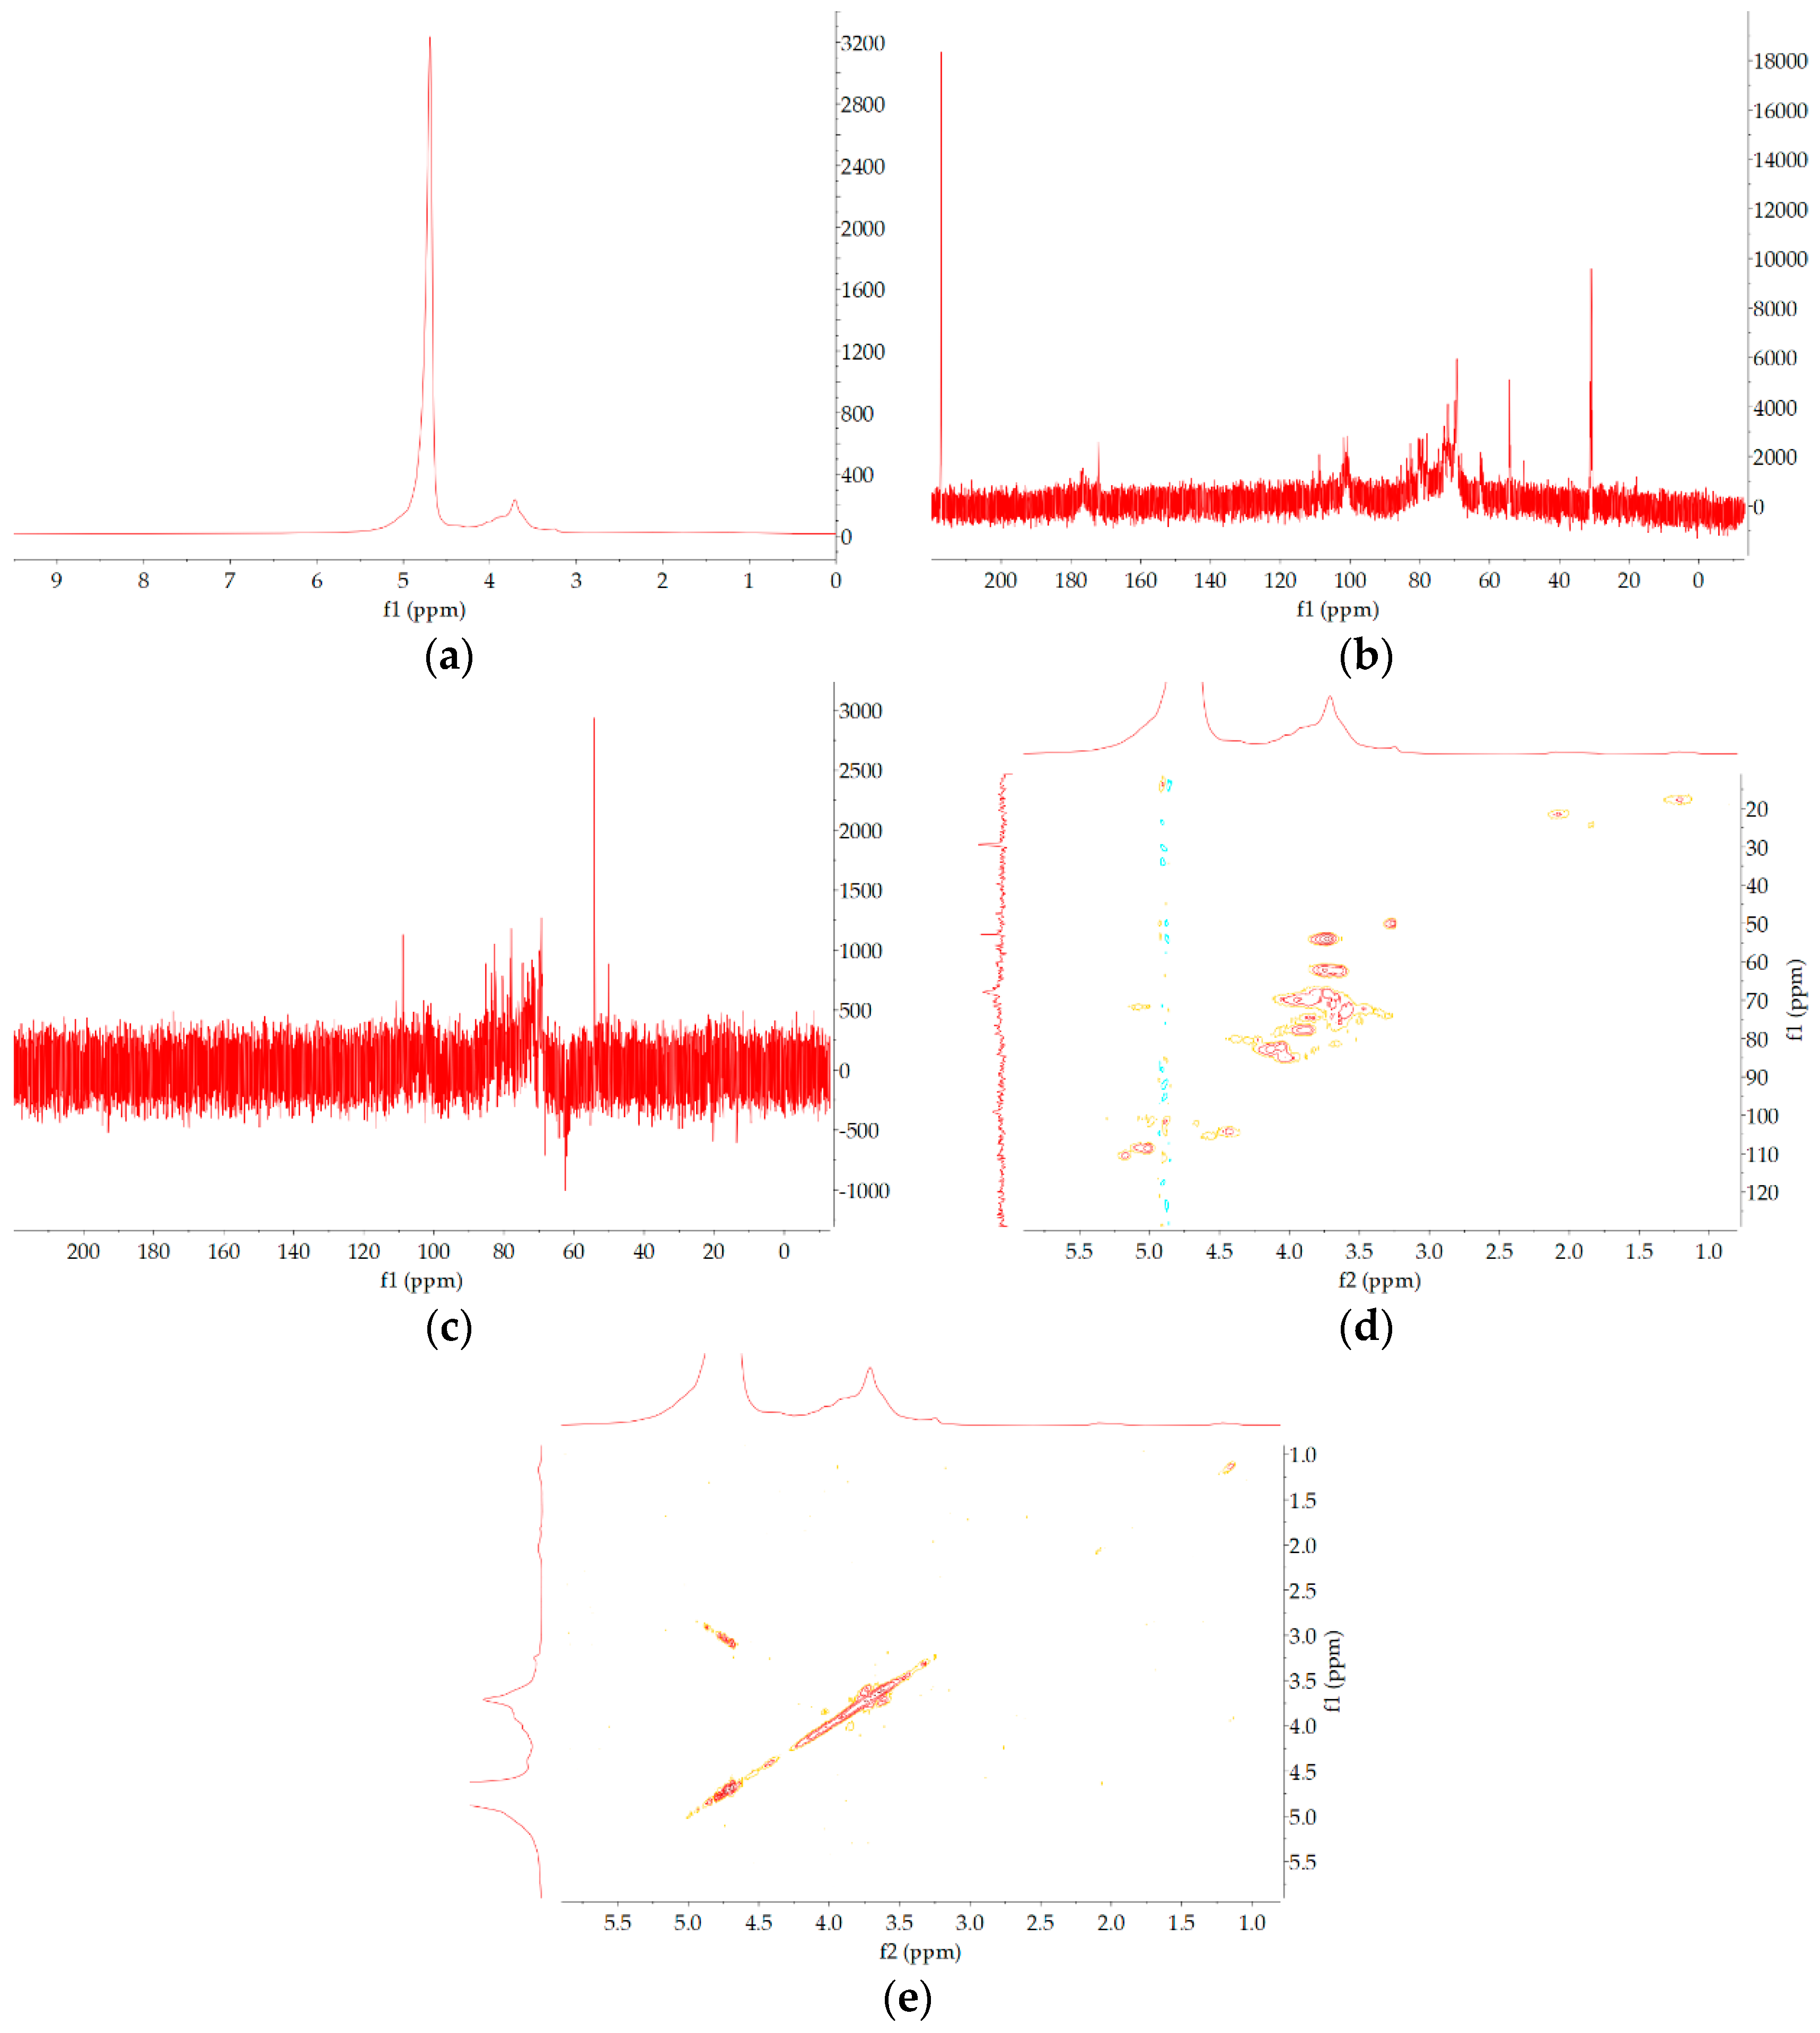
2.5. Nuclear Magnetic Resonance (NMR) Spectrometer Analysis
CY (50 mg) was accurately weighed and dissolved in D2O to exchange hydrogen atoms for deuterium and then freeze-dried, repeated threetimes to obtain the sample. 1H and 13C NMR spectra of the CY sample were determined using a Bruker DRX-600 NMR spectrometer (Bruker BioSpin GmbH, Rheinstetten, Germany). MestReNova (Mwstrelab Research, Santiago de Compostela, Spain) software was used to process and analyze the NMR spectra results.
2.6. Ethics Statement
The animal experiment was approved by the Institutional Animal Care and Use Committee of Fujian University of Traditional Chinese Medicine (approval no. 2018070), and all guidelines for the care and use of animals were followed.
2.7. Animal Preparation and Experiment Design
Sixty male Wistar rats (6 weeks old, 200 ± 20 g) were provided by Shanghai SLAC Laboratory Animal Co., Ltd. (Shanghai, China). All experimental rats were raised under stable conditions (12 h daylight cycle, 55 ± 10% humidity, and 22 ± 2 °C) with free food and water. After 1 week of adaptive feeding, animals were randomly distributed into 6 groups. Normal control (NC) group rats were provided a chow diet, while the others were fed a high-fat diet (2.5% cholesterol, 1.0% sodium cholate, 20.0% sugar, 10.0% lard, and 66.5% commercial standard pellet diet). After 4 weeks of dietary manipulation, all rats were fasted for 12 h. Rats fed a high-fat diet were administered streptozotocin (STZ, 30 mg/kg body weight) intraperitoneally (i.p.) to induce type 2 diabetes mellitus (T2DM), and those fed a basal diet received an equivalent volume of saline. The rats were considered diabetic when the fasting blood glucose (FBG) level exceeded 16.7 mmol/L. The diabetic rats were distributed to the groups treated with 0 mg/kg CY (abbreviated as DC), 200 mg/kg CY (abbreviated as LT), 400 mg/kg CY (abbreviated as MT), 800 mg/kg CY (abbreviated as HT), and 200 mg/kg metformin (abbreviated as ME).
CY and metformin were diluted with distilled water to the desired concentration prior to gavage. The blood glucose value was measured via blood obtained from rat tail veins.
2.8. Sample Collection and Biochemical Index Analysis
During the experiment, the mental state and activity of the animals were observed daily, and the food intake and body weight were quantitatively determined weekly.
After fasting for 12 h, the rats were anesthetized using pentobarbital sodium to gather blood samples at the end of the observation period. The blood samples were centrifuged (3500 rpm, 15 min, 4 °C) to obtain clear serum. The serum levels of TG, TC, HDL-C, LDL-C, AST, and ALT were measured by assay kits (Nanjing Jiancheng Bioengineering Institute, Nanjing, China) according to the manufacturer’s protocol.
2.9. Measurement of Fasting Glucose and Oral Glucose Tolerance Test (OGTT)
On days 10, 20, 30, and 40, after the rats were fasted without water for 6 h, the fasting blood glucose values of the rats were measured by tail vein blood sampling before and after drug administration. At the end of the observation period, all rats were selected for the oral glucose tolerance test (OGTT). After 12 h of fasting overnight, basal blood glucose was detected, followed by gavaging each rat with glucose solution (1.5 g/kg). Then, blood glucose was monitored via blood obtained from rat tail veins at the following time points: 0 min, 30 min, 60 min, and 120 min. The results of the OGTT are expressed as the area under the glucose curve (AUC) over 120 min.
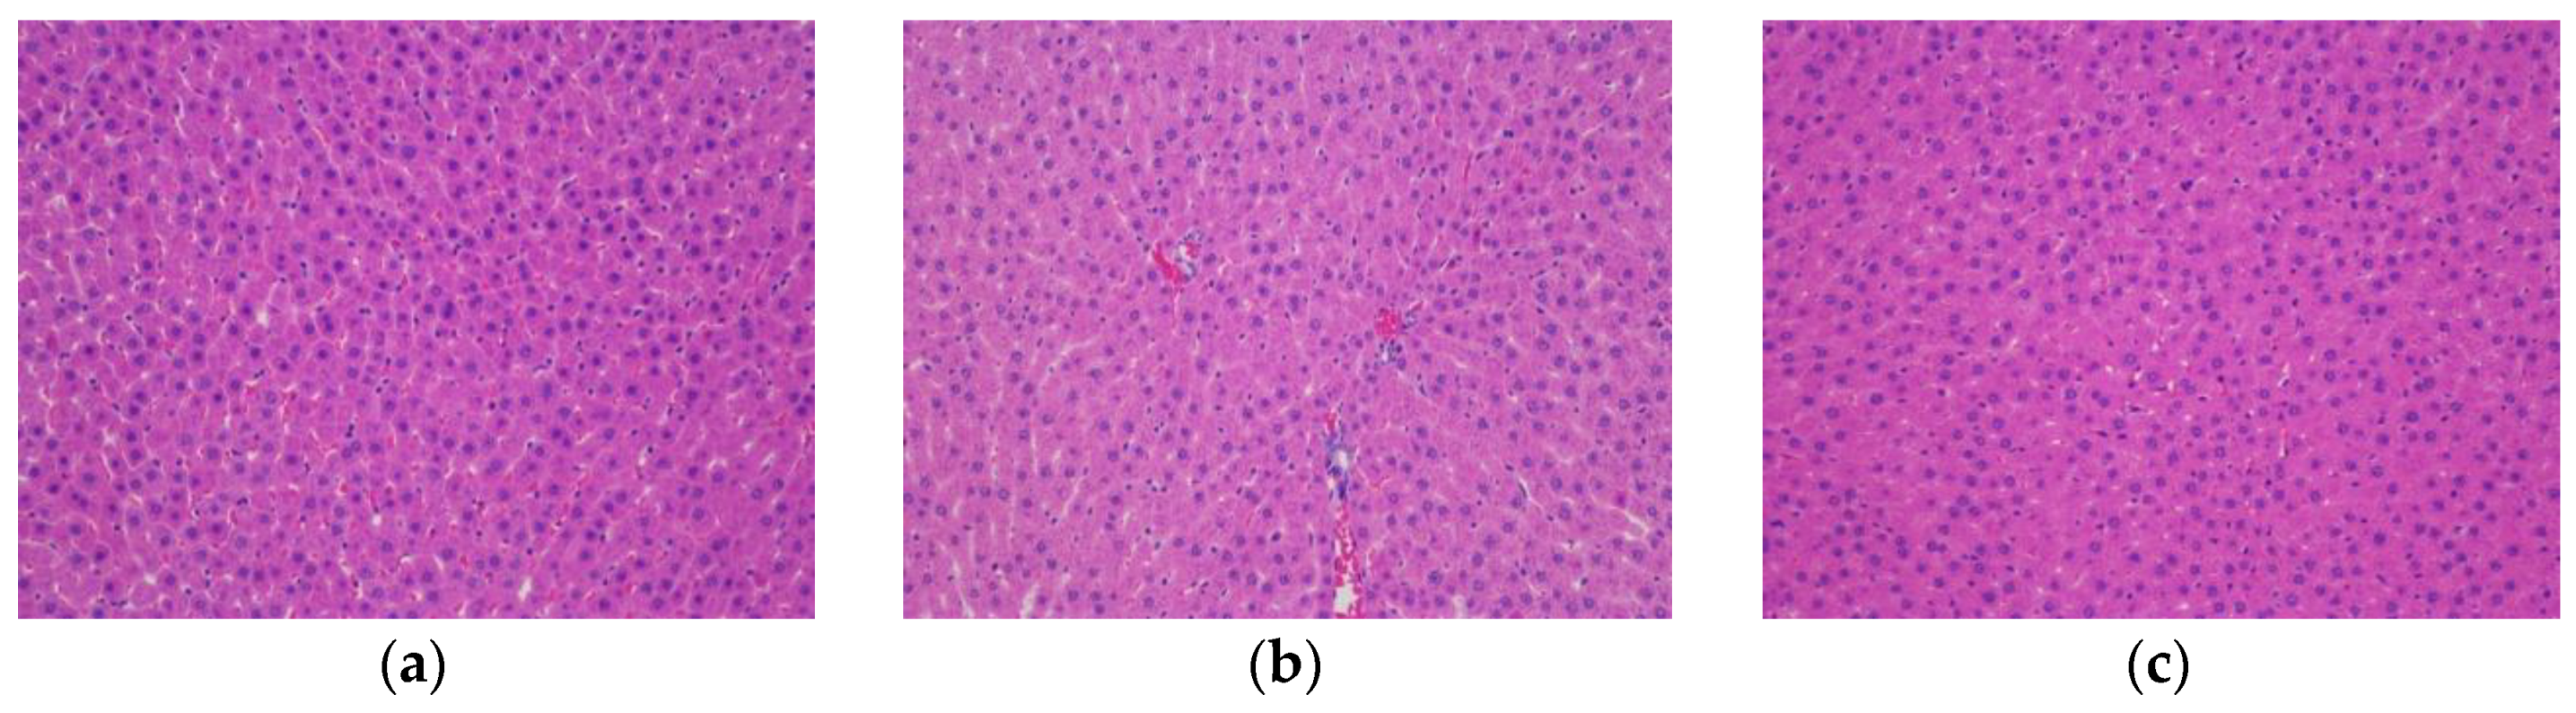
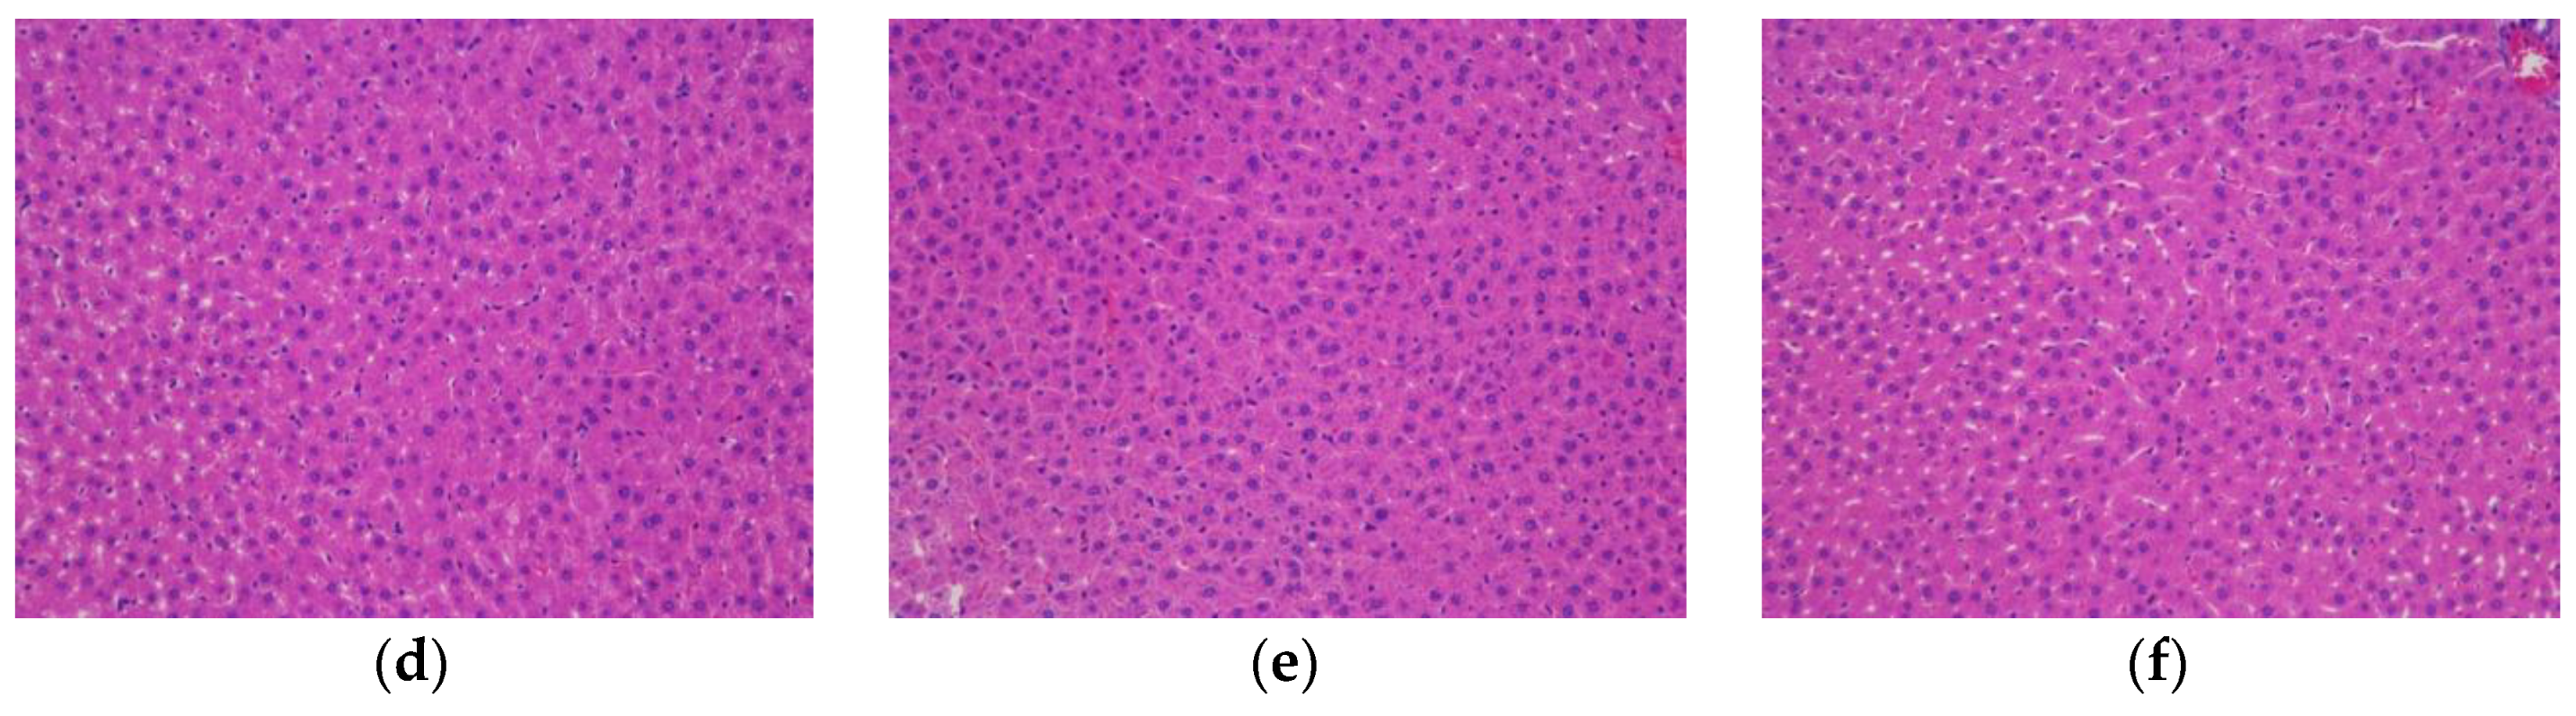
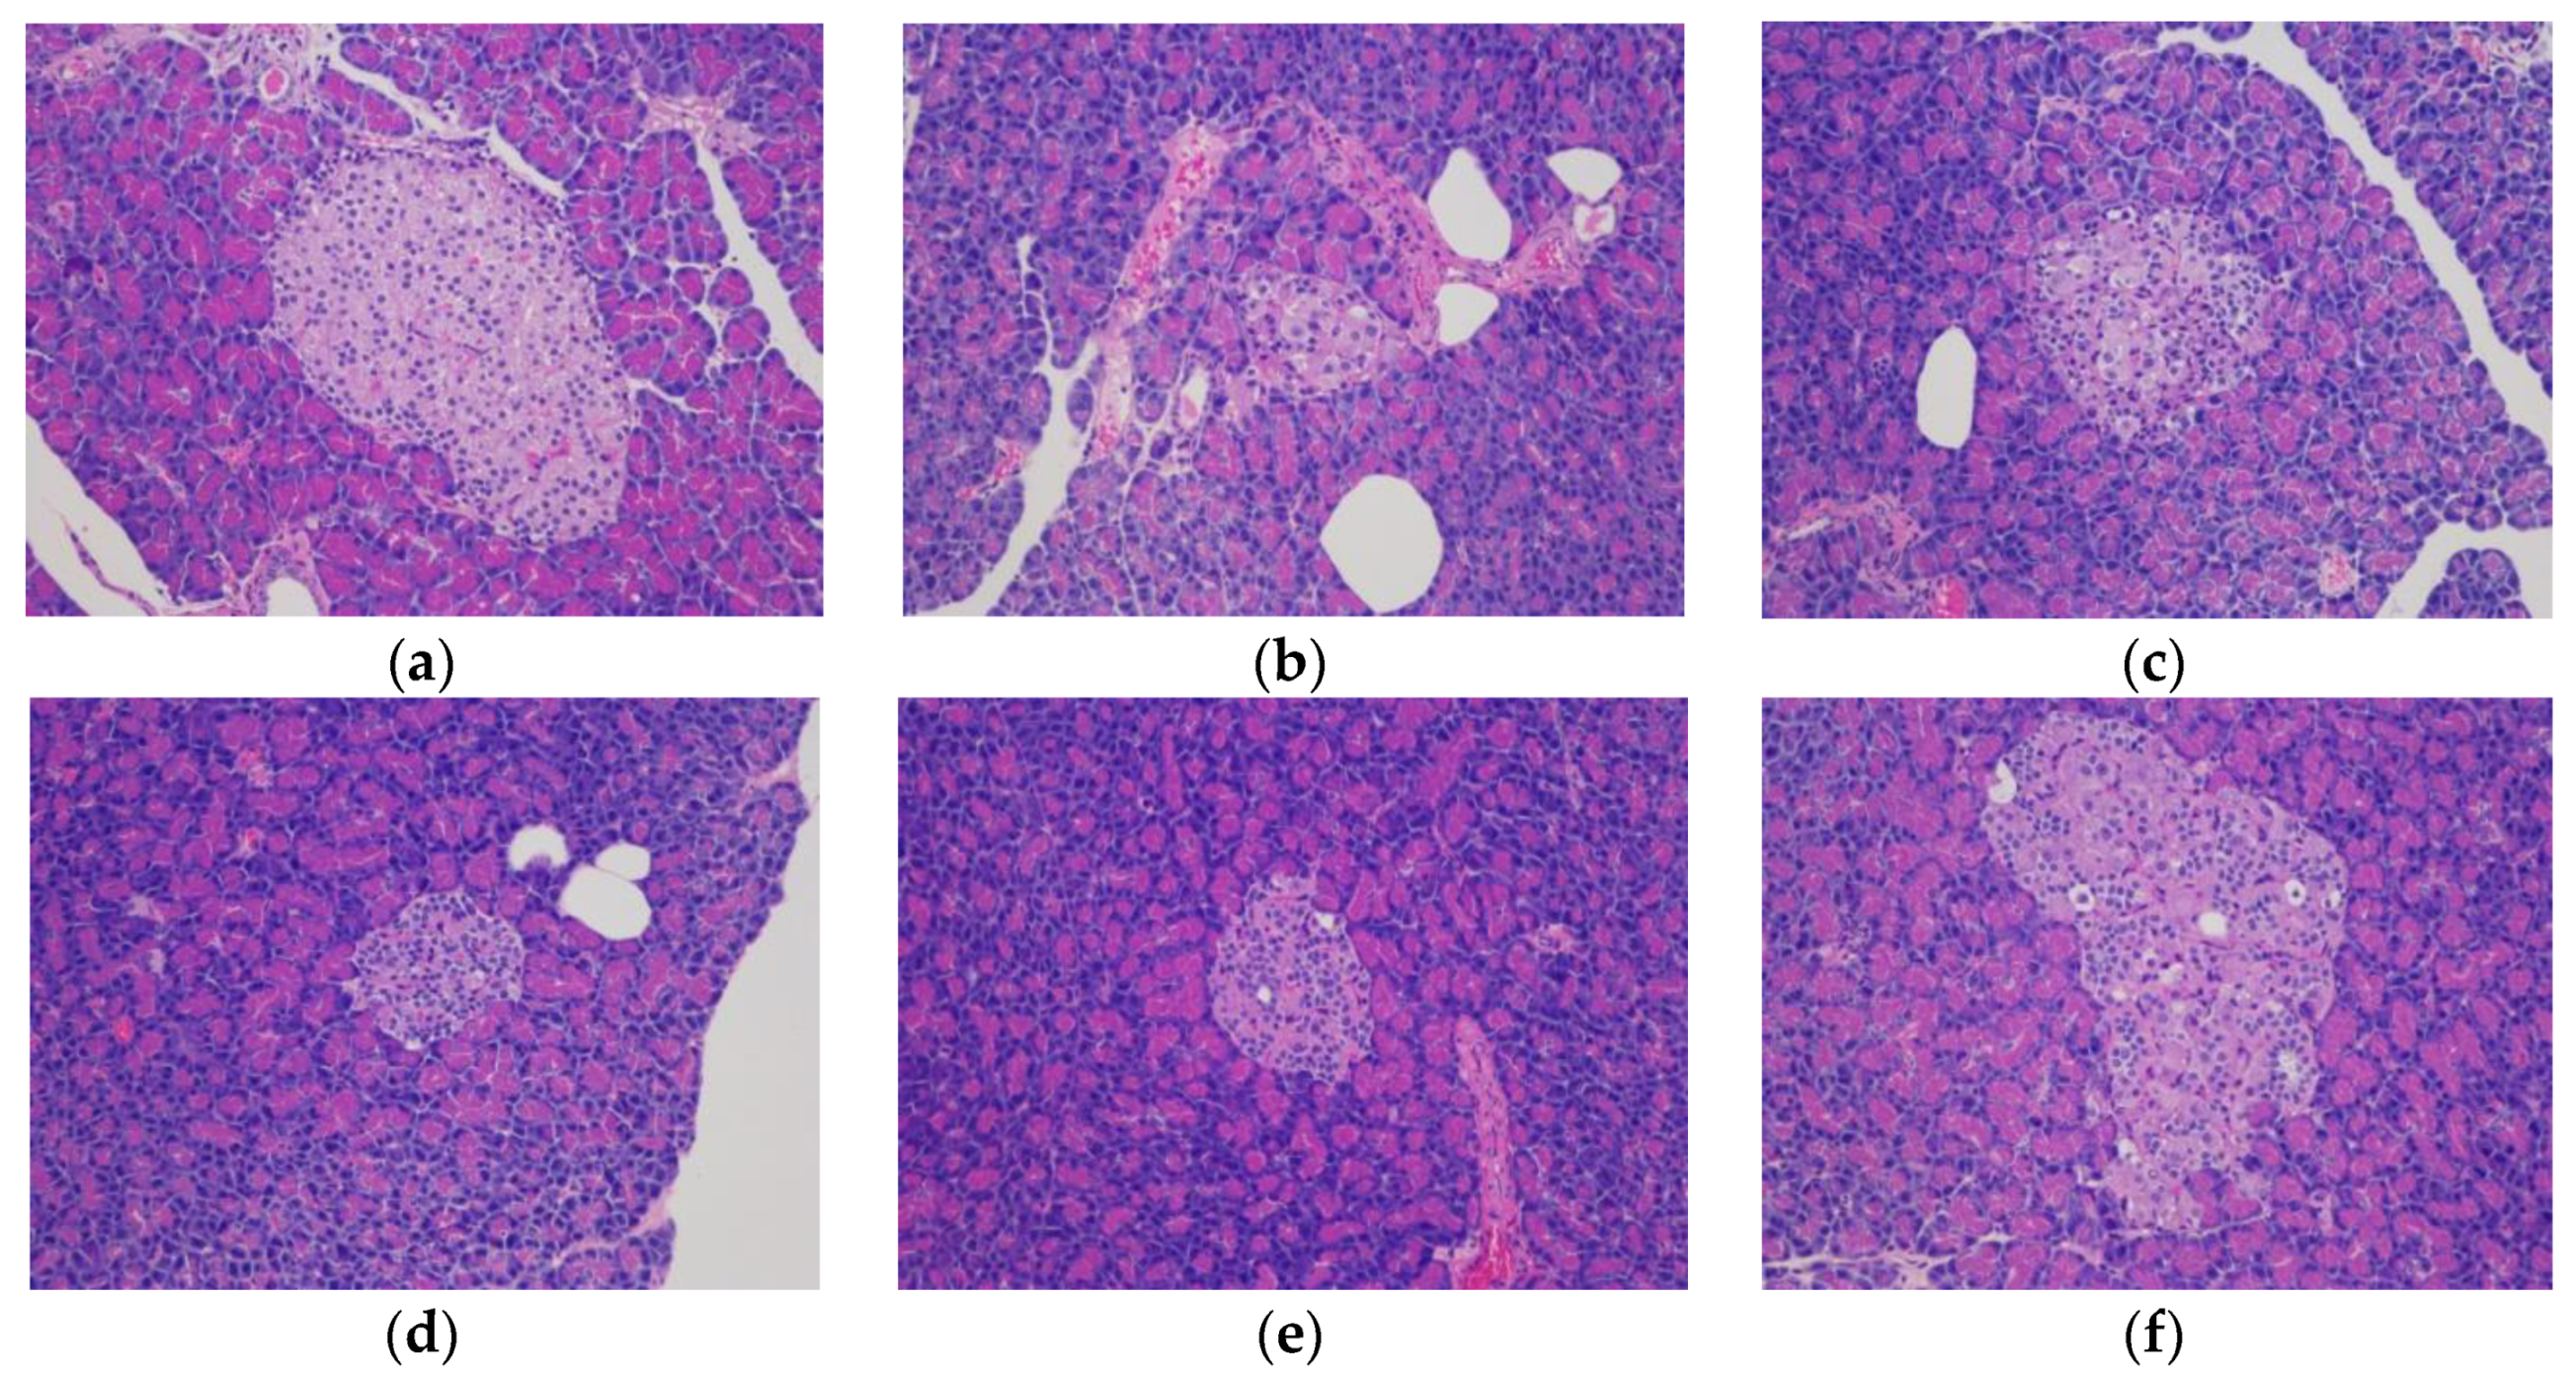
2.10. Histopathological Examination
The rat livers and pancreatic tissue were weighed, and hematoxylin and eosin (HE) staining was performed for histological investigation. In detail, the samples were fixed with 4% paraformaldehyde, dehydrated with alcohol gradients, cleared with xylene, embedded in paraffin, and sectioned. After deparaffinization, the sections were subjected to hematoxylin and eosin staining and then observed under a high-magnification microscope.
2.11. 16S rRNA Gene Sequence Analysis of Gut Microbiota in Cecum
Cecum contents were frozen in liquid nitrogen immediately after harvest and stored at −80 °C until sequencing. The sequencing service was conducted by Shanghai Personal Biotechnology Co., Ltd. (Shanghai, China). Total DNA from the cecal contents was extracted with Fast DNA SPIN extraction kits (MP Biomedicals, Santa Ana, CA, USA) following the instruction manual. The bacterial 16S rRNA gene V3-4 region was amplified by polymerase chain reaction (PCR) using the forward primer (5′-ACTCCTACGGGAGGCAGCA-3′) and the reverse primer (5′-GGACTACHVGGGTWTCTAAT-3′). PCR amplicons were purified with VAHTSTM DNA Clean Beads (Vazyme, Nanjing, CN) and quantified individually using the PicoGreen dsDNA Assay Kit (Invitrogen, Carlsbad, CA, USA). Then, amplicons were pooled in equal amounts, and paired-end 2 × 300 bp sequencing was performed on the Illumina MiSeq platform, as described by Yang et al. [
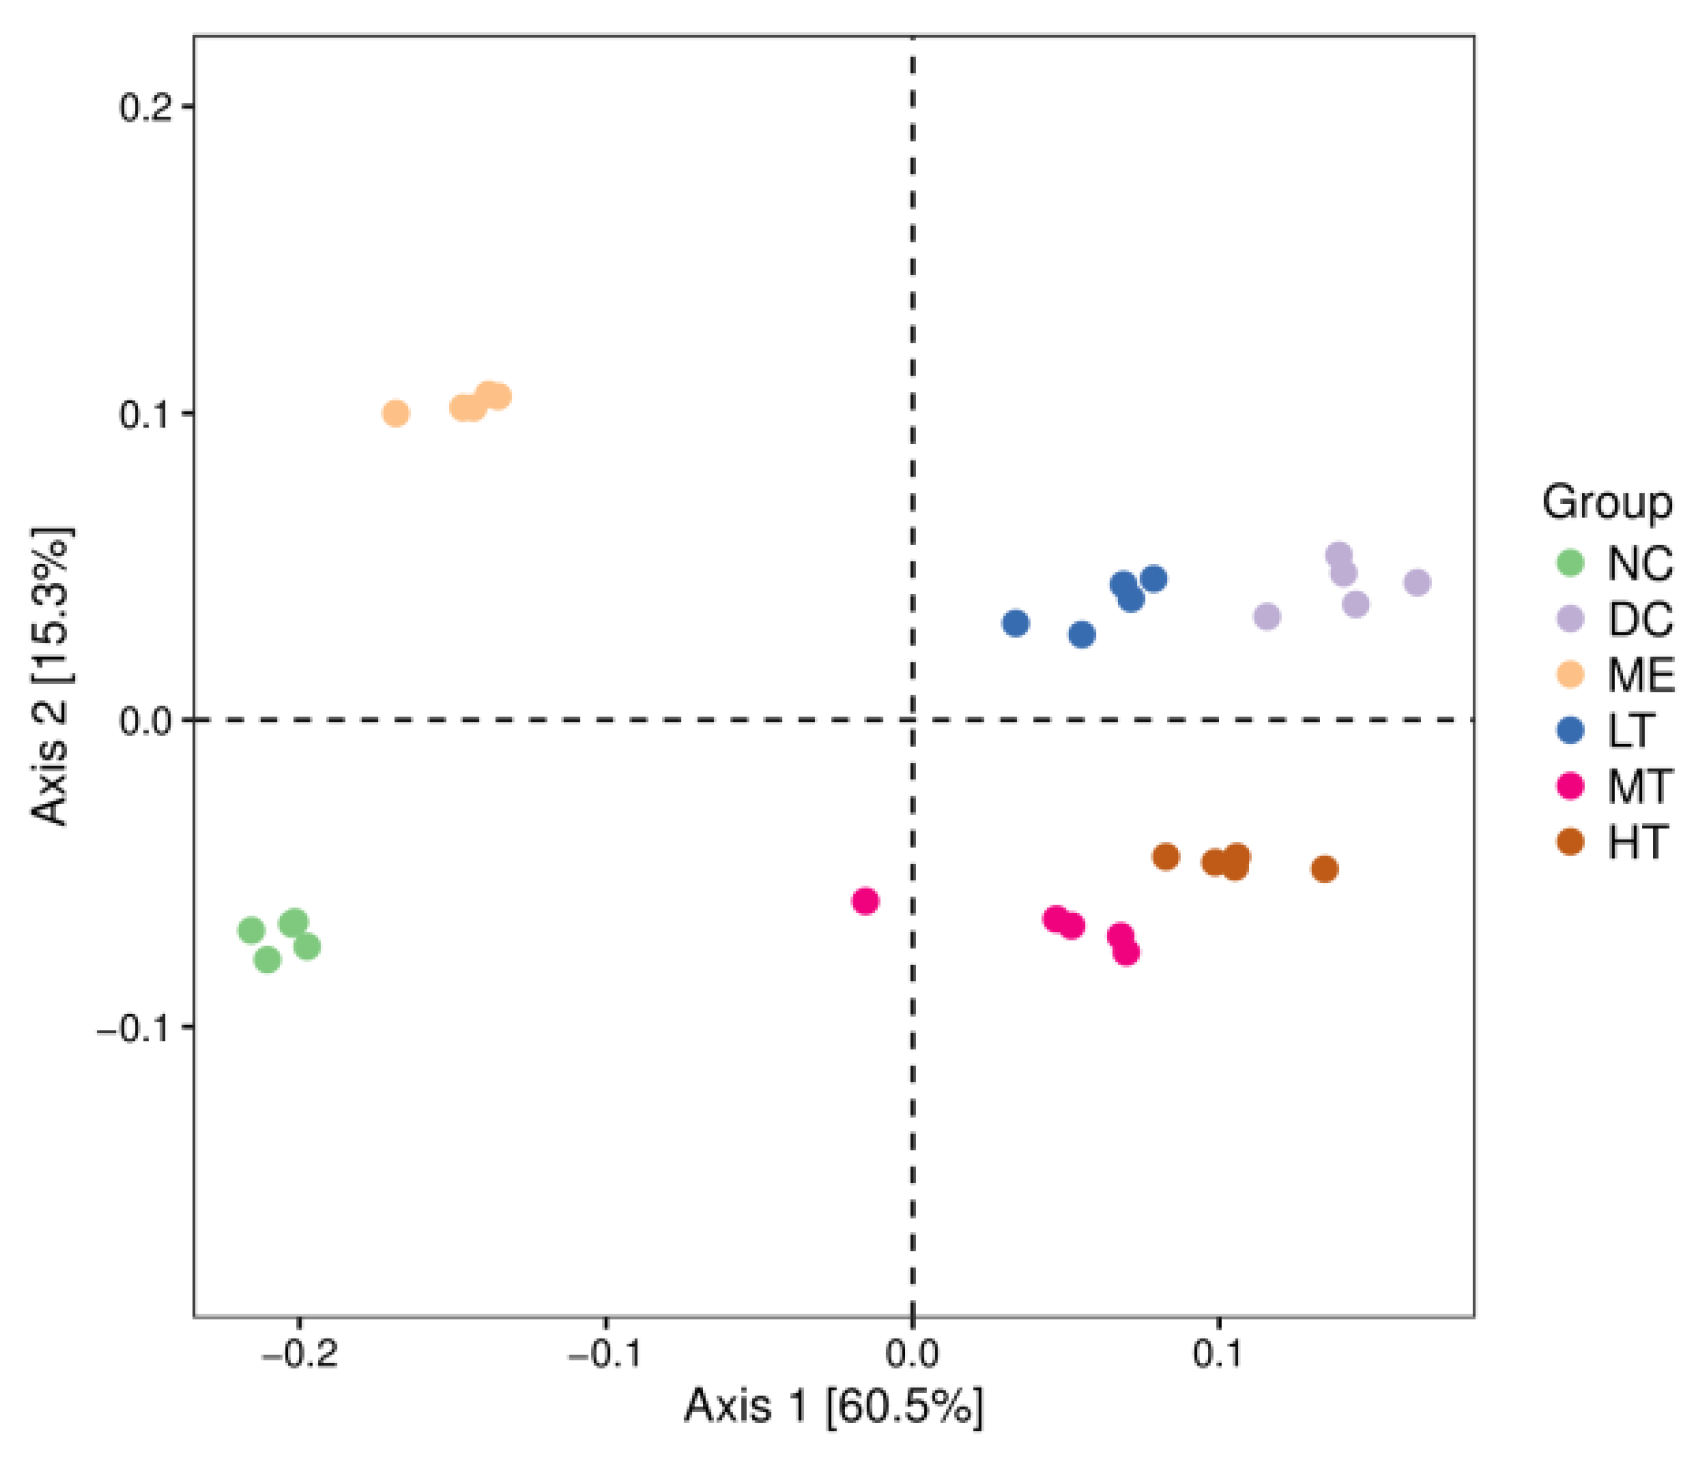
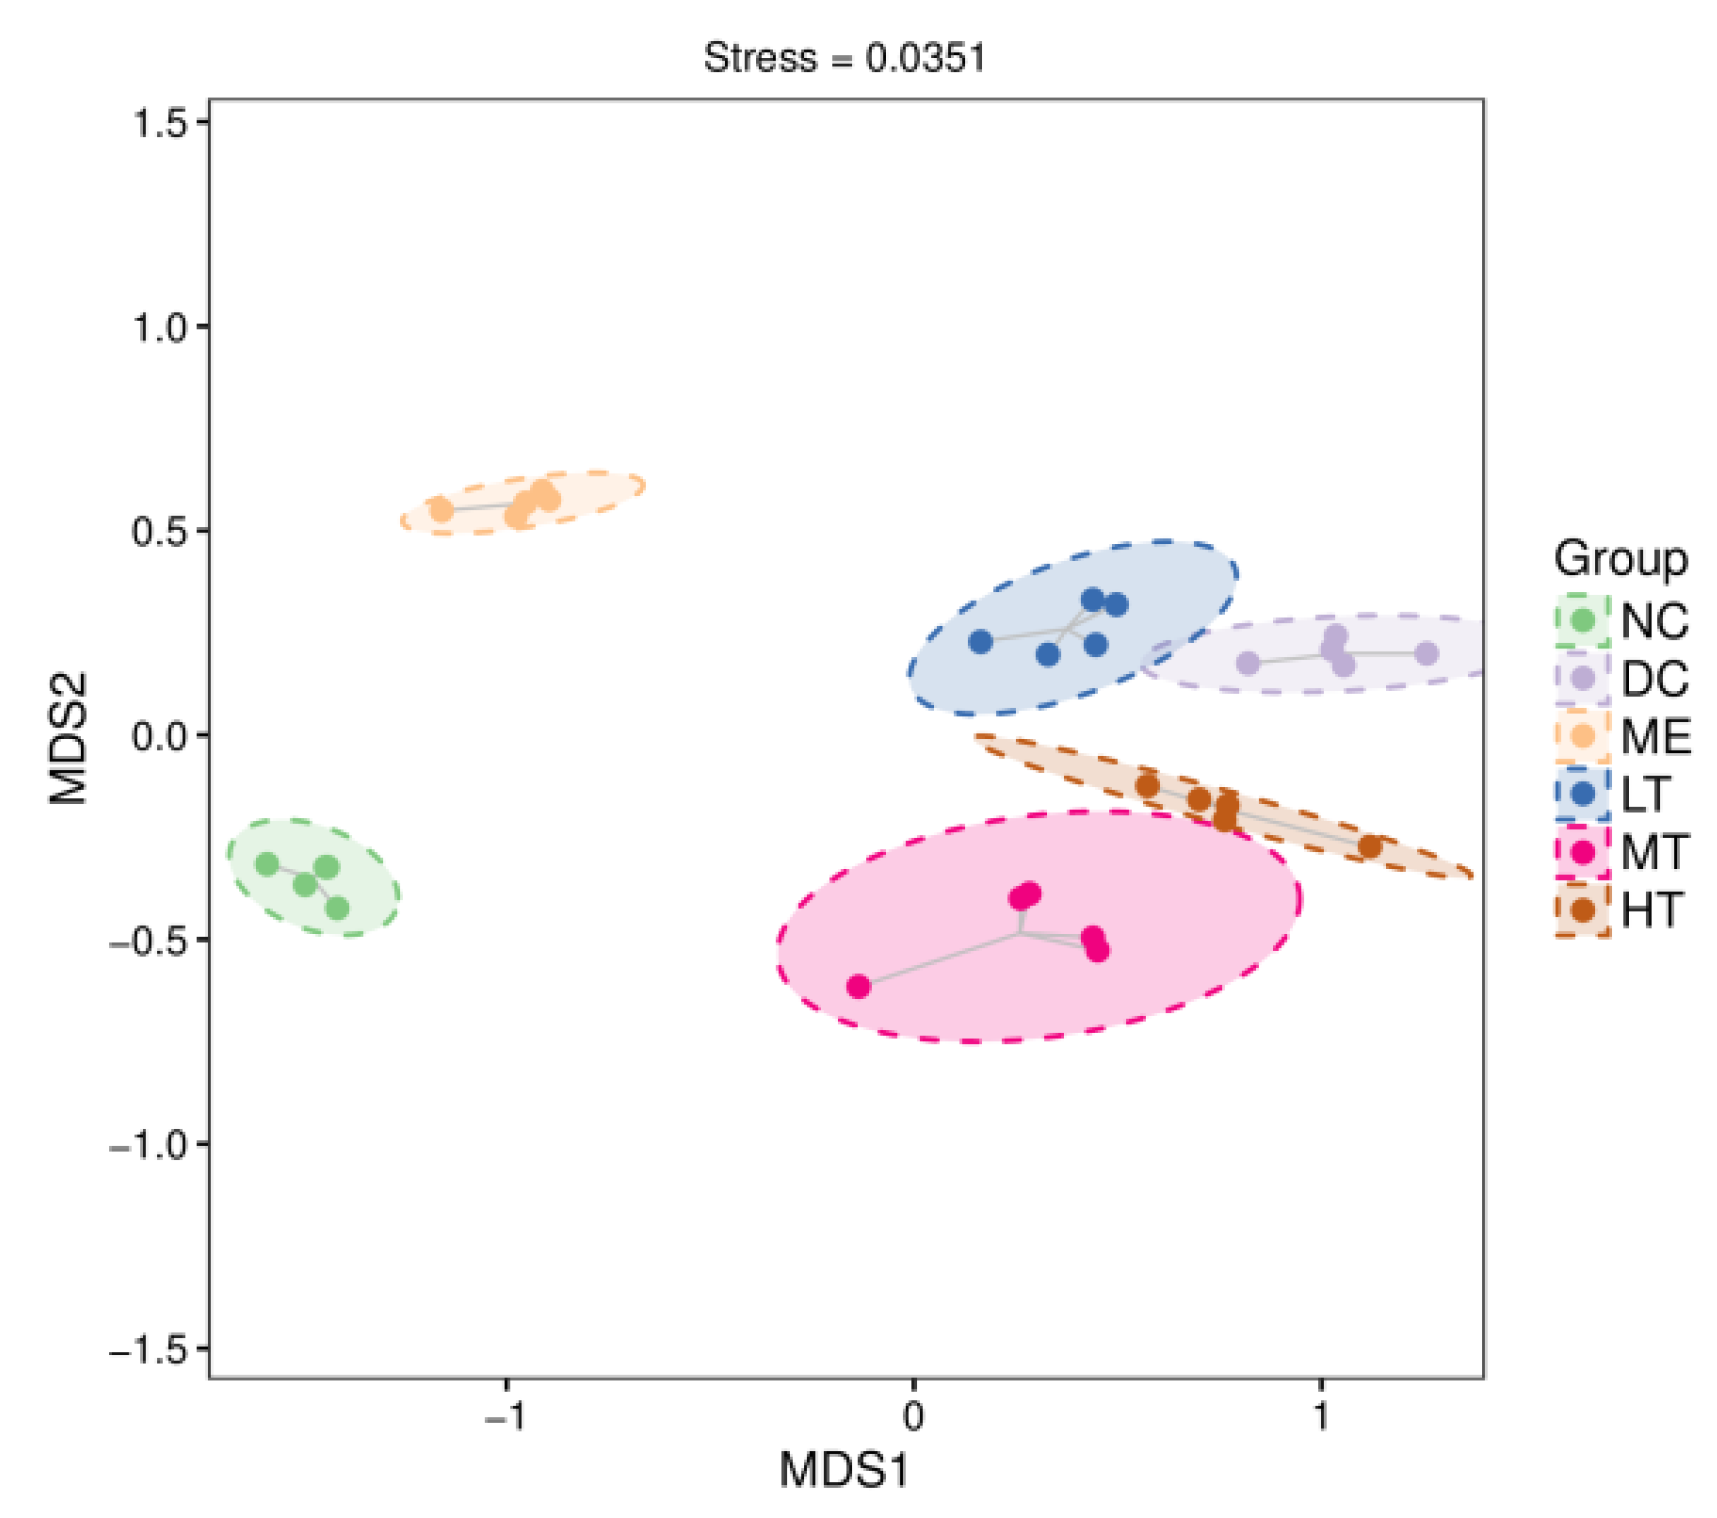
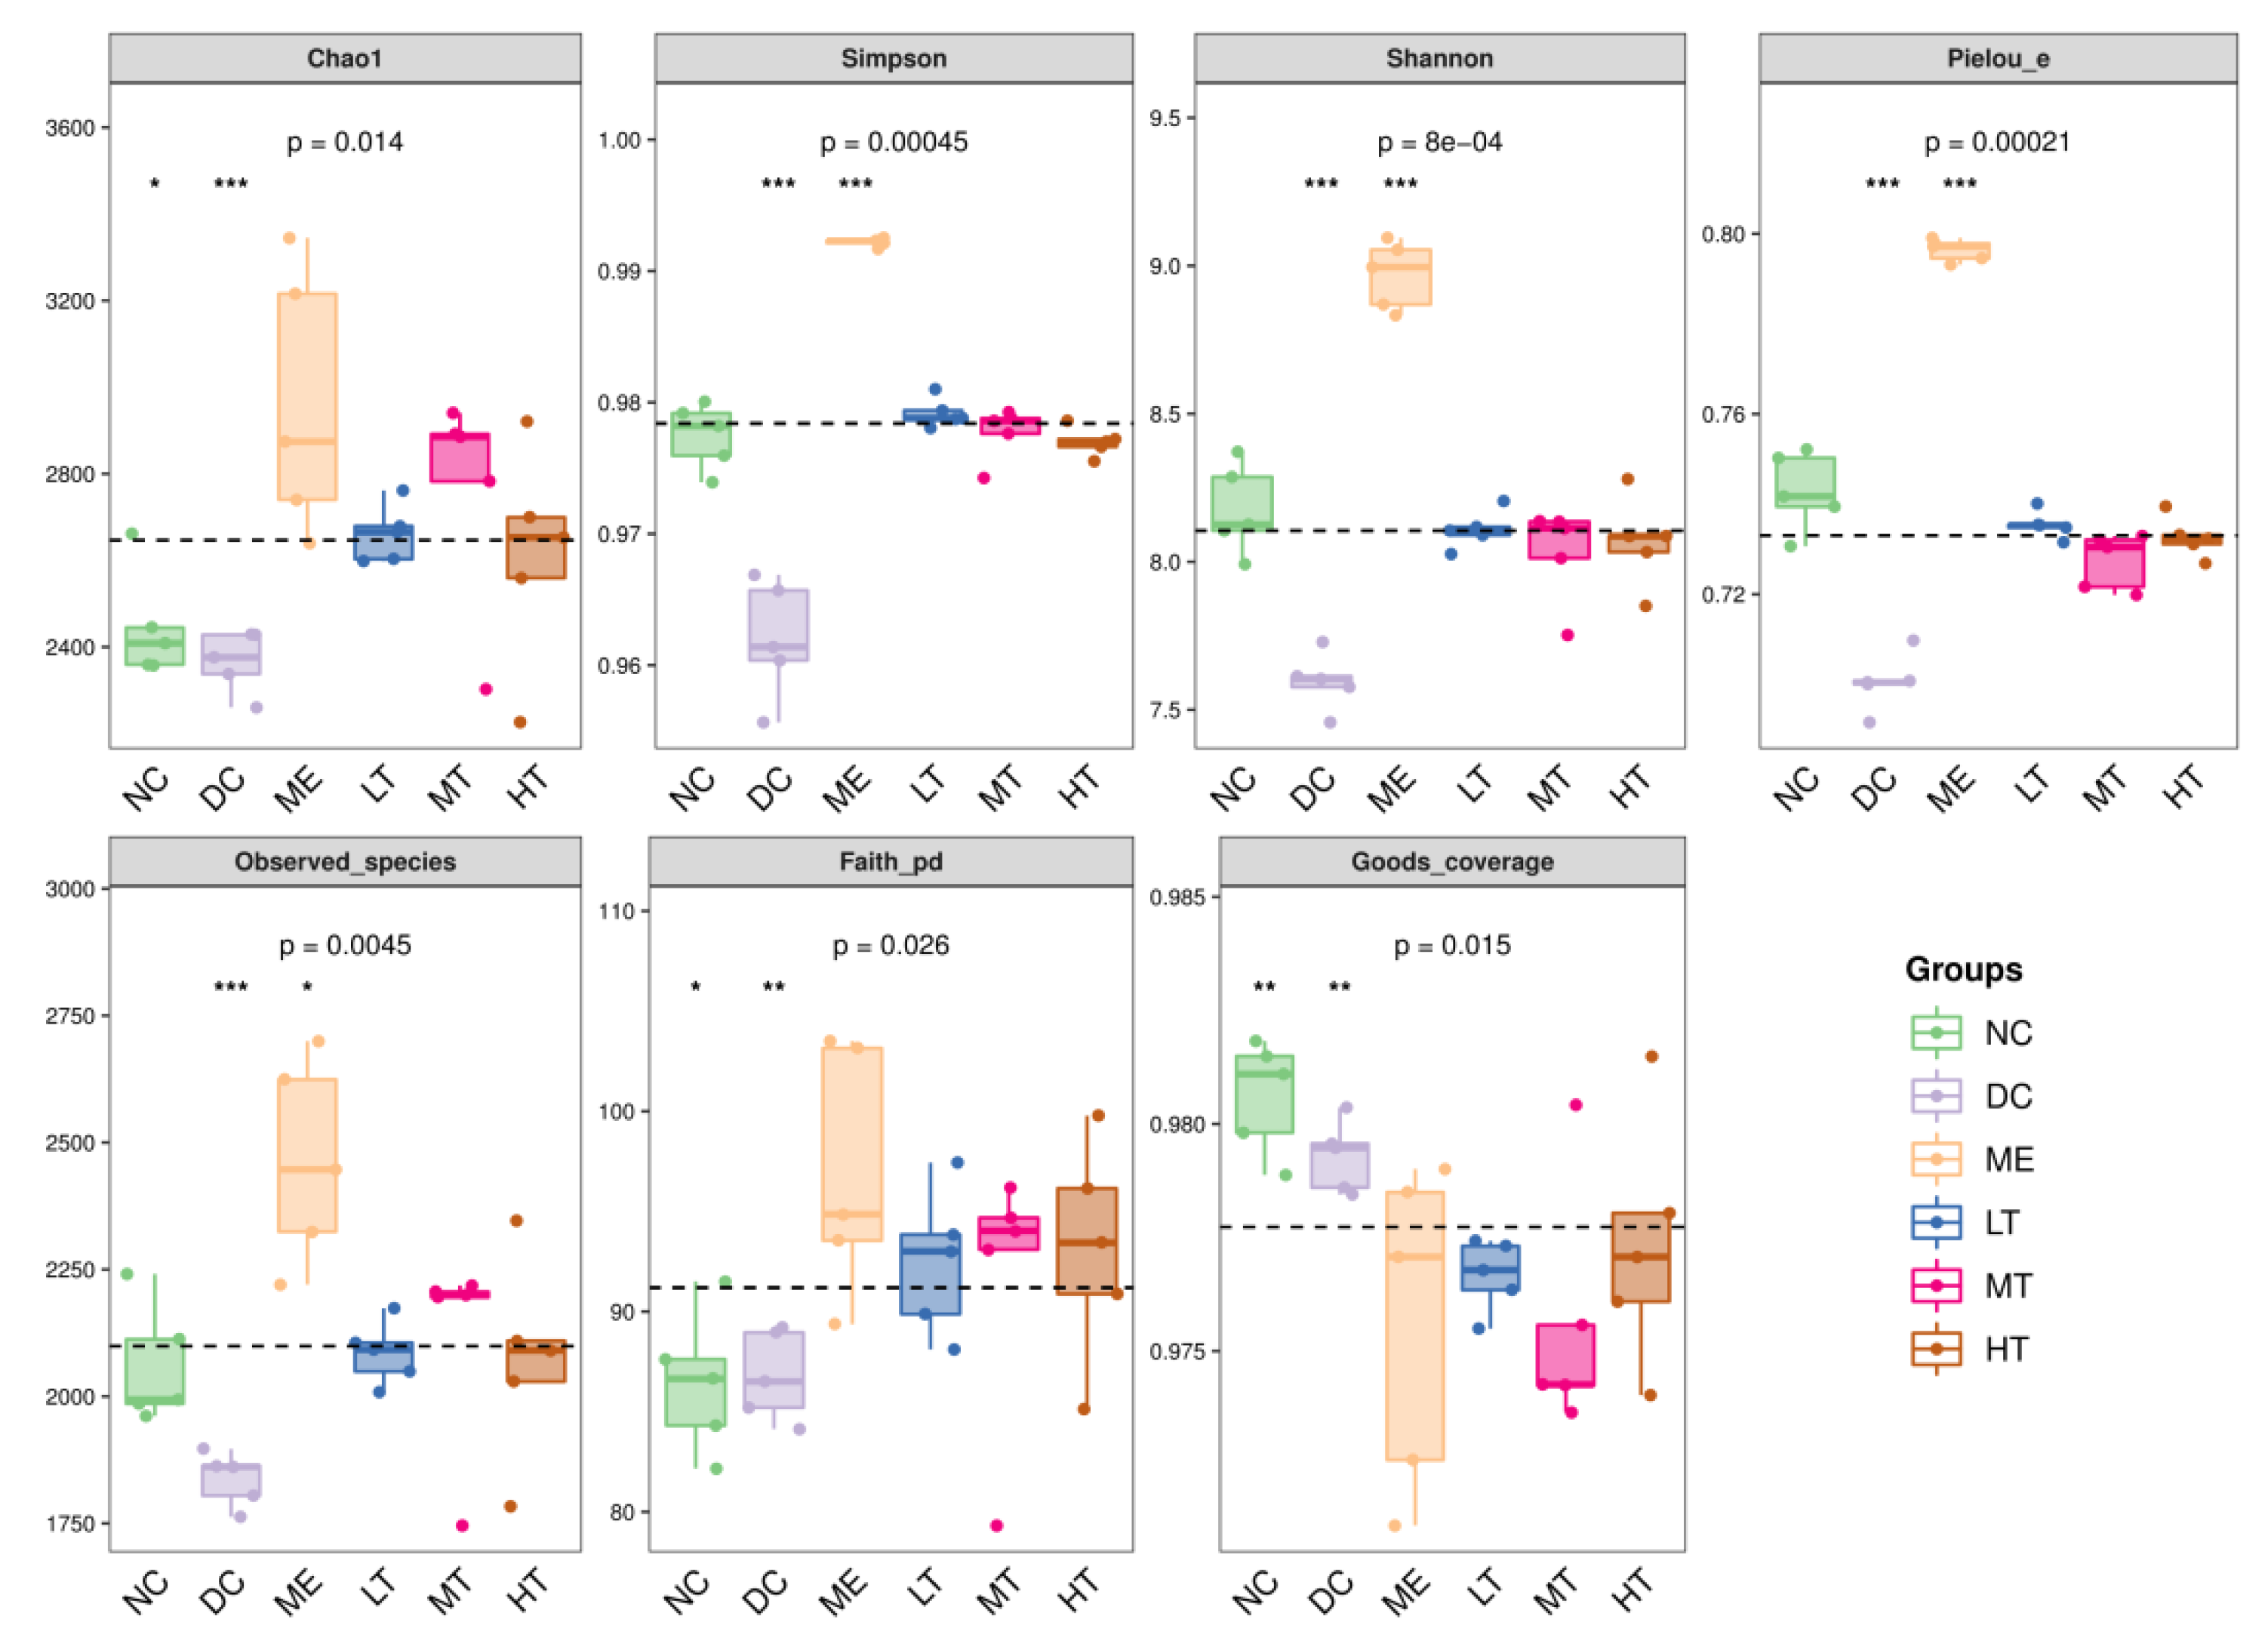
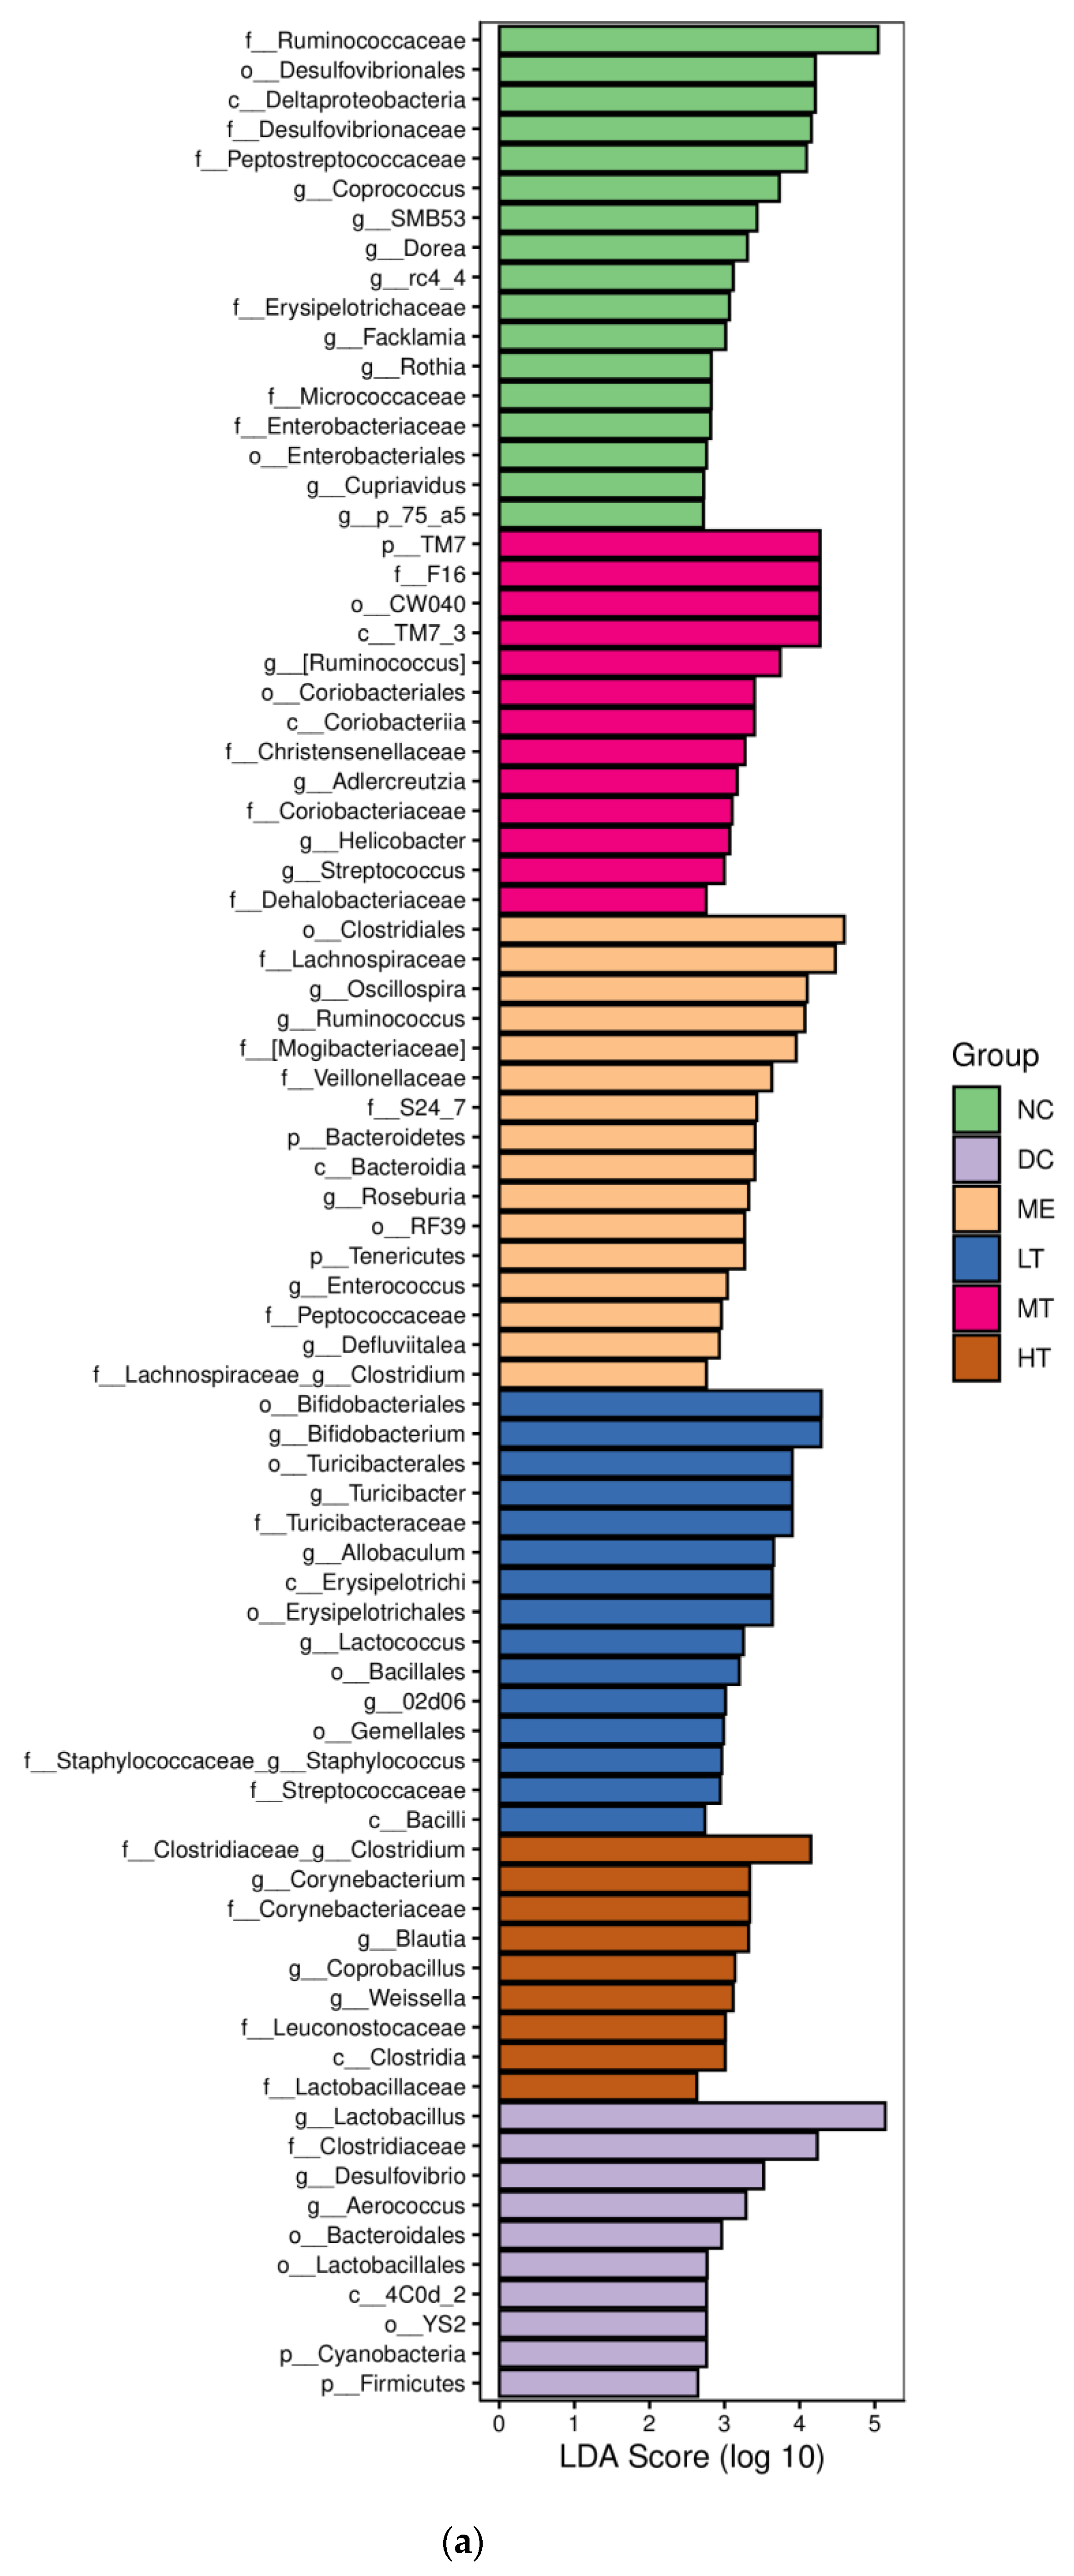
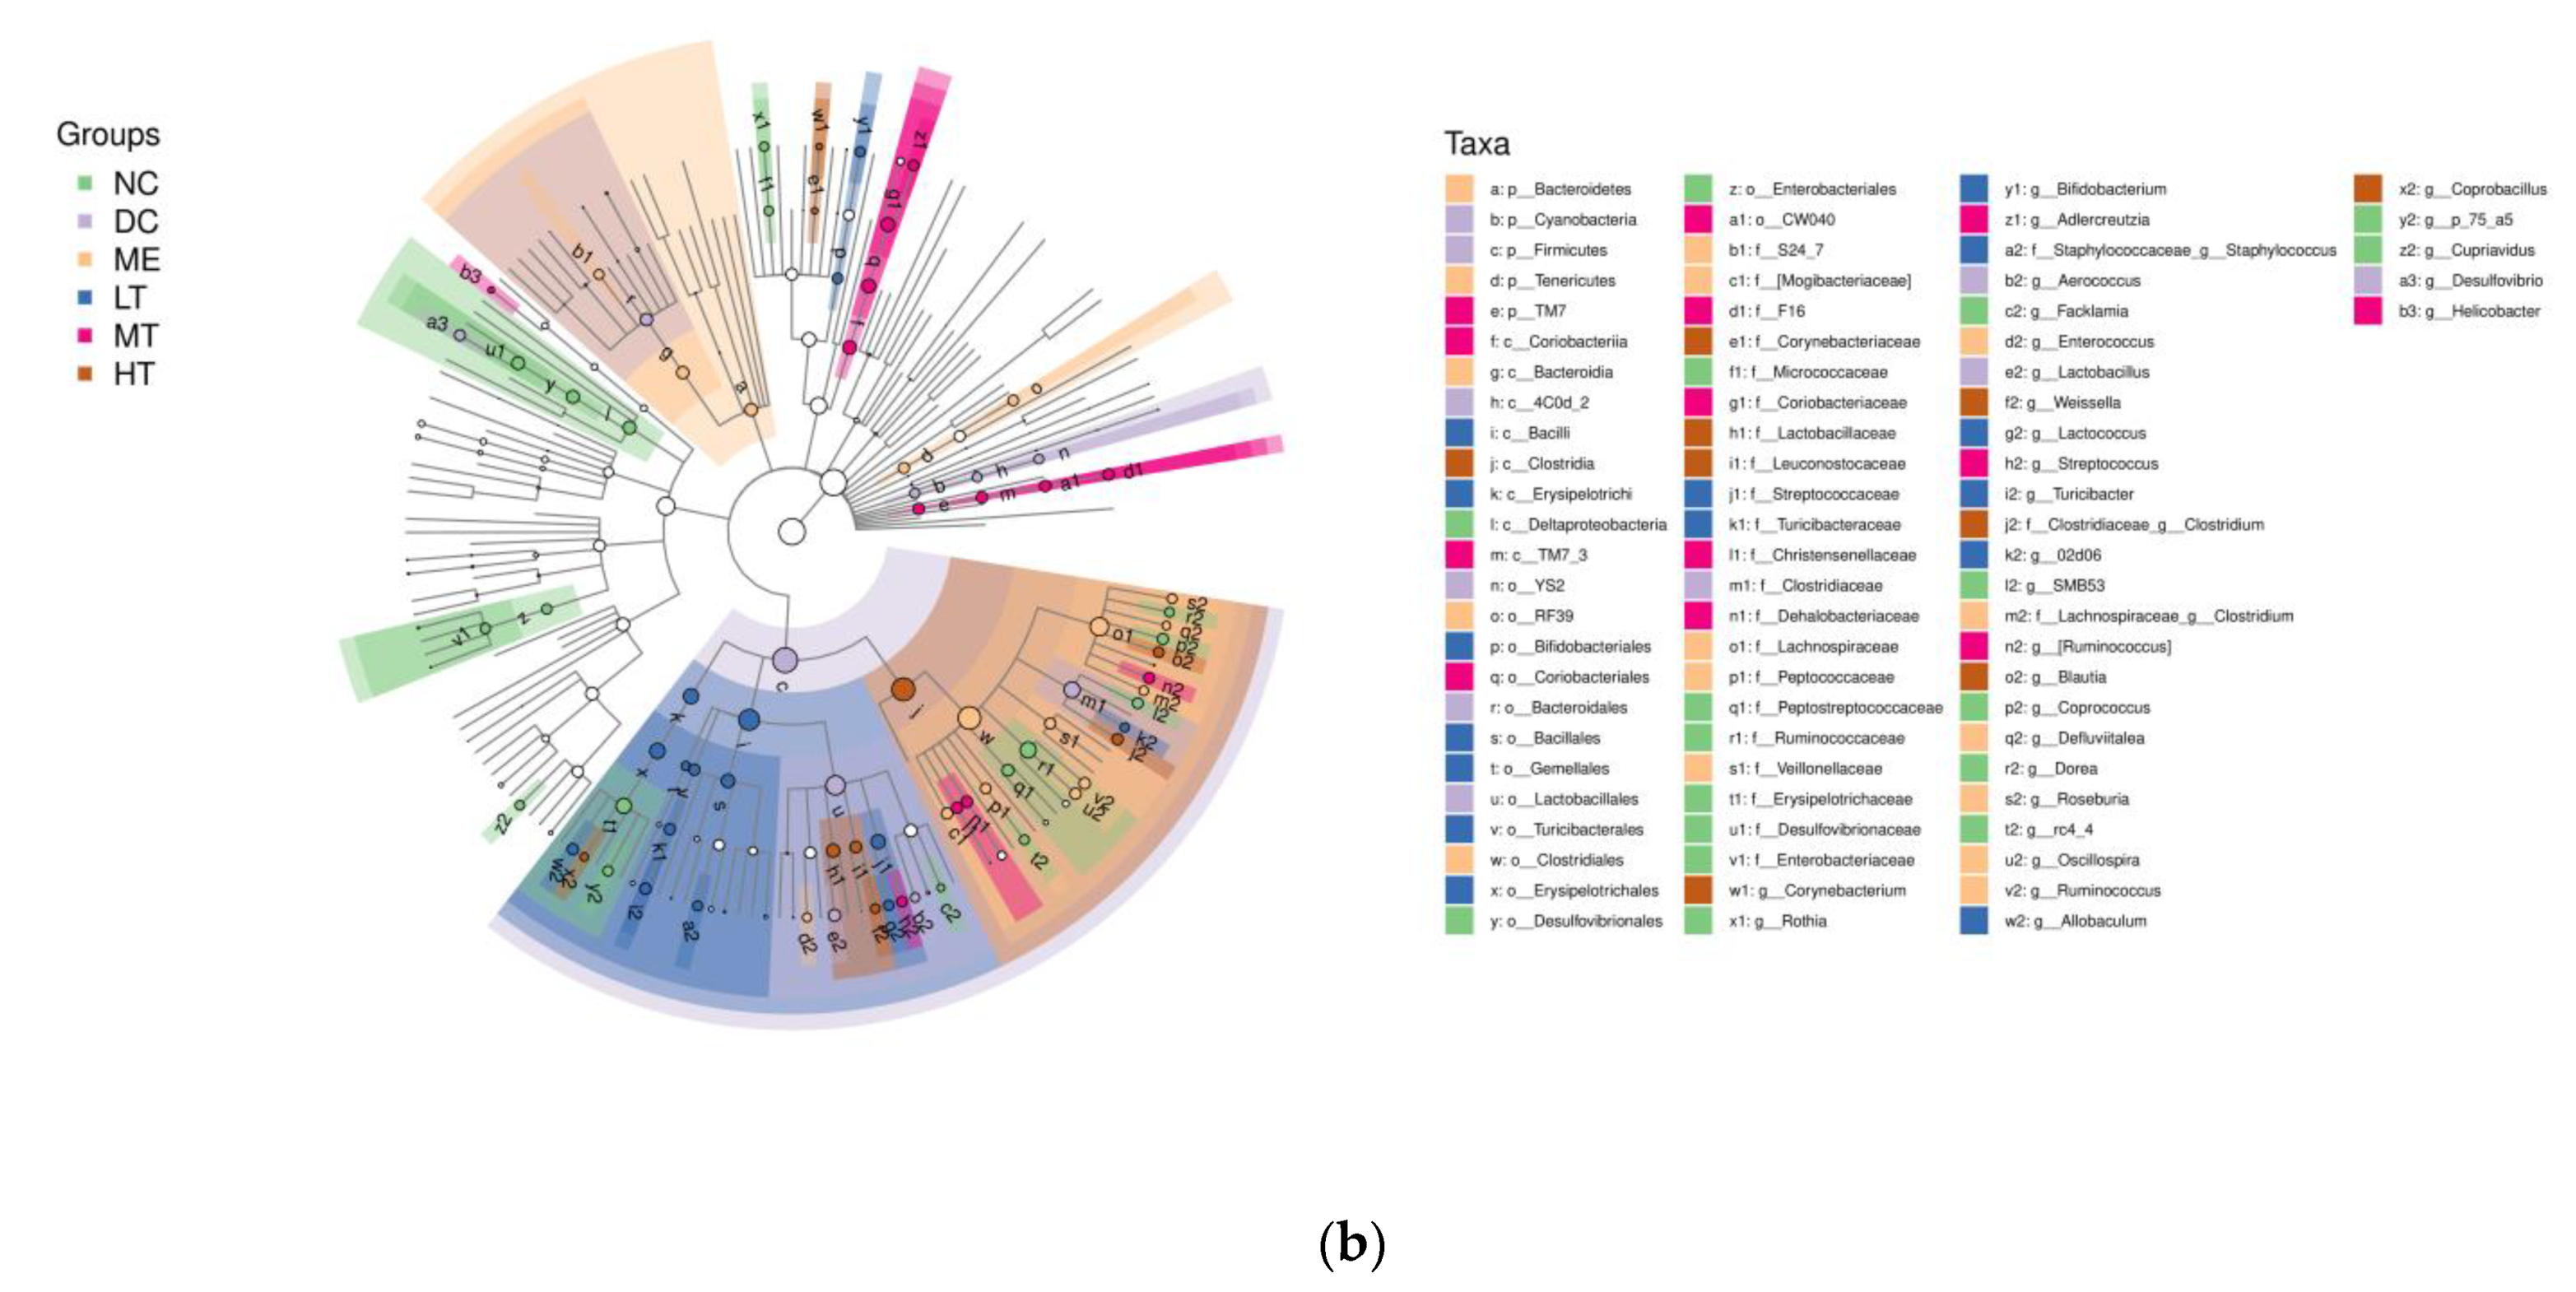
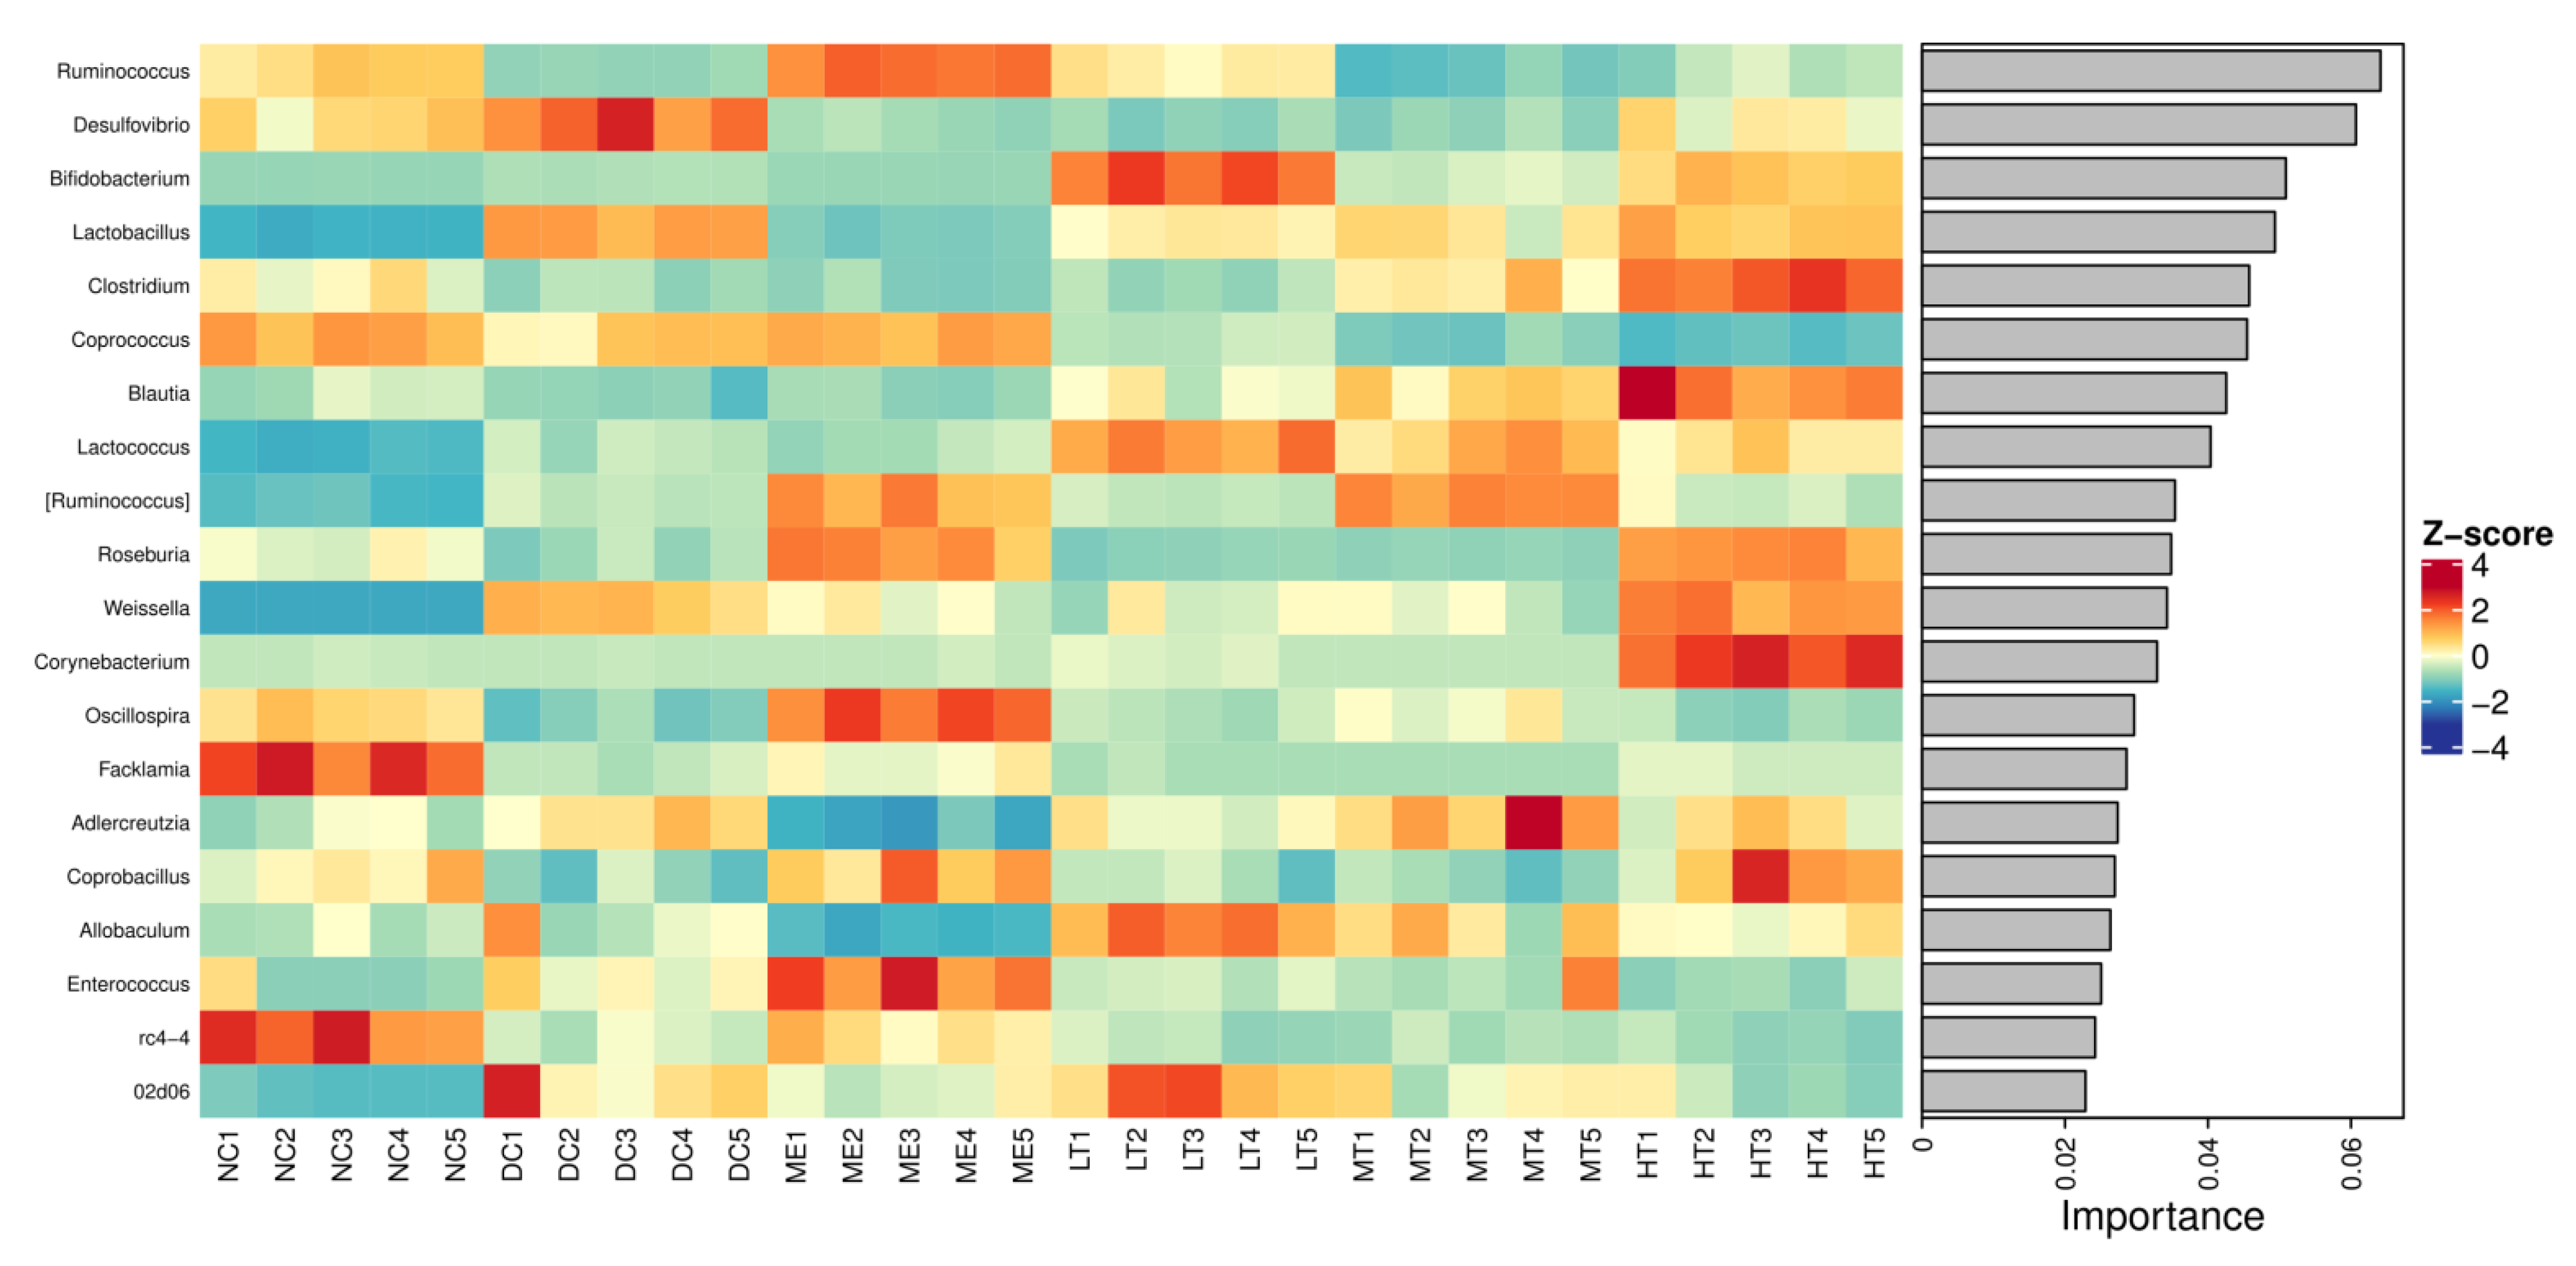
29]. The sequencing data and predicted functional data were obtained by QIIME2 (2019.4) and PICRUSt2. The following statistics were performed by R software. α-Diversity evaluation was calculated by Chao1, observed species, Simpson, Shannon, Faith’s PD, Pielou’s evenness, and Good’s coverage index. β-Diversity evaluation was assessed with UniFrac distance-based principal coordinate analysis (PCoA) and nonmetric multidimensional scaling (NMDS). Linear discriminant analysis with effect size (LEfSe), heatmaps, and random forest classifier was applied to identify specific taxa of microbes among groups using the default parameters [
30,
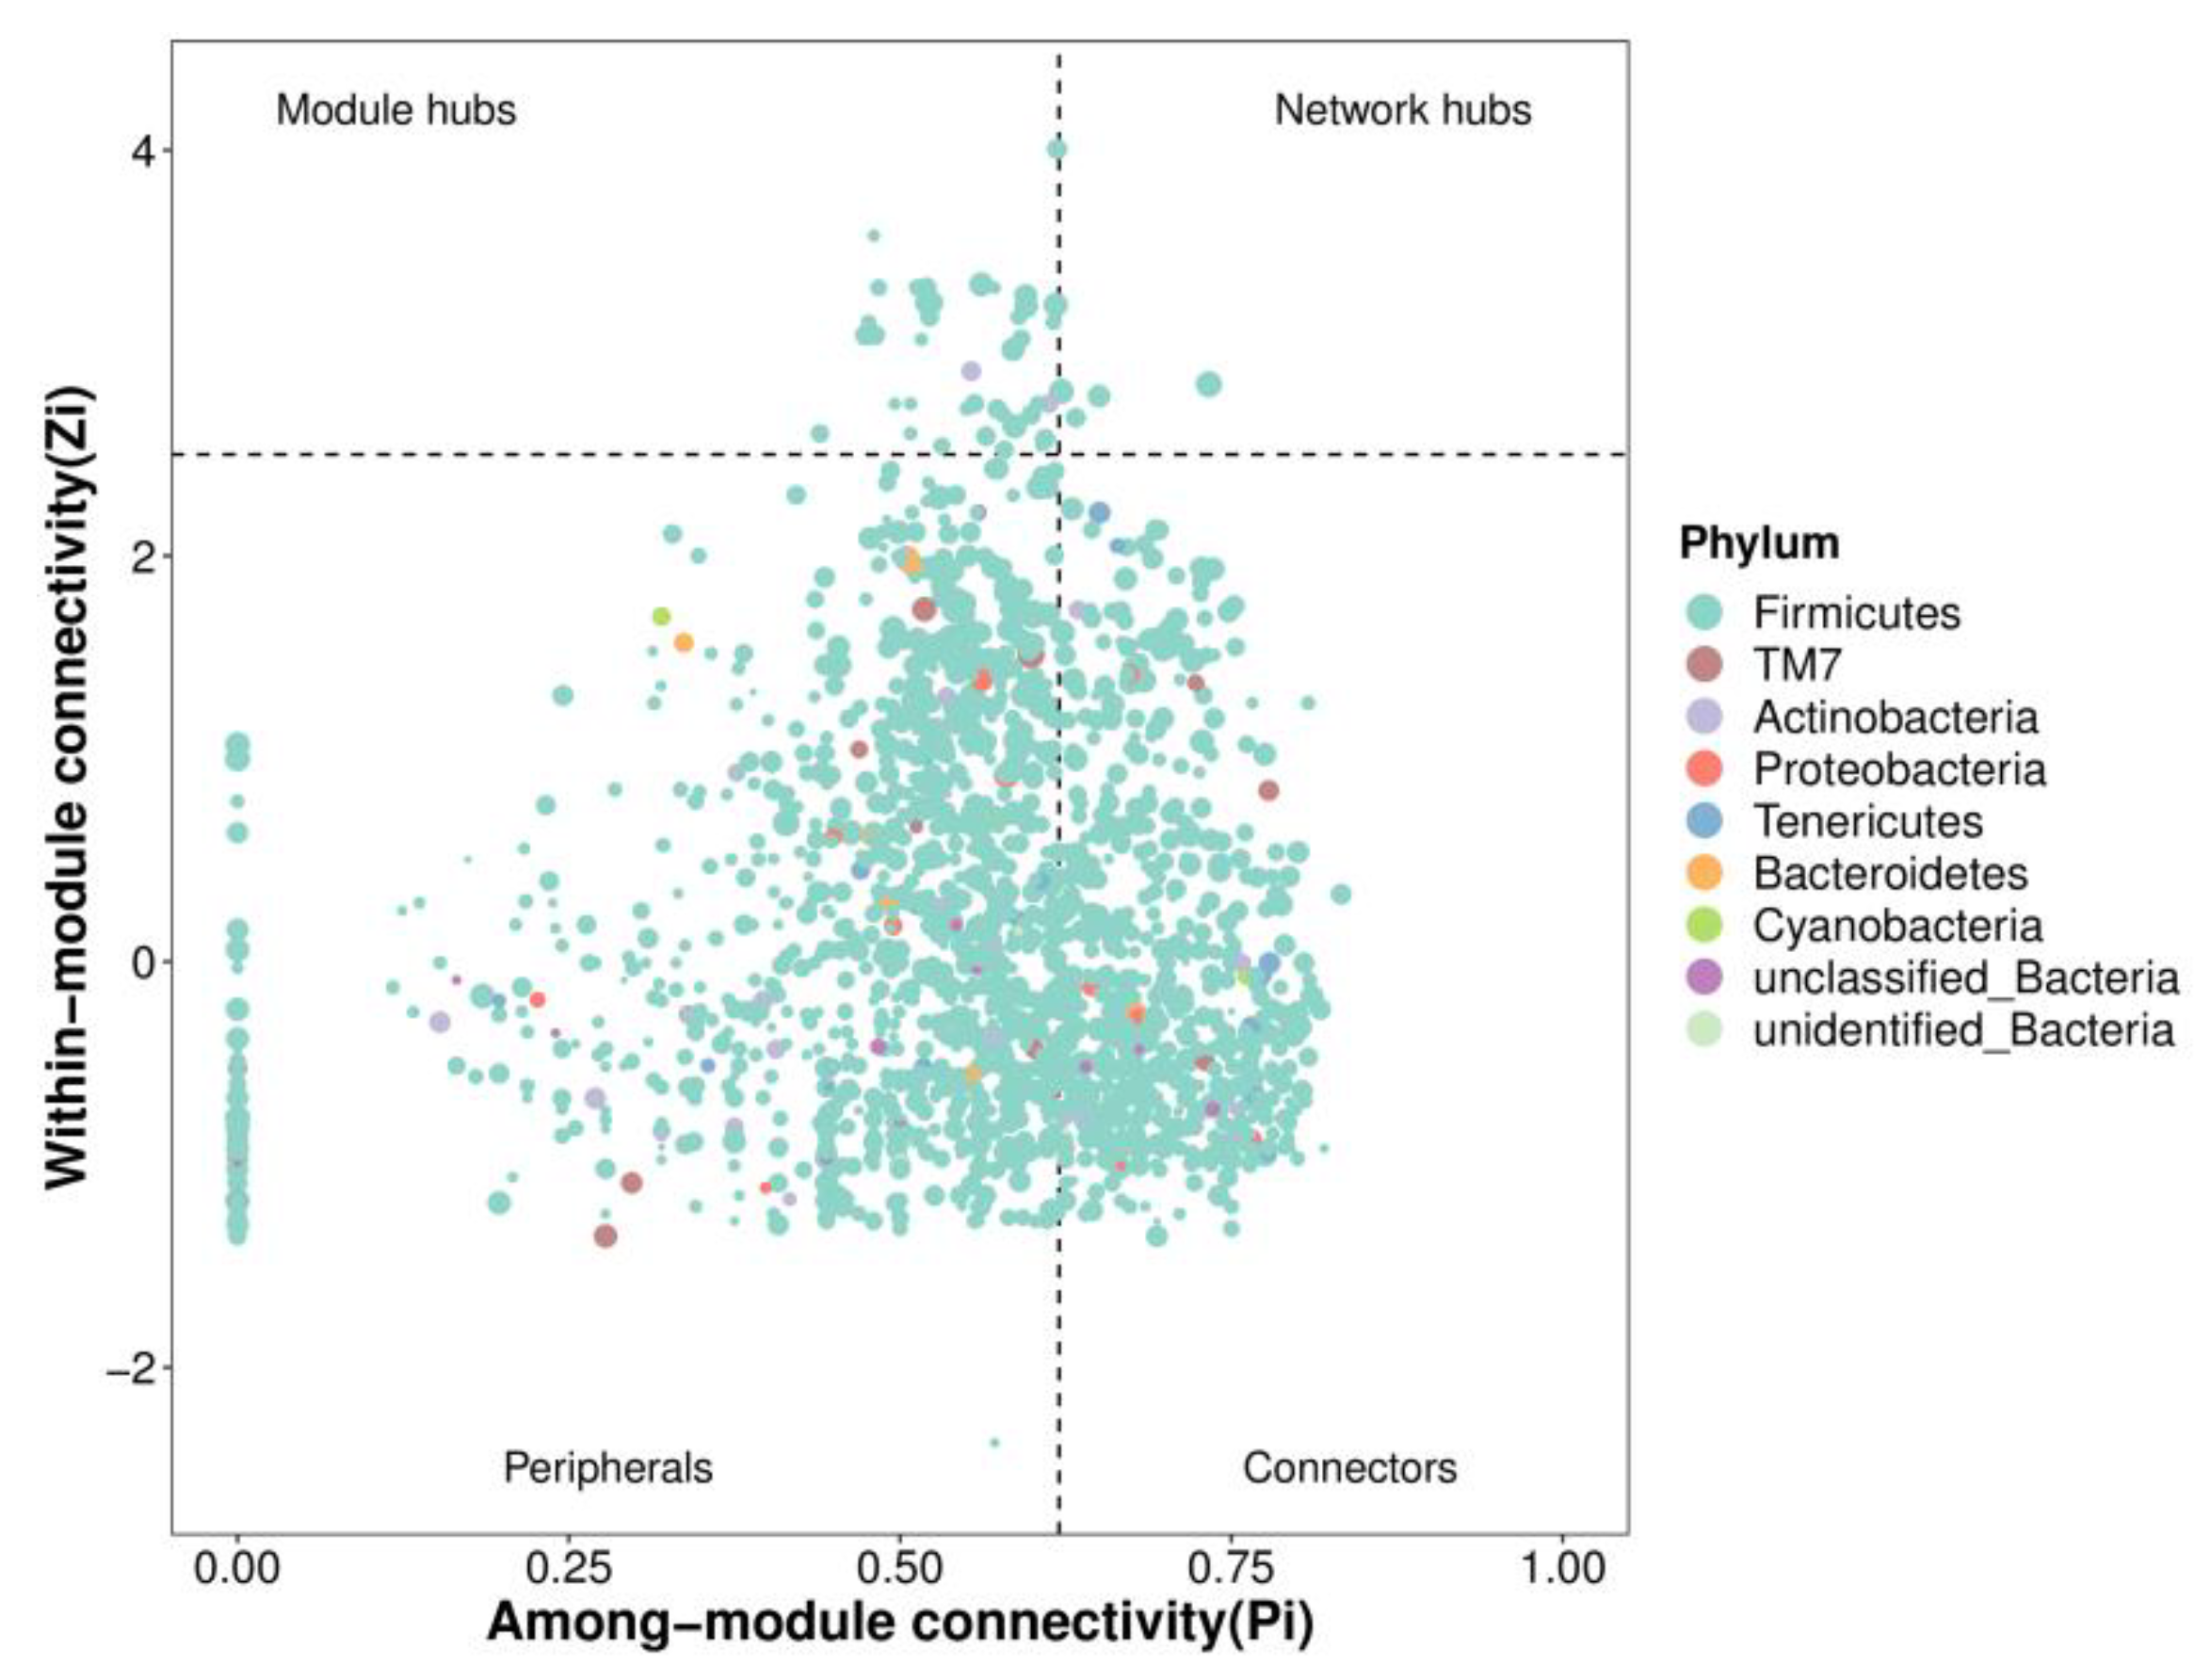
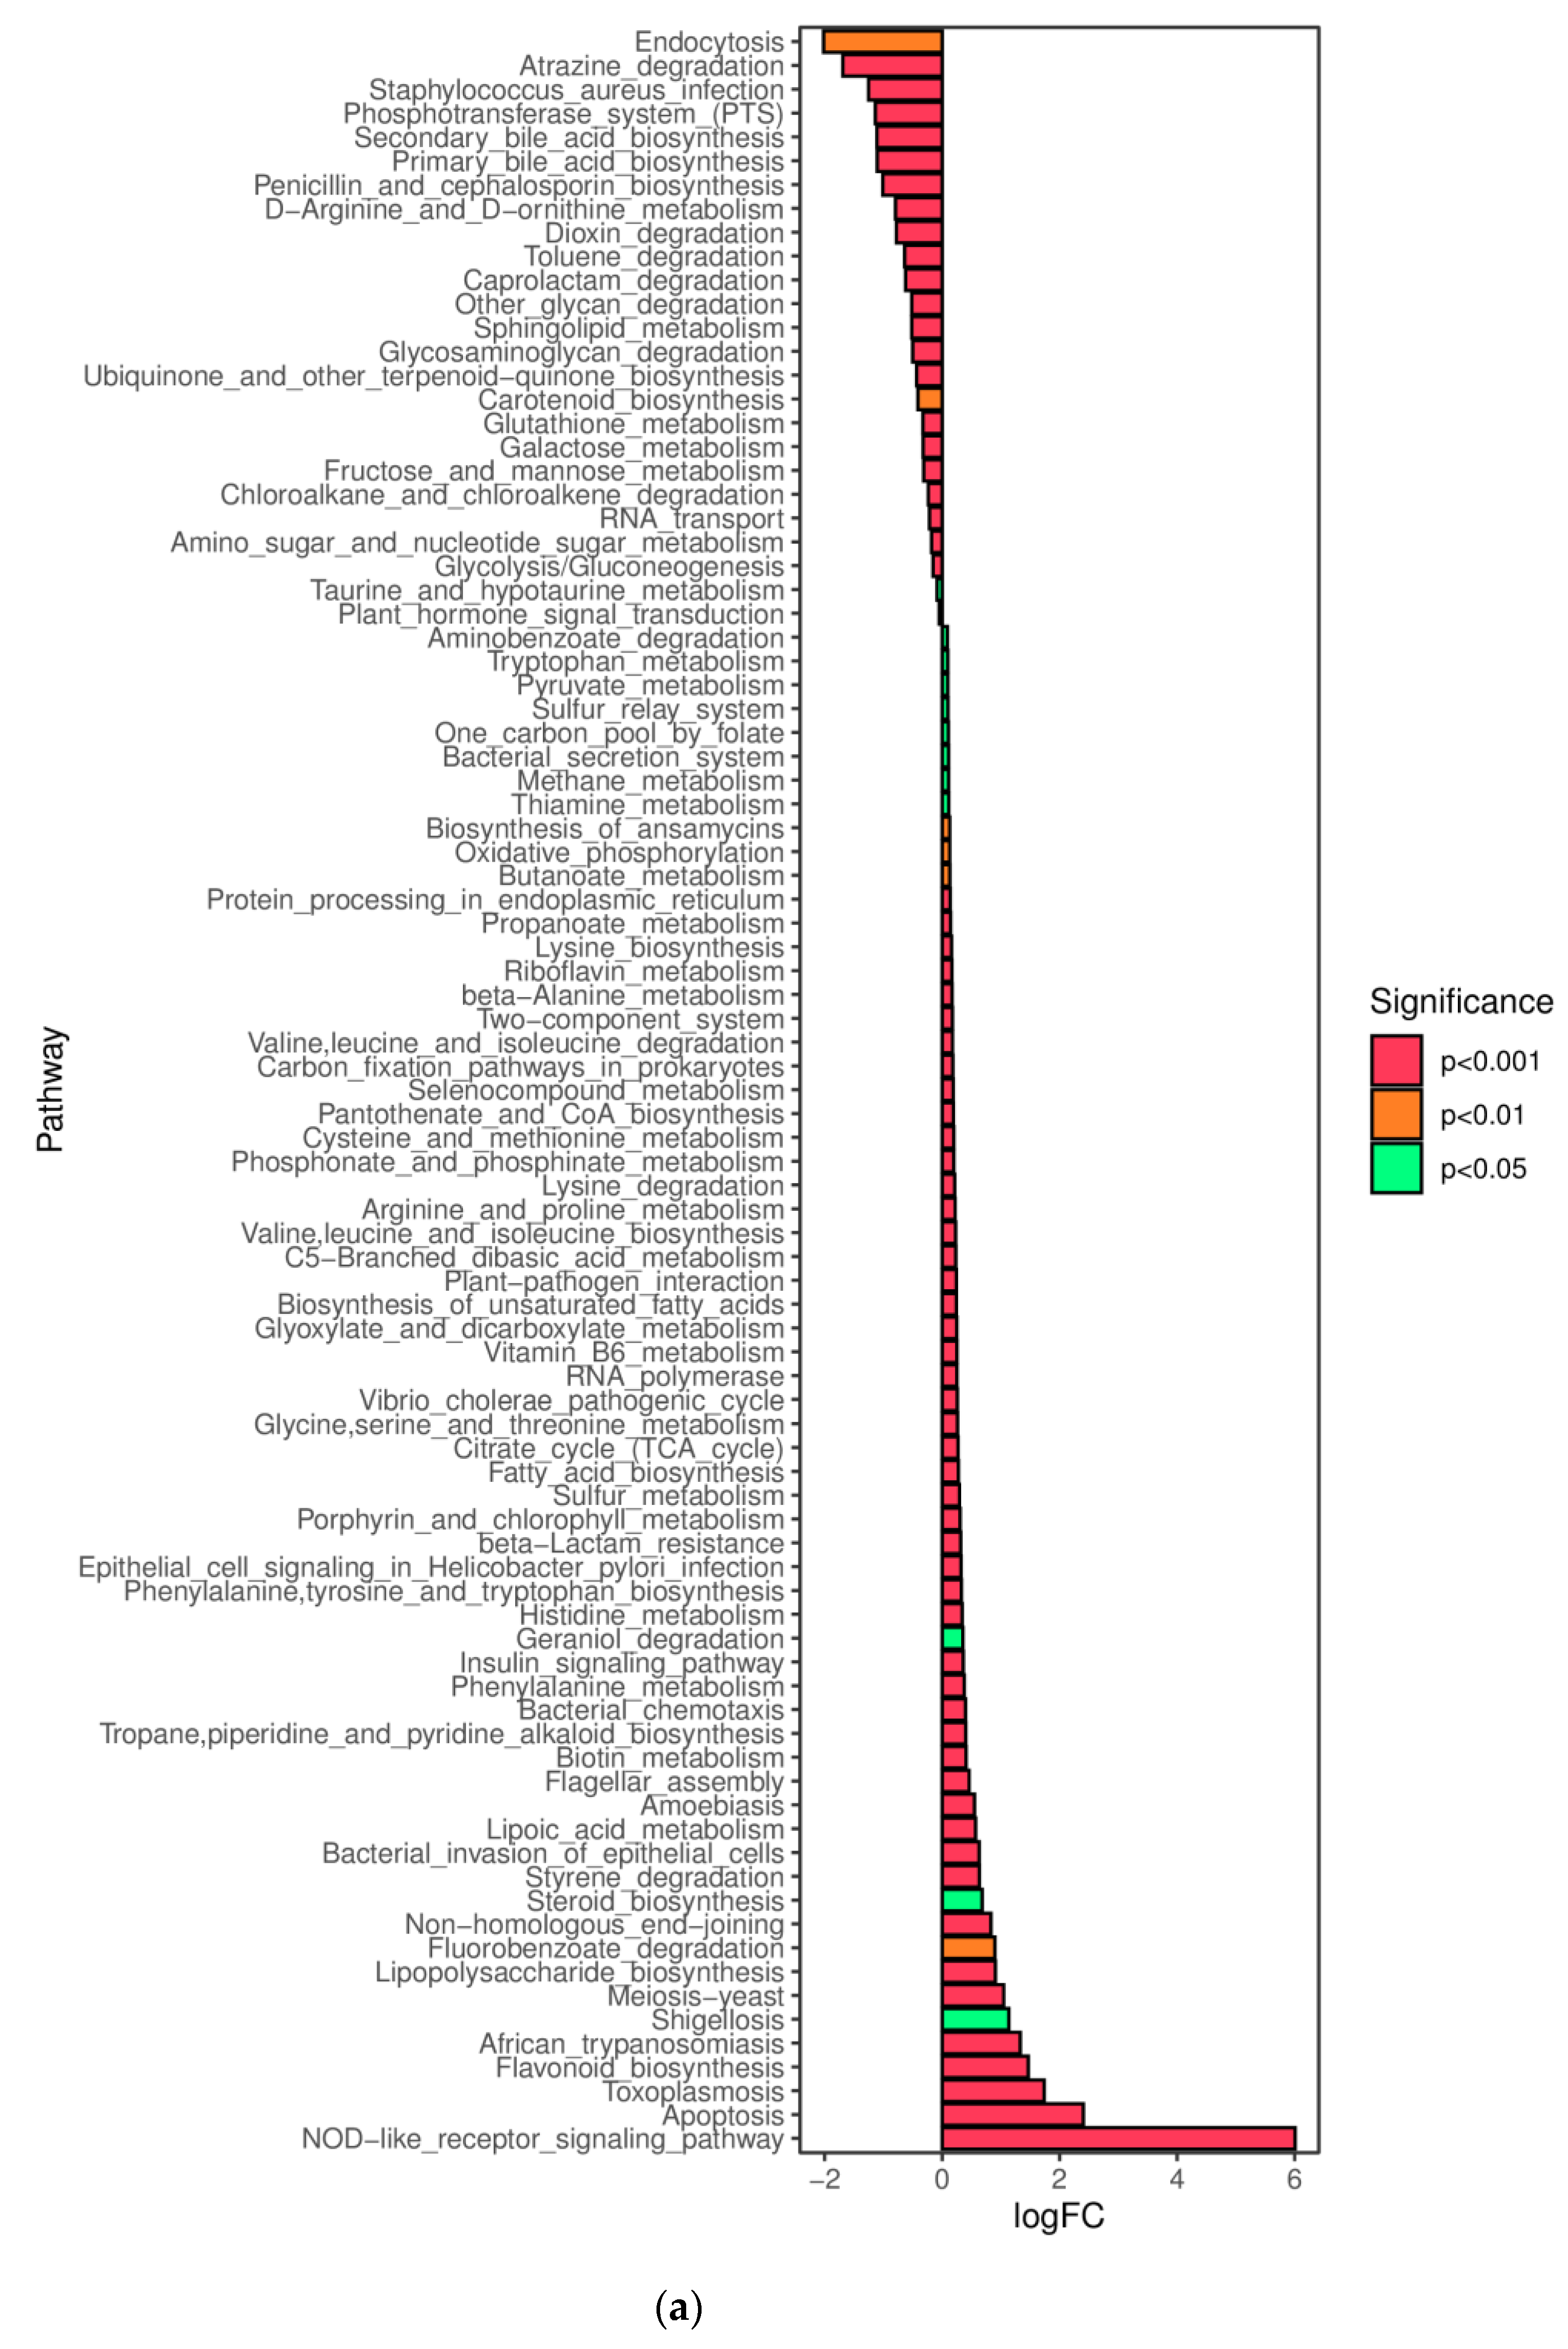
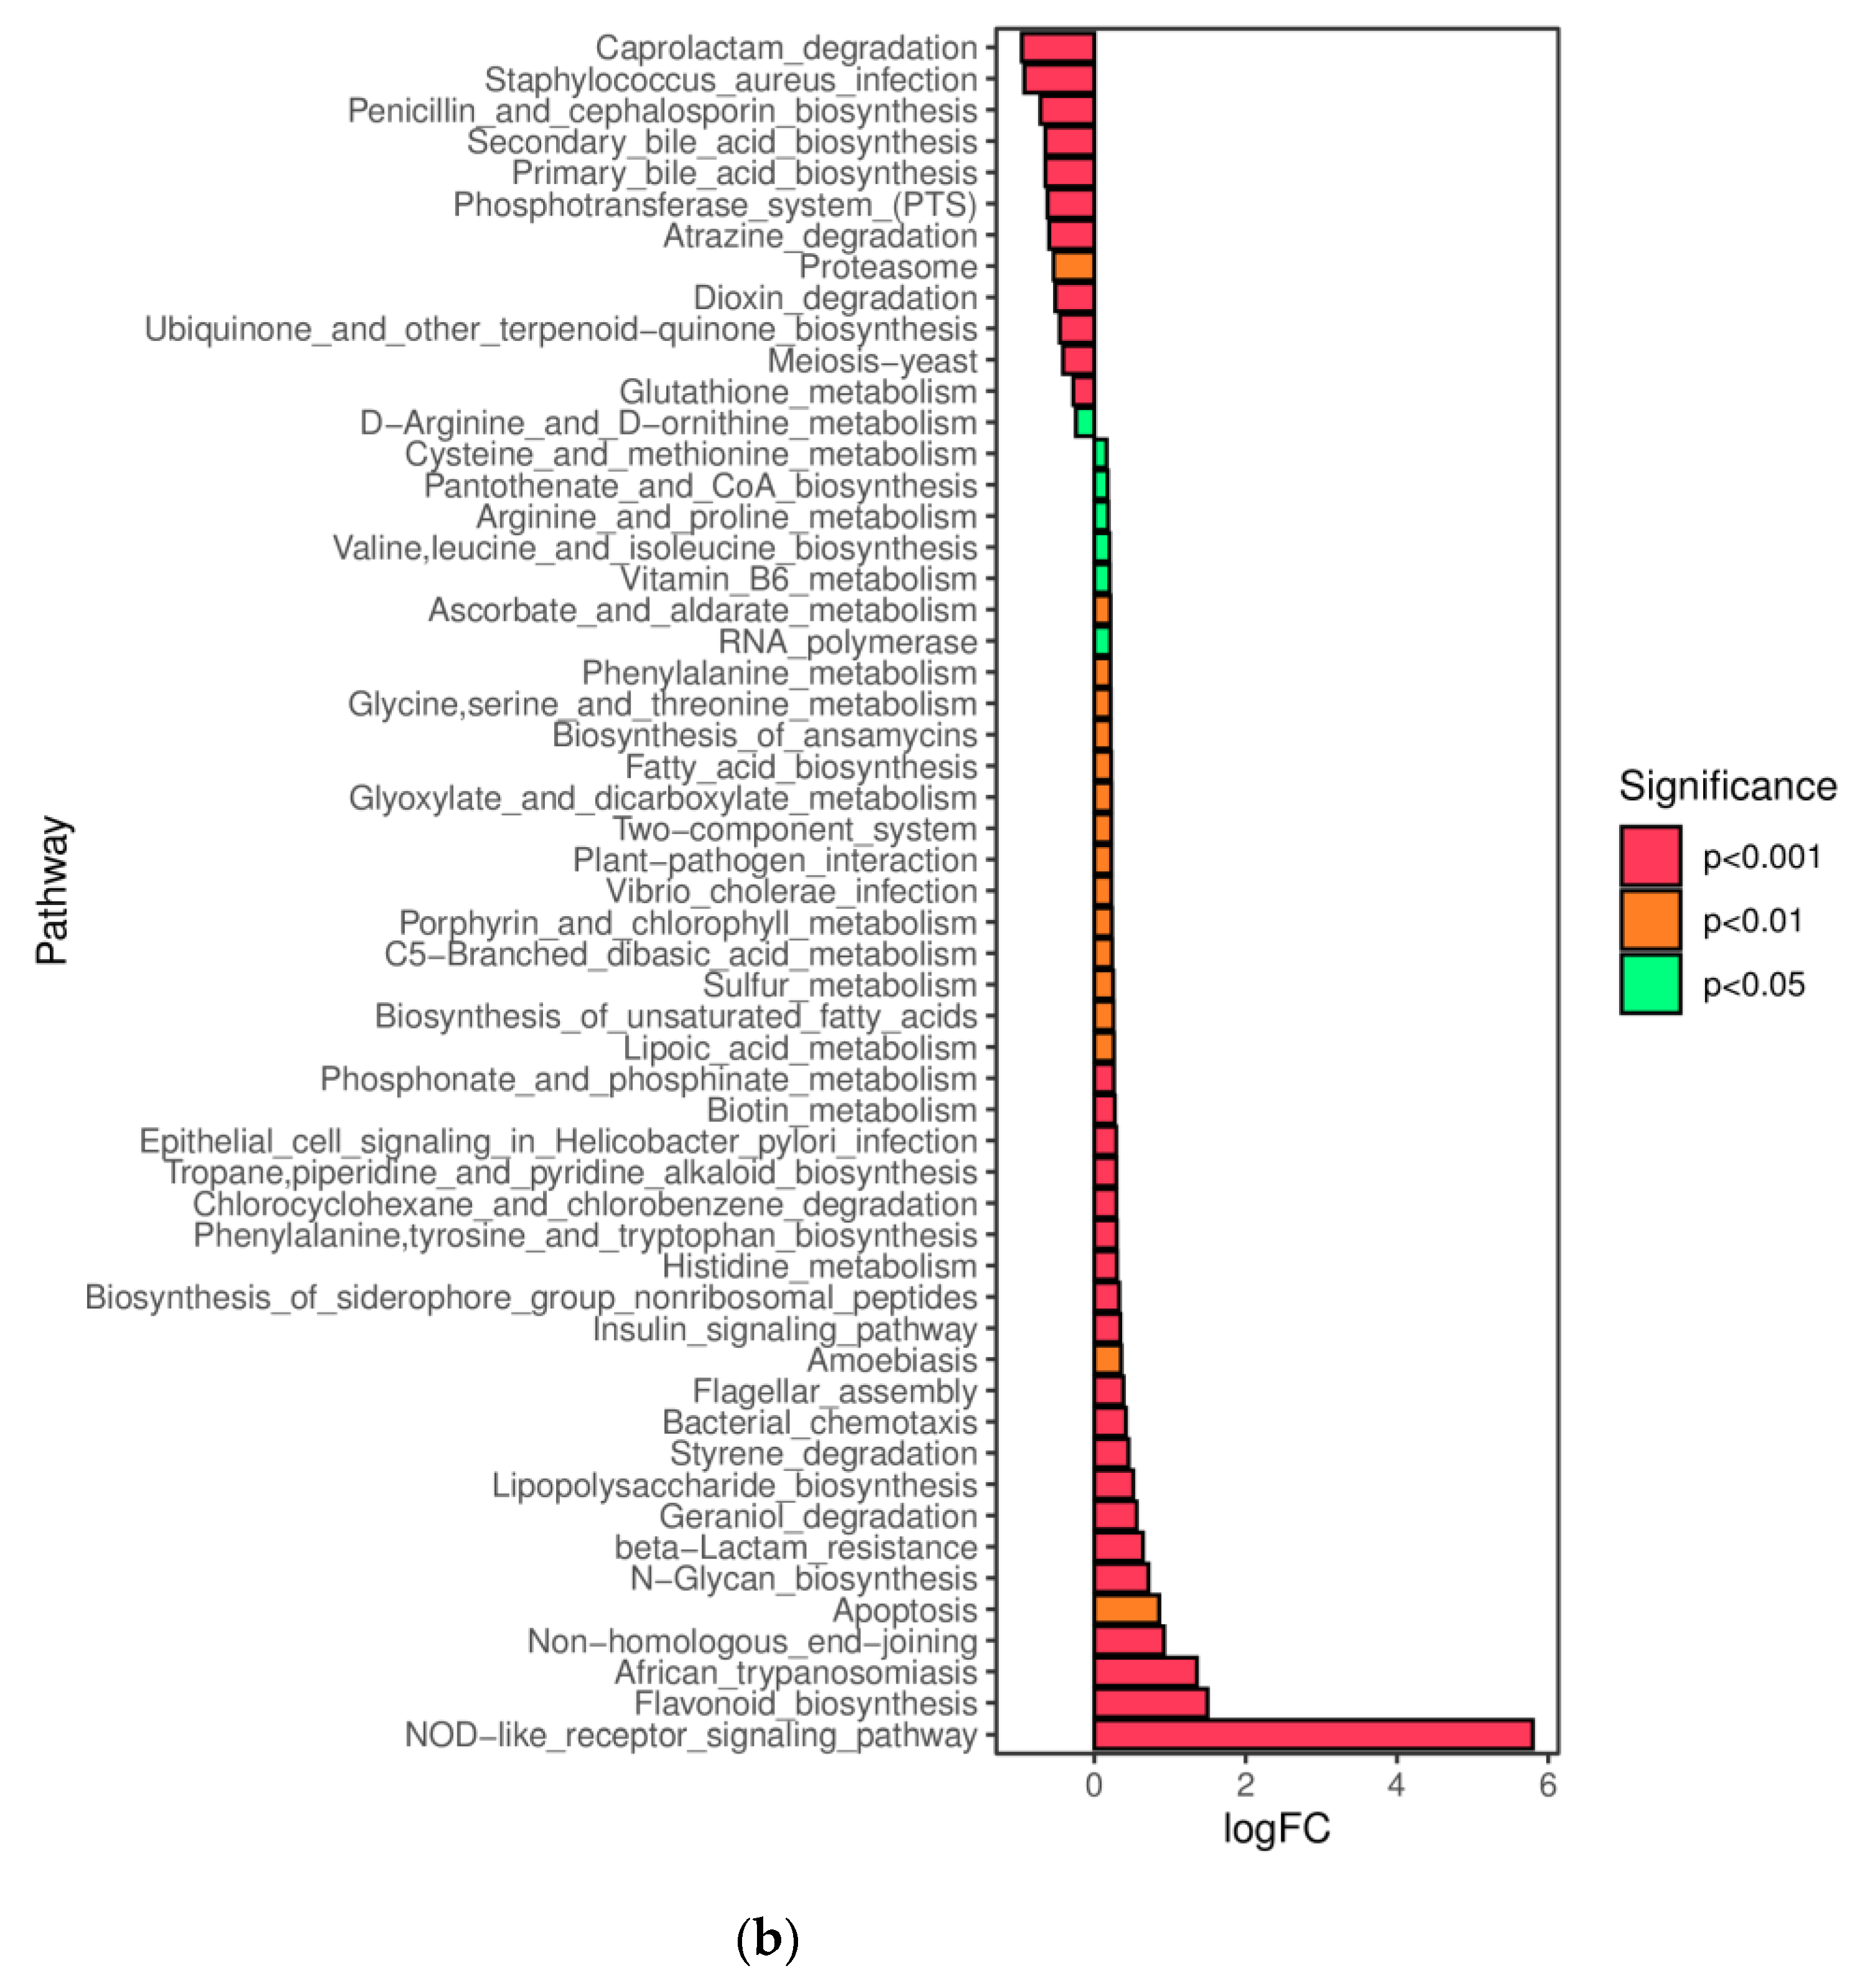
31]. Zi (within-module connectivity) and Pi (among-module connectivity) score values were performed to search the keystone species. The predicted genes and their functions were aligned to the Kyoto Encyclopedia of Genes and Genomes (KEGG) database, and differences among groups were compared through the PICRUSt2 software [
32,
33].
2.12. Statistical Analysis
All the data in this paper are expressed as the mean±standard deviation (SD) from three independent experiments conducted in parallel, and Student’s test was used for the statisticalanalysis. Statistical data showed a significant difference when the p value was less than 0.05 and a highly significant difference when the p value was less than 0.01. Microbiological analysis was performed using the statistical software R (3.4.1, Robert Gentleman and Ross Ihaka, Auckland University, Auckland, New Zealand).
4. Discussion
The structure of polysaccharides determined their biological activities. Numerous studies have shown that the differences in the biological activity of tea polysaccharides obtained from different tea raw materials or different preparation methods were due to structural differences in tea polysaccharides, such as molecular weight, monosaccharide composition, glycosidic bond linkage form, conformation, etc. [
7,
18,
48,
49].
Chen et al. summarized the previous tea polysaccharides extracted from different tea materials, and their molecular weights were distributed mainly between 1.2 KD and 3900 KD [
50]. Lu et al. reported that TPS in Huangshan Mao Feng green tea was an acidic heteropolysaccharide, and that the monosaccharides contained mannose, ribose, rhamnose, gluconic acid, galacturonic acid, glucose, xylose, galactose, and arabinose, as determined by high-performance liquid chromatography (HPLC) [
18]. In this study, we found that the TPS from yellow leaves of Wuyi rock tea was mainly composed of rhamnose, arabinose, galactose, glucose, and galacturonic acid.
The biological activity of polysaccharides was closely related to their structure and conformation. Structure–activity relationship analysis revealed that the biological activity of yam polysaccharides might be more dependent on their higher molecular weight, higher galacturonic acid content, and complex spatial configuration [
51]. Ren et al. found that polysaccharides of appropriate molecular weight could ensure their easy entry into cells through tissue barriers, which greatly improved their biological efficiency in inhibiting viral replication [
52]. Surenjav et al. confirmed that the biological activity of polysaccharides required polysaccharides with a regular advanced structure [
53].
As a biological macromolecule, tea polysaccharide was relatively difficult to be absorbed by cells. As a polysaccharide containing a galacturonic acid structure, tea polysaccharide was less efficiently absorbed by the small intestinal mucosa due to the electrostatic repulsive force between the negatively charged tea polysaccharide containing a carboxylic acid group and the negatively charged small intestinal mucosa, which reduced its bioavailability [
11].
In contrast, micro-organisms colonizing the human gut had broader genetic heterogeneity and greater degrading enzymes and metabolic capabilities than their hosts. In general, Bacteroides have relatively large genomes that encode various carbohydrate-active enzymes (CAZymes) that confer the ability to synthesize, recognize, or metabolize complex carbohydrates in bacteria. Zeng et al., utilized polysaccharides from Fuzhuan brick tea as a material, and the relative molecular mass, polysaccharide content, and reducing sugar content of TPS did not change after digestion by the digestive system (simulated saliva, gastric juice, and small intestine fluid), indicating that TPS could “escape” digestion of the digestive system and reach the large intestine safely. After fermentation by simulated intestinal flora in vitro, the polysaccharide content was significantly reduced, indicating that TPS could be degraded and utilized by intestinal micro-organisms, implying that the physiological activity of tea polysaccharides might act through the intestinal flora [
54]. Moreover, the intestinal flora is considered to play a crucial role in promoting host health, and is therefore often referred to as the “forgotten organ”. Studies have shown that intestinal microbial imbalance might be a key environmental factor for various complex diseases. With the rapid development of high-throughput sequencing technology, the relationship between human intestinal flora and T2DM is gradually being revealed [
55].
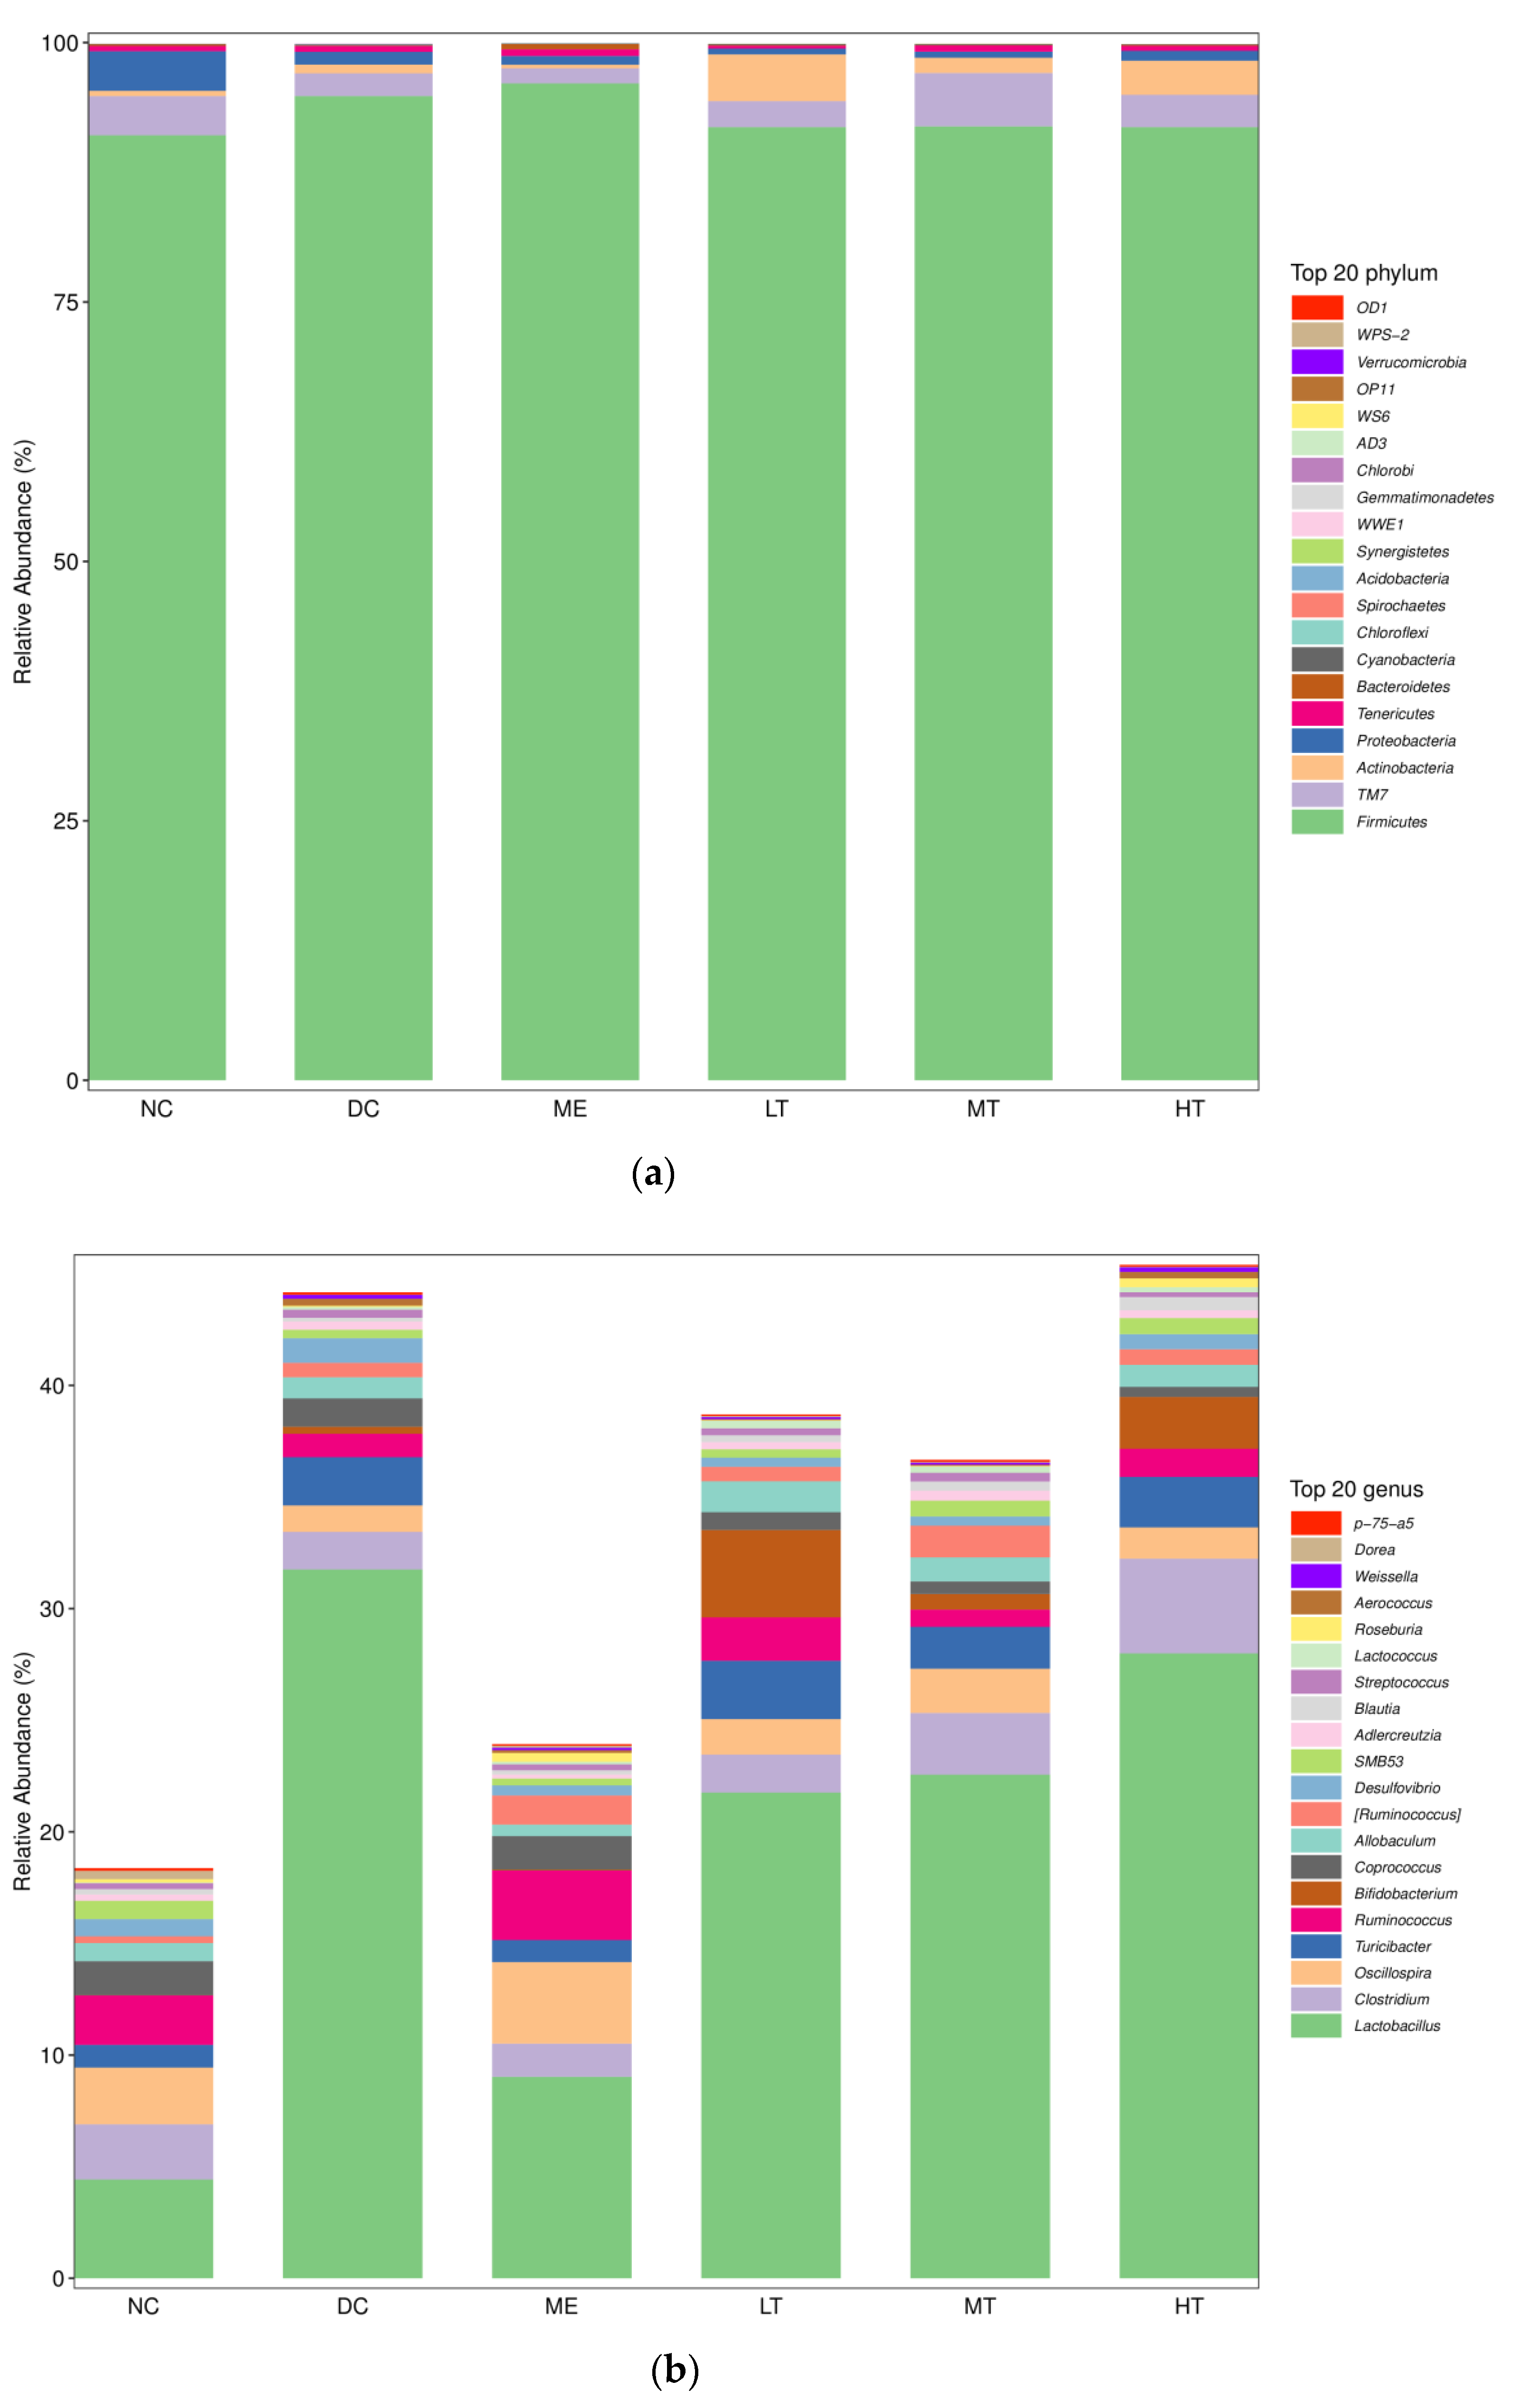
In our study,
Lactobacillus was significantly increased in the intestines of type 2 diabetic rats.
Bifidobacterium rebounded significantly with the intervention of tea polysaccharides.
Lactobacillus and
Bifidobacterium can train the immune system, inhibit the reproduction of other harmful bacteria, are often considered probiotics, and have been validated in many studies. However, there were also some contradictory reports. Professor Zhao and colleagues intervened in patients fed a high dietary fiber diet and found that the selectively enriched intestinal flora could alleviate type 2 diabetes, among which
Bifidobacterium pseudocatenulatum was one of the most significant strains to promote SCFA production [
55]. Stephanie Schnorr and colleagues investigated the phylogenetic diversity and metabolite production of the gut microbiota from a community of human hunter–gatherers, the Hadza of Tanzania. They showed that the gut of Hadza had an absence of
Bifidobacterium, suggesting that
Bifidobacterium was not necessary for survival [
56]. Mohamed Elfil and his colleagues [
47] reported a significant increase in
Lactobacillus in peritoneal dialysis (PD) patients. In an experimental study on pu-erh tea intervention for hypercholesterolemia, the relative abundance of OTUs of
Lactobacillus,
Bacillus,
Lactococcus, and
Streptococcus was found to be reduced in rat and human fecal samples at the genus level after pu-erh tea intervention. The author believed that the common function of these micro-organisms with reduced abundance was the production of BSH enzymes [
46]. Chen and colleagues used five-week-old male mice fed a high-energy diet with different lipid-to-sugar ratios to induce prediabetic mice. The intestinal flora is characterized by a high-fat diet rich in
Lactobacillus and
Bifidobacterium [
57]. Taken together with previous studies, the intestinal flora of individuals with significant T2DM and prediabetes showed a relative decrease in butyrate-producing bacteria and an increase in species with potential proinflammatory functions [
58]. However, attempts to transfer intestinal flora from unmedicated individuals with T2DM disease or prediabetes to germ-free mice to replicate the T2DM phenotype have thus far been unsuccessful [
58], thus also illustrating the complexity of the relationship between intestinal flora and T2DM.
In short, because of the wide variation among individuals of different populations, races, genders, ages, and health conditions, there may be no “gold standard” for human gut flora that promotes metabolically healthy hosts. Associating gut microbiota and host disease with a single mechanism is not desirable.
5. Conclusions
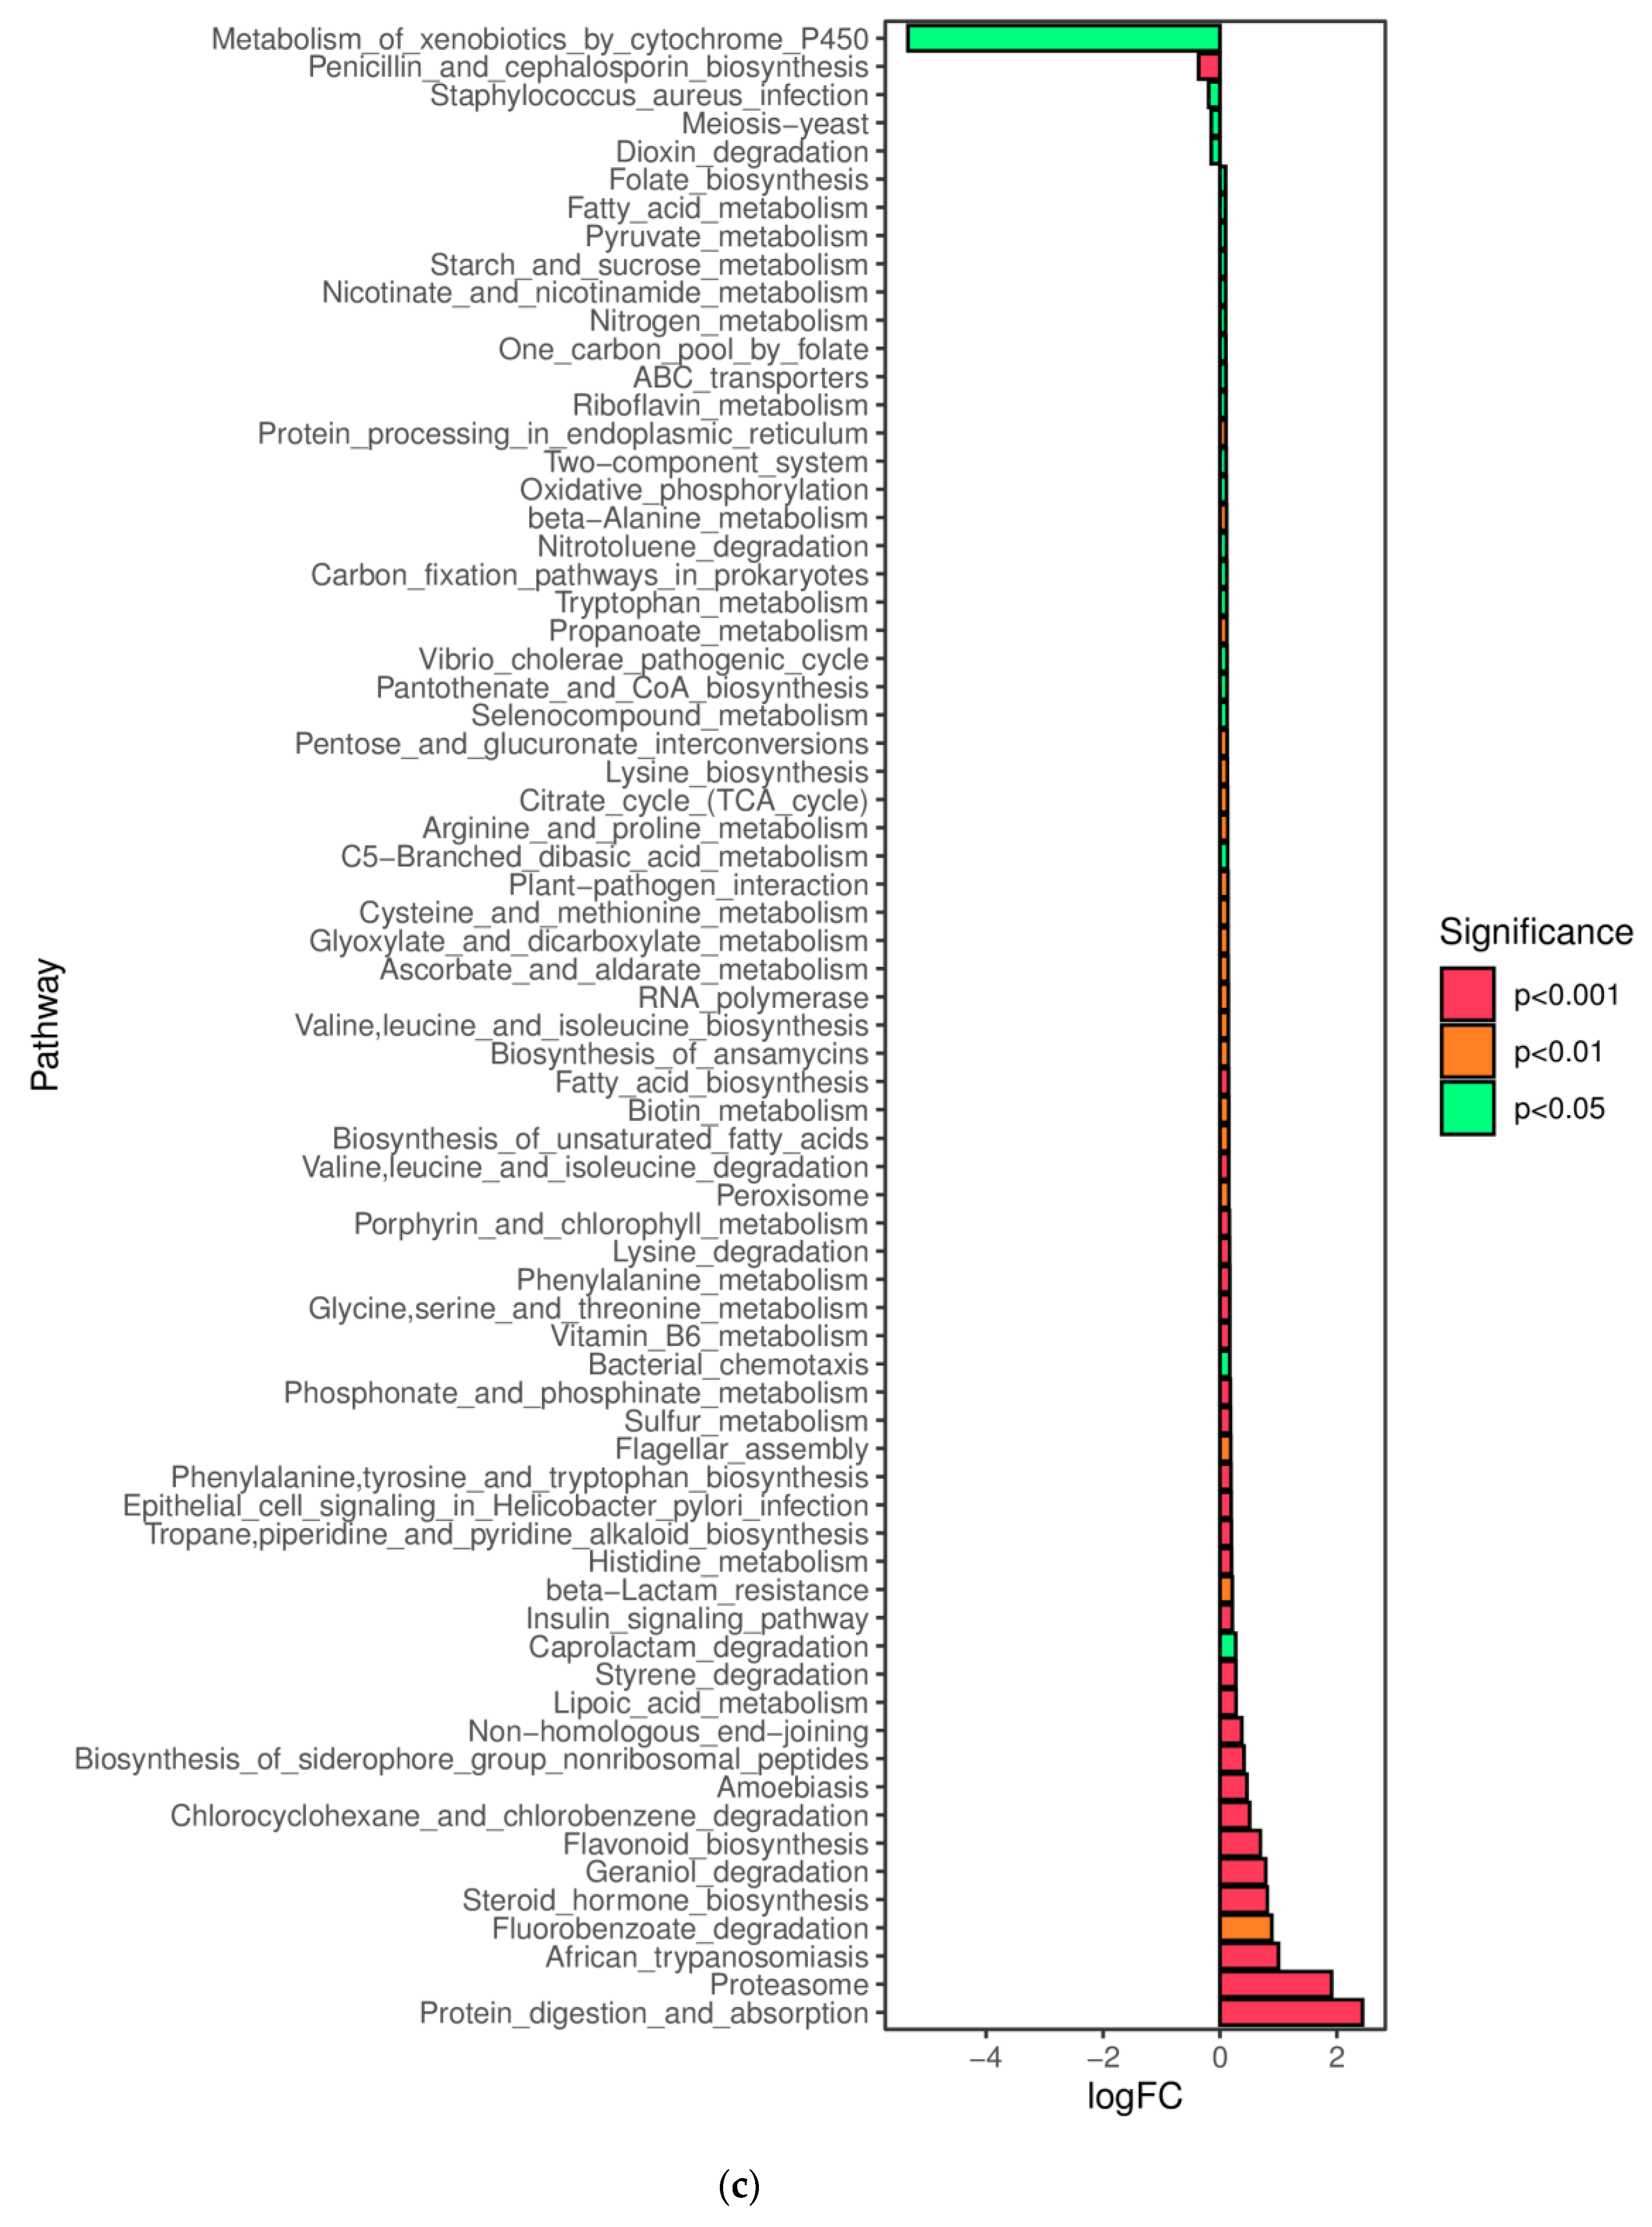
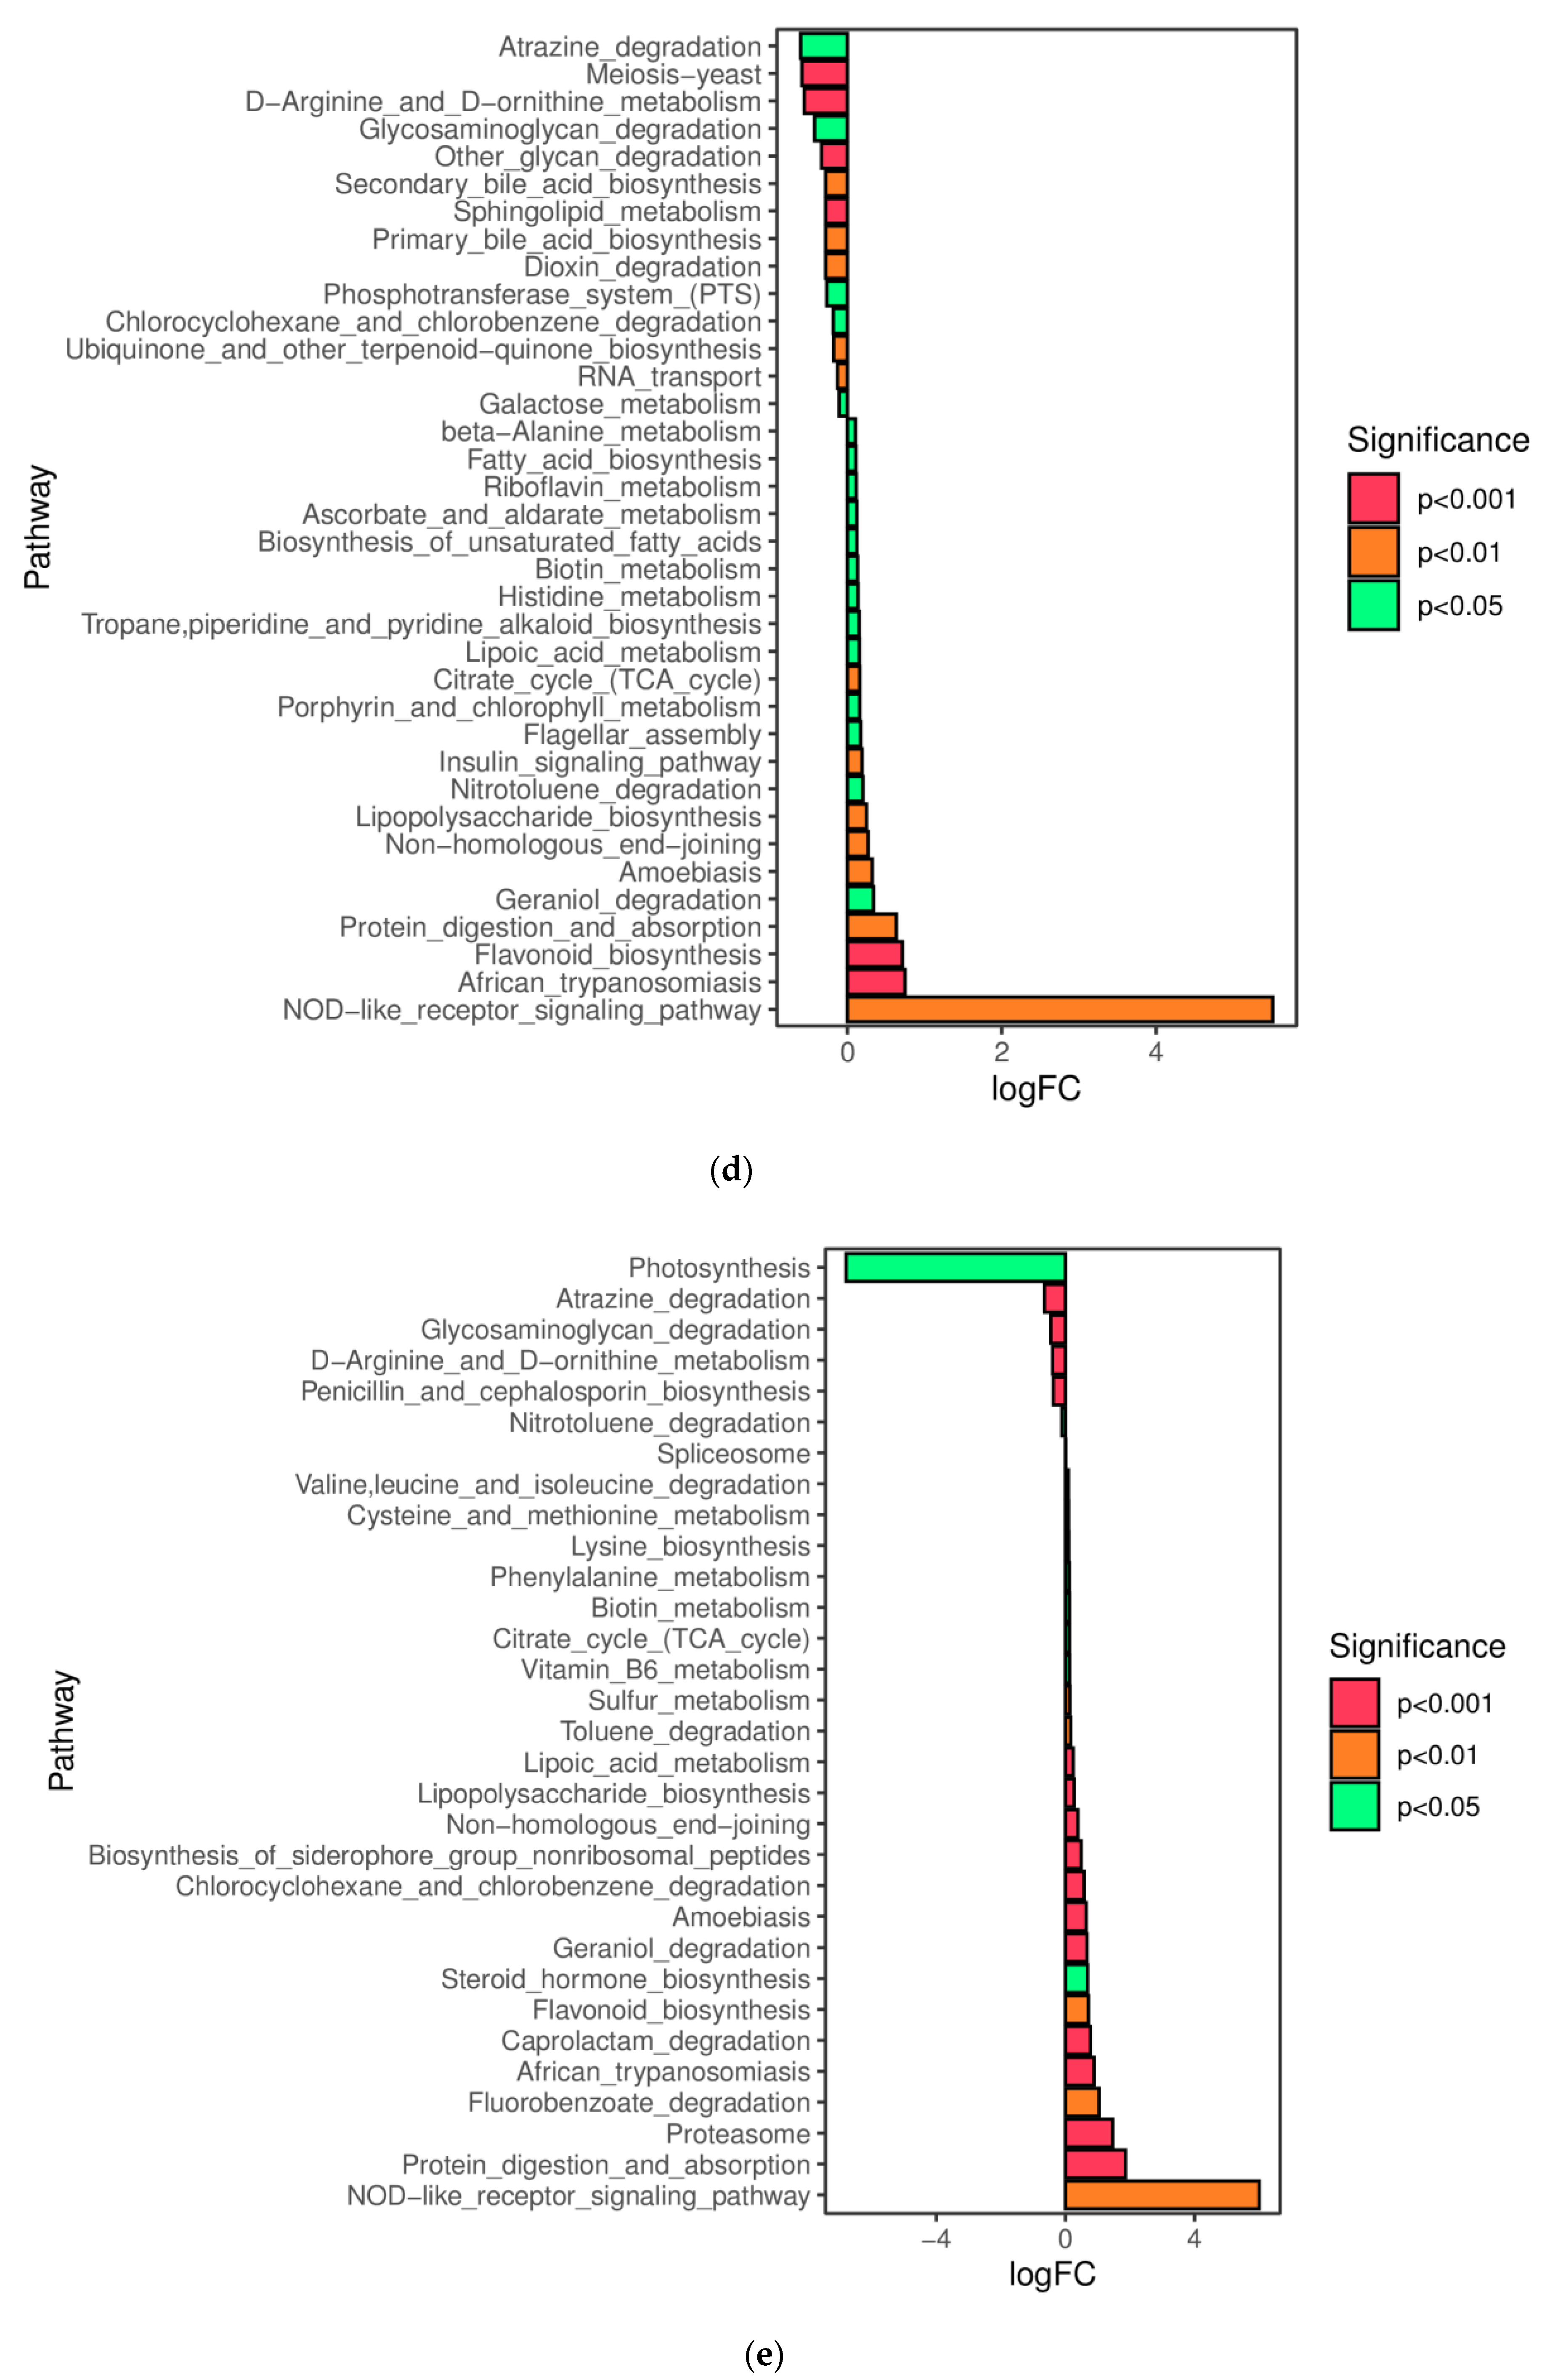
In this study, a novel polysaccharide from yellow leaves of Wuyi rock tea named CY was isolated and purified. The mean MW value of CY was 39.285 kDa. CY was mainly composed of rhamnose, arabinose, galactose, glucose, and galacturonic acid, the majority of which mainly contained 10 kinds of glycosyl residues, α-l-Araf-(1→, →5)-α-l-Araf-(1→, →4)-α-d-Glcp-(1→, Arap-(1→, →6)-α-d-Glcp-(1→, →2,4)-α-l-Rhap-(1→, →3,4)-α-d-Glcp-(1→, →4)-α-d-GalAp-(1→, α-d-Galp-(1→, →6)-β-d-Galp-(1→, →4)-β-d-Galp-(1→. CY intervention significantly lowered the blood sugar levels in type 2 diabetic rats. Both α-diversity and β-diversity indices provided strong evidence for microbial structural dysbiosis in T2DM rats. Gut microbiota analysis revealed that Actinobacteria play an important role in the intestinal flora network. Bifidobacterium was the key micro-organism that promoted significant improvements in flora structure. Moreover, the metabolic functions of the gut microbiota were enhanced based on bioinformatics analysis. Gene expressions including secondary bile acid biosynthesis and primary bile acid biosynthesis were upregulated in the metabolic pathway. Gene expressions including the NOD-like receptor signaling pathway, lipopolysaccharide biosynthesis, and insulin signaling pathway were downregulated in the metabolic pathway. Hence, CY might be used to treat glucose metabolism disorders and their complications as a food supplement.


