

Characterization of Flavor Profile of “Nanx Wudl” Sour Meat Fermented from Goose and Pork Using Gas Chromatography–Ion Mobility Spectrometry (GC–IMS) Combined with Electronic Nose and Tongue
 , , and
Abstract
:1. Introduction
2. Materials and Methods
2.1. Experimental Design
2.2. Electronic Nose Analysis
2.3. Electronic Tongue Analysis
2.4. GC–IMS Analysis
- RT(x): The retention time of the substance/min;
- RT(n): The retention time of the n-ketones/min;
- n: The number of carbon atoms in the n-ketones;
- x: target to be carried out via qualitative and quantitative analysis;
- x − 1: The component peaking before target x;
- x + 1: The component peaking after target x.
2.5. Statistical Analysis
3. Results
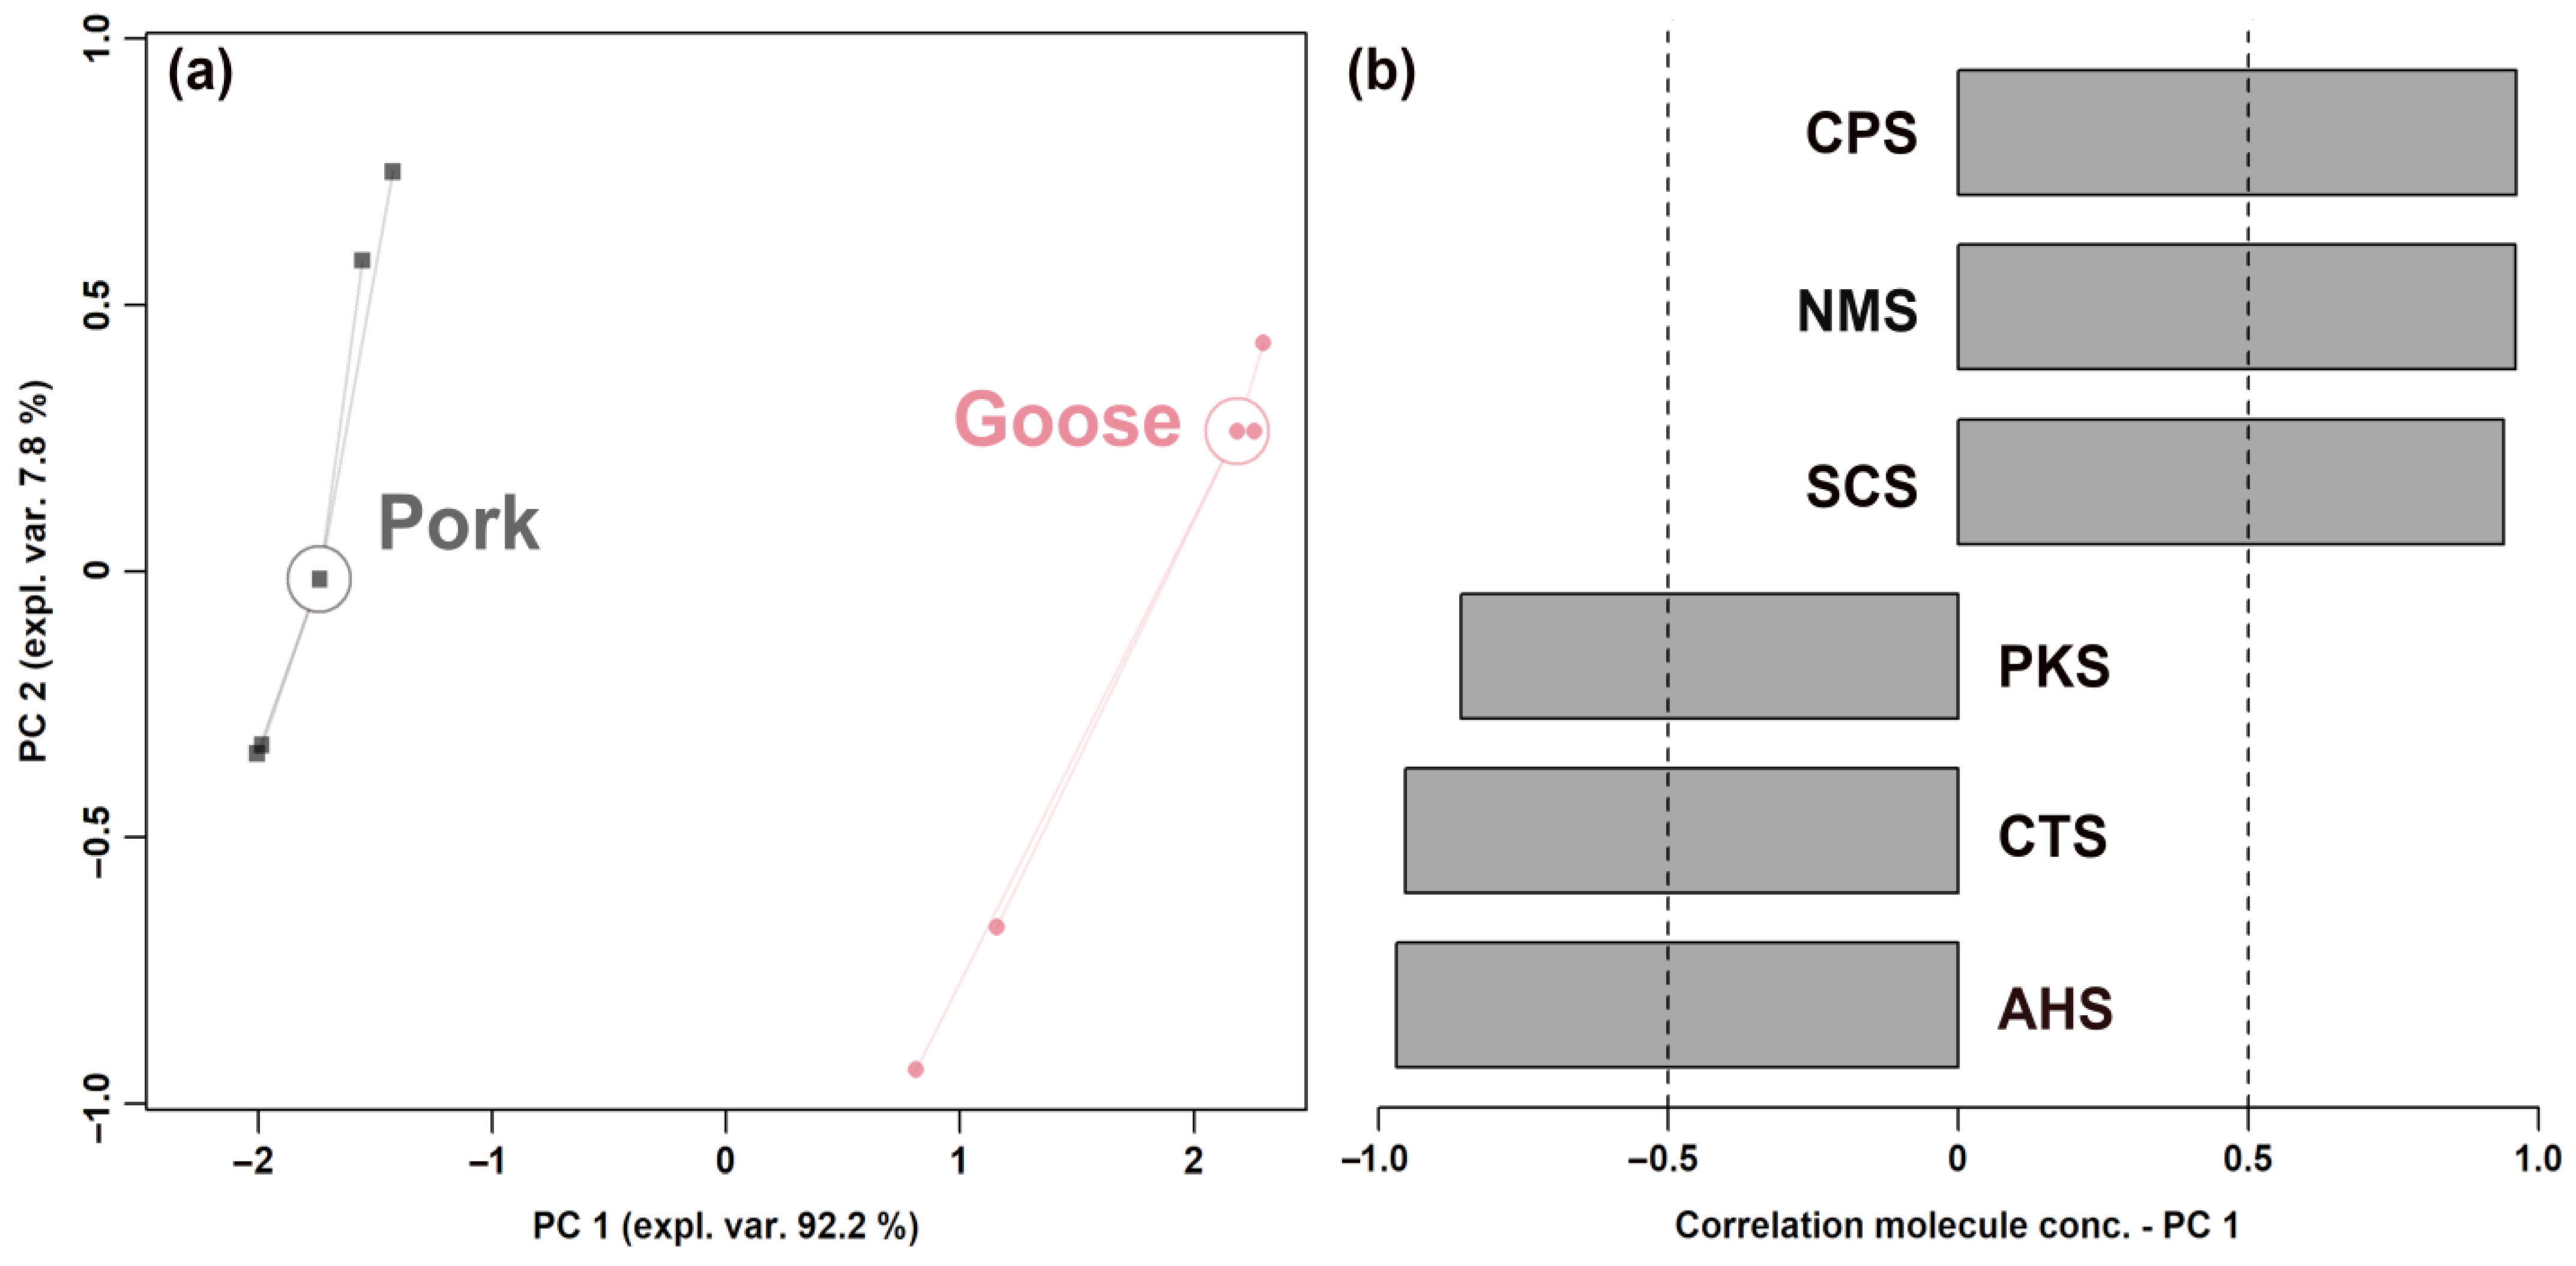
3.1. Electronic Nose Analysis
3.2. Electronic Tongue Analysis
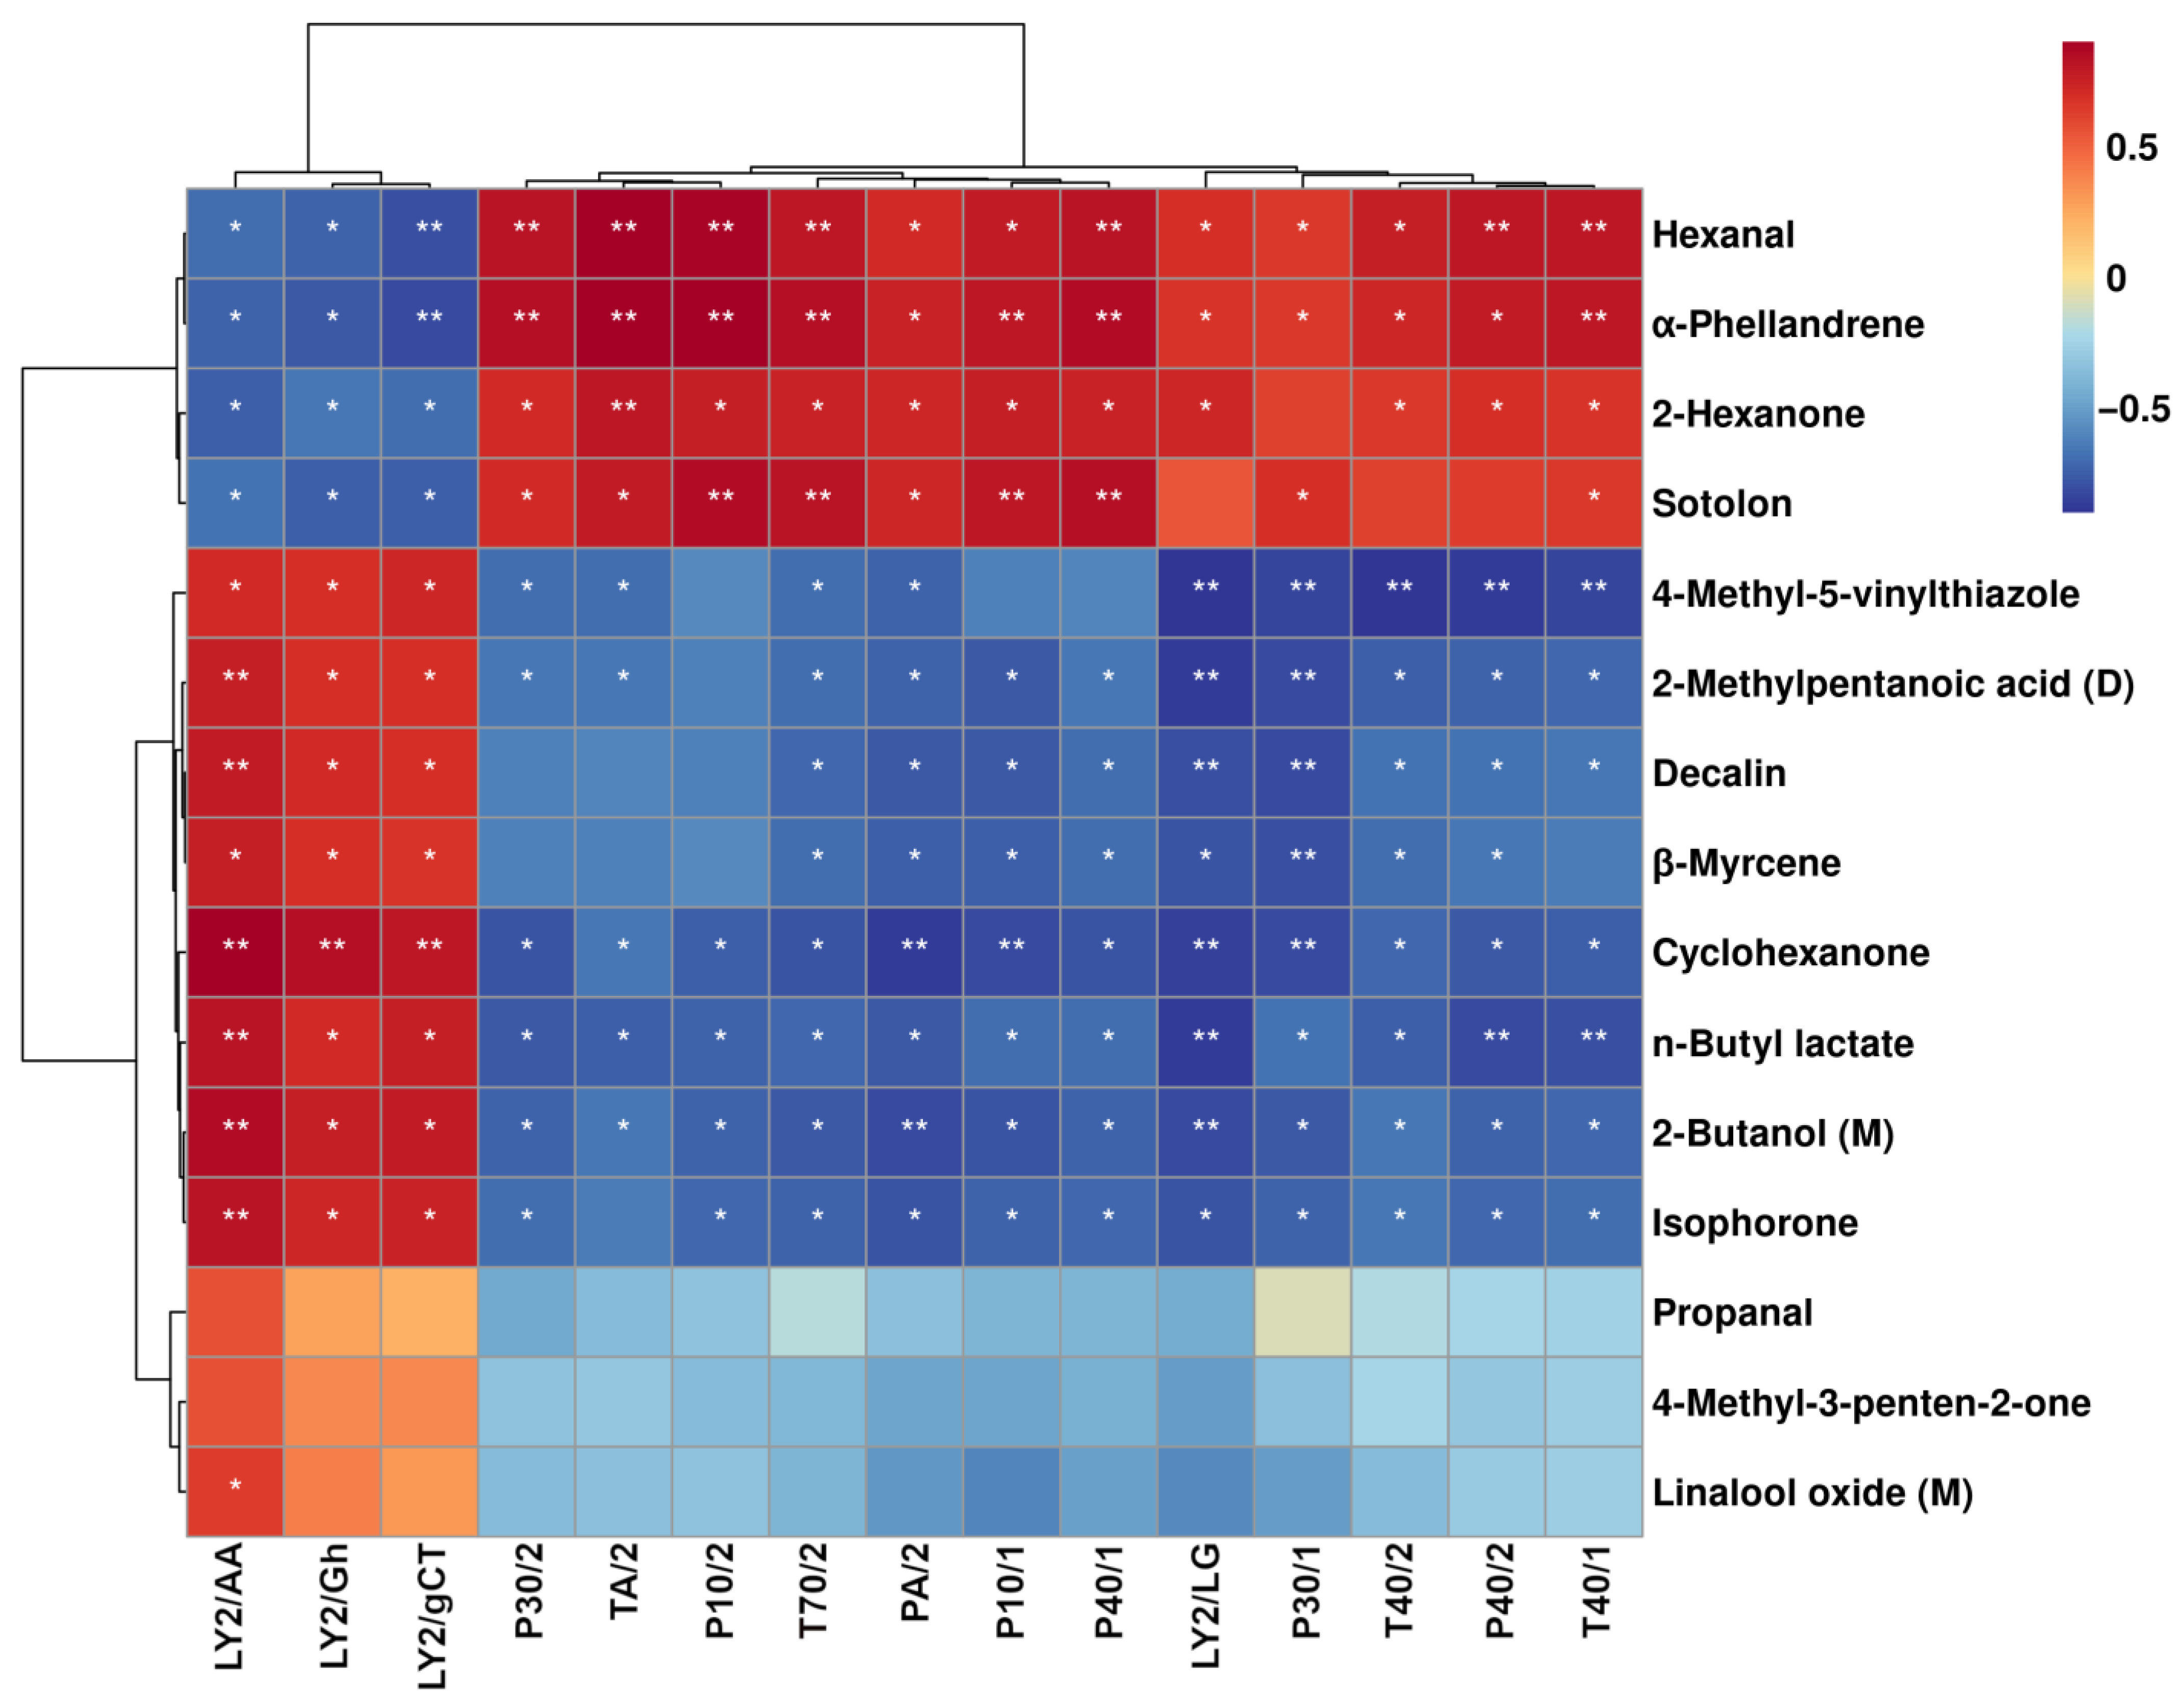
3.3. GC–IMS Analysis
3.4. Correlation between E-Nose and GC–IMS
4. Discussion
5. Conclusions
Author Contributions
Funding
Data Availability Statement
Conflicts of Interest
References
- Zhong, A.; Chen, W.; Hu, L.; Wu, Z.; Xiao, Y.; Li, K.; Li, Z.; Wang, Y.; Wang, C. Characterisation of key volatile compounds in fermented sour meat after fungi growth inhibition. LWT 2022, 165, 113662. [Google Scholar] [CrossRef]
- Chen, C.; Chen, X.; Jiang, M.; Rui, X.; Li, W.; Dong, M. A newly discovered bacteriocin from Weissella hellenica D1501 associated with Chinese Dong fermented meat (Nanx Wudl). Food Control 2014, 42, 116–124. [Google Scholar] [CrossRef]
- Ying, W.; Ya-Ting, J.; Jin-Xuan, C.; Yin-Ji, C.; Yang-Ying, S.; Xiao-Qun, Z.; Dao-Dong, P.; Chang-Rong, O.; Ning, G. Study on lipolysis-oxidation and volatile flavour compounds of dry-cured goose with different curing salt content during production. Food Chem. 2016, 190, 33–40. [Google Scholar] [CrossRef] [PubMed]
- Wołoszyn, J.; Wereńska, M.; Goluch, Z.; Haraf, G.; Okruszek, A.; Teleszko, M.; Król, B. The selected goose meat quality traits in relation to various types of heat treatment. Poult. Sci. 2020, 99, 7214–7224. [Google Scholar] [CrossRef] [PubMed]
- Lv, J.; Li, C.; Li, S.; Liang, H.; Ji, C.; Zhu, B.; Lin, X. Effects of temperature on microbial succession and quality of sour meat during fermentation. LWT 2019, 114, 108391. [Google Scholar] [CrossRef]
- Lv, J.; Yang, Z.; Xu, W.; Li, S.; Liang, H.; Ji, C.; Yu, C.; Zhu, B.; Lin, X. Relationships between bacterial community and metabolites of sour meat at different temperature during the fermentation. Int. J. Food Microbiol. 2019, 307, 108286. [Google Scholar] [CrossRef]
- Lv, J.; Lin, X.; Liu, M.; Yan, X.; Liang, H.; Ji, C.; Li, S.; Zhang, S.; Chen, Y.; Zhu, B. Effect of Saccharomyces cerevisiae LXPSC1 on microorganisms and metabolites of sour meat during the fermentation. Food Chem. 2023, 402, 134213. [Google Scholar] [CrossRef]
- Zhang, Y.; Hu, P.; Xie, Y.; Wang, X. Co-fermentation with Lactobacillus curvatus LAB26 and Pediococcus pentosaceus SWU73571 for improving quality and safety of sour meat. Meat Sci. 2020, 170, 108240. [Google Scholar] [CrossRef]
- Wang, Q.; Li, X.; Xue, B.; Wu, Y.; Song, H.; Luo, Z.; Shang, P.; Liu, Z.; Huang, Q. Low-salt fermentation improves flavor and quality of sour meat: Microbiology and metabolomics. LWT 2022, 171, 114157. [Google Scholar] [CrossRef]
- Khan, M.I.; Jo, C.; Tariq, M.R. Meat flavor precursors and factors influencing flavor precursors—A systematic review. Meat Sci. 2015, 110, 278–284. [Google Scholar] [CrossRef]
- Wang, Z.; Mi, S.; Wang, X.; Mao, K.; Liu, Y.; Gao, J.; Sang, Y. Characterization and discrimination of fermented sweet melon juice by different microbial strains via GC–IMS-based volatile profiling and chemometrics. Food Sci. Hum. Wellness 2023, 12, 1241–1247. [Google Scholar] [CrossRef]
- Guo, Y.; Chen, D.; Dong, Y.; Ju, H.; Wu, C.; Lin, S. Characteristic volatiles fingerprints and changes of volatile compounds in fresh and dried Tricholoma matsutake Singer by HS-GC–IMS and HS-SPME-GC–MS. J. Chromatogr. B Anal. Technol. Biomed. Life Sci. 2018, 1099, 46–55. [Google Scholar] [CrossRef]
- Yuan, Z.-Y.; Li, J.; Zhou, X.-J.; Wu, M.-H.; Li, L.; Pei, G.; Chen, N.-H.; Liu, K.-L.; Xie, M.-Z.; Huang, H.-Y. HS-GC–IMS-Based metabonomics study of Baihe Jizihuang Tang in a rat model of chronic unpredictable mild stress. J. Chromatogr. B Anal. Technol. Biomed. Life Sci. 2020, 1148, 122143. [Google Scholar] [CrossRef] [PubMed]
- Chen, Q.; Hu, Y.; Wen, R.; Wang, Y.; Qin, L.; Kong, B. Characterisation of the flavour profile of dry fermented sausages with different NaCl substitutes using HS-SPME-GC-MS combined with electronic nose and electronic tongue. Meat Sci. 2021, 172, 108338. [Google Scholar] [CrossRef] [PubMed]
- Zhu, D.; Ren, X.; Wei, L.; Cao, X.; Ge, Y.; Liu, H.; Li, J. Collaborative analysis on difference of apple fruits flavour using electronic nose and electronic tongue. Sci. Hortic. 2020, 260, 108879. [Google Scholar] [CrossRef]
- Lv, J.; Xu, W.; Ji, C.; Liang, H.; Li, S.; Yang, Z.; Zhang, S.; Lin, X. Relationships between the bacterial diversity and metabolites of a Chinese fermented pork product, sour meat. Int. J. Food Sci. Technol. 2021, 56, 2742–2750. [Google Scholar] [CrossRef]
- Zhong, A.; Chen, W.; Duan, Y.; Li, K.; Tang, X.; Tian, X.; Wu, Z.; Li, Z.; Wang, Y.; Wang, C. The potential correlation between microbial communities and flavors in traditional fermented sour meat. LWT 2021, 149, 111873. [Google Scholar] [CrossRef]
- Kononiuk, A.D.; Karwowska, M. Comparison of selected parameters related to food safety of fallow deer and beef uncured fermented sausages with freeze-dried acid whey addition. Meat Sci. 2020, 161, 108015. [Google Scholar] [CrossRef]
- Settanni, L.; Barbaccia, P.; Bonanno, A.; Ponte, M.; Di Gerlando, R.; Franciosi, E.; Di Grigoli, A.; Gaglio, R. Evolution of indigenous starter microorganisms and physicochemical parameters in spontaneously fermented beef, horse, wild boar and pork salamis produced under controlled conditions. Food Microbiol. 2020, 87, 103385. [Google Scholar] [CrossRef] [PubMed]
- Li, X.; Yang, Y.; Zhu, Y.; Ben, A.; Qi, J. A novel strategy for discriminating different cultivation and screening odor and taste flavor compounds in Xinhui tangerine peel using E-nose, E-tongue, and chemometrics. Food Chem. 2022, 384, 132519. [Google Scholar] [CrossRef] [PubMed]
- Yang, C.; Duan, W.; Xie, K.; Ren, C.; Zhu, C.; Chen, K.; Zhang, B. Effect of salicylic acid treatment on sensory quality, flavor-related chemicals and gene expression in peach fruit after cold storage. Postharvest Biol. Technol. 2020, 161, 111089. [Google Scholar] [CrossRef]
- Han, D.; Zhang, C.-H.; Fauconnier, M.-L.; Jia, W.; Wang, J.-F.; Hu, F.-F.; Xie, D.-W. Characterization and comparison of flavor compounds in stewed pork with different processing methods. LWT 2021, 144, 111229. [Google Scholar] [CrossRef]
- Wang, D.; Zhang, J.; Zhu, Z.; Lei, Y.; Huang, S.; Huang, M. Effect of ageing time on the flavour compounds in Nanjing water-boiled salted duck detected by HS-GC–IMS. LWT 2022, 155, 112870. [Google Scholar] [CrossRef]
- Liu, H.; Yu, Y.; Zou, B.; Yu, Y.; Yang, J.; Xu, Y.; Chen, X.; Yang, F. Evaluation of Dynamic Changes and Regularity of Volatile Flavor Compounds for Different Green Plum (Prunus mume Sieb. et Zucc) Varieties during the Ripening Process by HS-GC–IMS with PLS-DA. Foods 2023, 12, 551. [Google Scholar] [CrossRef]
- Guo, S.; Zhao, X.; Ma, Y.; Wang, Y.; Wang, D. Fingerprints and changes analysis of volatile compounds in fresh-cut yam during yellowing process by using HS-GC–IMS. Food Chem. 2022, 369, 130939. [Google Scholar] [CrossRef] [PubMed]
- Box, G.E.P.; Cox, D.R. An Analysis of Transformations. J. R. Stat. Soc. Ser. B Methodol. 2018, 26, 211–243. [Google Scholar] [CrossRef]
- Montanari, C.; Gatto, V.; Torriani, S.; Barbieri, F.; Bargossi, E.; Lanciotti, R.; Grazia, L.; Magnani, R.; Tabanelli, G.; Gardini, F. Effects of the diameter on physico-chemical, microbiological and volatile profile in dry fermented sausages produced with two different starter cultures. Food Biosci. 2018, 22, 9–18. [Google Scholar] [CrossRef]
- Karpiński, P.; Kruszewski, B.; Stachelska, M.A.; Szabłowska, E. Development of volatile profile of Kumpiak podlaski dry-cured ham during traditional ripening. Int. J. Food Sci. Technol. 2020, 55, 3630–3638. [Google Scholar] [CrossRef]
- Wen, R.; Kong, B.; Yin, X.; Zhang, H.; Chen, Q. Characterisation of flavour profile of beef jerky inoculated with different autochthonous lactic acid bacteria using electronic nose and gas chromatography–ion mobility spectrometry. Meat Sci. 2022, 183, 108658. [Google Scholar] [CrossRef]
- Zhu, C.; Yang, Z.; He, L.; Lu, X.; Tang, J.; Laghi, L. The Longer the Storage Time, the Higher the Price, the Better the Quality? A 1H-NMR Based Metabolomic Investigation of Aged Ya’an Tibetan Tea (Camellia sinensis). Foods 2022, 11, 2986. [Google Scholar] [CrossRef]
- Sidira, M.; Kandylis, P.; Kanellaki, M.; Kourkoutas, Y. Effect of immobilized Lactobacillus casei on the evolution of flavor compounds in probiotic dry-fermented sausages during ripening. Meat Sci. 2015, 100, 41–51. [Google Scholar] [CrossRef] [PubMed]
- Li, X.; Dong, Y.; Jiang, P.; Qi, L.; Lin, S. Identification of changes in volatile compounds in sea cucumber Apostichopus japonicus during seasonings soaking using HS-GC–IMS. LWT 2022, 154, 112695. [Google Scholar] [CrossRef]
- Zhang, Q.; Ding, Y.; Gu, S.; Zhu, S.; Zhou, X.; Ding, Y. Identification of changes in volatile compounds in dry-cured fish during storage using HS-GC–IMS. Food Res. Int. 2020, 137, 109339. [Google Scholar] [CrossRef]
- Wan, J.; Liu, Q.; Ma, C.; Muhoza, B.; Huang, Y.; Sun, M.; Song, S.; Ho, C.-T. Characteristic flavor fingerprint disclosure of dzo beef in Tibet by applying SAFE-GC-O-MS and HS-GC–IMS technology. Food Res. Int. 2023, 166, 112581. [Google Scholar] [CrossRef] [PubMed]
- Nie, S.; Li, L.; Wang, Y.; Wu, Y.; Li, C.; Chen, S.; Zhao, Y.; Wang, D.; Xiang, H.; Wei, Y. Discrimination and characterization of volatile organic compound fingerprints during sea bass (Lateolabrax japonicas) fermentation by combining GC–IMS and GC-MS. Food Biosci. 2022, 50, 102048. [Google Scholar] [CrossRef]
- Kim, K.-W.; Kim, H.-J.; Lee, E.-D.; Kim, D.-K.; Lee, J.; Lee, S.-S.; Jang, A.; Lee, S.-H. Comparison of Meat Quality Characteristics and Aromatic Substances of Korean Native Black Goat Ribs by Different Sex. J. Food Nutr. Res. 2020, 8, 585–590. [Google Scholar] [CrossRef]
- Montanari, C.; Bargossi, E.; Gardini, A.; Lanciotti, R.; Magnani, R.; Gardini, F.; Tabanelli, G. Correlation between volatile profiles of Italian fermented sausages and their size and starter culture. Food Chem. 2016, 192, 736–744. [Google Scholar] [CrossRef]
- Le Bars, D.; Yvon, M. Formation of diacetyl and acetoin by Lactococcus lactis via aspartate catabolism. J. Appl. Microbiol. 2008, 104, 171–177. [Google Scholar] [CrossRef]
- Moya, V.-J.; Flores, M.; Aristoy, M.-C.; Toldrá, F. Pork meat quality affects peptide and amino acid profiles during the ageing process. Meat Sci. 2001, 58, 197–206. [Google Scholar] [CrossRef]
- Geldenhuys, G.; Hoffman, L.C.; Muller, N. The fatty acid, amino acid, and mineral composition of Egyptian goose meat as affected by season, gender, and portion. Poult. Sci. 2015, 94, 1075–1087. [Google Scholar] [CrossRef]
- Yim, D.-G.; Kim, H.J.; Kim, S.-S.; Lee, H.J.; Kim, J.-K.; Jo, C. Effects of different X-ray irradiation doses on quality traits and metabolites of marinated ground beef during storage. Radiat. Phys. Chem. 2023, 202, 110563. [Google Scholar] [CrossRef]
- Feng, X.; Ahn, D.U. Volatile profile, lipid oxidation and protein oxidation of irradiated ready-to-eat cured turkey meat products. Radiat. Phys. Chem. 2016, 127, 27–33. [Google Scholar] [CrossRef]
- Jo, Y.; An, K.-A.; Arshad, M.S.; Kwon, J.-H. Effects of e-beam irradiation on amino acids, fatty acids, and volatiles of smoked duck meat during storage. Innov. Food Sci. Emerg. Technol. 2018, 47, 101–109. [Google Scholar] [CrossRef]
- Bak, K.H.; Rankin, S.A.; Richards, M.P. Hexanal as a marker of oxidation flavour in sliced and uncured deli turkey with and without phosphates using rosemary extracts. Int. J. Food Sci. Technol. 2020, 55, 3104–3110. [Google Scholar] [CrossRef]
- Choi, S.M.; Lee, D.-J.; Kim, J.-Y.; Lim, S.-T. Volatile composition and sensory characteristics of onion powders prepared by convective drying. Food Chem. 2017, 231, 386–392. [Google Scholar] [CrossRef]
- Xu, Y.; Shui, M.; Chen, D.; Ma, X.; Feng, T. Optimization of Jinhua Ham Classification Method Based on Volatile Flavor Substances and Determination of Key Odor Biomarkers. Molecules 2022, 27, 7087. [Google Scholar] [CrossRef]
- Wu, W.; Wang, X.; Hu, P.; Zhang, Y.; Li, J.; Jiang, J.; Zheng, R.; Zhang, L. Research on flavor characteristics of beef cooked in tomato sour soup by gas chromatography–ion mobility spectrometry and electronic nose. LWT 2023, 179, 114646. [Google Scholar] [CrossRef]
- Jia, S.; Li, Y.; Zhuang, S.; Sun, X.; Zhang, L.; Shi, J.; Hong, H.; Luo, Y. Biochemical changes induced by dominant bacteria in chill-stored silver carp (Hypophthalmichthys molitrix) and GC–IMS identification of volatile organic compounds. Food Microbiol. 2019, 84, 103248. [Google Scholar] [CrossRef]
- Ozturk, I.; Sagdic, O.; Yetim, H. Effects of Autochthonous Yeast Cultures on Some Quality Characteristics of Traditional Turkish Fermented Sausage “Sucuk”. Food Sci. Anim. Resour. 2021, 41, 196–213. [Google Scholar] [CrossRef]
- Qiu, Y.; Wu, Y.; Li, L.; Chen, S.; Zhao, Y.; Li, C.; Xiang, H.; Wang, D.; Wei, Y.; Wang, Y. Elucidating the mechanism underlying volatile and non-volatile compound development related to microbial amino acid metabolism during golden pomfret (Trachinotus ovatus) fermentation. Food Res. Int. 2022, 162, 112095. [Google Scholar] [CrossRef]
- Li, X.; Liu, S.-Q. Effect of co-inoculation and sequential inoculation of Lactobacillus fermentum and Pichia kluyveri on pork hydrolysates fermentation. Food Biosci. 2021, 44, 101400. [Google Scholar] [CrossRef]
- Jiang, L.; Chen, Y.; Deng, L.; Liu, F.; Wang, T.; Shi, X.; Wang, B. Bacterial community diversity and its potential contributions to the flavor components of traditional smoked horsemeat sausage in Xinjiang, China. Front. Microbiol. 2022, 13, 942932. [Google Scholar] [CrossRef] [PubMed]
- Zhang, J.; Zhang, W.; Zhou, L.; Zhang, R. Study on the influences of ultrasound on the flavor profile of unsmoked bacon and its underlying metabolic mechanism by using HS-GC–IMS. Ultrason. Sonochem. 2021, 80, 105807. [Google Scholar] [CrossRef] [PubMed]
- Jeong, I.-S.; Park, G.-W.; Kim, Y.-S.; Park, K.-H.; Hwangbo, H.; Lee, S.-Y.; Kim, S.-G. Effects of a Novel Convection Heated Roasting Method on Aroma and Umami Taste Components of Vegetable- and Meat-Based Extracts. J. Food Qual. 2022, 2022, 7690931. [Google Scholar] [CrossRef]
- Ohata, M.; Zhou, L.; Higuchi, K.; Nagai, T.; Kasamatsu, H.; Arihara, K. Investigation of volatile components and identification of the most potent odour-active component in fermented meat sauce. Flavour Fragr. J. 2017, 32, 171–177. [Google Scholar] [CrossRef]
- Soncu, E.D.; Özdemir, N.; Arslan, B.; Küçükkaya, S.; Soyer, A. Contribution of surface application of chitosan–thyme and chitosan–rosemary essential oils to the volatile composition, microbial profile, and physicochemical and sensory quality of dry-fermented sausages during storage. Meat Sci. 2020, 166, 108127. [Google Scholar] [CrossRef]
- Shao, Y.; Liu, X.; Zhang, Z.; Wang, P.; Li, K.; Li, C. Comparison and discrimination of the terpenoids in 48 species of huajiao according to variety and geographical origin by E-nose coupled with HS-SPME-GC-MS. Food Res. Int. 2023, 167, 112629. [Google Scholar] [CrossRef] [PubMed]
- Thangaleela, S.; Sivamaruthi, B.S.; Kesika, P.; Tiyajamorn, T.; Bharathi, M.; Chaiyasut, C. A Narrative Review on the Bioactivity and Health Benefits of Alpha-Phellandrene. Sci. Pharm. 2022, 90, 57. [Google Scholar] [CrossRef]


| Count | Compound | CAS | Molecule Formula | MW * | RI | RT (s) | DT (ms) | Goose | Pork | p-Value |
|---|---|---|---|---|---|---|---|---|---|---|
| Ketones | 2,6-Dimethyl-4-heptanone | C108838 | C9H18O | 142.2 | 1210.4 | 756.074 | 1.77916 | 1.15 × 10³ ± 43.80 | 7.19 × 10² ± 1.13 × 10² | 0.008 |
| 2-Hexanone | C591786 | C6H12O | 100.2 | 1093.1 | 436.042 | 1.49671 | 7.90 × 10² ± 66.90 | 2.23 × 10³ ± 2.82 × 10² | 0.000 | |
| 4-Hydroxy-2,5-dimethyl-3(2 H)-furanone | C3658773 | C6H8O3 | 128.1 | 1053.3 | 371.81 | 1.61084 | 3.05 × 10³ ± 3.90 × 10² | 2.29 × 10³ ± 1.15 × 10³ | 0.139 | |
| 4-Methyl-3-penten-2-one | C141797 | C6H10O | 98.1 | 1106.1 | 462.228 | 1.44482 | 7.86 × 10² ± 4.19 × 10² | 3.88 × 10² ± 1.79 × 10² | 0.093 | |
| Isophorone | C78591 | C9H14O | 138.2 | 1115 | 480.134 | 1.25323 | 1.01 × 10³ ± 1.40 × 10² | 4.97 × 10² ± 63.20 | 0.000 | |
| 2-Methyl-dihydro-(2 H)-Furan-3-one | C3188009 | C5H8O2 | 100.1 | 1280.5 | 1019.37 | 1.06662 | 1.74 × 10³ ± 2.62 × 10² | 2.07 × 10³ ± 93.20 | 0.056 | |
| MIBK | C108101 | C6H12O | 100.2 | 1021.3 | 338.292 | 1.47542 | 2.36 × 10² ± 19.10 | 3.54 × 10² ± 50.70 | 0.001 | |
| 3-Methyl-2-pentanone | C565617 | C6H12O | 100.2 | 1056.3 | 374.988 | 1.47533 | 3.54 × 10³ ± 7.26 × 10² | 4.16 × 10³ ± 2.62 × 10² | 0.155 | |
| 2-Acetylpyrrole | C1072839 | C6H7NO | 109.1 | 1082.5 | 414.813 | 1.49823 | 8.98 × 10² ± 2.03 × 10² | 1.78 × 10³ ± 2.21 × 10² | 0.003 | |
| 2-Acetylpyrazine | C22047252 | C6H6N2O | 122.1 | 1017.1 | 333.894 | 1.20618 | 8.62 × 10² ± 1.40 × 10² | 4.40 × 10² ± 85.10 | 0.004 | |
| Acids | Acetic acid | C64197 | C2H4O2 | 60.1 | 1447.3 | 1673.557 | 1.05277 | 1.73 × 10⁴ ± 1.07 × 10³ | 1.52 × 10⁴ ± 1.77 × 10³ | 0.101 |
| Octanoic acid | C124072 | C8H16O2 | 144.2 | 1174.4 | 628.473 | 1.44089 | 9.98 × 10² ± 1.52 × 10² | 1.87 × 10³ ± 3.04 × 10² | 0.002 | |
| 2-Methylpentanoic acid (D) | C97610 | C6H12O2 | 116.2 | 1029.9 | 347.315 | 1.59258 | 2.77 × 10² ± 37.50 | 1.15 × 10² ± 19.90 | 0.000 | |
| 2-Methylpentanoic acid (M) | C97610 | C6H12O2 | 116.2 | 1028.9 | 346.226 | 1.26389 | 4.00 × 10² ± 46.80 | 2.57 × 10² ± 24.30 | 0.001 | |
| Heptanoic acid | C111148 | C7H14O2 | 130.2 | 1082.4 | 414.564 | 1.3611 | 3.66 × 10² ± 12.40 | 4.37 × 10² ± 54.40 | 0.013 | |
| Nonanoic acid | C112050 | C9H18O2 | 158.2 | 1279.5 | 1015.116 | 1.54967 | 1.50 × 10³ ± 2.57 × 10² | 2.40 × 10³ ± 1.65 × 10² | 0.010 | |
| E-2-Decenoic acid | C334496 | C10H18O2 | 170.3 | 1334.9 | 1232.645 | 1.48495 | 2.12 × 10² ± 40.80 | 3.27 × 10² ± 97.00 | 0.054 | |
| 2-Heptenoic acid | C18999285 | C7H12O2 | 128.2 | 1207 | 744.053 | 1.40605 | 1.26 × 10³ ± 2.56 × 10² | 3.10 × 10³ ± 2.42 × 10² | 0.001 | |
| Alcohols | 1-Octen-3-ol | C3391864 | C8H16O | 128.2 | 1447.5 | 1674.263 | 1.1622 | 4.63 × 10³ ± 6.10 × 10² | 3.62 × 10³ ± 9.00 × 10² | 0.096 |
| 1-Pentanol (D) | C71410 | C5H12O | 88.1 | 1253.8 | 914.653 | 1.51902 | 1.83 × 10³ ± 1.34 × 10² | 1.52 × 10³ ± 4.16 × 10² | 0.257 | |
| 1-Pentanol (M) | C71410 | C5H12O | 88.1 | 1254.1 | 915.518 | 1.25162 | 1.61 × 10³ ± 1.27 × 10² | 1.33 × 10³ ± 3.01 × 10² | 0.199 | |
| 2-Hexanol | C626937 | C6H14O | 102.2 | 1235.1 | 843.655 | 1.56671 | 4.13 × 10³ ± 1.04 × 10³ | 7.17 × 10³ ± 9.86 × 10² | 0.016 | |
| 3-Methyl-1-butanol | C123513 | C5H12O | 88.1 | 1207.6 | 746.268 | 1.24551 | 1.15 × 10³ ± 40.60 | 1.07 × 10³ ± 1.03 × 10² | 0.235 | |
| 2-Methylbutanol | C137326 | C5H12O | 88.1 | 1214.5 | 770.435 | 1.24551 | 2.27 × 10³ ± 1.71 × 10² | 1.97 × 10³ ± 1.23 × 10² | 0.036 | |
| p-Cymen-7-ol | C536607 | C10H14O | 150.2 | 1281.2 | 1021.821 | 1.32996 | 5.51 × 10³ ± 1.15 × 10³ | 1.03 × 10⁴ ± 1.82 × 10³ | 0.006 | |
| (Z)-6-nonen-1-ol | C35854865 | C9H18O | 142.2 | 1181.1 | 652.231 | 1.75376 | 8.75 × 10² ± 30.50 | 1.59 × 10³ ± 9.61 × 10² | 0.016 | |
| 4-Methyl-2-pentanol | C108112 | C6H14O | 102.2 | 1180.5 | 650.067 | 1.54657 | 2.02 × 10³ ± 5.14 × 10² | 4.15 × 10³ ± 1.43 × 10³ | 0.009 | |
| 1-Nonanol | C143088 | C9H20O | 144.3 | 1144.7 | 540.011 | 1.53779 | 2.82 × 10³ ± 8.05 × 10² | 3.71 × 10³ ± 9.29 × 10² | 0.105 | |
| Alcohols | Linalool oxide (D) | C60047178 | C10H18O2 | 170.3 | 1087.7 | 425.155 | 1.80714 | 2.61 × 10³ ± 7.70 × 10² | 1.27 × 10³ ± 3.23 × 10² | 0.016 |
| Linalool oxide (M) | C60047178 | C10H18O2 | 170.3 | 1082.4 | 414.503 | 1.25444 | 4.16 × 10² ± 64.60 | 3.2 × 6102 ± 68.00 | 0.137 | |
| 2-Ethyl-1-hexanol | C104767 | C8H18O | 130.2 | 1030.4 | 347.834 | 1.4048 | 3.83 × 10³ ± 6.13 × 10² | 4.42 × 10³ ± 4.86 × 10² | 0.129 | |
| 2-Butanol (D) | C78922 | C4H10O | 74.1 | 1016.3 | 333.005 | 1.33429 | 1.41 × 10³ ± 3.90 × 10² | 2.71 × 10³ ± 3.06 × 10² | 0.010 | |
| 2-Butanol (M) | C78922 | C4H10O | 74.1 | 1016 | 332.708 | 1.14461 | 6.46 × 10² ± 1.90 × 10² | 2.32 × 10² ± 85.80 | 0.007 | |
| Propanol | C71238 | C3H8O | 60.1 | 976.8 | 295.222 | 1.24209 | 6.75 × 10² ± 2.14 × 10² | 1.54 × 10² ± 37.60 | 0.000 | |
| Propan-2-ol | C67630 | C3H8O | 60.1 | 940.1 | 275.184 | 1.08085 | 7.06 × 10² ± 60.40 | 5.53 × 10² ± 1.74 × 10² | 0.207 | |
| 1-Octanol | C111875 | C8H18O | 130.2 | 1030.2 | 347.582 | 1.46611 | 7.99 × 10³ ± 3.00 × 10² | 7.04 × 10³ ± 4.65 × 10² | 0.037 | |
| 2-Furanmethanol, 5-methyl- | C3857258 | C6H8O2 | 112.1 | 949.8 | 280.488 | 1.26173 | 1.93 × 10² ± 46.40 | 9.20 × 101 ± 9.12 | 0.001 | |
| Aldehydes | Cumin aldehyde | C122032 | C10H12O | 148.2 | 1240.6 | 862.903 | 1.33504 | 3.60 × 10³ ± 1.00 × 10³ | 8.59 × 10³ ± 2.16 × 10³ | 0.005 |
| trans-2-Undecenal | C53448070 | C11H20O | 168.3 | 1335.1 | 1233.494 | 1.56546 | 3.86 × 10³ ± 2.27 × 10² | 2.22 × 10³ ± 5.03 × 10² | 0.017 | |
| 2,4-Decadienal,(E,E)- | C25152845 | C10H16O | 152.2 | 1315.6 | 1156.984 | 1.41449 | 3.79 × 10² ± 16.70 | 4.62 × 10² ± 51.90 | 0.005 | |
| (Z)-4-Heptenal | C6728310 | C7H12O | 112.2 | 1272 | 985.747 | 1.62114 | 2.59 × 10³ ± 4.75 × 10² | 4.85 × 10³ ± 1.84 × 10³ | 0.010 | |
| 2-Hexenal | C6728263 | C6H10O | 98.1 | 1210.7 | 757.253 | 1.50243 | 1.28 × 10⁴ ± 8.16 × 10² | 7.70 × 10³ ± 1.07 × 10³ | 0.006 | |
| 2-Methyl-2-pentenal | C623369 | C6H10O | 98.1 | 1153.1 | 556.885 | 1.5028 | 1.03 × 10³ ± 2.27 × 10² | 2.55 × 10³ ± 2.73 × 10² | 0.001 | |
| Hexanal | C66251 | C6H12O | 100.2 | 1073.1 | 395.761 | 1.55606 | 5.58 × 10² ± 89.50 | 2.27 × 10³ ± 9.09 × 10² | 0.001 | |
| (E)-2-Nonenal | C18829566 | C9H16O | 140.2 | 1144.7 | 540.011 | 1.40541 | 1.37 × 10³ ± 1.13 × 10² | 7.37 × 10² ± 58.30 | 0.000 | |
| (E)-2-Pentenal | C1576870 | C5H8O | 84.1 | 1094.4 | 438.764 | 1.36432 | 1.01 × 10³ ± 73.90 | 1.05 × 10³ ± 1.34 × 10² | 0.975 | |
| 2-Formyl-5-methylthiophene | C13679704 | C6H6OS | 126.2 | 1108.5 | 467.078 | 1.17289 | 3.40 × 10² ± 46.20 | 3.20 × 10² ± 26.50 | 0.838 | |
| Octanal | C124130 | C8H16O | 128.2 | 1006.9 | 323.217 | 1.39288 | 1.13 × 10³ ± 2.03 × 10² | 1.54 × 10³ ± 75.20 | 0.033 | |
| Butanal, 3-methyl- | C590863 | C5H10O | 86.1 | 909.8 | 258.669 | 1.19285 | 4.51 × 10² ± 38.00 | 5.86 × 10² ± 52.20 | 0.008 | |
| Acetaldehyde diethyl acetal | C105577 | C6H14O2 | 118.2 | 863.4 | 233.347 | 1.13106 | 5.32 × 10² ± 90.20 | 4.71 × 10² ± 21.70 | 0.563 | |
| Propanal | C123386 | C3H6O | 58.1 | 842 | 221.677 | 1.03933 | 5.49 × 10² ± 1.50 × 10² | 4.89 × 10² ± 1.33 × 10² | 0.863 | |
| 2-Phenylacetaldehyde | C122781 | C8H8O | 120.2 | 1013.7 | 330.292 | 1.25765 | 1.95 × 10³ ± 3.40 × 10² | 1.87 × 10³ ± 56.70 | 0.710 | |
| Esters | Isoamyl propionate | C105680 | C8H16O2 | 144.2 | 1190.1 | 683.977 | 1.33833 | 5.35 × 10³ ± 2.37 × 10³ | 1.57 × 10⁴ ± 3.81 × 10³ | 0.005 |
| Ethyl-(E)-2-hexenoate | C27829727 | C8H14O2 | 142.2 | 1334.8 | 1232.212 | 1.32568 | 3.78 × 10³ ± 2.68 × 10² | 6.16 × 10³ ± 5.68 × 10² | 0.001 | |
| Hexyl propionate | C2445763 | C9H18O2 | 158.2 | 1329.3 | 1210.43 | 1.43 | 4.53 × 10³ ± 6.92 × 10² | 6.47 × 10³ ± 6.47 × 10² | 0.021 | |
| (Z)-3-hexenyl acetate | C3681718 | C8H14O2 | 142.2 | 1315.4 | 1155.965 | 1.30104 | 3.60 × 10² ± 23.20 | 2.92 × 10² ± 23.80 | 0.015 | |
| Hexyl acetate (D) | C142927 | C8H16O2 | 144.2 | 1271.7 | 984.728 | 1.88721 | 1.25 × 10³ ± 91.60 | 2.58 × 10³ ± 2.26 × 10³ | 0.044 | |
| (Z)-3-Hexen-1-ol, Pentanoate | C35852461 | C11H20O2 | 184.3 | 1272.2 | 986.766 | 1.48608 | 1.53 × 10³ ± 28.50 | 1.26 × 10³ ± 3.50 × 10² | 0.122 | |
| Ethyl hexanoate (D) | C123660 | C8H16O2 | 144.2 | 1234.6 | 841.923 | 1.79323 | 6.16 × 10³ ± 3.86 × 10² | 9.92 × 10³ ± 1.89 × 10³ | 0.002 | |
| Hexyl acetate (M) | C142927 | C8H16O2 | 144.2 | 1271.9 | 985.651 | 1.38787 | 1.63 × 10³ ± 85.90 | 1.89 × 10³ ± 4.85 × 10² | 0.383 | |
| Eesters | Ethyl benzoate | C93890 | C9H10O2 | 150.2 | 1160.1 | 577.835 | 1.26386 | 9.73 × 10² ± 1.61 × 10² | 5.00 × 10² ± 68.00 | 0.001 |
| γ-Octalactone | C104507 | C8H14O2 | 142.2 | 1255.6 | 921.364 | 1.33563 | 4.68 × 10³ ± 9.39 × 10² | 1.06 × 10⁴ ± 2.47 × 10³ | 0.002 | |
| Ethyl hexanoate (M) | C123660 | C8H16O2 | 144.2 | 1234.7 | 842.104 | 1.34131 | 3.84 × 10³ ± 4.45 × 10² | 6.48 × 10³ ± 1.12 × 10³ | 0.002 | |
| Hexyl butanoate | C2639636 | C10H20O2 | 172.3 | 1188.4 | 678.191 | 1.48375 | 9.06 × 10² ± 87.10 | 1.39 × 10³ ± 1.86 × 10² | 0.003 | |
| (Z)-3-hexenyl butyrate | C16491364 | C10H18O2 | 170.3 | 1181.4 | 653.414 | 1.41322 | 9.61 × 10² ± 58.10 | 7.61 × 10² ± 1.07 × 10² | 0.038 | |
| Ethyl 2-methylpentanoate | C39255328 | C8H16O2 | 144.2 | 1141.7 | 534.023 | 1.74779 | 1.12 × 10⁴ ± 1.16 × 10² | 9.35 × 10³ ± 3.20 × 10³ | 0.137 | |
| Sotolon | C28664359 | C6H8O3 | 128.1 | 1097.4 | 444.752 | 1.61692 | 2.79 × 10² ± 24.50 | 5.70 × 10² ± 2.84 × 10² | 0.007 | |
| Ethyl levulinate | C539888 | C7H12O3 | 144.2 | 1082 | 413.724 | 1.64736 | 4.97 × 10² ± 55.40 | 7.92 × 10² ± 2.66×10² | 0.032 | |
| Butanoic acid, 3-methyl-, Butyl ester | C109193 | C9H18O2 | 158.2 | 1074.2 | 397.938 | 1.38714 | 1.22 × 10³ ± 84.70 | 8.69 × 10² ± 91.10 | 0.006 | |
| Isopentyl butanoate | C106274 | C9H18O2 | 158.2 | 1060.1 | 378.974 | 1.40381 | 5.11 × 10² ± 45.20 | 3.71 × 10² ± 57.00 | 0.017 | |
| Butyl formate | C592847 | C5H10O2 | 102.1 | 1014 | 330.632 | 1.5051 | 5.57 × 10² ± 77.30 | 4.87 × 10² ± 1.33×10² | 0.282 | |
| Ethyl propanoate | C105373 | C5H10O2 | 102.1 | 1011.2 | 327.666 | 1.44949 | 6.71 ×10³ ± 2.54×10² | 6.11 × 10³ ± 2.84×10² | 0.021 | |
| Butyl propanoate | C590012 | C7H14O2 | 130.2 | 908.2 | 257.789 | 1.27492 | 5.02 × 10² ± 69.60 | 8.46 × 10² ± 1.97×10² | 0.005 | |
| Ethyl acetate | C141786 | C4H8O2 | 88.1 | 943.6 | 277.07 | 1.33409 | 3.49 × 10² ± 26.40 | 4.93 × 10² ± 59.90 | 0.003 | |
| Ethyl butanoate | C105544 | C6H12O2 | 116.2 | 1014.5 | 331.173 | 1.5593 | 1.10 × 10³ ± 1.46×10² | 7.65 × 10² ± 1.45×10² | 0.020 | |
| n-Butyl lactate | C34451199 | C7H14O3 | 146.2 | 1018.6 | 335.453 | 1.26872 | 2.65 × 10² ± 51.10 | 1.33 × 10² ± 7.96 | 0.000 | |
| Heptyl acetate | C112061 | C9H18O2 | 158.2 | 1073.5 | 396.604 | 1.448 | 5.63 × 10³ ± 1.87 × 10³ | 4.62 × 10³ ± 2.04 × 10³ | 0.811 | |
| Geranyl acetate | C105873 | C12H20O2 | 196.3 | 1400 | 1487.894 | 1.21911 | 4.14 × 10² ± 59.60 | 1.83 × 10² ± 32.80 | 0.000 | |
| cis-Rose oxide | C3033236 | C10H18O | 154.3 | 1111.6 | 473.354 | 1.38248 | 3.18 × 10³ ± 3.65 × 10² | 1.68 × 10³ ± 2.53 × 10² | 0.002 | |
| Others | Dipropyl disulfide | C629196 | C6H14S2 | 150.3 | 1098.5 | 446.929 | 1.47388 | 1.23 × 10³ ± 2.11 × 10² | 2.25 × 10³ ± 6.31 × 10² | 0.006 |
| 2,6-Dimethylpyrazine (D) | C108509 | C6H8N2 | 108.1 | 1327.6 | 1204.024 | 1.53744 | 1.76 × 10⁴ ± 7.42 × 10² | 1.03 × 10⁴ ± 1.37 × 10³ | 0.004 | |
| 2,6-Dimethylpyrazine (M) | C108509 | C6H8N2 | 108.1 | 1331.2 | 1218.118 | 1.14507 | 3.30 × 10³ ± 1.67 × 10² | 3.09 × 10³ ± 1.49 × 10² | 0.059 | |
| α-Phellandrene | C99832 | C10H16 | 136.2 | 1152 | 554.708 | 1.67323 | 4.86 × 10² ± 25.00 | 1.34 × 10³ ± 4.68 × 10² | 0.000 | |
| 4-Methyl-5-vinylthiazole | C1759280 | C6H7NS | 125.2 | 1029.9 | 347.315 | 1.53323 | 4.62 × 10² ± 32.60 | 1.99 × 10² ± 37.40 | 0.001 | |
| Decalin | C91178 | C10H18 | 138.3 | 1063.2 | 382.237 | 1.23101 | 5.61 × 10² ± 1.44 × 10² | 1.82 × 10² ± 15.10 | 0.000 | |
| β-Myrcene | C123353 | C10H16 | 136.2 | 977.3 | 295.442 | 1.28554 | 2.45 × 10³ ± 2.71 × 10² | 1.02 × 10³ ± 2.30 × 10² | 0.002 | |
| Ethylpyrazine | C13925003 | C6H8N2 | 108.1 | 933.6 | 271.661 | 1.12623 | 4.13 × 10² ± 81.50 | 3.21 × 10² ± 52.40 | 0.051 | |
| 2,3-Diethyl-5-Methylpyrazine | C18138040 | C9H14N2 | 150.2 | 1154 | 558.675 | 1.27281 | 9.39 × 10² ± 69.70 | 8.97 × 10² ± 65.40 | 0.364 | |
| 2-Isobutyl-3-Methylpyrazine | C13925069 | C9H14N2 | 150.2 | 1142.5 | 535.449 | 1.30033 | 1.78 × 10² ± 44.70 | 1.96 × 10² ± 93.00 | 0.863 | |
| 2-Heptylfuran | C3777717 | C11H18O | 166.3 | 1212.6 | 763.852 | 1.40704 | 3.13 × 10³ ± 6.22 × 10² | 4.40 × 10³ ± 2.19 × 10² | 0.035 | |
| 2-Pentylfuran | C3777693 | C9H14O | 138.2 | 1230.8 | 828.288 | 1.25257 | 8.35 × 10² ± 77.00 | 8.67 × 10² ± 63.50 | 0.383 |
Disclaimer/Publisher’s Note: The statements, opinions and data contained in all publications are solely those of the individual author(s) and contributor(s) and not of MDPI and/or the editor(s). MDPI and/or the editor(s) disclaim responsibility for any injury to people or property resulting from any ideas, methods, instructions or products referred to in the content. |
© 2023 by the authors. Licensee MDPI, Basel, Switzerland. This article is an open access article distributed under the terms and conditions of the Creative Commons Attribution (CC BY) license (https://creativecommons.org/licenses/by/4.0/).
Share and Cite
Zhao, X.; Feng, J.; Laghi, L.; Deng, J.; Dao, X.; Tang, J.; Ji, L.; Zhu, C.; Picone, G. Characterization of Flavor Profile of “Nanx Wudl” Sour Meat Fermented from Goose and Pork Using Gas Chromatography–Ion Mobility Spectrometry (GC–IMS) Combined with Electronic Nose and Tongue. Foods 2023, 12, 2194. https://0-doi-org.brum.beds.ac.uk/10.3390/foods12112194
Zhao X, Feng J, Laghi L, Deng J, Dao X, Tang J, Ji L, Zhu C, Picone G. Characterization of Flavor Profile of “Nanx Wudl” Sour Meat Fermented from Goose and Pork Using Gas Chromatography–Ion Mobility Spectrometry (GC–IMS) Combined with Electronic Nose and Tongue. Foods. 2023; 12(11):2194. https://0-doi-org.brum.beds.ac.uk/10.3390/foods12112194
Chicago/Turabian StyleZhao, Xin, Jianying Feng, Luca Laghi, Jing Deng, Xiaofang Dao, Junni Tang, Lili Ji, Chenglin Zhu, and Gianfranco Picone. 2023. "Characterization of Flavor Profile of “Nanx Wudl” Sour Meat Fermented from Goose and Pork Using Gas Chromatography–Ion Mobility Spectrometry (GC–IMS) Combined with Electronic Nose and Tongue" Foods 12, no. 11: 2194. https://0-doi-org.brum.beds.ac.uk/10.3390/foods12112194