Article

Characterization of Aroma Active Compound Production during Kombucha Fermentation: Towards the Control of Sensory Profiles

1
Laboratory of Gastronomic Sciences, Gembloux Agro-Bio Tech, Liège University, 5030 Gembloux, Belgium
2
Laboratory of Chemistry of Natural Molecules, Gembloux Agro-Bio Tech, Liège University, 5030 Gembloux, Belgium
*
Author to whom correspondence should be addressed.
Submission received: 10 March 2023 / Revised: 30 March 2023 / Accepted: 12 April 2023 / Published: 15 April 2023
(This article belongs to the Special Issue Changes of Volatile Flavor Compounds during the Fermentation in Foods)

Abstract

:
Since the sensorial profile is the cornerstone for the development of kombucha as a beverage with mass market appeal, advanced analytical tools are needed to gain a better understanding of the kinetics of aromatic compounds during the fermentation process to control the sensory profiles of the drink. The kinetics of volatile organic compounds (VOCs) was determined using stir bar sorptive extraction—gas chromatography—mass spectrometry, and odor-active compounds were considered to estimate consumer perception. A total of 87 VOCs were detected in kombucha during the fermentation stages. The synthesis of mainly phenethyl alcohol and isoamyl alcohol probably by Saccharomyces genus led to ester formation. Moreover, the terpene synthesis occurring at the beginning of fermentation (Δ-3-carene, α-phellandrene, γ-terpinene, m- and p-cymene) could be related to yeast activity as well. Principal component analysis identified classes that allowed the major variability explanation, which are carboxylic acids, alcohols, and terpenes. The aromatic analysis accounted for 17 aroma-active compounds. These changes in the evolution of VOCs led to flavor variations: from citrus-floral-sweet notes (geraniol and linalool domination), and fermentation brought intense citrus-herbal-lavender-bergamot notes (α-farnesene). Finally, sweet-floral-bready-honey notes dominated the kombucha flavor (2-phenylethanol). As this study allowed to estimate kombucha sensory profiles, an insight for the development of new drinks by controlling the fermentation process was suggested. Such a methodology should allow a better control and optimization of their sensory profile, which could in turn lead to greater consumer acceptance.

Graphical Abstract

1. Introduction

Flavor profile monitoring along with other factors, such as the environment in which a food product is consumed, are the most importance factors ensuring consumer acceptance. Indeed, the aroma, which consists of a complex association of volatile organic compounds (VOCs), significantly affects overall consumer experience. Although synergistic interactions can occur between minor constituents of the aroma, consumer perception is mainly impacted by key aromatic compounds, known as odor-active compounds. Monitoring the production and occurrence throughout food processing is therefore of crucial importance [1].
Fermentation has regained attention in the food industry as a natural, cost-effective, versatile, and proven technology that extends the shelf-life of food products and enhances their nutritional content while developing foods with interesting sensory profiles [2]. Fermentation can be applied to produce natural drinks to replace conventional soft drinks.
In this context, Kombucha (from the Japanese word for “Tea Algae”) is a fermented drink originating from China, Korea, and Japan (220 BC). It is popular for its detoxifying, antioxidant, and energizing properties, and is also recognized as active against digestive problems [3,4]. This refreshing drink is obtained through the fermentation of sweetened tea, caused by the action of a “Symbiotic Culture Of Bacteria and Yeasts” [5], named SCOBY. The latter can also refer to the cellulosic film produced by specific bacteria on the surface of kombucha during fermentation [6]. The presence of specific strains of microorganisms (MOs) working as a symbiotic culture during fermentation prevents the contamination and growth of spoilage and pathogenic microorganisms [7]. Following inoculation of sweetened tea with a SCOBY and its liquid starter (fermented liquid produced by the previous kombucha batch [8]), the yeasts hydrolyze sucrose into glucose and fructose, which are in turn converted to ethanol as the main metabolite [9,10,11]. This alcohol is then used by the acetic acid bacteria (AAB) as a substrate to produce acetic acid via oxidation, leading to low levels of alcohol, although kombucha is considered a non-alcoholic beverage [12]. Additionally, AAB converts glucose to gluconic acid and cellulose (SCOBY), and fructose to acetic acid [6]. Moreover, the well-known [4,13,14,15] therapeutic effects of kombucha derive from its chemical composition, and mainly from the tea polyphenols activated and secondary metabolites produced during fermentation [13]. In aerobic fermentation conditions, a slightly carbonated and acidic refreshing drink is obtained, containing several organic acids, amino-acids, vitamins, tea polyphenols, and some hydrolytic enzymes [16].
Multiple factors affect the concentration of the different constituents present in non-alcoholic fermented beverages. Thus, the initial matrix and sugar contents [17], the fermentation duration [18], the incubation temperature [19], and the nature of the kombucha culture [20] mostly influence the concentration of the components of this complex beverage [21]. Lončar et al. (2006) point out that the fermentation time is the most influential parameter on the composition of the fermentation products, followed by temperature and the concentration of the liquid starter [3].
To date, the most prevalent and abundant SCOBY taxa are the yeast genus Brettanomyces and the bacterial genus Komagataeibacter (formerly Gluconobacter), sampling the upper and lower SCOBY layers, respectively [22]. Amongst the AAB identified by culture-dependent studies [23], Acetobacter xylinum (reclassified as Gluconacetobacter xylinus [24]) is considered as the most efficient cellulose producer in kombucha [25]. While Acetobacter species generally dominate [26,27], the genera Gluconacetobacter and Lactobacillus have occasionally been isolated [28]. The literature is inconsistent about the presence of lactic acid bacteria (LAB) in kombucha, as they are sometimes found in low concentrations [29,30] and simply not reported in other cases [7]. Moreover, fungal genera have also been identified, mainly Zygosaccharomyces, Saccharomyces, Dekkera, Pichia [16,31], Lachancea, and Starmerella [22].
Thus, the composition (organic acids, tea polyphenols, catechins, etc.), the physicochemical properties, and the aromatic compounds content in kombucha are not only dictated by the microorganisms present but also by the pathways they use during the fermentation process, all having a positive impact on the final product flavor [32,33].
The aromatic compounds in kombucha can be divided into three categories according to their origin: native from the used matrix (tea constituents and derived ingredients), from the saccharide source substrates, and from the metabolites produced by the microorganisms during fermentation [34]. The composition and concentration of VOCs vary according to the fermentation stages of the kombucha as well as the fermentation temperature [35]. Furthermore, the production of sapid metabolites such as organic acids during fermentation also adds to the overall sensorial experience [36]. The main VOCs reported in the literature are classified into six different families, namely carboxylic acids, alcohols, aldehydes, ketones, esters, and benzenoids [34].
Since the sensorial profile is the cornerstone for the development of kombucha as a beverage with mass market appeal, advanced analytical tools are needed to gain a better understanding of the kinetics of aromatic compounds during the fermentation process to control the sensory profiles of the drink.
That is why in this study, after analyzing the physico-chemical parameters of the beverage as a function of the fermentation key parameters (such as fermentation time and temperature for instance), the kinetics of volatile organic compounds was determined using stir bar sorptive extraction—gas chromatography—mass spectrometry (SBSE−GC−MS), which allows an optimal capture of volatile and semi-volatile compounds in aqueous matrices [37,38]. The correlation with microbial metabolic pathways was then established.
As mentioned earlier, although kombucha presents a complex mixture of VOCs, only a part of them contribute to the overall aroma and influence consumer perception. Ortho-nasal detection odor thresholds were thus considered to determine odor-active compounds and evaluate consumer perception of kombucha. Eventually, this methodology will result in—by understanding the main fermentation parameters impacts on the kombucha process—the designing of new drinks by controlling the fermentation process to optimize their aromatic profile for gaining consumer acceptance.

2. Materials and Methods

2.1. Materials and Chemical Reagents

The Chun Mee Moon Palace green tea and Lien Son black tea leaves used in this study were sourced from China (Zheijiang) and Vietnam (Yen Bai), respectively, and were certified to be organically grown (limiting the probability of undesirable molecules in the beverage). Sucrose used for the fermentation was a beet refined white sugar from Tirlemont (Belgium). This sucrose type avoided the development of any additional taste and allowed to increase the alcohol level by favoring the yeast’s activity during the fermentation [4]. The culture medium used for tea fermentation was a symbiotic culture of bacteria and yeast (SCOBY) from Fairment (Berlin, Germany). This cellulose biofilm was preserved in kombucha. Enzytec enzyme kits for the determination of sugar, ethanol and acid content of the samples were obtained from R-Biofarm (Pfungstadt, Germany). The solvents used in this study were of analytical quality.

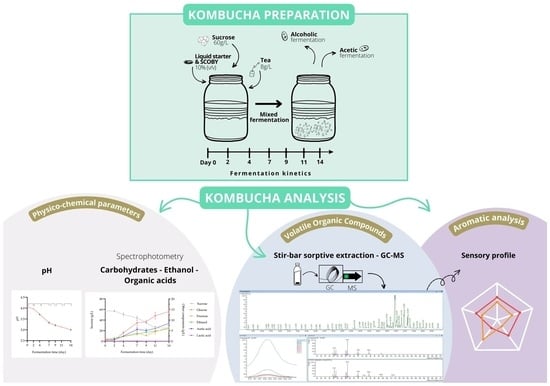
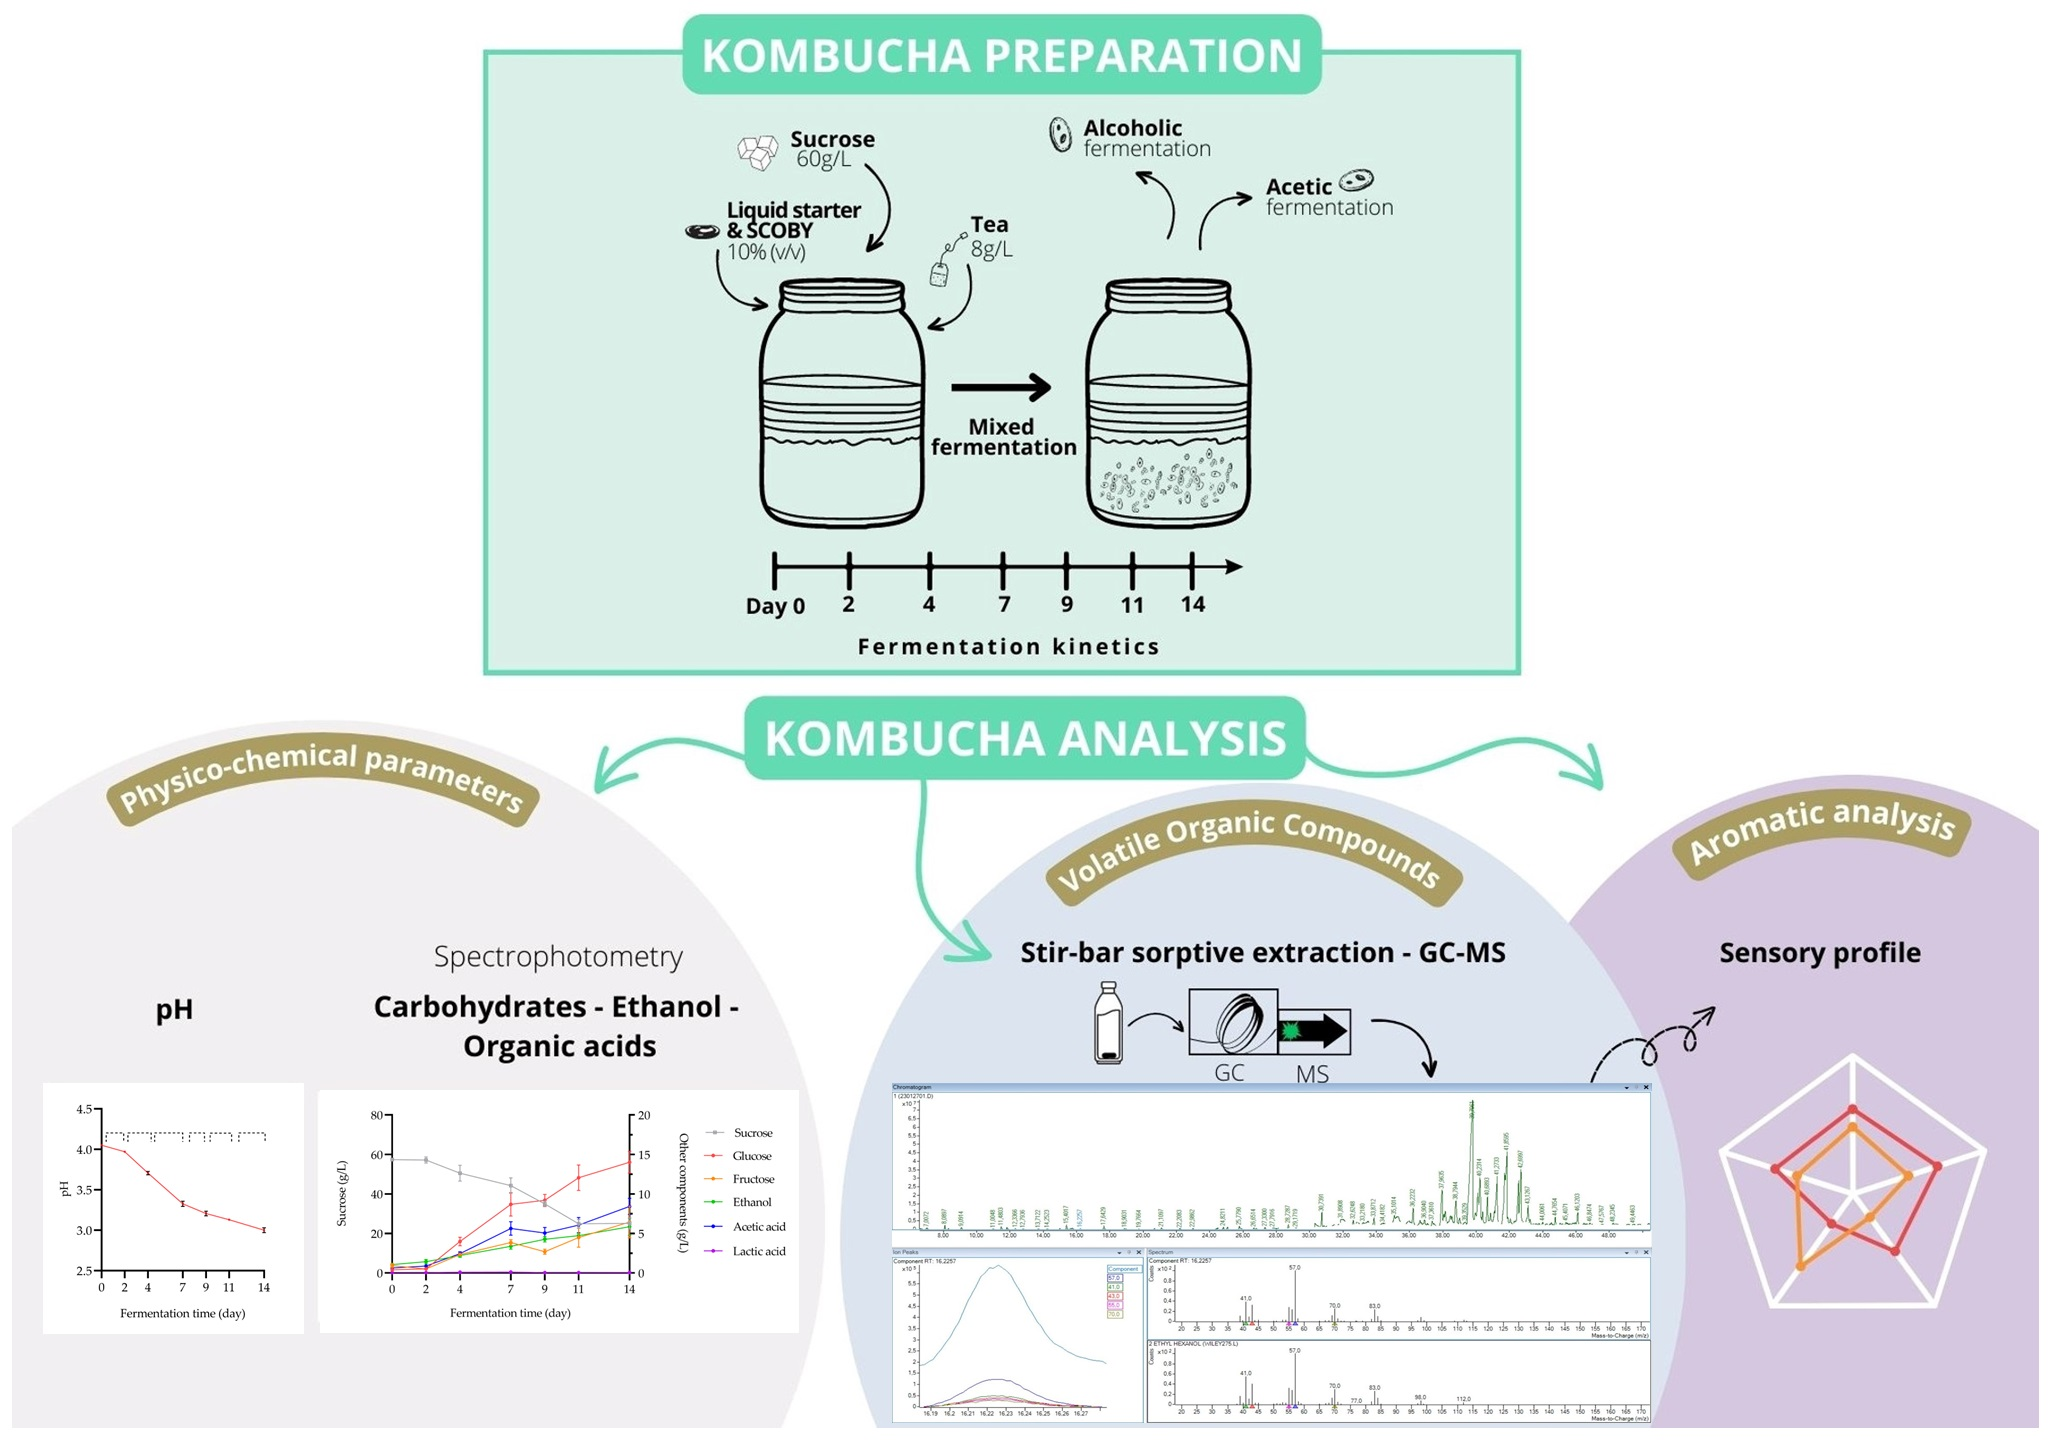
2.2. Kombucha Preparation

The tea was prepared by infusing Chun Mee Moon Palace green tea leaves and Lien Son black tea (1:1) with a total concentration of 8 g/L in mineral water previously heated to 75 °C [35]. After infusing for 10 min, the tea solutions, made in three repetitions, were filtered and sweetened with white beet sugar (60 g/L) [3,35]. Once the solutions were cooled (<35 °C), the culture medium composed of SCOBY and its liquid starter was added at a concentration of 10% (v/v). The containers were covered with a gauze held by an elastic band (aerobic conditions) and then placed in the oven (Memmert UF55) for fermentation for 14 days at 20 and 30 °C, respectively [16]. Measurements of the kinetics were taken on day 0, 2, 4, 7, 9, 11, and 14 of fermentation (referred to as D0, D2, D4, D7, D9, D11, and D14 later in the manuscript). Each day of measurement, a volume of 10 mL was sampled and placed at −20 °C to carry out the different determinations and to evaluate the fermentation kinetics.

2.3. Dynamic Analysis of the Physico-Chemical Parameters of the Drink

The pH was measured with a pH meter (Hach BeRight; SensION+ pH1; S/N 605069; IP67, Hach Company, CO, USA). The pH during the fermentation was monitored via direct measurement in the fermentation medium every sampling day.
Quantification of the major components, namely ethanol (EtOH), carbohydrates (glucose, fructose, sucrose), and organic acids (acetic and lactic), was performed with spectrophotometry (Molecular devices SpectraMax ABSPlus; S/N ABP00716, LLC, San Jose, USA) using colorimetric enzyme kits (R-Biopharm, Darmstadt, Germany). For these quantifications, the sample was diluted in 200 mM pH 7 phosphate buffers (except for lactic acid where the phosphate buffer was at pH 8). These assays were performed on the samples collected to obtain the kinetics (production/conversion) of these molecules of interest. Ethanol determination was performed at the end of the fermentation process to ensure that the levels are below 1.2%, per the European legislation (1169/2011) (0.5% for non-EU countries [39]) for being considered as a non-alcoholic drink [12].

2.4. Chromatographic Analysis of the Development of Volatile Organic Compounds

Volatile organic compounds were characterized using GC-MS [38,40,41]. Beforehand, VOCs were sampled via sorption on a magnetic bar (SBSE Gerstel-Twister 10 × 0.5 mm) coated with polydimethylsiloxane (PDMS) as the adsorption resin [42]. The magnetic bars were conditioned in 10 mL of a solution of ACN/H2O (50/50 v/v) under magnetic stirring for 2 h; then, the magnetic bars were rinsed with distilled water and dried under nitrogen flow for 2 h at 260 °C (initial temperature of 40 °C, flow of 10°/min, pressure of 2 bars) in a thermo-desorption tube. For the samples analysis, they were thawed in a water bath (30 °C) and homogenized; a 5 mL sample was transferred into a vial, and NaCl was then added to reach a concentration of 20% (w/v). A conditioned SBSE was then placed in each vial and agitated with a magnetic stirrer for 2 h. The magnetic bar was then rinsed with distilled water and partially dried with absorbent paper. A total of 1 µL of heptan-1-ol at a concentration of 100 mg/L (in ethanol) was added to each sample as the internal standard. VOC analysis was performed using gas chromatography (GC Agilent Technologies 7890A) coupled with mass spectrometry (5975C). The injection was performed in the split-less mode with a flow rate of 1.2 mL/min, using helium as the carrier gas. The column used was a Carbowax 20 M, with dimensions 30 m × 250 µm × 0.25 µm. The temperature gradient of the oven was as follows: 40 °C for 2 min, then 6 °C/min until 300 °C for 5 min. The total analysis time was 50 min. Retention indices (RIs) were calculated based on a mixture of n-alkanes between C6–C30 (Sigma Aldrich, Darmstadt, Germany) [43,44]. The chromatograms of the samples were analyzed with the Mass Hunter Analysis software (B.08.00 software, Agilent Technologies, Santa Clara, California, USA), and the identification of the VOCs was performed by comparison to the NIST17 and WILEY275 spectral libraries (National Institute of Standards and Technology, Gaithersburg, USA) and RI from the literature [45]. To optimize compound identification and data processing, the following filters were applied as a first rough compound sorting on the raw data: match factor (percentage of probability of correct identification of the compound under consideration) ≥70% and maximum area under the curve ≥0.05% (except for aroma analysis: ≥1%). Next, a manually disciplined treatment approach consisted in the validation of all molecules one by one, referring to the mass spectrum by consulting the spectra of reference molecules in the literature. Additionally, RI was finally considered to match the validation hypothesis [41].
The semi-quantification of volatile compounds was calculated relative to the injected internal standard. The determination of OAV (odor-activity value) was calculated as a function of the considered compound concentration in the sample divided by its orthonasal detection perception threshold in water, referred in the literature [46]. This concept allowed to study the contribution of the compounds to the aroma of the drink [47].

2.5. Raw Data Analysis

All chemical analyses and fermentation medium measurements were performed in three replicates, and the values were expressed as means (n = 3) ± standard deviation (SD). Basic statistical data processing was performed using GraphPad Prism (8.0.1 software, GraphPad software Corporation, San Diego, California, USA) and Microsoft office Excel (Excel 2021 software, Microsoft Corporation, Redmond, Washington, USA) software. Student’s t-tests were performed on the pH and the spectrophotometry data to determine if there were significant differences (n = 3; α = 5%) measured between the stages of fermentation.
Principal component analysis (PCA) using the Spearman correlation matrix was conducted on mean VOC class concentrations, considering kombucha fermentation stages as variables. PCAs were performed on all VOC concentrations, considered as individuals. Kombucha fermentation stages were represented as vectors. Principal components PC1 (Dim1) and PC2 (Dim2) were considered and reported in this article. Variables representation quality was illustrated as cos² values, rated by contribution scale. PCAs were performed in R (R 4.0.2 software, R Development Core Team, Boston, United States).

3. Results and Discussions

The set of experiments carried out in this study included the fermentation of kombucha at two different temperatures: 20 and 30 °C. The choice to present and discuss only the results obtained under the 30 °C temperature modality was made considering the similar trends observed in the results between the two temperatures implemented. Moreover, 30 °C temperature modality induced the most optimal fermentation from the development point of view of the various organic acids [29,34,35] not to mention that the controlled fermentation time and the set liquid starter concentration were indicators influencing the beverage [3]. However, as the fermentation temperature might induce variations in the VOC synthesis and ultimately on the aroma profile of the drink, an insight on the temperature impact is proposed in this manuscript (by considering the modality of 20 °C), regarding Section 3.2.2.

3.1. Physico-Chemical Characterization of Kombucha during Fermentation

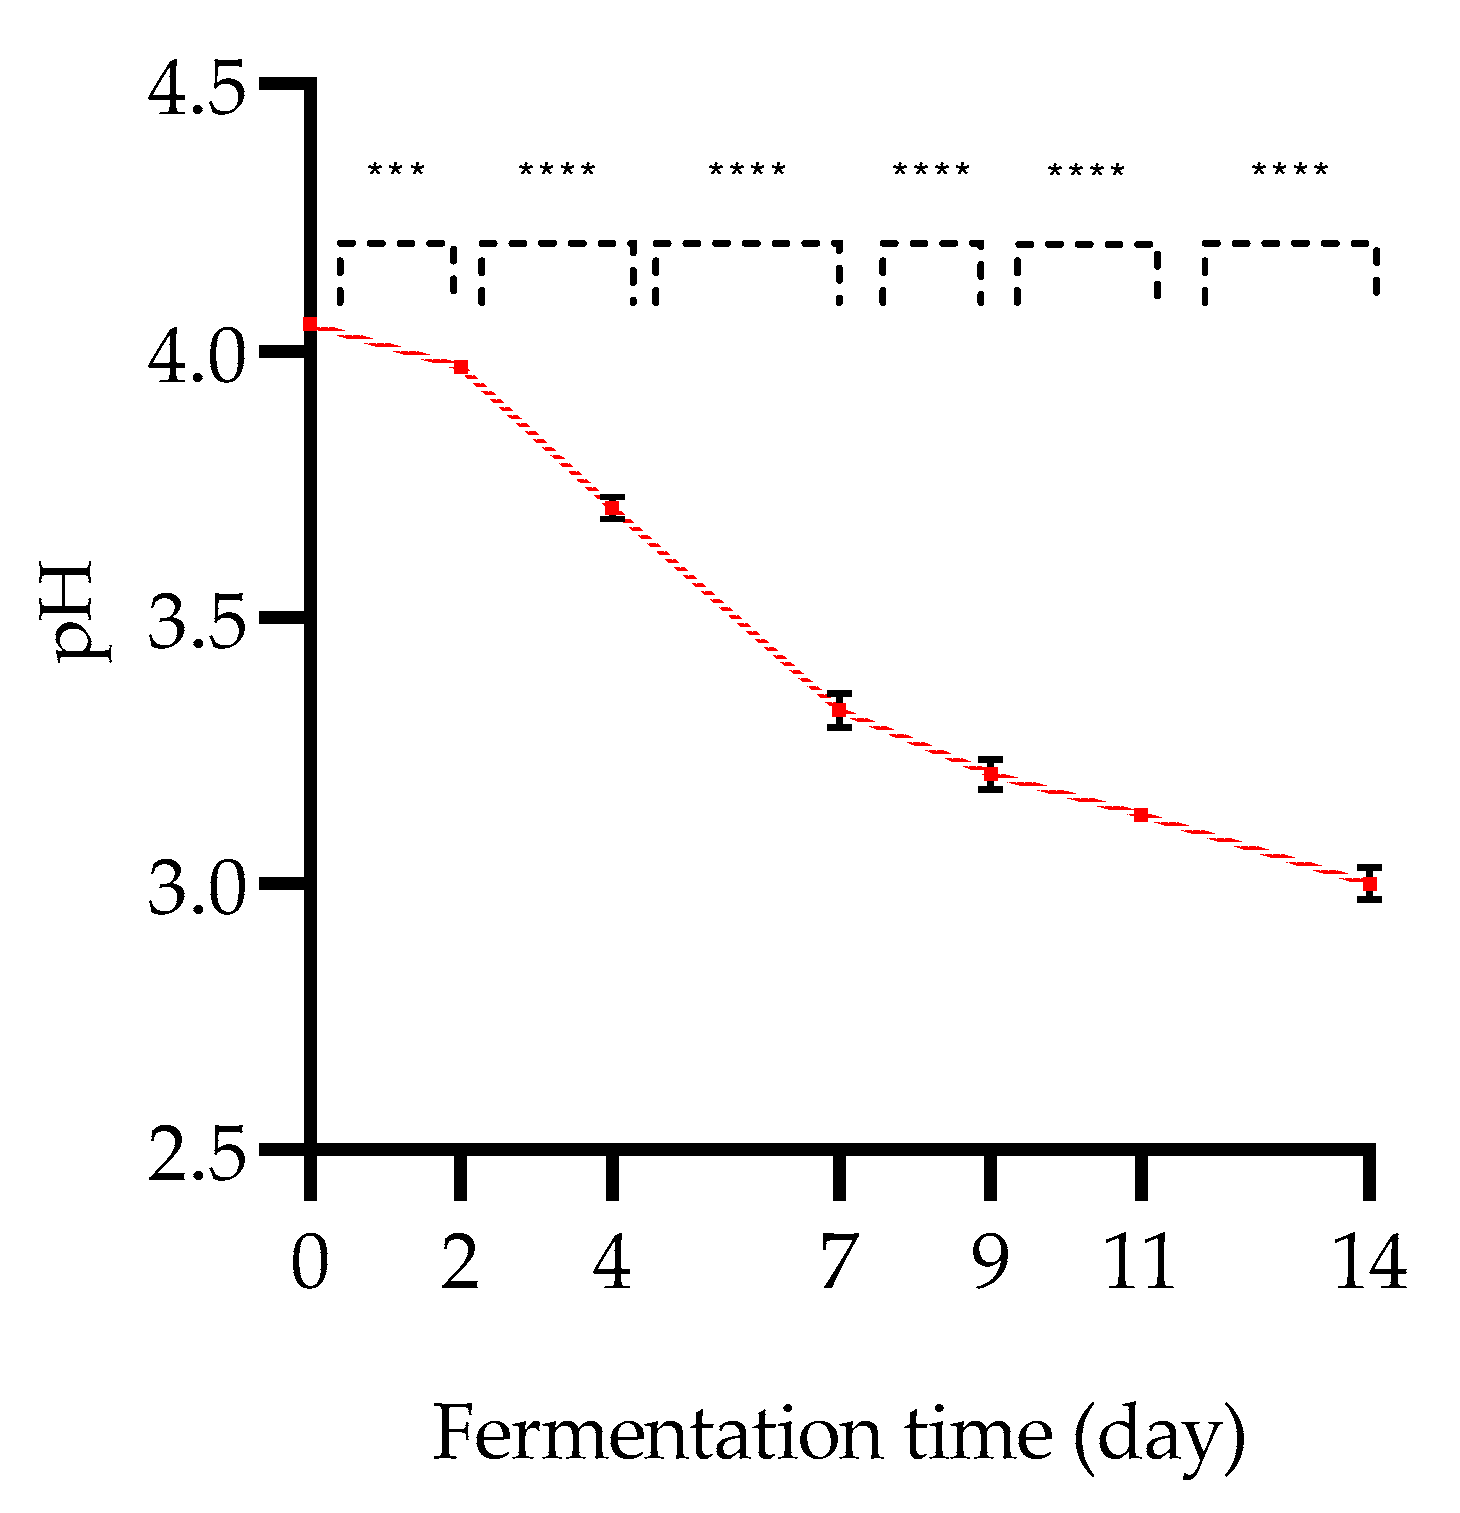
3.1.1. Evolution of pH during Fermentation

As shown in Figure 1, the initial pH was 4.05 ± 0.00 and decreased to 3.00 ± 0.03 after 14 days of fermentation. The evolution of the pH decreases linearly and constantly throughout the fermentation, although very high significant differences (p < 0.0001) are measured all along the fermentation.
The study by Zhen-ju Zhao et al. (2018) focusing on kombucha fermentation also describes a decrease in pH during fermentation [7,26,34,36,48]. In addition, the sequencing of a rapid decrease in pH at the beginning of fermentation (0–10 days) followed by a slower decrease at the end (10–14 days) has been demonstrated [9,34]. Indeed, both parameters are indirect evidence of the growth of MOs present in the consortium and the accumulation of flavor metabolic products [9,16,19,34].

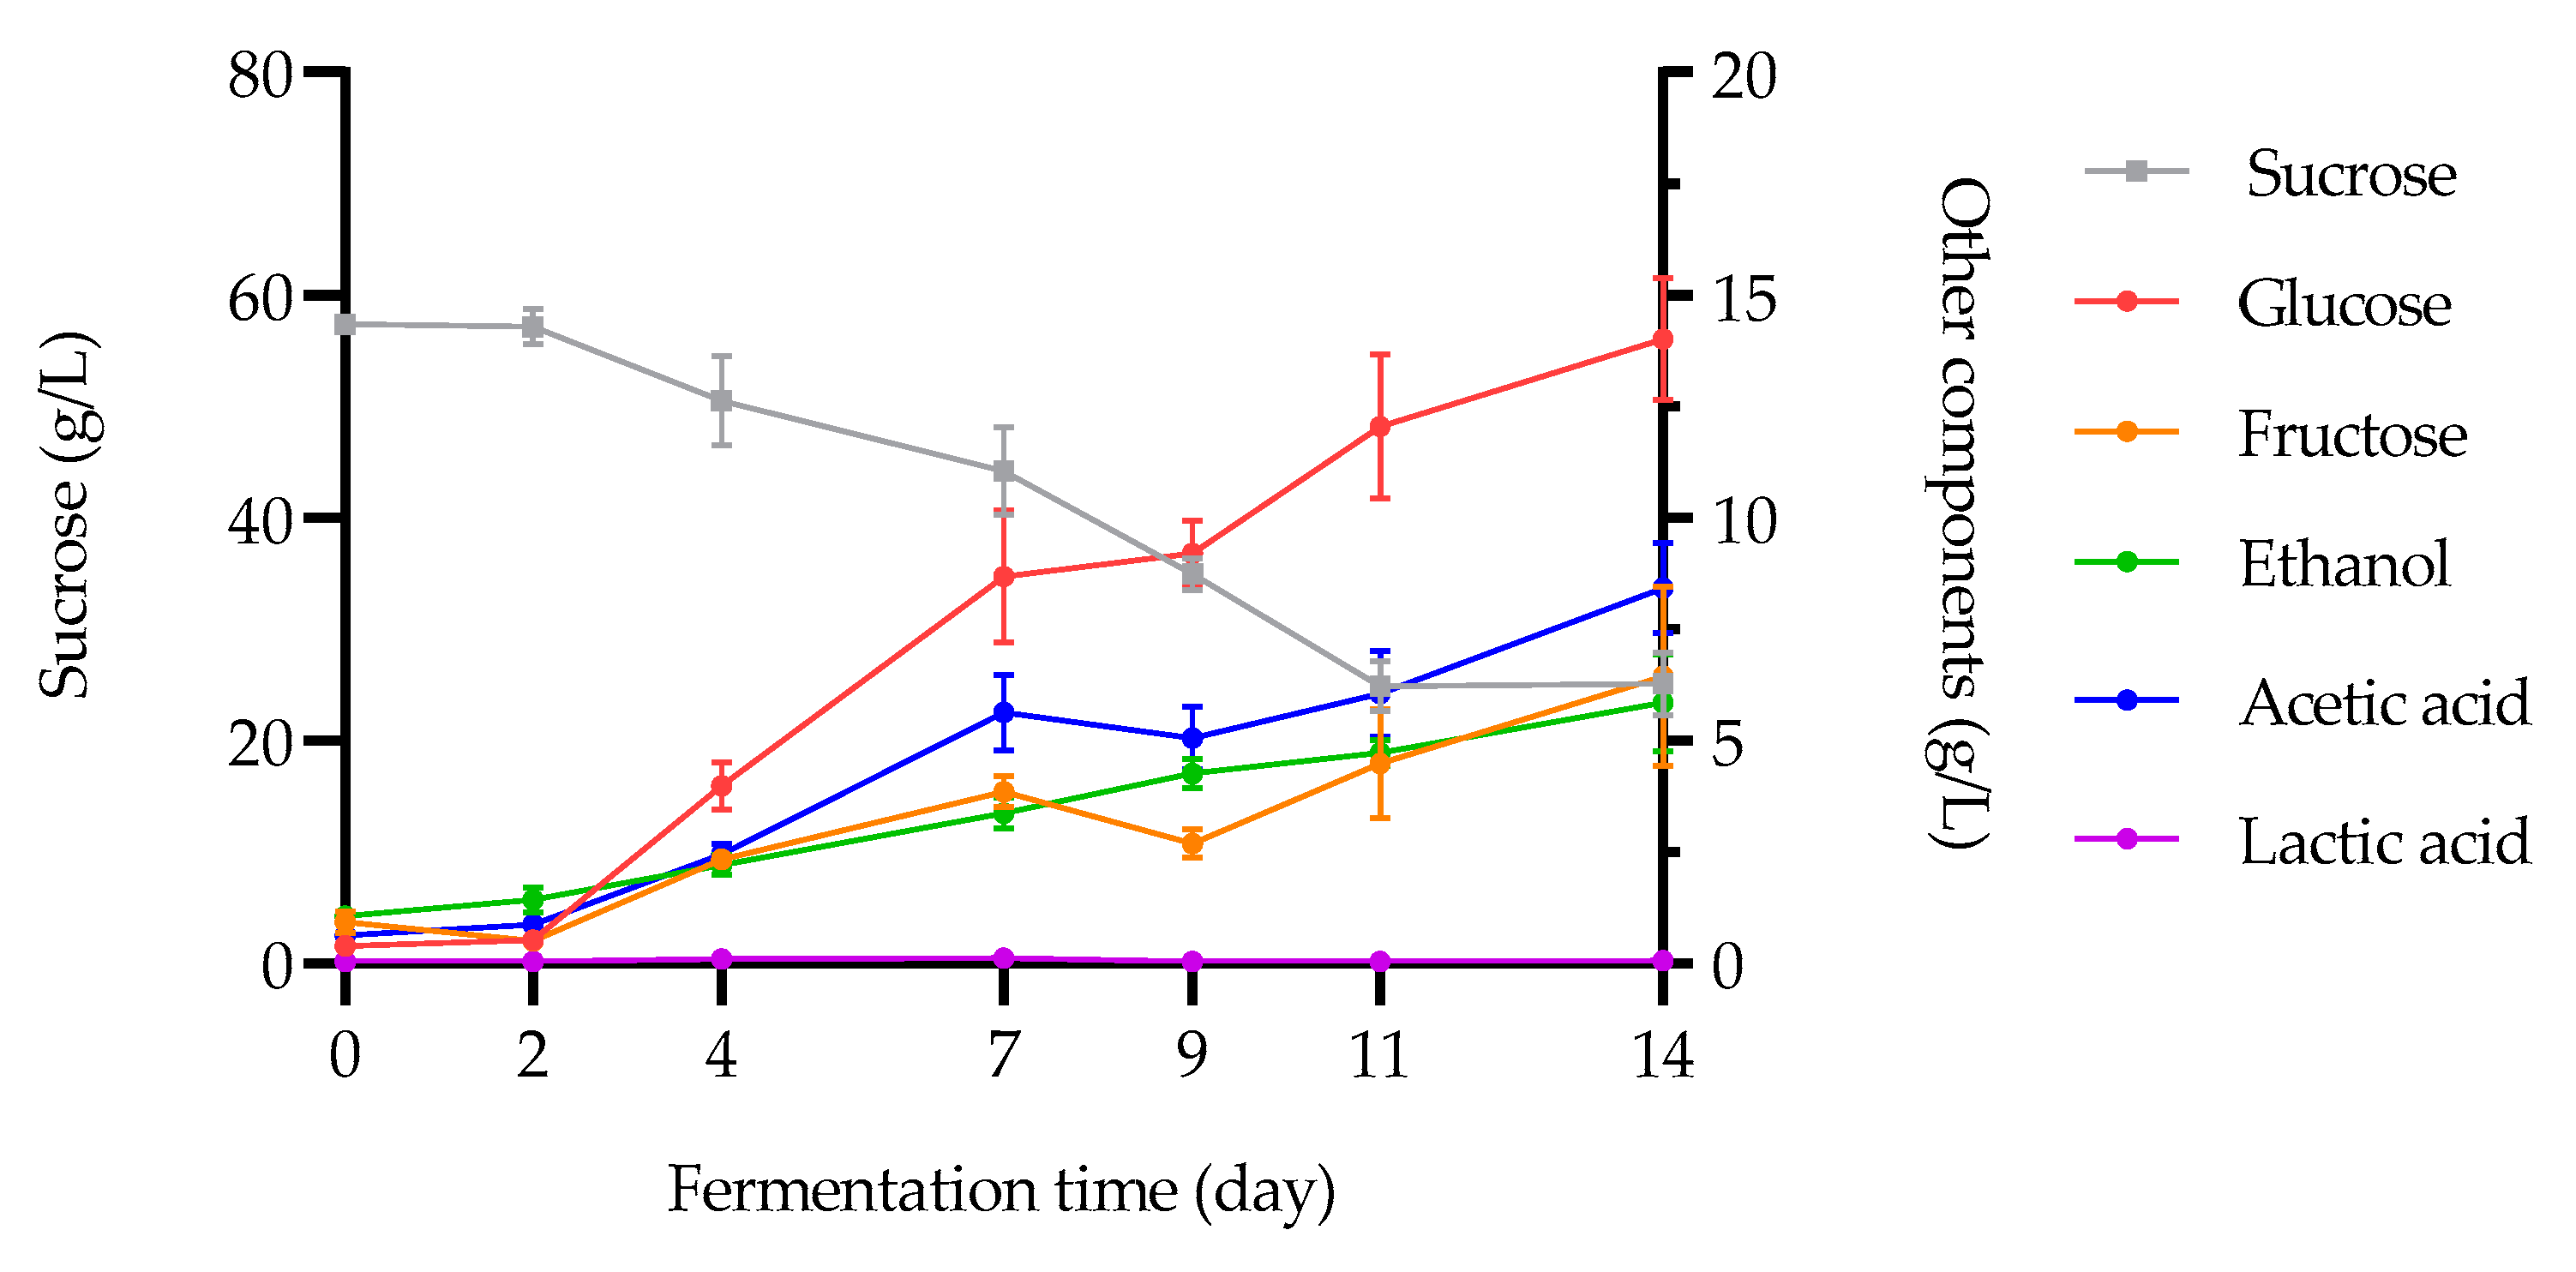
3.1.2. Carbohydrate, Alcohol, and Acid Concentration Kinetics during Kombucha Fermentation

The evolution of the concentrations of carbohydrates, alcohol, and organic acids during kombucha fermentation is presented in Figure 2.
First, the sucrose concentration decreases in a very highly significant way (p < 0.0001) over time (from 57.4 g/L ± 0.09 at D0 to 25.2 ± 2.85 g/L at D14), with a highly significant decrease (p < 0.01) in sucrose content between D7 (44.2 ± 3.92 g/L) and D11 (24.9 ± 2.22 g/L). The amounts of residual sucrose are in accordance with those reported from previous studies on black and green tea kombuchas [17,34]. Degradation kinetics of this disaccharide by the yeast taxa into glucose and fructose units through the glycolysis pathway [49] allows the assimilation of simple sugars by them [7,50]. As a result, since the concentration of simple sugars is inversely proportional to that of sucrose, it increases during fermentation [3]. The concentration of glucose (from 0.40 ± 0.21 g/L at D0 to 14.0 ± 1.38 g/L at D14) in the fermentative medium is higher than that of the fructose (from 0.93 ± 0.24 g/L at D0 to 6.45 ± 2.03 g/L at D14), increasing in a very highly (p < 0.0001) and a highly (p < 0.01) significant way over time, respectively. In fact, during the hydrolysis of sucrose, yeasts convert fructose and glucose simultaneously to ethanol and CO2 on the one hand, with a more rapid utilization of fructose as compared to glucose [7,9]. On the other hand, the AAB preferential carbon source is glucose, principally for SCOBY, resulting in cellulose synthesis [9,34,48,49,50,51].
Ethanol evolution increases in a highly significant way (p < 0.01) during the fermentation process, starting from 0.13 ± 0.02% at the initial stage until 0.74 ± 0.14% at the final stage. Ethanol synthesis at the beginning of fermentation is a trend observed in the literature [7,52], correlated with an exponential increase in the yeasts population growth [17,34]. Previous studies reported a final ethanol content of approximately 0.5% [36] and 0.6% [35] after 12 and 20 days of fermentation, respectively (for initial sucrose contents of 50 and 100 g/L, respectively). The kinetics of ethanol production can be explained by the initiation of Saccharomyces genus to the yeasts metabolic activity, the first actors in the fermentation, which synthesize ethanol thanks to the availability of carbonaceous and nitrogenous substrates as well as oxygen in the medium [7,50]. In addition, these low levels of ethanol in the samples at the end of fermentation are below the 1.2% (v/v) per the European regulation (1169/2011) for considering it as an non-alcoholic drink [12].
Moving to the composition of the kombucha microbiome provided by the liquid starter and the kombucha SCOBY, the ethanol produced by the yeasts is converted via various fermentative pathways into organic acids by different bacteria [16,20,48,49,50]. Therefore, among these organic acids, the kinetics of acetic acid production are staggered in time to that of ethanol: starting from 0.63 ± 0.07 g/L at the initial stage to reach 8.42 ± 1.03 g/L at the final stage (p < 0.001). Studies reported the start of acetic acid production at D3 [51] and an exponential increase in bacteria population growth from this stage [34].
Despite the very low values measured considering lactic acid synthesis during the fermentation process, it increases significantly, ranging from 0.05 to 0.06 ± 0.00 g/L for the initial and final stages, respectively (p < 0.05). Indeed, LAB represent a minority share of the microbiome present in the kombucha SCOBY compared to AAB [19,22]; lactic acid is therefore less produced compared to acetic acid.
Once the organic acids have been synthesized by the microbiome, the inhibition of some and the evolution of others towards the synthesis of aromas allows the production and evolution of these acids to be highlighted.

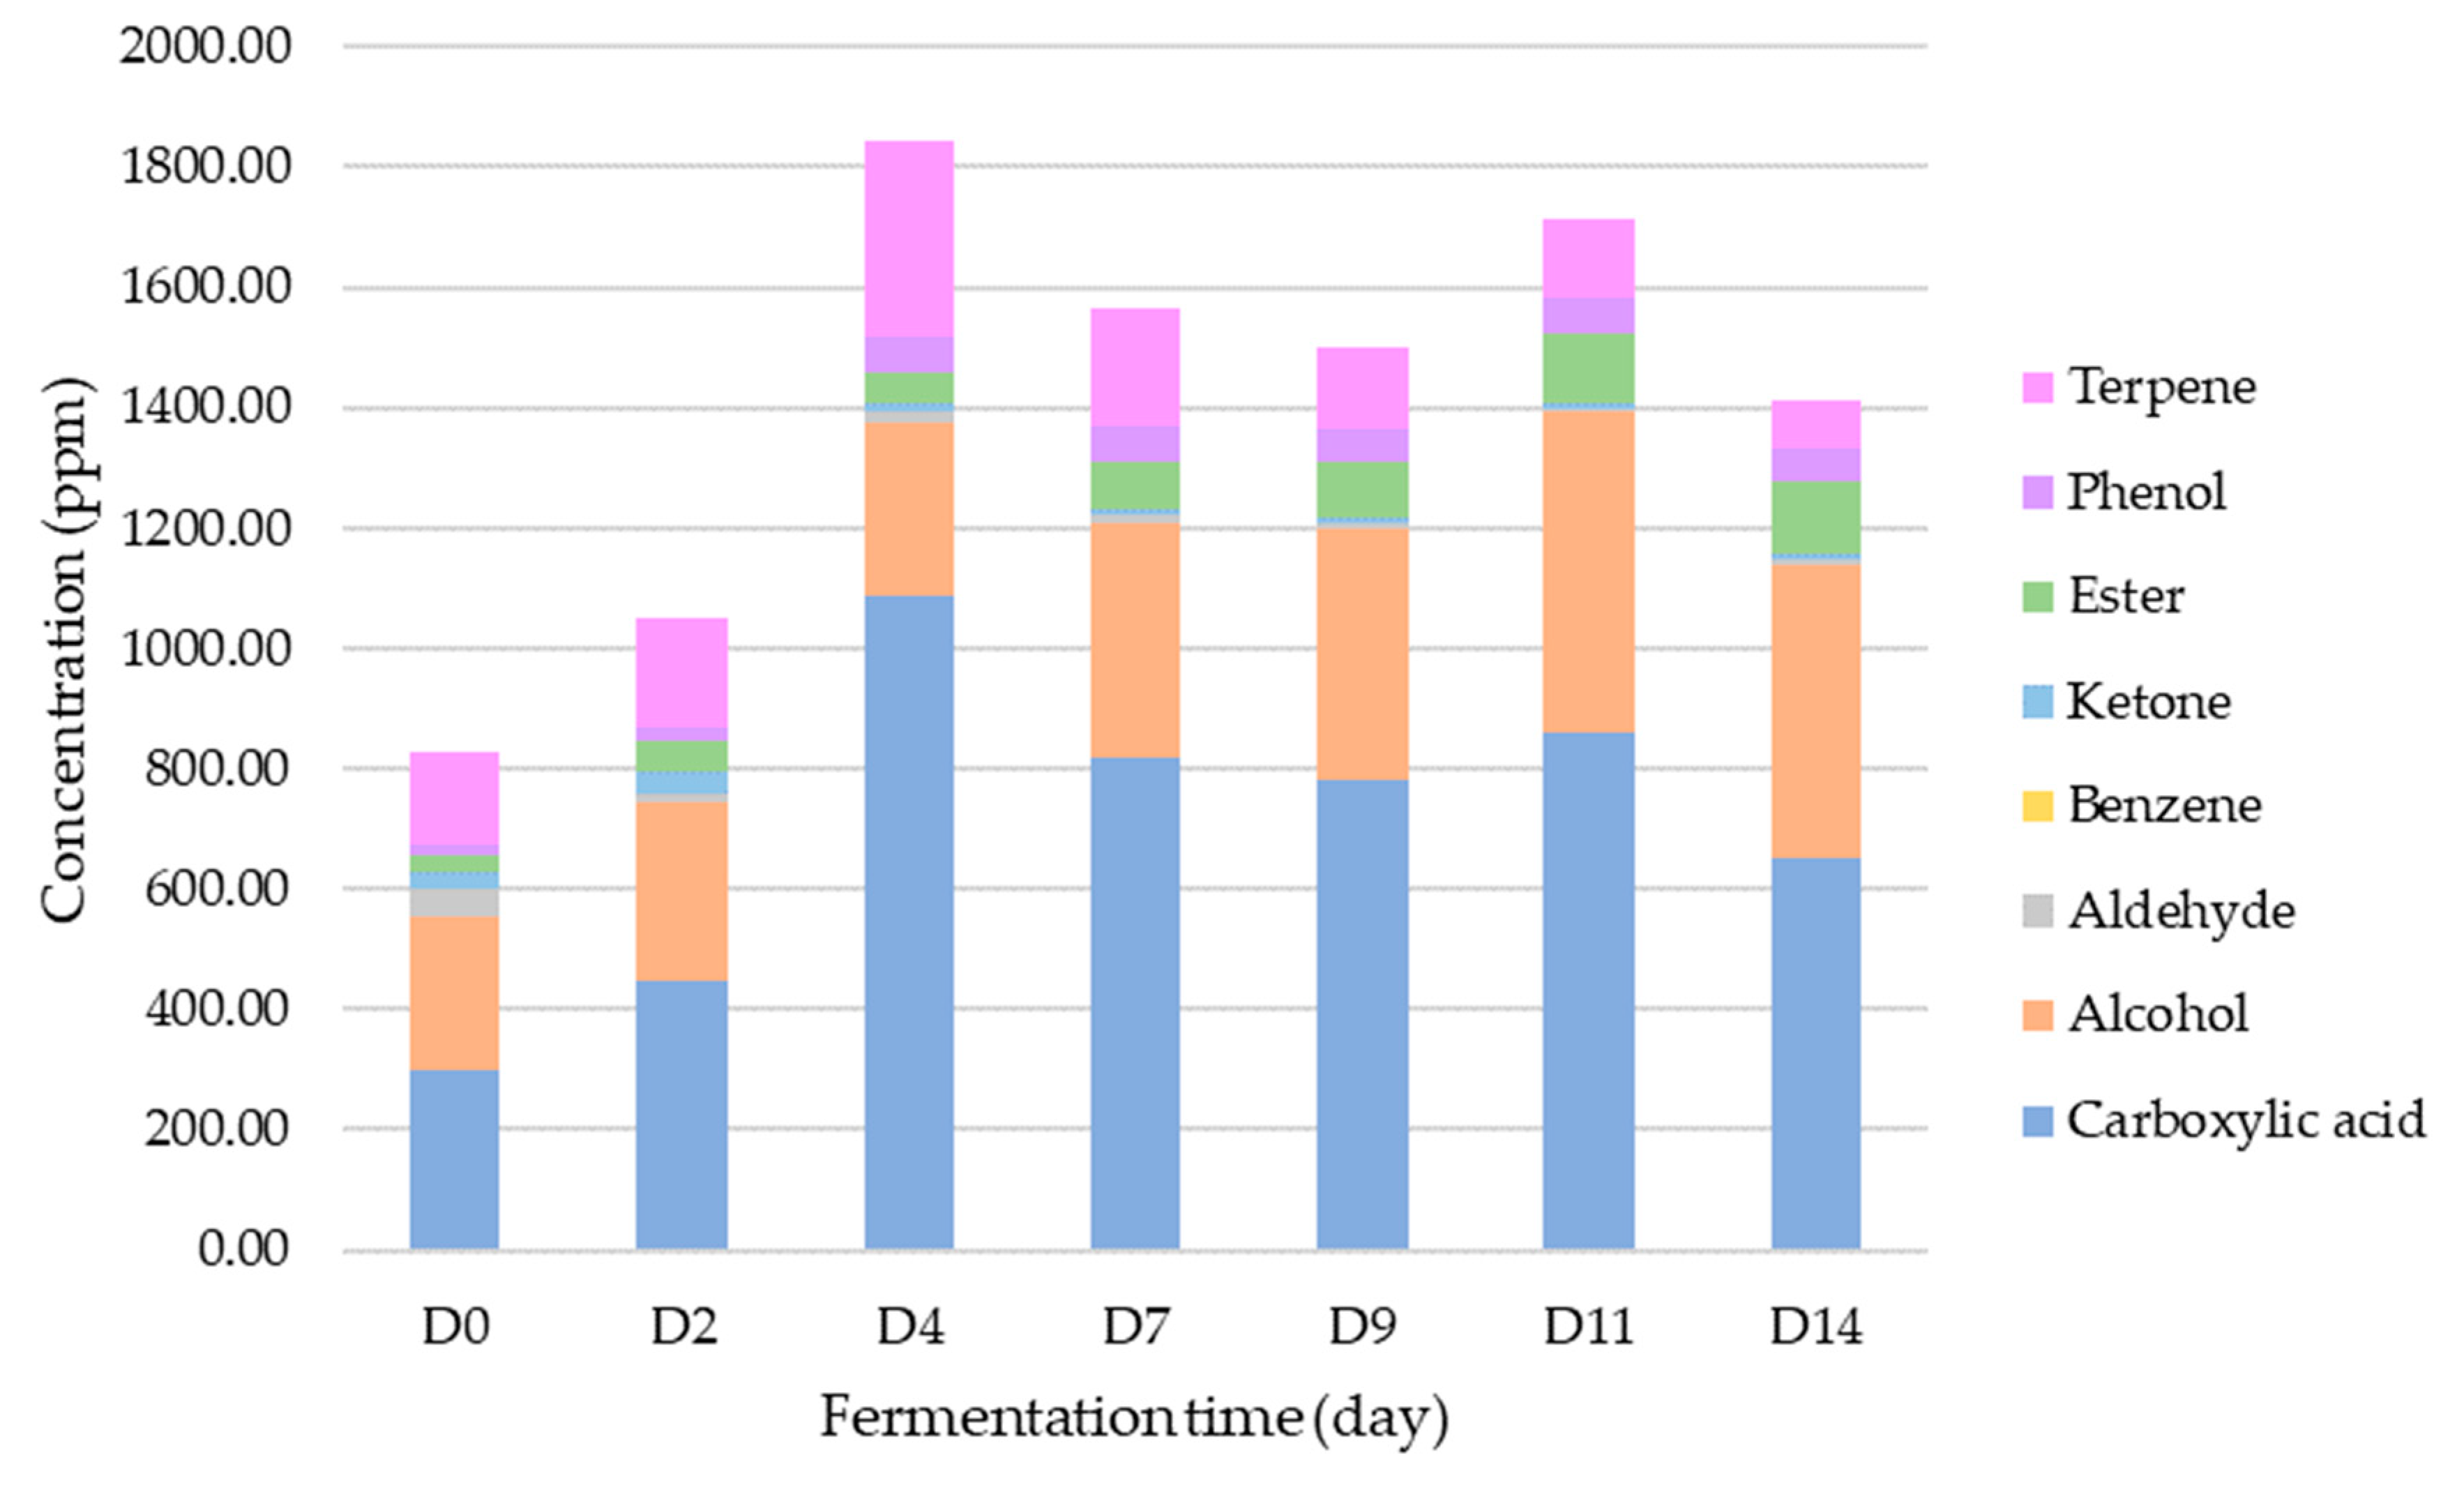
3.2. Study of the Development Kinetics of Volatile Organic Compounds

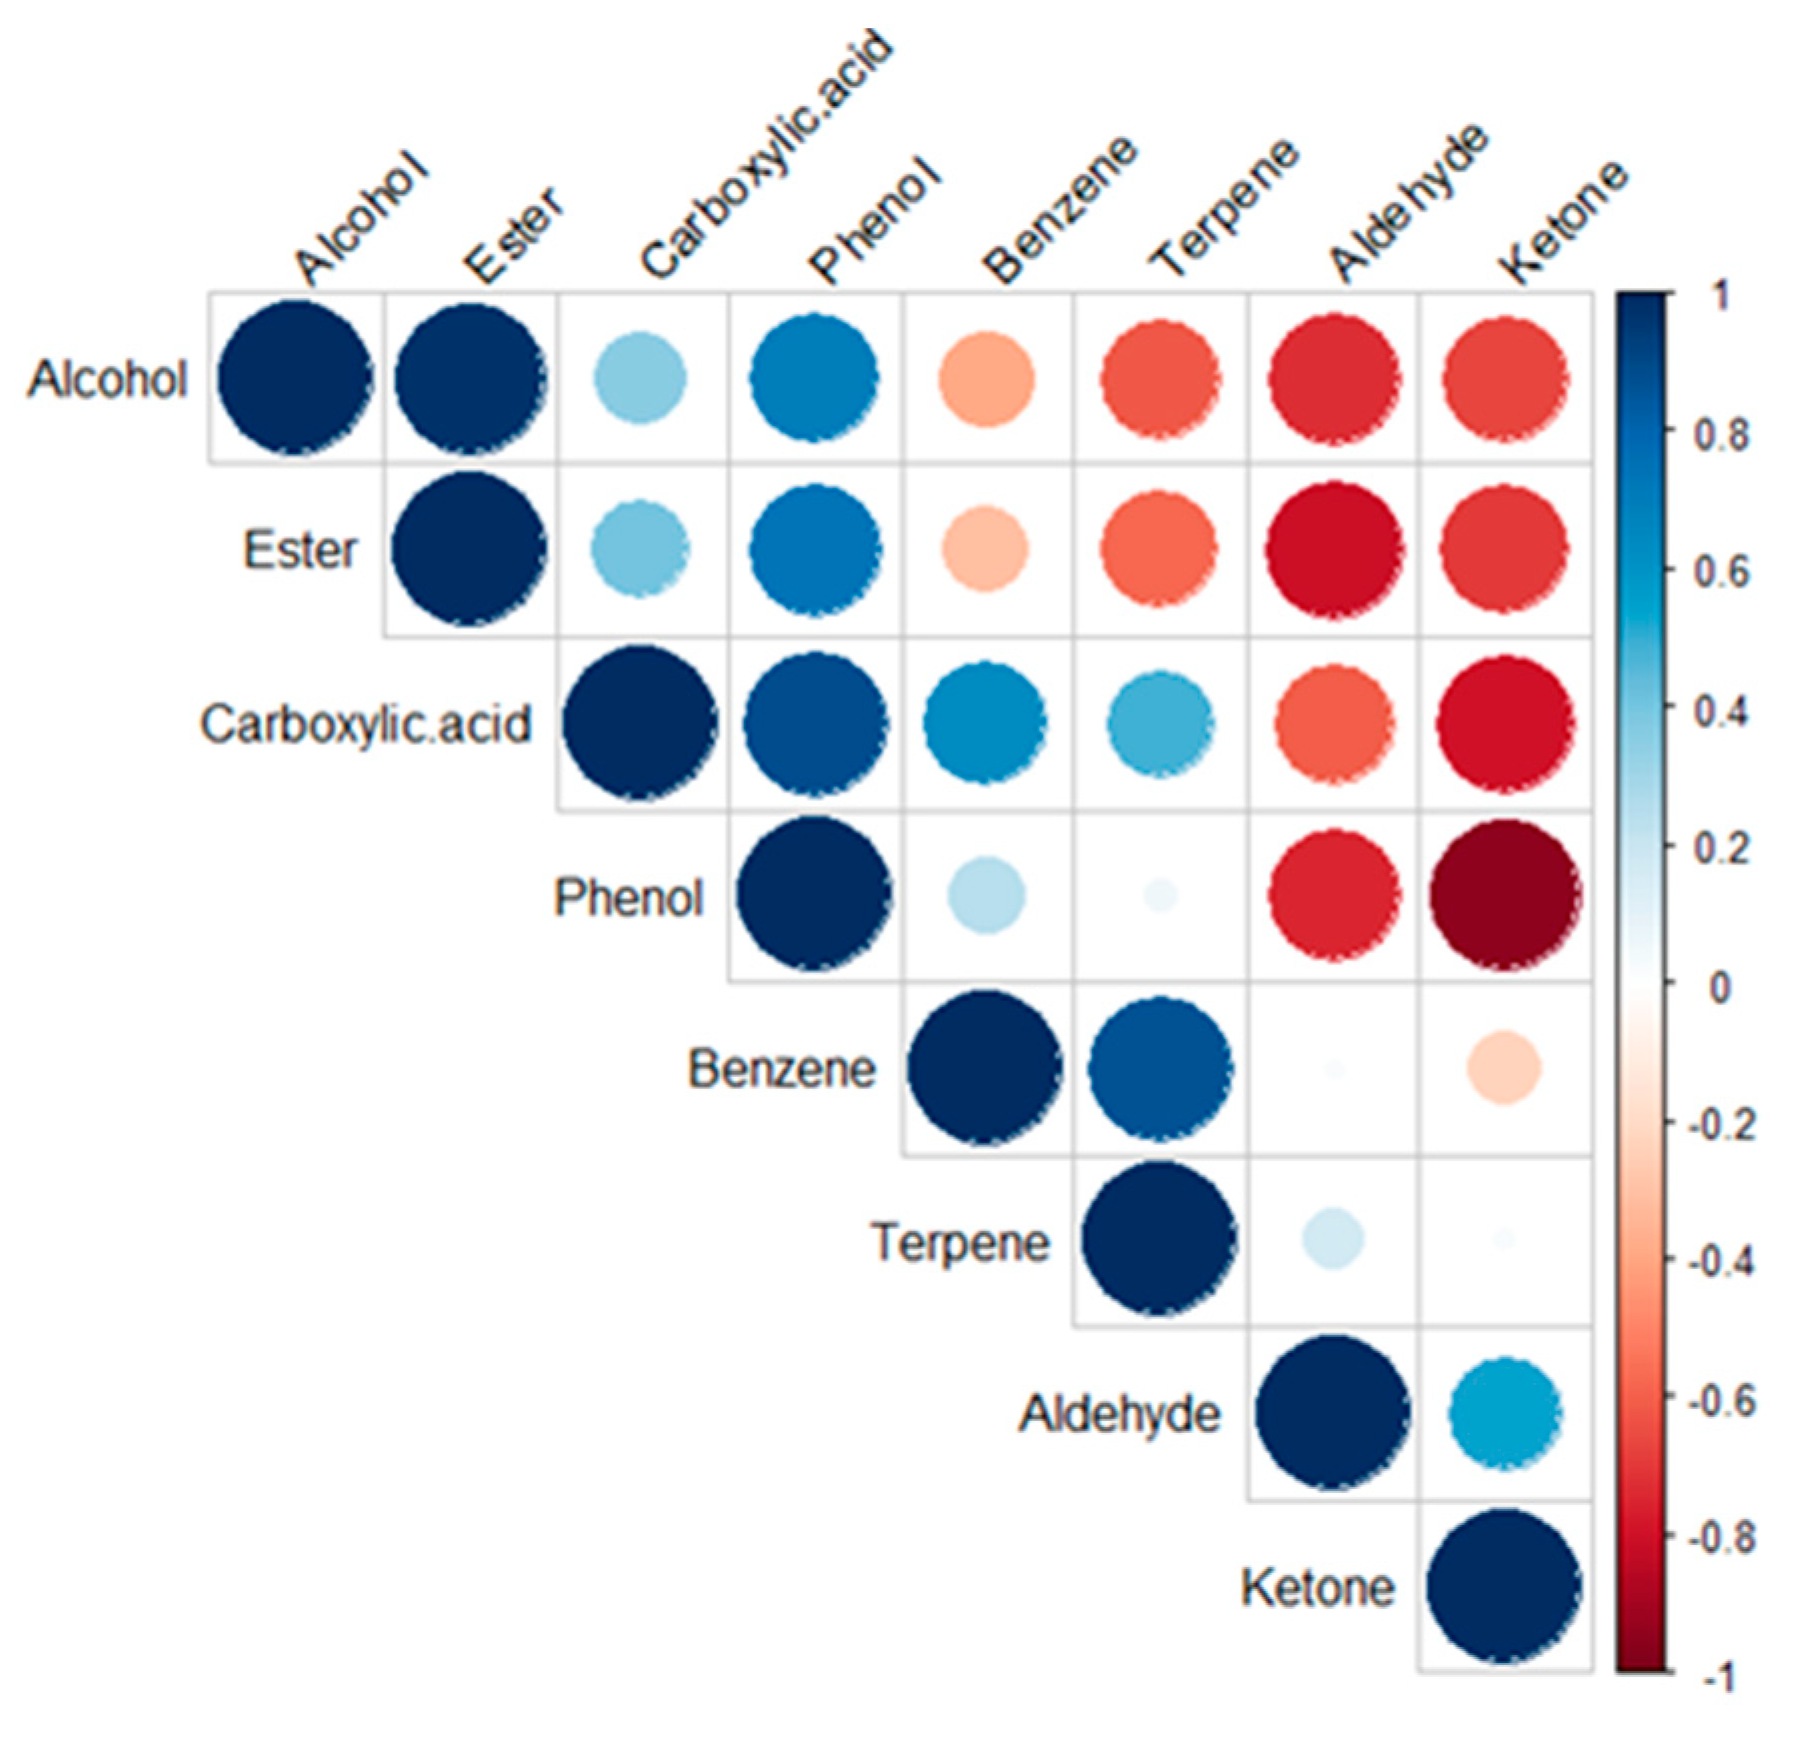
3.2.1. Chemical Analysis of Major VOCs and Metabolic Pathways Involved in Fermentation

The evolution of VOC content in the raw matrix and during the kombucha fermentation process is shown in Table 1. A total of 87 VOCs were detected in kombucha during the fermentation stages, including 28 carboxylic acids, 23 alcohols, 10 ketones, 9 terpenes, 7 esters, 7 aldehydes, 2 phenols, and 1 benzene. In fact, the SBSE technique tends to capture VOCs and semi-VOCs from both the aqueous and gaseous phase of the matrix [37,38]. In this case, sensitivity is increased as compared to routine extraction techniques such as SPME or HS-SPME [34,37].
From a global point of view, all reported classes (except for esters and phenols) are found in the raw matrix. Indeed, the fermentation process changes dynamically the VOCs tea profile into a different mixture of compounds [7,33,34]. These families of molecules are mainly metabolites synthesized by the microbiome on the basis of organic substrates present in the environment [16,36]. Metabolic pathways relative to kombucha fermentation are adapted to the nutrients present in the tea (mainly nitrogenous compounds) [17,35].
Classes found in the tea matrix globally tend to decrease during fermentation (namely carboxylic acids, aldehydes, benzenes, ketones, and terpenes). Fatty acids are a specific type of carboxylic acids in the tea matrix [36,53,54]. The compounds found in the highest concentrations are hexadecanoic acid (568.52 ppm and 427.35 ppm in black and green teas, respectively), (E)-hexadec-9-enoic acid (226.30 ppm and 129.69 ppm in black and green teas, respectively), and pentadecanoic acid (150.78 ppm and 102.42 ppm in black and green teas, respectively). Total concentrations of carboxylic acids are 1222.65 ppm and 994.75 ppm for black and green tea, respectively.
Terpenes are also mainly present in tea (representing a total concentration of 635.88 ppm and 669.93 ppm for black and green teas, respectively) with major compounds such as squalene (563.30 ppm and 510.25 ppm in black and green teas, respectively) and limonene (60.22 ppm and 121.01 ppm in black and green teas, respectively). Terpenes present diverse properties involved in chemical resistance of tea plant against biotic and abiotic stresses [55,56]. More precisely, squalene is a natural lipid of the triterpene class involved in the synthesis of cholesterol, steroid hormones, and vitamin D [57]. Limonene has a fruity, acidic aroma and is known for its antiseptic, antiviral, and sedative properties [58].
The synthesis of new compounds during the fermentation is also reported [7,34,36] (both introducing new compounds into existing classes (carboxylic acids and alcohols) and new full-fledged classes (esters and phenols)). Moreover, carboxylic acids are also the major components of the fermentation process, followed by alcohols. The use of these two classes of molecules as a basis for the formation of other types of compounds such as esters [59], phenols, and terpenes mainly (molecules formed using aldehydes and ketones) is reported in the literature [34,60].
Carboxylic acids mostly found during the kombucha fermentation are decanoic, hexadecanoic, hexanoic, and octanoic acids, synthetized during fermentation process to reach final concentrations of 89.08 ± 7.94, 47.75 ± 12.37, 51.37 ± 9.61, and 303.54 ± 9.94 ppm, respectively. These major compounds are reported in previous studies [34]. Total carboxylic acid content at the end of fermentation is 653.95 ppm. Major alcohols metabolized during fermentation are 2-phenylethanol and 3-methylbutan-1-ol, reaching 273.15 ± 2.16 and 113.39 ± 8.02 ppm at the final fermentation stage (for a total alcohol content of 484.51 ppm).
Alcohols found in kombucha are mainly metabolites of Saccharomyces yeasts [51,60,61]. More precisely, mixed fermentation allows the production of enriched VOCs profiles by non-Saccharomyces yeast strains such as Zygosaccharomyces sp., Dekkera sp., Candida sp., and Pichia sp. [13,22,33]. They contribute to the final aroma of the product but also to the formation of organic acids by their oxidation [1,61]. Together with aldehydes principally, they are the main substrates for the formation of organic acids and esters by the metabolic pathways of the bacteria present in the SCOBY [34]. In other words, alcohols are used by the MOs to synthesize aromatic volatile acids that acidify the medium [36,60].
Intermediary classes such as aldehydes, benzenes, and ketones are present in the raw matrix and used during the fermentation for the synthesis of both microorganisms’ secondary metabolites and aromatic molecules [7]. Indeed, their contents at final stage are relatively low (6.37 ppm for aldehydes, 11.33 for ketones) or not detected (benzenes). Ketones are metabolized by yeasts mainly through the oxidation of alcohols [60].
Now considering classes mainly formed during the fermentation process, ester and phenol total contents represent 71.71 ppm and 54.06 ppm, respectively. Final terpene content decreased to 78.45 ppm. However, new compound synthesis during the fermentation process such as Δ-3-carene, α-phellandrene, γ-terpinene, and m- and p-cymene occurs.
The evolution of content of different classes during the fermentation process is illustrated in Figure 3. Trends outlined previously concerning classes kinetics are confirmed using the Spearman correlation established between the evolution of VOC classes during fermentation stages (Figure 4). Indeed, classes such as ketones are negatively correlated with carboxylic acids and phenols; aldehydes are negatively correlated with alcohols and esters; phenols are positively correlated with esters and carboxylic acids.
In addition, total content of released molecules as a function of fermentation stages can be highlighted. Fermentation increases total VOC content over time, with a maximum of 1790.92± ppm at D4. Indeed, during the fermentation process, both VOC composition and relative content fluctuate [34,36].
In this case, the association of yeasts and AAB drives the fermentation process and mainly contributes to the chemical composition of kombucha [7]. Essentially, through the MO activity, reagents, and substrates from the fermentation media (raw matrix, carbonaceous substrate and kombucha broth) result in the formation of metabolic and aromatic products. As described previously, most known and studied metabolic pathways driving the fermentation process are glycolysis pathway allowing yeasts to degrade carbonaceous substrates into ethanol, products then implied for the synthesis of organic acids and cellulose considering AAB pathways [49].
As the SCOBY is a complex consortium composed of diverse populations from both yeast and bacteria taxa, complementary metabolic pathways might be used (not to mention inter-species interactions), leading to the synthesis of these specific VOC profiles (Table 1). As a result, the correlation between the most synthetized VOCs and MO consortium evolution during fermentation could provide a better understanding of this fermentation process. The synthesis of phenethyl alcohol and isoamyl alcohol by Saccharomyces genus (sometimes by Candida and Lactobacillus genus) leading to ester formation (ethyl acetate main structure) is reported in the literature [62]. Moreover, terpene synthesis occurring at the beginning of fermentation could be crossed with the yeast activity as well [63]. Recent research on engineered yeast used for the microbial synthesis of terpenes was conducted, linked with their high mevalonic acid metabolic flux and their important intracellular acetyl-CoA, enzymes, and substrates concentrations [64]. The study of Ferremi Leali et al. (2022) demonstrated inter-species metabolic interactions through the improved VOC synthesis diversity profile (production of geraniol, Δ-3-carene, and p-cymene) in co-cultures consortium kombucha (Zygosaccharomyces sp., Bruxellensis sp. and Novacetimonas sp.) [65]. However, monocultures of Zygosaccharomyces sp induced the synthesis of specific VOCs such as benzaldehyde, isoamyl alcohol, and phenethyl acetate [65].
A PCA was performed to analyze the variation among the different VOC profile stages (Figure 5). The first dimension explains 68.1% of the total variance, represented on the horizontal axis. A variables correlation plot illustrates the formation of three groups depending on their position on 1:2 plan (Figure 5A). Indeed, green, and black teas are positively correlated together, inducing similar VOC profiles. Then, D0 to D4 fermentation stages are grouped (first quadrant), separated from stages traducing the end of fermentation (D7 to D14) in the fourth quadrant. Moreover, trends provided by the second dimension brought no additional information considering this dataset (explanation of 20.2% of the total variability). To resume, a major significant change in VOC profiles between the beginning (D0-D4) and end (D7-D14) of fermentation stages is highlighted by the PCA. As illustrated by the individual’s representation (Figure 5B), classes that allows the major variability explanation are carboxylic acids, alcohols, and terpenes (most represented along Dim1).

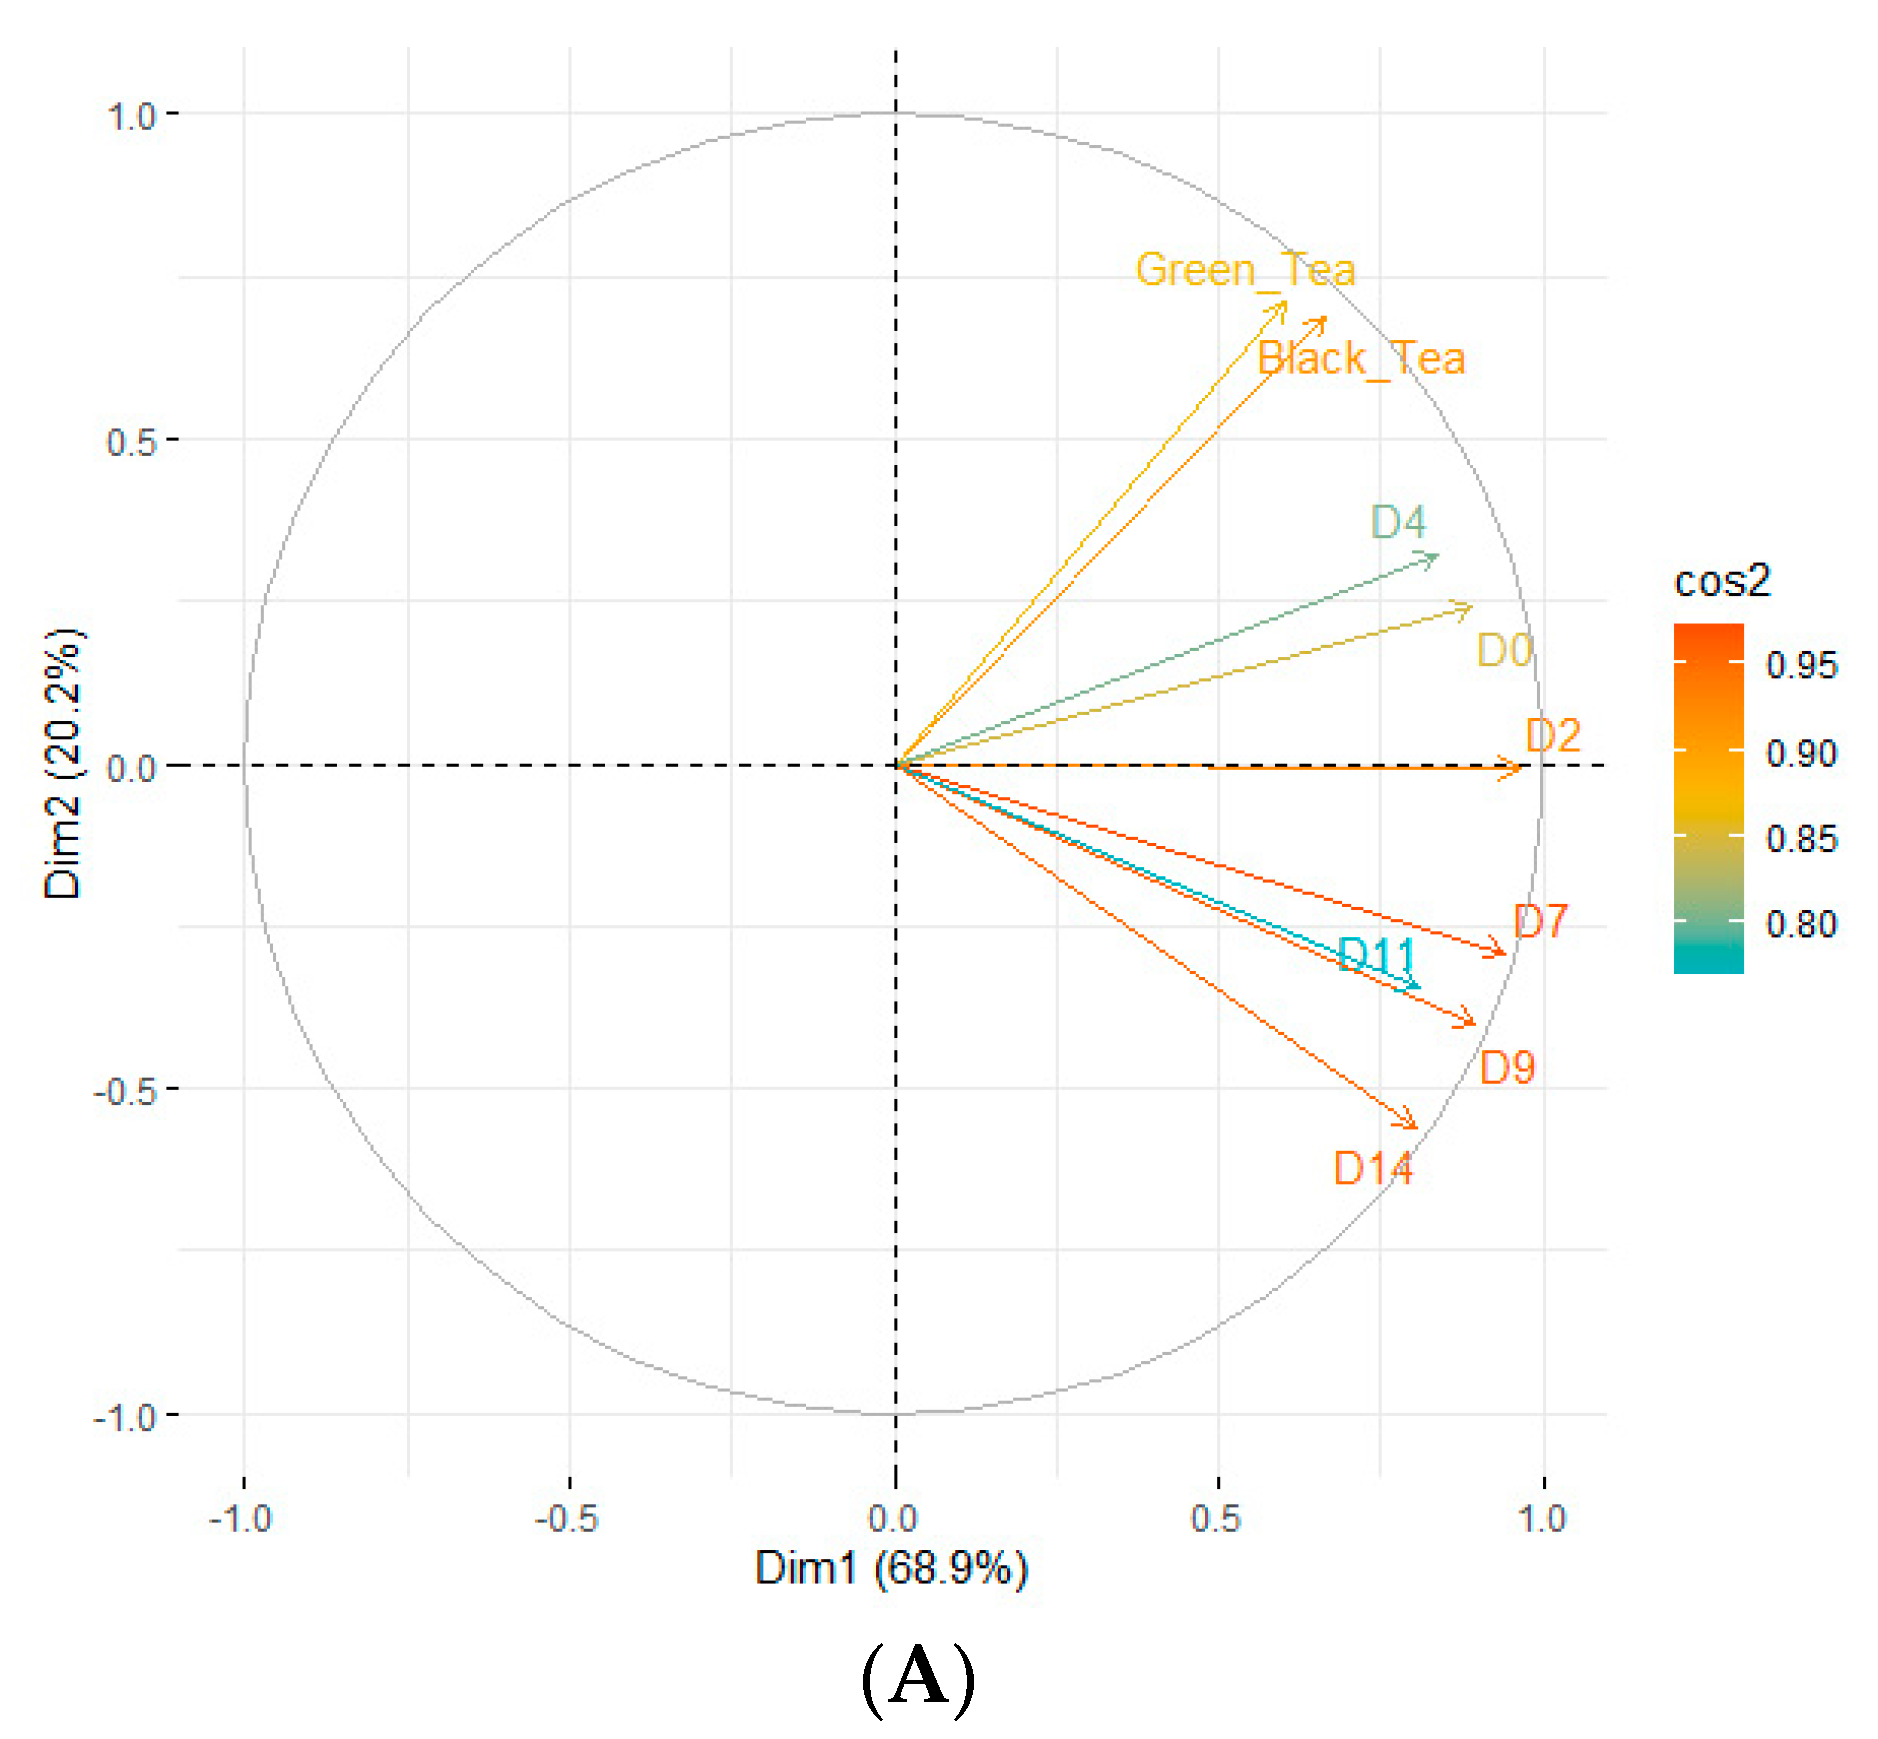
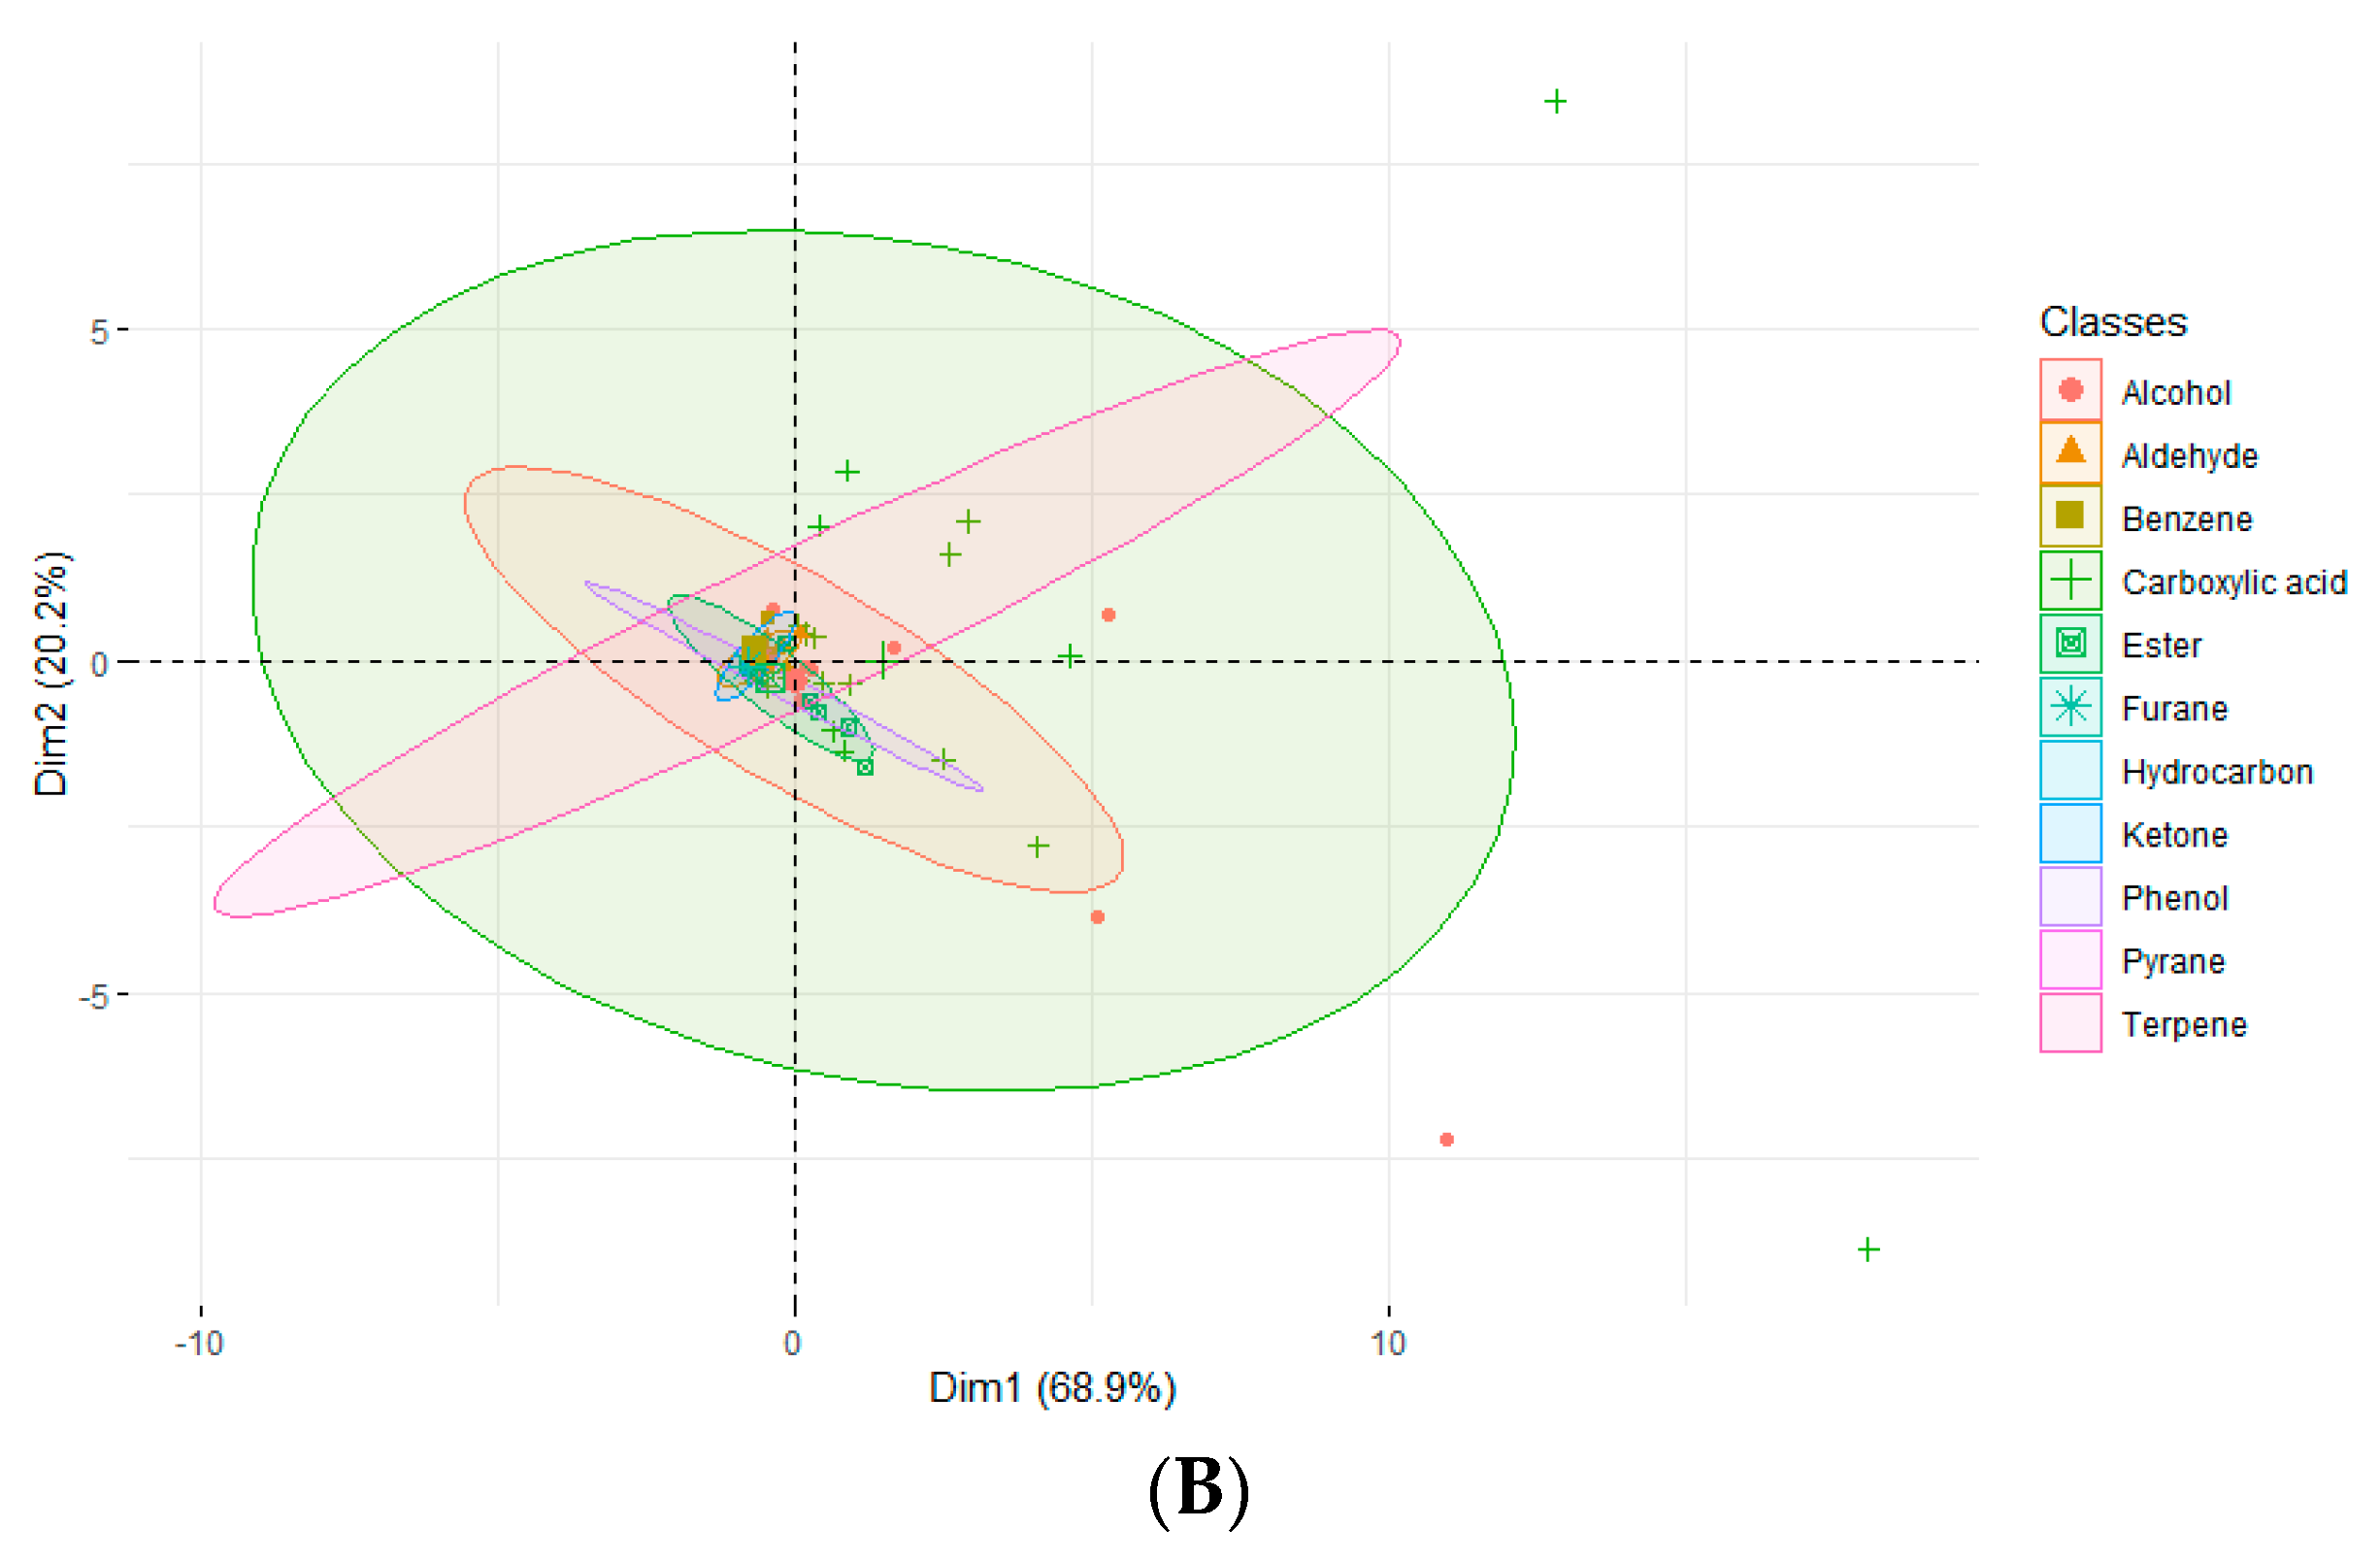
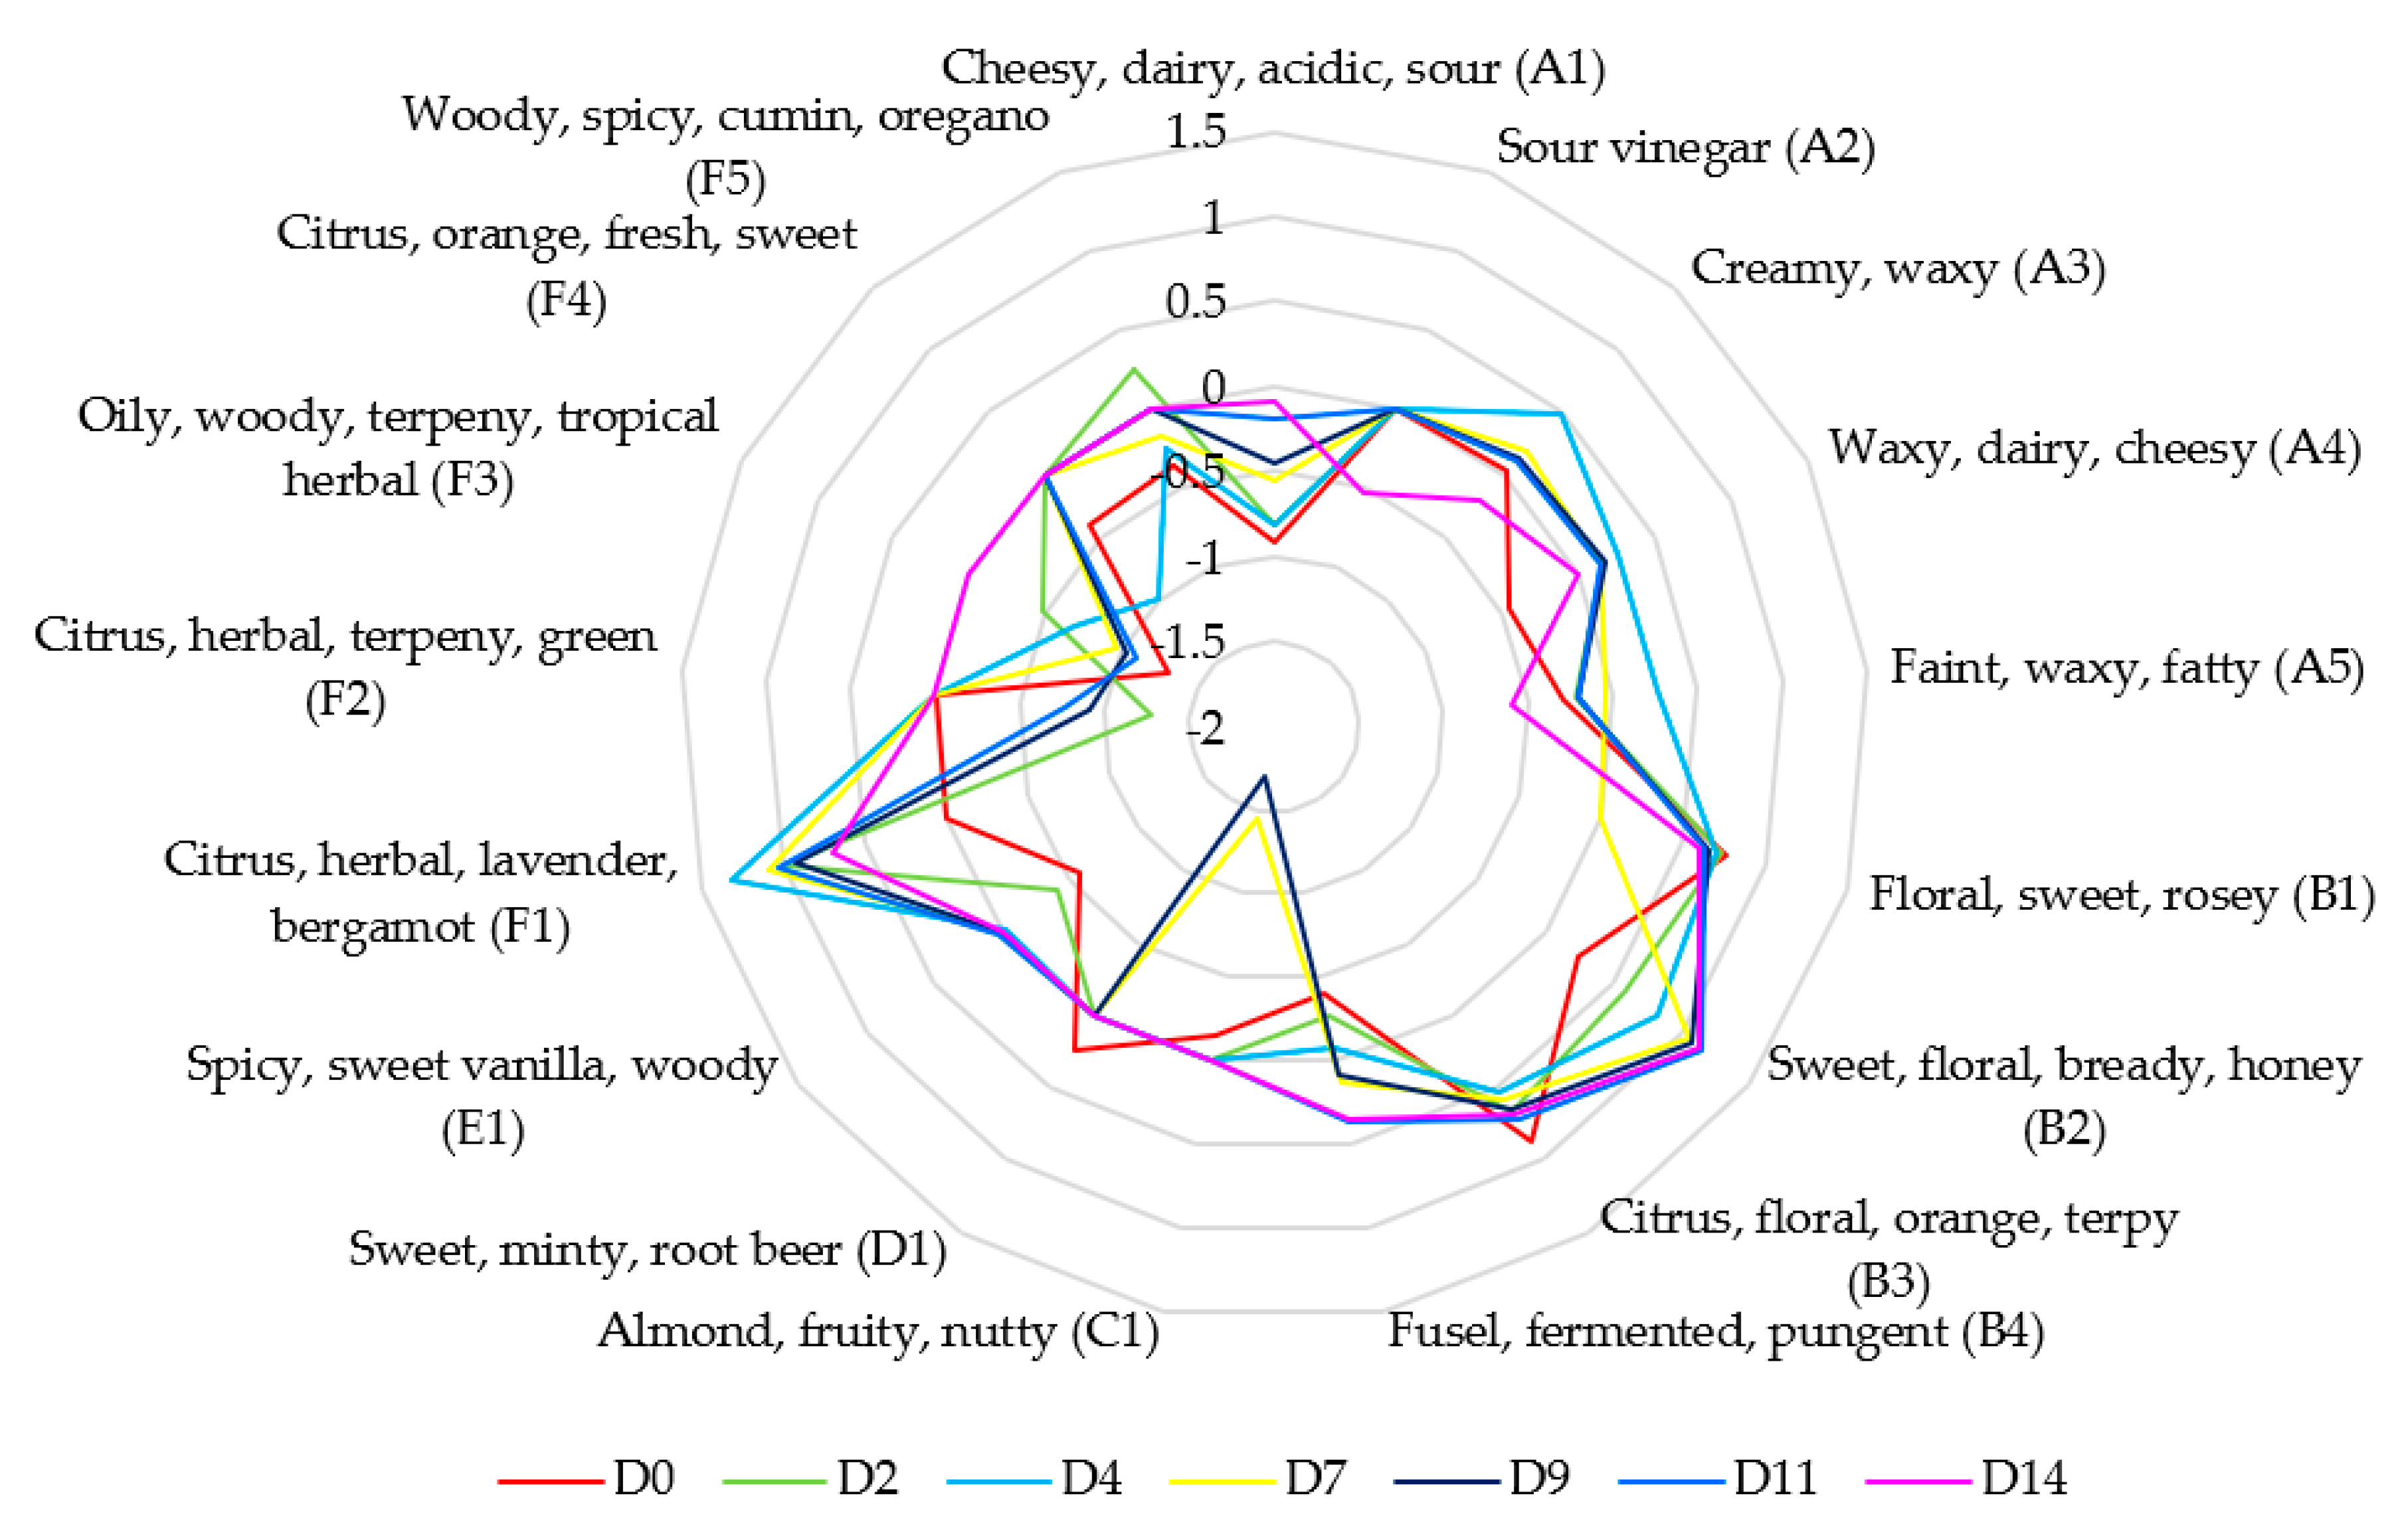
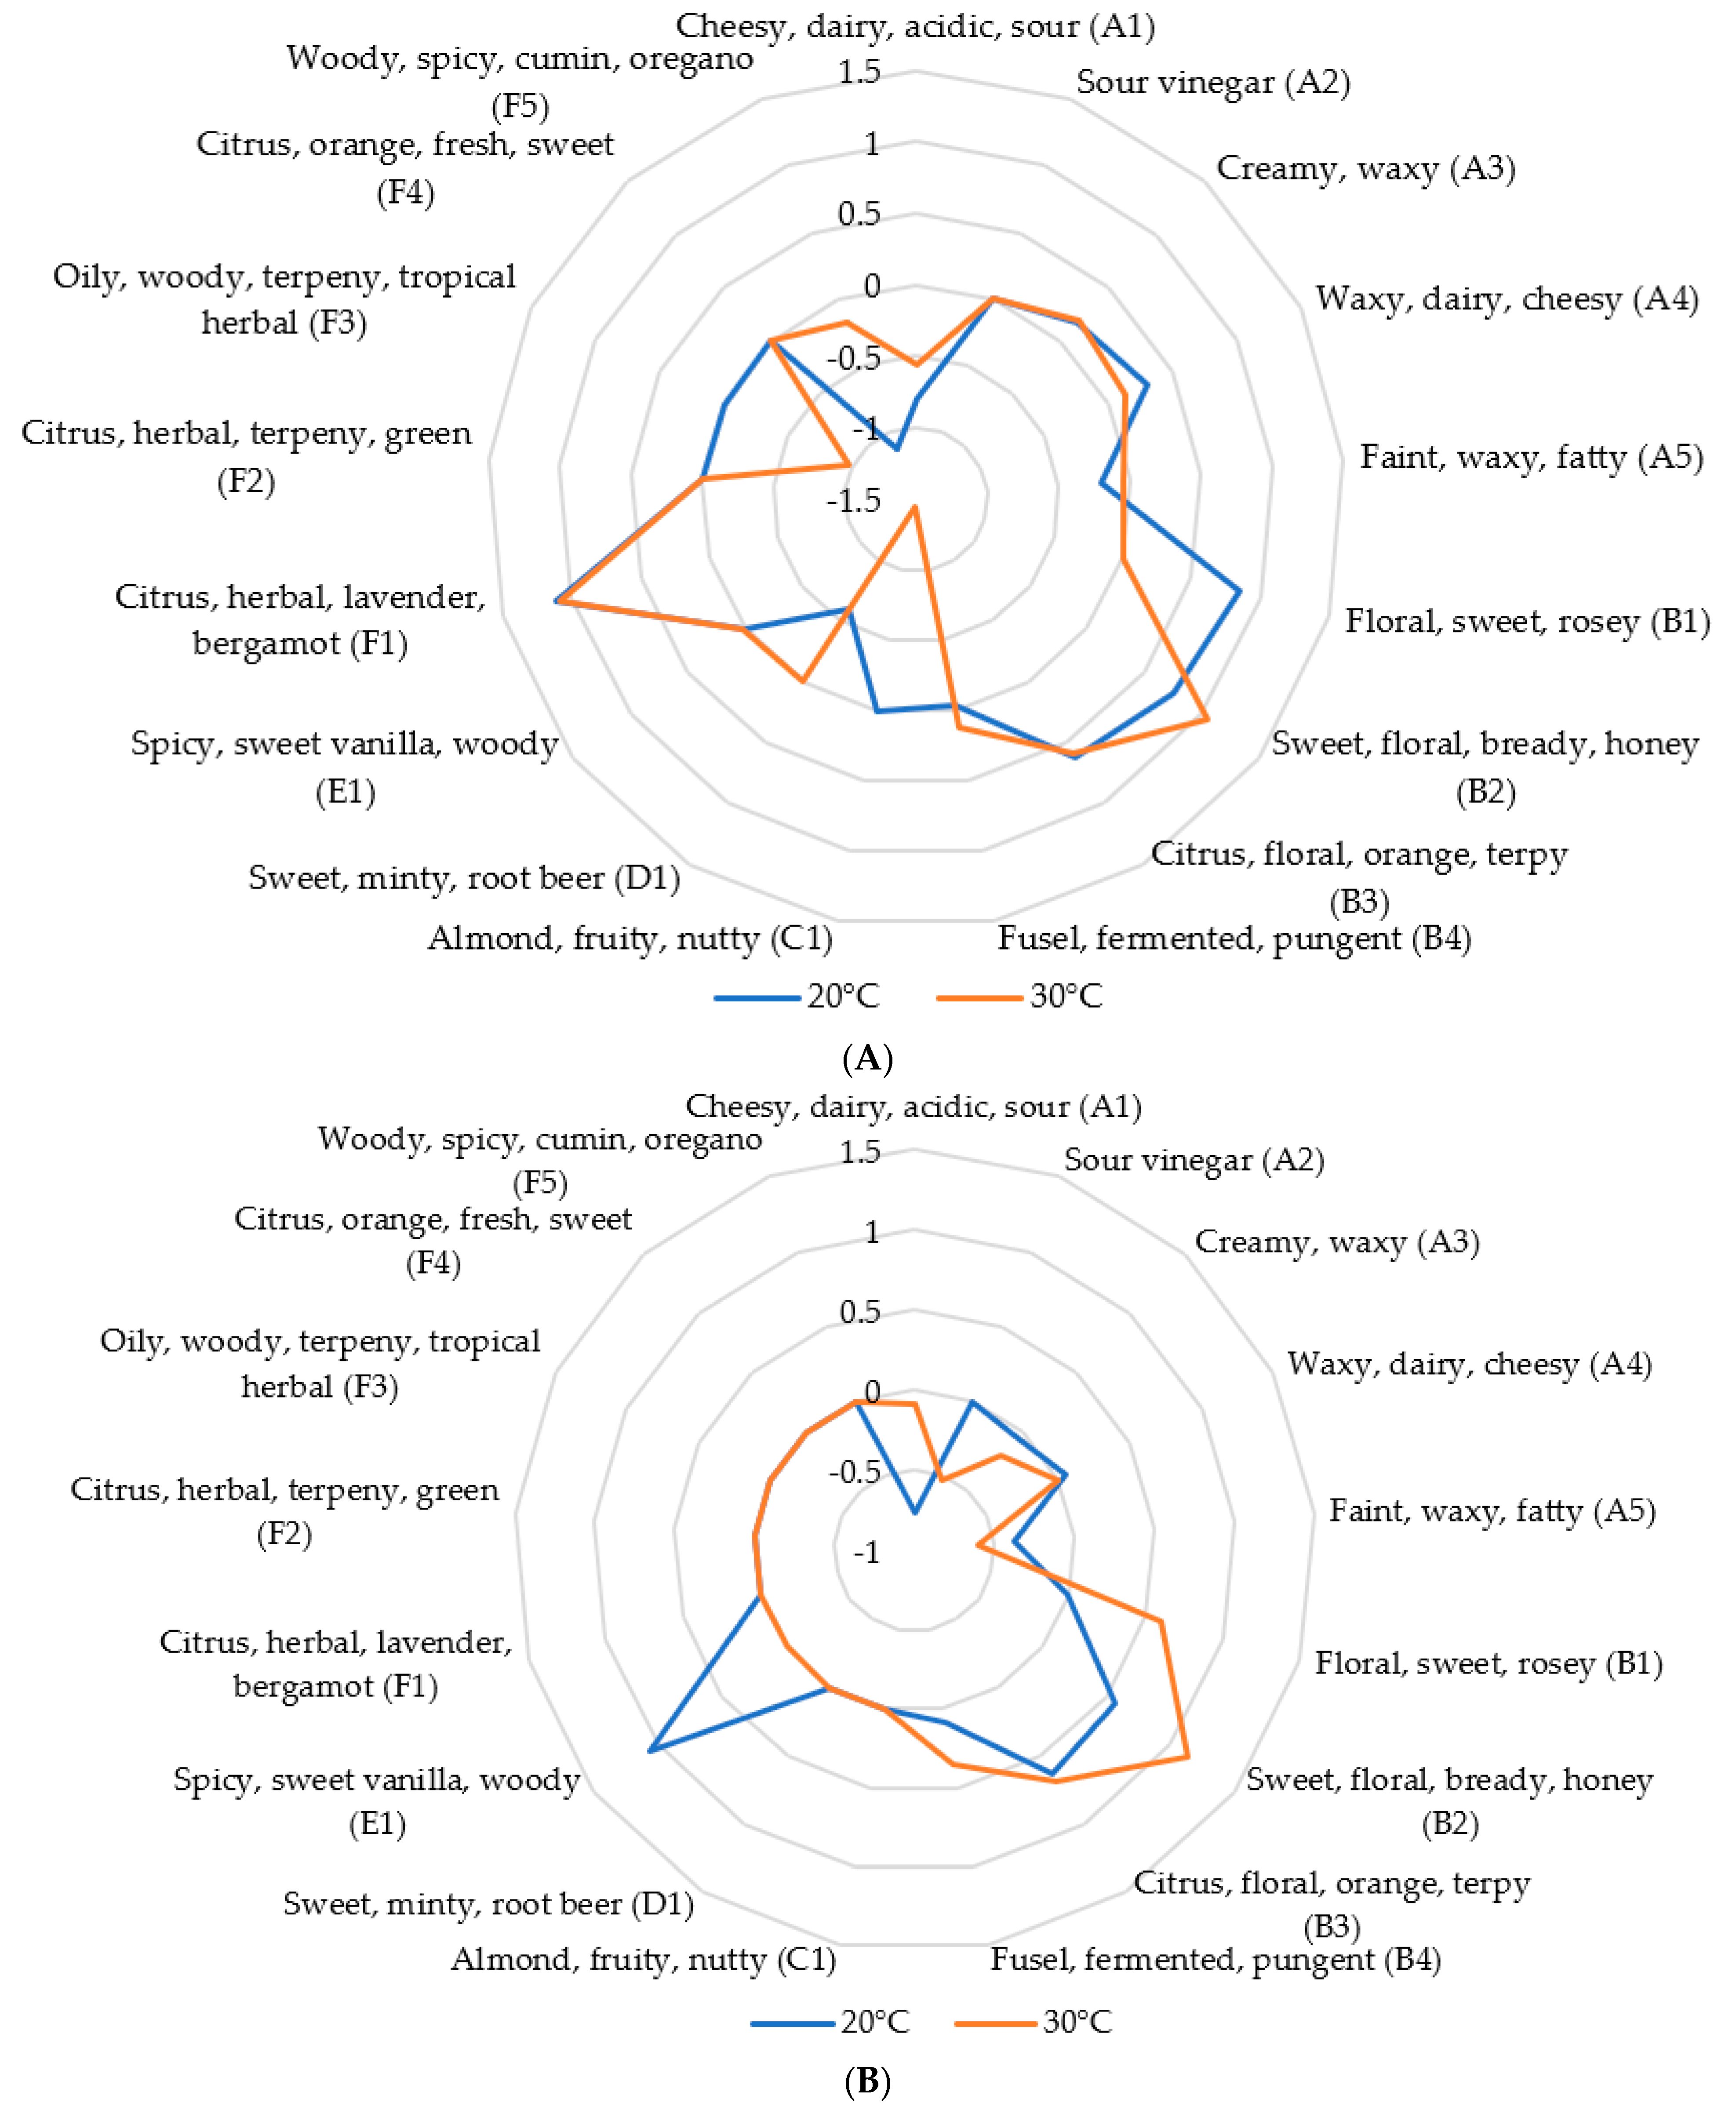
3.2.2. Aromatic Characterization of Kombucha and Establishment of Sensory Profiles

As far as kombucha microorganisms play an important role in the formation of flavor quality during fermentation [30,34], the beverage will now be analyzed from this point of view.
The evolution of most representative aromatic molecules is presented in Table 2. Based on VOC concentrations and perception thresholds in water reported in the literature, odor-activity values were determined along the fermentation process. Odor-activity value (OAV) explains the contribution to a specific aroma. When the OAV is greater than 1, it indicates that the considered compound has a significant aroma contribution in the relative food system. Indeed, the greater the OAV is, the higher the aroma contribution is [1].
The aromatic analysis accounts for 17 VOCs: 5 carboxylic acids (A), 4 alcohols (B), 1 aldehyde (C), 1 ester (D), 1 phenol (E), and 5 terpenes (F). The introduction of a code (letter followed by a number) allows a clear identification of each molecule considering its class, translated afterwards on the sensory profiles (Figure 6).
First, the main VOCs contributing to tea aroma are linalool (OAV of 22.29 in black tea), geraniol (14.68 in black tea), carboxylic acids such as hexadecanoic (7.58 and 5.70 in black and green teas, respectively), nonanoic (1.11 and 1.67 in black and green teas, respectively), and tetradecanoic (3.84 and 3.06 in black and green teas, respectively) acids, to end with methyl 2-hydroxybenzoate (1.70 in black tea) and limonene (2.01 and 4.03 in black and green teas, respectively). Hence, raw matrix presents creamy-waxy aromas from carboxylic acids, with a predominance of floral-sweet and citrus notes (geraniol and linalool) for black tea and citrus-orange (limonene) for green tea. Major tea aromas are chemically formed during the infusion, and bound to precursor handles, such as sugars (carbonaceous substrates available from yeast activity). Moreover, matrix terpenes derivatives contribute to the overall tea aroma because of their oxygenation in the fermentation medium (lower perception threshold inducing a higher OAV) [59].
Along the fermentation process, tea sensory profile is modified through MO activity, resulting in the development of diverse aromatic molecules with different perception profiles. In fact, 2-phenylethanol (OAV of 1.77 at D2 to 13.66 at D14), α-farnesene (from 10.09 at D2 to 5.06 at D14) and p-cymene (the highest OAV of 1.81 at D2) synthesis occur along the fermentation. However, as initial tea constituents globally decrease along fermentation stages, they still contribute to the aroma system as their OAV stays greater than 1 (except for limonene). These changes in the evolution of compounds concentration leads to flavor variations during the fermentation stages (Figure 6): from citrus-floral-sweet, and orange notes at the initial stage (geraniol and linalool domination), stages D2-D4 fermentation brings intense citrus-herbal-lavender-bergamot notes (synthesis of α-farnesene). From D7, while α-farnesene OAV decreases, sweet-floral-bready-honey notes dominates the kombucha flavor (2-phenylethanol synthesis). Moreover, final kombucha flavor (D14) may also present fermented-pungent notes relative to the 3-methylbutan-1-ol OAV increase (OAV of 2.27). Natural plant volatiles such as aliphatic esters, alcohols, acids, and carbonyls are commonly converted into esters, ketones, and alcohols (fatty acids metabolism) during the fermentation process. Oxidation through enzymes, such as lipoxygenase, converts fatty acids to diverse volatile products, depending on MO’s enzymes, pH, and medium conditions [59].
The correlation between changes in the VOC profiles during the fermentation process and metabolic pathways is reported in the literature. Therefore, aroma-active compounds also fluctuate [1,34,66]. Considering the metabolic pathways employed in the kombucha fermentation process, multiple aromatic compounds are referred to be microbial metabolites (2-phenyl alcohol [62]) [36]. Terpene synthesis by diverse yeast taxa at the beginning of fermentation is again highlighted here [62], through the highest aroma perception of α-farnesene and p-cymene at D4 and D2, respectively. However, although the final flavor of kombucha maintains characteristic aroma compounds from its original substrate, it may have several common compounds (such as 2-phenyl ethanol and nonanoic acid) that contributes to the signature aroma of kombucha [36]. The final flavor of kombucha also depends on fermentation parameters such as the initial sucrose concentration and kombucha starter, raw matrix, microbial SCOBY composition, temperature, and time [7,17,19,35,67].
Eventually, through the aroma-active compound analysis, overall beverage flavor and taste are determined. Despite the need of sensory analysis to evaluate consumer acceptance, the fermentation time control seems to give an overview of potential developed aromas and perceptions. Indeed, the obtention of fruity-, floral-, acidic-, and citrus-like beverages could be intended by the fermentation control, not to mention the primary safety control of these fermented beverages (food safety conditions avoiding any pathogen development).
To go deeper in the aroma-active compound analysis, an insight concerning the temperature impact on the beverage flavor is studied. The consideration of an extra fermentation temperature in the study (20 °C) allows the qualitative comparison of the development of aroma active compounds. Based on the following sensory profiles, flavor comparison is illustrated for the intermediate (D7) and final (D14) stages (Figure 7A,B respectively). Considering both fermentation stages, the temperature seems to have a positive correlation on the alcohol synthesis (except for an observed inhibition of B1 synthesis at D7-30 °C). Otherwise, temperature may inhibit the synthesis of carboxylic acids and phenols (D14). The underlying hypothesis arising from these observations is the role of temperature as a factor in the metabolite production rate in the fermentation media. As the production of aroma-active compounds obtained at 30 °C-D14 is not like that obtained at 20 °C-D7, the relationship between metabolite production and temperature might be more complex. In fact, as most aromatic compounds developed during fermentation are synthetized through metabolic pathways, the MOs involved in the process might have optimal temperature range conditions [68]. For instance, yeast taxa allowing the synthesis of multiple aroma-active compounds prefer fermentation temperatures below 30 °C [68].
Finally considering the final flavor approach, a higher temperature could inhibit the formation of certain aroma compound classes such as carboxylic acids and phenols (respectively responsible for sour-creamy-fatty and spicy-woody notes). On the contrary, alcohol synthesis might be improved with temperature, accounting for a greater perception of floral-sweet-citrus-like flavors. This information allows us to consider the temperature as another way of controlling fermentation flavors, not to mention that major fermentation modalities may be linked with each other (fermentation time for instance). The effect of crossed fermentation parameters (temperature and time) on the flavor development should be further studied, towards the control of fermentation and the production of quality flavored beverages.

4. Conclusions

In the present study, the main kinetics including pH, major fermentation components, VOCs, and aroma-active compounds were analyzed during kombucha fermentation. Concerning the physico-chemical characterization of kombucha, a pH decrease reflects an acidification in the fermentation medium and illustrates organic acid synthesis by the fermentation microbiome. In these conditions, low pH (below 4.5) ensures food safety by inhibiting spoilage and pathogen development.
Through the kinetics of major compounds, the main microbial consortium pathways are highlighted, such as glycolysis pathway and AAB pathways.
Dynamic changes in VOCs were investigated using SBSE-GC-MS during kombucha fermentation. A total of 87 VOCs were detected in kombucha during the fermentation stages, including 28 carboxylic acids, 23 alcohols, 10 ketones, 9 terpenes, 7 esters, 7 aldehydes, 2 phenols and 1 benzene. The fermentation process changes the VOC tea profile dynamically into a different mixture of compounds. The synthesis of mainly phenethyl alcohol and isoamyl alcohol probably by Saccharomyces genus leads to ester formation (ethyl acetate main structure). Moreover, the terpene synthesis occurring at the beginning of fermentation (Δ-3-carene, α-phellandrene, γ-terpinene, and m- and p-cymene) could be related to yeast activity as well.
The aromatic analysis, based on odor-active values, accounts for 17 aroma-active compounds. These changes in the evolution of compound concentrations led to flavor variations at the different fermentation stages: from citrus-floral-sweet and orange notes at the initial stage (geraniol and linalool domination), with stages D2-D4 fermentation bringing intense citrus-herbal-lavender-bergamot notes (synthesis of α-farnesene). From stage D7, sweet-floral-bready-honey notes dominates the kombucha flavor (2-phenylethanol synthesis). However, although the final flavor of kombucha keeps characteristic aroma compounds from its original substrate, several common compounds (such as 2-phenyl ethanol, nonanoic, and octanoic acids) may also contribute to the signature aroma of kombucha.

5. Prospects of this Research Study

Firstly, the characterization of the microbial beverage population could confirm some existing relations between VOC synthesis and metabolic pathways involved during fermentation, not only by identifying the microorganisms present in the starting SCOBY but also by studying its evolution and potential specification. Secondly, despite the need for sensory analysis to evaluate consumer acceptance and preferences considering the beverage, the fermentation time control seems to give an overview of potentially developed aromas and perceptions. Moreover, as temperature may have an impact on the final kombucha flavor, the effect of crossed fermentation parameters (temperature and time) on the development of aroma-active compounds should be further studied, towards the control of fermentation and the production of quality flavored beverages.
As far as health beverage aspects are concerned, it would be interesting to investigate the potential antioxidant and anti-inflammatory properties. Indeed, the evolution of these parameters with fermentation modalities could help developing optimal functional beverages. Moreover, interactions between the beverage and the intestinal consumer microbiomes should be further studied.
In this context, the use of alternative fermentation matrices could be intended. Several studies [14,17,26,69,70,71] demonstrated the efficiency of mixed fermentation on various matrices such as tea, hibiscus, coconut water, cereals, etc. A panel of functional beverages of this type could help in determining the limit of the necessary nutrients for the SCOBY development. The study of kinetics of the tea constituents may allow the evaluation of this fermentation substrate impact on health. The use of lactose and gluten-free matrices could aim at satisfying a larger target population. Indeed, at the dawn of a food transition encouraging the consumption of healthy and sustainable functional foods, it is now crucial to promote food with health benefits for the consumer.

Author Contributions

Conceptualization, S.S.; methodology, S.S. and G.R. and P.-Y.W. and C.B.; software, S.S.; validation, D.G. and M.-L.F.; formal analysis, S.S. and G.R.; investigation, S.S. and G.R.; resources, S.S.; data curation, S.S. and G.R.; writing—original draft preparation, S.S.; writing—review and editing, E.H. and M.-L.F. and D.G. and G.R. and P.-Y.W. and C.B.; visualization, D.G. and M.-L.F.; supervision, M.-L.F. and D.G. and E.H.; project administration, M.-L.F. and E.H.; funding acquisition, M.-L.F. and E.H. All authors have read and agreed to the published version of the manuscript.

Funding

This research received Wallonia region funds for Win4Excellence Microboost project (+3281-33-45-39).

Data Availability Statement

The datasets generated for this study are available on request to the corresponding author.

Acknowledgments

My special thanks go to Yves Brostaux for its statistical analysis expertise. Moreover, I would like to thank Franck Michels and Adrien Francis for their technical support.

Conflicts of Interest

The authors declare no conflict of interest.

References

  1. Gou, M.; Bi, J.; Chen, Q.; Wu, X.; Fauconnier, M.L.; Qiao, Y. Advances and Perspectives in Fruits and Vegetables Flavor Based on Molecular Sensory Science. Food Rev. Int. 2021, 1–14. [Google Scholar] [CrossRef]
  2. Teng, T.S.; Chin, Y.L.; Chai, K.F.; Chen, W.N. Fermentation for Future Food Systems. EMBO Rep. 2021, 22, e52680. [Google Scholar] [CrossRef] [PubMed]
  3. Lonǎr, E.; Djurić, M.; Malbaša, R.; Kolarov, L.J.; Klašnja, M. Influence of Working Conditions Upon Kombucha Conducted Fermentation of Black Tea. Food Bioprod. Process. 2006, 84, 186–192. [Google Scholar] [CrossRef]
  4. Dufresne, C.; Farnworth, E. Tea, Kombucha, and Health: A Review. Food Res. Int. 2000, 33, 409–421. [Google Scholar] [CrossRef]
  5. Teoh, A.L.; Heard, G.; Cox, J. Yeast Ecology of Kombucha Fermentation. Int. J. Food Microbiol. 2004, 95, 119–126. [Google Scholar] [CrossRef] [PubMed]
  6. Laavanya, D.; Shirkole, S.; Balasubramanian, P. Current Challenges, Applications and Future Perspectives of SCOBY Cellulose of Kombucha Fermentation. J. Clean. Prod. 2021, 295, 126454. [Google Scholar] [CrossRef]
  7. Bishop, P.; Pitts, E.R.; Budner, D.; Thompson-Witrick, K.A. Kombucha: Biochemical and Microbiological Impacts on the Chemical and Flavor Profile. Food Chem. Adv. 2022, 1, 100025. [Google Scholar] [CrossRef]
  8. de Oliveira, Í.A.C.L.; Rolim, V.A.D.O.; Gaspar, R.P.L.; Rossini, D.Q.; de Souza, R.; Bogsan, C.S.B. The Technological Perspectives of Kombucha and Its Implications for Production. Fermentation 2022, 8, 185. [Google Scholar] [CrossRef]
  9. Sievers, M.; Lanini, C.; Weber, A.; Schuler-Schmid, U.; Teuber, M. Microbiology and Fermentation Balance in a Kombucha Beverage Obtained from a Tea Fungus Fermentation. Syst. Appl. Microbiol. 1995, 18, 590–594. [Google Scholar] [CrossRef]
  10. McNeil, B.; Harvey, L.M.; Rowan, N.J.; Giavasis, I. Fermentation Monitoring and Control of Microbial Cultures for Food Ingredient Manufacture. Microb. Prod. Food Ingred. Enzym. Nutraceuticals 2013, 125–143. [Google Scholar] [CrossRef]
  11. Markov, S.L.; Malbaša, R.V.; Hauk, M.J.; Cvetković, D.D. Investigation of Tea Fungus Microbe Assotiations: I: The Yeasts. Acta Period. Technol. 2001, 133–138. [Google Scholar]
  12. Règlement (UE) n o 1169/2011 du Parlement Européen et du Conseil du 25 Octobre 2011 Concernant L’information des Consommateurs sur les Denrées Alimentaires, Modifiant les Règlements (CE) n o 1924/2006 et (CE) n o 1925/2006 du Parlement Européen et du Conseil et Abrogeant la Directive 87/250/CEE de la Commission, la Directive 90/496/CEE du Conseil, la Directive 1999/10/CE de la Commission, la Directive 2000/13/CE du Parlement Européen et du Conseil, les Directives 2002/67/CE et 2008/5/CE de la Commission et le Règlement (CE) n o 608/2004 de la Commission Texte Présentant de L’intérêt pour l’EEE. 2011; Volume 304.
  13. Watawana, M.I.; Jayawardena, N.; Gunawardhana, C.B.; Waisundara, V.Y. Health, Wellness, and Safety Aspects of the Consumption of Kombucha. J. Chem. 2015, 2015, 591869. [Google Scholar] [CrossRef] [Green Version]
  14. Melini, F.; Melini, V.; Luziatelli, F.; Ficca, A.G.; Ruzzi, M. Health-Promoting Components in Fermented Foods: An Up-to-Date Systematic Review. Nutrients 2019, 11, 1189. [Google Scholar] [CrossRef] [Green Version]
  15. Martínez Leal, J.; Valenzuela Suárez, L.; Jayabalan, R.; Huerta Oros, J.; Escalante-Aburto, A. A Review on Health Benefits of Kombucha Nutritional Compounds and Metabolites. CyTA—J. Food 2018, 16, 390–399. [Google Scholar] [CrossRef] [Green Version]
  16. Jayabalan, R.; Malbaša, R.V.; Lončar, E.S.; Vitas, J.S.; Sathishkumar, M. A Review on Kombucha Tea—Microbiology, Composition, Fermentation, Beneficial Effects, Toxicity, and Tea Fungus. Compr. Rev. Food Sci. Food Saf. 2014, 13, 538–550. [Google Scholar] [CrossRef] [PubMed]
  17. Gaggìa, F.; Baffoni, L.; Galiano, M.; Nielsen, D.S.; Jakobsen, R.R.; Castro-Mejía, J.L.; Bosi, S.; Truzzi, F.; Musumeci, F.; Dinelli, G.; et al. Kombucha Beverage from Green, Black and Rooibos Teas: A Comparative Study Looking at Microbiology, Chemistry and Antioxidant Activity. Nutrients 2019, 11, 1. [Google Scholar] [CrossRef] [Green Version]
  18. Jayabalan, R.; Malini, K.; Sathishkumar, M.; Swaminathan, K.; Yun, S.E. Biochemical Characteristics of Tea Fungus Produced during Kombucha Fermentation. Food Sci. Biotechnol. 2010, 19, 843–847. [Google Scholar] [CrossRef]
  19. Jayabalan, R.; Marimuthu, S.; Swaminathan, K. Changes in Content of Organic Acids and Tea Polyphenols during Kombucha Tea Fermentation. Food Chem. 2007, 102, 392–398. [Google Scholar] [CrossRef]
  20. Greenwalt, C.J.; Steinkraus, K.H.; Ledford, R.A. Kombucha, the Fermented Tea: Microbiology, Composition, and Claimed Health Effects. J. Food Prot. 2000, 63, 976–981. [Google Scholar] [CrossRef]
  21. Talebi, M.; Frink, L.A.; Patil, R.A.; Armstrong, D.W. Examination of the Varied and Changing Ethanol Content of Commercial Kombucha Products. Food Anal. Methods 2017, 10, 4062–4067. [Google Scholar] [CrossRef]
  22. Harrison, K.; Curtin, C. Microbial Composition of SCOBY Starter Cultures Used by Commercial Kombucha Brewers in North America. Microorganisms 2021, 9, 1060. [Google Scholar] [CrossRef] [PubMed]
  23. Sengun, I.Y.; Karabiyikli, S. Importance of Acetic Acid Bacteria in Food Industry. Food Control. 2011, 22, 647–656. [Google Scholar] [CrossRef]
  24. Arumugam, M.; Raes, J.; Pelletier, E.; Paslier, D.L.; Yamada, T.; Mende, D.R.; Fernandes, G.R.; Tap, J.; Bruls, T.; Batto, J.M.; et al. Enterotypes of the Human Gut Microbiome. Nature 2011, 473, 174–180. [Google Scholar] [CrossRef] [Green Version]
  25. Behera, S.S.; Ray, R.C.; Das, U.; Panda, S.K.; Saranraj, P. Microorganisms in Fermentation. Learn. Mater. Biosci. 2019, 1–39. [Google Scholar] [CrossRef]
  26. Dutta, H.; Paul, S.K. Kombucha Drink: Production, Quality, and Safety Aspects. Prod. Manag. Beverages 2019, 259–288. [Google Scholar] [CrossRef]
  27. LiangLiang, G.; XiaoYan, H.; Yue, L.; QingFu, C. Production Technology Optimization on Fermented Tea of Golden Buckwheat. Guizhou Agric. Sci. 2014, 42, 169–174. [Google Scholar]
  28. Pederson, C.S. Microbiology of Food Fermentations; AVI Publishing Co. Inc.: Westport, CO, USA, 1979; p. 384. [Google Scholar]
  29. Filippis, F.D.; Troise, A.D.; Vitaglione, P.; Ercolini, D. Different Temperatures Select Distinctive Acetic Acid Bacteria Species and Promotes Organic Acids Production during Kombucha Tea Fermentation. Food Microbiol. 2018, 73, 11–16. [Google Scholar] [CrossRef]
  30. Chakravorty, S.; Bhattacharya, S.; Chatzinotas, A.; Chakraborty, W.; Bhattacharya, D.; Gachhui, R. Kombucha Tea Fermentation: Microbial and Biochemical Dynamics. Int. J. Food Microbiol. 2016, 220, 63–72. [Google Scholar] [CrossRef]
  31. Reva, O.N.; Zaets, I.E.; Ovcharenko, L.P.; Kukharenko, O.E.; Shpylova, S.P.; Podolich, O.V.; de Vera, J.P.; Kozyrovska, N.O. Metabarcoding of the Kombucha Microbial Community Grown in Different Microenvironments. AMB Express 2015, 5, 35. [Google Scholar] [CrossRef] [Green Version]
  32. Salmerón, I.; Thomas, K.; Pandiella, S.S. Effect of Potentially Probiotic Lactic Acid Bacteria on the Physicochemical Composition and Acceptance of Fermented Cereal Beverages. J. Funct. Foods 2015, 15, 106–115. [Google Scholar] [CrossRef]
  33. Laureys, D.; Britton, S.J.; De Clippeleer, J. Kombucha Tea Fermentation: A Review. J. Am. Soc. Brew. Chem. 2020, 78, 165–174. [Google Scholar] [CrossRef]
  34. Zhen-jun Zhao, Y.S.; Wu, H.; Zhou, C.; Xian-chun Hu, J.Z. Flavour Chemical Dynamics during Fermentation of Kombucha Tea. Emir. J. Food Agric. 2018, 732–741. [Google Scholar] [CrossRef]
  35. Chen, C.; Liu, B.Y. Changes in Major Components of Tea Fungus Metabolites during Prolonged Fermentation. J. Appl. Microbiol. 2000, 89, 834–839. [Google Scholar] [CrossRef] [PubMed]
  36. Zhang, J.; Van Mullem, J.; Dias, D.R.; Schwan, R.F. The Chemistry and Sensory Characteristics of New Herbal Tea-Based Kombuchas. J. Food Sci. 2021, 86, 740–748. [Google Scholar] [CrossRef] [PubMed]
  37. Starowicz, M. Analysis of Volatiles in Food Products. Separations 2021, 8, 157. [Google Scholar] [CrossRef]
  38. Ochiai, N.; Sasamoto, K.; David, F.; Sandra, P. Recent Developments of Stir Bar Sorptive Extraction for Food Applications: Extension to Polar Solutes. J. Agric. Food Chem. 2018, 66, 7249–7255. [Google Scholar] [CrossRef]
  39. Staff, D.A.; Register, O. of the F. Code of Federal Regulations: Title 21: Food and Drugs; Office of the Federal Register: Washington, DC, USA, 2005. [Google Scholar]
  40. David, F.; Sandra, P. Stir Bar Sorptive Extraction for Trace Analysis. J. Chromatography. A 2007, 1152, 54–69. [Google Scholar] [CrossRef]
  41. Margoum, C.; Guillemain, C.; Yang, X.; Coquery, M.; Margoum, C.; Guillemain, C.; Yang, X. Stir Bar Sorptive Extraction Coupled to Liquid Chromatography-Tandem Mass Spectrometry for the Determination of Pesticides in Water Samples: Method Validation and Measurement Uncertainty Title: 1 Stir Bar Sorptive Extraction Coupled to Liquid Chromatography-Tandem Mass Spectrometry for the 2 Determination of Pesticides in Water Samples: Method Validation and Measurement Uncertainty. Talanta 2013, 116, 1–7. [Google Scholar]
  42. Vedenin, A.; Suvorkin, V.; Kachur, E. Stir Bar Sorptive Extraction-Thermal Desorption-Capillary GC-MS Applied for Analysis of Amphetamine Derivatives in Biological Fluids. GERSTEL AppNote 2014, 7. [Google Scholar]
  43. Salmerón, I.; Thomas, K.; Pandiella, S.S. Effect of Substrate Composition and Inoculum on the Fermentation Kinetics and Flavour Compound Profiles of Potentially Non-Dairy Probiotic Formulations. LWT—Food Sci. Technol. 2014, 55, 240–247. [Google Scholar] [CrossRef]
  44. Parker, J.K.; Elmore, S.; Methven, L. Flavour Development, Analysis and Perception in Food and Beverages; Elsevier: Amsterdam, The Netherlands, 2014; ISBN 978-1-78242-111-5. [Google Scholar]
  45. Linstrom, P.J.; Mallard, W.G. The NIST Chemistry WebBook:  A Chemical Data Resource on the Internet. J. Chem. Eng. Data 2001, 46, 1059–1063. [Google Scholar] [CrossRef]
  46. The Good Scents Company—Flavor, Fragrance, Food and Cosmetics Ingredients Information. Available online: http://www.thegoodscentscompany.com/ (accessed on 10 January 2023).
  47. Gou, M.; Chen, Q.; Wu, X.; Liu, G.; Fauconnier, M.-L.; Bi, J. Novel Insight into the Evolution of Volatile Compounds during Dynamic Freeze-Drying of Ziziphus Jujuba Cv. Huizao Based on GC–MS Combined with Multivariate Data Analysis. Food Chem. 2023, 410, 135368. [Google Scholar] [CrossRef]
  48. Villarreal-Soto, S.A.; Beaufort, S.; Bouajila, J.; Souchard, J.P.; Renard, T.; Rollan, S.; Taillandier, P. Impact of Fermentation Conditions on the Production of Bioactive Compounds with Anticancer, Anti-Inflammatory and Antioxidant Properties in Kombucha Tea Extracts. Process. Biochem. 2019, 83, 44–54. [Google Scholar] [CrossRef] [Green Version]
  49. Zailani, N.S.; Adnan, A. Substrates and metabolic pathways in symbiotic culture of bacteria and yeast (scoby) fermentation: A mini review. J. Teknol. 2022, 84, 155–165. [Google Scholar] [CrossRef]
  50. Villarreal-Soto, S.A.; Beaufort, S.; Bouajila, J.; Souchard, J.-P.; Taillandier, P. Understanding Kombucha Tea Fermentation: A Review. J. Food Sci. 2018, 83, 580–588. [Google Scholar] [CrossRef] [PubMed]
  51. Neffe-Skocińska, K.; Sionek, B.; Ścibisz, I.; Kołożyn-Krajewska, D. Acid Contents and the Effect of Fermentation Condition of Kombucha Tea Beverages on Physicochemical, Microbiological and Sensory Properties. Cyta-J. Food 2017, 15, 601–607. [Google Scholar] [CrossRef] [Green Version]
  52. Czaja, W.; Krystynowicz, A.; Bielecki, S.; Brown, R.M. Microbial Cellulose—The Natural Power to Heal Wounds. Biomaterials 2006, 27, 145–151. [Google Scholar] [CrossRef]
  53. Balentine, D.A.; Wiseman, S.A.; Bouwens, L.C.M. The Chemistry of Tea Flavonoids. Crit. Rev. Food Sci. Nutr. 1997, 37, 693–704. [Google Scholar] [CrossRef]
  54. Wang, Y.; Sun, D.; Chen, H.; Qian, L.; Xu, P. Fatty Acid Composition and Antioxidant Activity of Tea (Camellia sinensis L.) Seed Oil Extracted by Optimized Supercritical Carbon Dioxide. Int. J. Mol. Sci. 2011, 12, 7708–7719. [Google Scholar] [CrossRef] [PubMed] [Green Version]
  55. Liu, G.; Yang, M.; Fu, J. Identification and Characterization of Two Sesquiterpene Synthase Genes Involved in Volatile-Mediated Defense in Tea Plant (Camellia sinensis). Plant Physiol. Biochem. 2020, 155, 650–657. [Google Scholar] [CrossRef] [PubMed]
  56. Zhou, Y.; Liu, X.; Yang, Z. Characterization of Terpene Synthase from Tea Green Leafhopper Being Involved in Formation of Geraniol in Tea (Camellia sinensis) Leaves and Potential Effect of Geraniol on Insect-Derived Endobacteria. Biomolecules 2019, 9, 808. [Google Scholar] [CrossRef] [PubMed] [Green Version]
  57. Gershenzon, J.; Dudareva, N. The Function of Terpene Natural Products in the Natural World. Nat. Chem. Biol. 2007, 3, 408–414. [Google Scholar] [CrossRef]
  58. Vieira, A.J.; Beserra, F.P.; Souza, M.C.; Totti, B.M.; Rozza, A.L. Limonene: Aroma of Innovation in Health and Disease. Chem. -Biol. Interact. 2018, 283, 97–106. [Google Scholar] [CrossRef] [PubMed] [Green Version]
  59. Fisher, C.; Scott, T.R. Food Flavours; Springer Science & Business Media: Berlin/Heidelberg, Germany, 1997. [Google Scholar] [CrossRef]
  60. Chan, M.; Sy, H.; Finley, J.; Robertson, J.; Brown, P.N. Determination of Ethanol Content in Kombucha Using Headspace Gas Chromatography with Mass Spectrometry Detection: Single-Laboratory Validation. J. AOAC Int. 2021, 104, 122–128. [Google Scholar] [CrossRef]
  61. Bamforth, C.W.; Cook, D.J. Food, Fermentation, and Micro-Organisms, 2nd ed.; 2019; pp. 1–245. [Google Scholar] [CrossRef]
  62. Lemfack, M.C.; Gohlke, B.O.; Toguem, S.M.T.; Preissner, S.; Piechulla, B.; Preissner, R. MVOC 2.0: A Database of Microbial Volatiles. Nucleic Acids Res. 2018, 46, D1261. [Google Scholar] [CrossRef] [PubMed] [Green Version]
  63. Guittin, C.; Maçna, F.; Sanchez, I.; Barreau, A.; Poitou, X.; Sablayrolles, J.-M.; Mouret, J.-R.; Farines, V. The Impact of Must Nutrients and Yeast Strain on the Aromatic Quality of Wines for Cognac Distillation. Fermentation 2022, 8, 51. [Google Scholar] [CrossRef]
  64. Yang, L.; Liu, H.; Jin, Y.; Liu, J.; Deng, L.; Wang, F. Recent Advances in Multiple Strategies for the Synthesis of Terpenes by Engineered Yeast. Fermentation 2022, 8, 615. [Google Scholar] [CrossRef]
  65. Ferremi Leali, N.; Binati, R.L.; Martelli, F.; Gatto, V.; Luzzini, G.; Salini, A.; Slaghenaufi, D.; Fusco, S.; Ugliano, M.; Torriani, S.; et al. Reconstruction of Simplified Microbial Consortia to Modulate Sensory Quality of Kombucha Tea. Foods 2022, 11, 3045. [Google Scholar] [CrossRef]
  66. Saberi, S.; Cliff, M.A.; van Vuuren, H.J.J. Impact of Mixed S. Cerevisiae Strains on the Production of Volatiles and Estimated Sensory Profiles of Chardonnay Wines. Food Res. Int. 2012, 48, 725–735. [Google Scholar] [CrossRef]
  67. Abaci, N.; Senol Deniz, F.S.; Orhan, I.E. Kombucha—An Ancient Fermented Beverage with Desired Bioactivities: A Narrowed Review. Food Chem. X 2022, 14, 100302. [Google Scholar] [CrossRef]
  68. Bullerman, L.B. SPOILAGE|Fungi in Food—An Overview. In Encyclopedia of Food Sciences and Nutrition, 2nd ed.; Caballero, B., Ed.; Academic Press: Oxford, UK, 2003; pp. 5511–5522. ISBN 978-0-12-227055-0. [Google Scholar]
  69. Ignat, M.V.; Salanță, L.C.; Pop, O.L.; Pop, C.R.; Tofană, M.; Mudura, E.; Coldea, T.E.; Borșa, A.; Pasqualone, A. Current Functionality and Potential Improvements of Non-Alcoholic Fermented Cereal Beverages. Foods 2020, 9, 1031. [Google Scholar] [CrossRef] [PubMed]
  70. Blandino, A.; Al-Aseeri, M.E.; Pandiella, S.S.; Cantero, D.; Webb, C. Cereal-Based Fermented Foods and Beverages. Food Res. Int. 2003, 36, 527–543. [Google Scholar] [CrossRef]
  71. Aly, M.M.A.; Hassan, A.A.; El-Hadidie, S.T. Production of Cereal-Based Probiotic Beverages. World Appl. Sci. J. 2012, 19, 1367–1380. [Google Scholar]
Figure 1. pH evolution of kombucha samples as a function of the fermentation time (day) at 30 °C (mean ± SD; n = 3; Student’s t-test; ****, p < 0.0001; ***)).
Foods 12 01657 g001
Figure 2. Evolution of the concentration of carbohydrates, alcohol, and acids (g/L) as functions of fermentation time (day) at 30 °C (mean ± SD; n = 3).
Foods 12 01657 g002
Figure 3. Changes in average contents (ppm) of different classes of VOCs with kombucha fermentation time (day) at 30 °C.
Foods 12 01657 g003
Figure 4. Correlation between different classes of VOCs during kombucha fermentation stages conducted at 30 °C (a color gradient denotes the Spearman’s correlation coefficients).
Foods 12 01657 g004
Figure 5. Principal component analysis (mean values for VOCs averaged across kombucha fermentation time (day)) plots of variables correlation (cos² color scale) (A) and individuals’ representation (ellipses corresponds to VOCs classes) (B) (labelled individuals are those best represented on the plan).
Foods 12 01657 g005aFoods 12 01657 g005b
Figure 6. Estimated sensory profile is expressed as the log of the OAV for most representative volatile organic compounds (%area > 1%) with kombucha fermentation time (day) at 30 °C (OAV = concentration/perception threshold).
Foods 12 01657 g006
Figure 7. Variation of the estimated sensory profile (expressed as the log of OAV; OAV = concentration/perception threshold) of the most representative volatile compounds (%area > 1%) with temperature (°C) on kombucha fermentation in the (A) intermediate stage (D7) and (B) the final stage (D14).
Foods 12 01657 g007
Table 1. Volatile organic compounds contents 1 (ppm) with kombucha fermentation time (day) conducted at 30 °C.
Raw MatrixKombucha Fermentation Stages
ClassCompoundCAS NumberRI 2RI lit 3Black TeaGreen Tea D0D2D4D7D9D11D14
Carboxylic acid(2E)-3,7-dimethylocta-2,6-dienoic acid4698-08-223262329ndnd5.02 ± 0.264.68 ± 0.844.86 ± 0.345.24 ± 0.786.40 ± 0.917.08 ± 0.815.93 ± 1.47
(9E,12E)-octadeca-9,12-dienoic acid506-21-831713168ndndndnd7.15 ± 0.50ndndndnd
(E)-hexadec-9-enoic acid10030-73-625702579226.30129.69ndnd2.36 ± 0.53nd7.81 ± 4.2110.96 ± 1.02nd
(E)-oct-2-enoic acid1871-67-620842082ndnd1.84 ± 0.661.26 ± 0.29ndndndndnd
(Z)-heptadec-10-enoic acid29743-97-33036303030.22nd8.99 ± 0.152.09 ± 0.6619.46 ± 6.747.55 ± 1.184.45 ± 3.007.35 ± 0.462.18 ± 0.63
(Z)-hexadec-7-enoic acid2416-19-529202924ndndndnd14.03 ± 16.43nd33.57 ± 8.63ndnd
(Z)-hexadec-9-enoic acid373-49-929322944ndnd21.21 ± 0.8445.90 ± 3.93123.34 ± 2.5558.62 ± 5.4541.50 ± 13.5857.22 ± 11.4817.34 ± 10.54
(Z)-nonadec-10-enoic acid73033-09-732583256ndndnd29.08 ± 6.69nd28.66 ± 2.64ndndnd
(Z)-octadec-11-enoic acid506-17-231323135ndndndndnd37.21 ± 12.6126.58 ± 6.8933.99 ± 7.199.91 ± 3.30
(Z)-octadec-9-enoic acid112-80-131333142nd198.03ndnd71.75 ± 98.09ndndndnd
(Z)-tetradec-9-enoic acid544-64-93168317319.90ndnd1.82 ± 0.217.57 ± 6.162.59 ± 1.012.62 ± 1.342.92 ± 1.98nd
2-methylpropanoic acid79-31-215651563ndndndnd2.71 ± 0.043.03 ± 0.302.93 ± 1.085.84 ± 0.408.13 ± 1.48
3-methylbutanoic acid503-74-216651664ndnd5.81 ± 0.477.66 ± 1.417.74 ± 0.2113.86 ± 0.8817.54 ± 4.1931.95 ± 3.2440.74 ± 10.26
acetic acid64-19-714501450ndndndndndndndnd15.17 ± 9.76
butanoic acid107-92-616231628ndndndnd4.15 ± 1.731.86 ± 0.23ndndnd
dec-9-enoic acid14436-32-923002305ndndndndndndndnd0.99 ± 0.24
decanoic acid334-48-52264226721.8317.1013.13 ± 1.013.48 ± 0.2730.58 ± 0.7462.49 ± 1.7471.98 ± 4.2894.60 ± 3.5289.08 ± 7.94
dodecanoic acid143-07-72474247111.967.043.03 ± 0.671.84 ± 0.4811.33 ± 3.144.83 ± 0.603.71 ± 1.034.72 ± 0.841.98 ± 0.61
heptadecanoic acid506-12-73027302719.93ndnd4.74 ± 0.9614.57 ± 4.826.35 ± 1.175.02 ± 0.355.46 ± 1.722.15 ± 0.28
heptanoic acid111-14-8194419462.20nd7.97 ± 0.896.44 ± 1.536.65 ± 2.397.24 ± 1.919.32 ± 1.779.64 ± 1.369.07 ± 1.79
hexadecanoic acid57-10-328982890568.52427.3580.04 ± 0.2197.89 ± 8.45234.64 ± 41.41117.93 ± 11.21100.84 ± 28.5898.64 ± 16.3247.75 ± 12.37
hexanoic acid142-62-118381838ndnd21.23 ± 0.9229.42 ± 6.9143.10 ± 3.4556.00 ± 9.5744.22 ± 6.6260.84 ± 10.6951.37 ± 9.61
nonanoic acid112-05-02171217411.07nd16.73 ± 0.073.54 ± 0.7914.45 ± 0.2218.17 ± 0.1813.72 ± 0.6114.84 ± 1.6513.91 ± 1.11
octadecanoic acid57-11-43107310411.36nd5.01 ± 0.608.66 ± 3.7337.79 ± 6.5012.45 ± 1.0232.22 ± 1.6722.59 ± 2.5513.44 ± 8.88
octanoic acid124-07-2205220505.446.0774.71 ± 0.69164.58 ± 15.00284.03 ± 15.47313.86 ± 10.05321.71 ± 17.22339.21 ± 23.23303.54 ± 9.94
pentadecanoic acid1002-84-227412745150.78102.4216.04 ± 0.6524.28 ± 3.3974.71 ± 23.2336.10 ± 5.8923.62 ± 8.8430.41 ± 7.9610.27 ± 2.85
tetradecanoic acid544-63-826562660134.58107.0418.04 ± 0.0821.12 ± 1.6765.28 ± 17.9731.26 ± 3.4522.05 ± 11.5922.07 ± 3.988.83 ± 2.93
tridecanoic acid638-53-9258025738.57ndndnd4.12 ± 1.121.38 ± 0.041.04 ± 0.451.22 ± 0.07nd
Total 1222.65994.75298.2448.381086.38816.65781.66861.16653.95
Alcoholgeraniol106-24-11840183644.04nd18.03 ± 0.7916.34 ± 0.7115.32 ± 0.80nd13.88 ± 0.9112.78 ± 1.8012.09 ± 1.74
nerol106-25-2179317943.28nd1.98 ± 0.132.14 ± 0.092.11 ± 0.182.70 ± 0.073.08 ± 0.193.40 ± 0.193.16 ± 0.11
linaloolpyran oxide C10448-31-4175517419.58nd1.91 ± 0.113.10 ± 0.551.87 ± 0.211.53 ± 0.121.28 ± 0.251.67 ± 0.291.32 ± 0.07
hotrienol 29957-43-516081613nd2.09nd1.94 ± 0.521.41 ± 0.041.19 ± 0.321.22 ± 0.271.83 ± 0.072.09 ± 0.41
(Z)-hex-3-en-1-ol928-96-113831390ndnd1.11 ± 0.402.34 ± 0.812.10 ± 0.061.83 ± 0.061.77 ± 0.332.13 ± 0.331.79 ± 0.18
1-methoxypropan-2-ol107-98-211521160ndnd47.78 ± 1.1047.04 ± 18.209.54 ± 5.049.64 ± 1.8117.69 ± 5.0717.89 ± 3.73nd
8-camphenemethanol2226-05-316881682ndnd1.11 ± 0.150.92 ± 0.07ndndndndnd
linalool oxide60047-17-814401442ndnd10.87 ± 1.0110.03 ± 1.01ndndndndnd
2,6-dimethylcyclohexan-1-ol5337-72-411121114ndnd5.53 ± 0.704.27 ± 0.432.83 ± 0.062.08 ± 0.011.38 ± 0.421.75 ± 0.101.38 ± 0.00
(-)-α-terpineol10482-56-116901690ndndnd13.22 ± 0.7611.34 ± 1.3213.22 ± 0.3513.16 ± 1.0518.11 ± 1.4516.52 ± 1.24
trans-furan linalool oxide34995-77-214681460109.31nd15.95 ± 0.3515.90 ± 1.9310.64 ± 0.307.97 ± 0.275.95 ± 1.086.95 ± 1.025.28 ± 0.37
2-ethylhexan-1-ol104-76-71489149010.066.863.95 ± 0.108.66 ± 0.609.18 ± 0.4111.76 ± 0.427.75 ± 0.397.83 ± 1.387.94 ± 0.28
2-phenylethanol60-12-8189718901.97nd35.83 ± 0.5377.78 ± 13.55135.58 ± 3.04225.04 ± 5.48242.05 ± 20.25288.59 ± 26.39273.15 ± 2.16
linalool78-70-615461545222.285.4472.18 ± 2.1045.82 ± 2.6333.83 ± 1.9938.39 ± 3.1843.87 ± 4.9153.14 ± 6.2848.69 ± 2.55
3-methylbutan-1-ol123-51-312161218ndnd22.30 ± 3.5527.37 ± 8.7341.89 ± 0.8666.49 ± 11.8261.35 ± 29.29115.60 ± 28.99113.39 ± 8.02
4,8-dimethylnona-1,7-dien-4-ol17920-92-211821191ndndnd1.27 ± 0.17ndndndndnd
4-carvomenthenol562-74-3159715941.34nd1.29 ± 0.420.88 ± 0.12ndndndndnd
butan-1-ol71-36-311571157nd1.01nd3.29 ± 2.613.18 ± 1.572.96 ± 1.24nd3.12 ± 2.192.77 ± 0.16
heptan-3-ol589-82-213171306ndndnd1.50 ± 0.39ndndndndnd
hexan-1-ol111-27-3135413567.27nd10.88 ± 0.535.23 ± 1.021.75 ± 0.231.27 ± 0.14ndndnd
nonan-1-ol143-08-8165716661.12nd1.89 ± 0.172.38 ± 0.133.14 ± 0.031.62 ± 0.21ndndnd
oct-1-en-3-ol3391-86-4145014563.80nd1.91 ± 0.091.00 ± 0.24ndndndndnd
octan-1-ol111-87-515561565ndnd5.44 ± 0.772.73 ± 0.624.30 ± 0.463.33 ± 0.311.76 ± 0.19ndnd
Total 414.0515.39260.25294.48290.03390.63415.71528.83484.51
Aldehydeβ-cyclocitral432-25-71613161113.3430.775.63 ± 0.561.96 ± 0.11ndndndndnd
2-phenylacetaldehyde122-78-116351632ndndndndndndndnd1.35 ± 0.00
3-methylbenzaldehyde620-23-516381635ndndndnd3.19 ± 0.04ndndndnd
benzaldehyde100-52-71611161710.54nd34.41 ± 1.19ndnd1.78 ± 0.051.02 ± 0.05ndnd
decanal112-31-21499149810.80ndnd2.20 ± 0.362.65 ± 0.342.22 ± 0.21.61 ± 0.21nd1.34 ± 0.05
hexanal66-25-11099109410.0222.549.07 ± 0.696.32 ± 0.444.73 ± 0.432.96 ± 1.751.93 ± 0.402.68 ± 0.42nd
nonanal124-19-61395139034.69ndnd7.06 ± 1.007.07 ± 0.086.57 ± 1.114.94 ± 0.434.86 ± 1.494.13 ± 0.39
Total 79.4053.3249.1214.7117.6313.549.517.536.37
Benzenestyrene100-42-51258125917.4462.63nd1.60 ± 0.98ndndndndnd
Total 17.4462.63nd1.60ndndndndnd
Ketonecis-dihydrocarvone3792-53-816001602ndndnd2.70 ± 0.19ndndndndnd
(3E)-6-methylhepta-3,5-dien-2-one1604-28-015881582ndnd1.81 ± 0.321.14 ± 0.30ndndndndnd
(3E,5E)-octa-3,5-dien-2-one30086-02-315661565ndnd5.08 ± 0.0614.85 ± 1.51ndndndndnd
dihydroactinidiolide17092-92-1229122917.9096.507.95 ± 0.167.98 ± 0.976.98 ± 0.375.80 ± 0.425.37 ± 0.906.35 ± 0.705.90 ± 0.31
dehydro-β-ionone 1203-08-319271932ndndndndnd1.06 ± 0.07nd1.34 ± 0.191.30 ± 0.24
β-ionone14901-07-6196419676.1523.292.77 ± 0.171.63 ± 0.06ndndndndnd
1-(5-methylthiophen-2-yl)ethanone13679-74-8118511970.896.45ndndndnd2.13±1.27 ± 0.251.24 ± 0.12
β-ionone epoxyde 23267-57-4196319686.5661.744.26 ± 0.403.52 ± 0.162.89 ± 0.042.06 ± 0.121.44 ± 0.15ndnd
5-methylheptan-2-one18217-12-4114511524.5891.06ndndndndndnd2.26 ± 0.34
6-methylhept-5-en-2-one110-93-01337134012.823.097.01 ± 0.293.94 ± 0.752.04 ± 0.142.19 ± 0.472.08 ± 0.052.17 ± 0.201.38 ± 0.31
Total 38.90282.1228.8735.7711.9111.1211.6910.4111.33
(1-ethynylcyclohexyl) carbamate126-52-313161313ndndndnd3.37 ± 0.03ndndndnd
2-(1H-indol-3-yl)ethyl acetate13137-14-918631865ndndndnd10.21 ± 4.1620.53 ± 3.1931.63 ± 6.0125.18 ± 1.1120.59 ± 1.53
2-phenylethyl acetate103-45-718061808ndnd4.63 ± 0.533.93 ± 0.567.12 ± 0.5312.93 ± 1.0319.63 ± 3.2328.51 ± 2.4740.66 ± 4.15
Esterethyl 2-phenylacetate101-97-317771763ndndndndndnd1.25 ± 0.131.55 ± 0.071.86 ± 0.06
ethyl hexanoate123-66-012391241ndndndndnd2.36 ± 0.383.31 ± 0.763.99 ± 1.135.87 ± 1.53
methyl 2-hydroxybenzoate119-36-81764176617.03nd17.61 ± 0.5910.05 ± 0.86ndndndndnd
methyl hexanoate106-70-711901184ndnd1.45 ± 0.673.60 ± 3.412.50 ± 0.73nd1.46 ± 0.282.73 ± 0.522.73 ± 0.24
Total 17.030.0023.7016.3815.4735.8146.7461.4471.71
Phenol4-ethyl-2-methoxyphenol2785-89-920162020ndnd7.86 ± 0.3911.82 ± 1.1129.02 ± 1.5330.88±30.85±32.44 ± 2.4629.59 ± 1.71
4-ethylphenol123-07-921612164ndnd7.99 ± 0.0810.54 ± 1.1828.53 ± 0.1029.04±27.10±28.74 ± 3.2324.46 ± 2.22
Total ndnd16.0222.3657.5559.9257.9561.1854.06
α-farnesene502-61-416871695ndndndndndndndnd1.078 ± 0.02
(-)-limonene5989-54-810271027ndnd12.89 ± 0.9811.87 ± 15.94ndndndndnd
squalene111-02-428652865563.30510.25139.59 ± 0.65151.29 ± 17.3311.75 ± 73.96184.91 ± 27.17125.47 ± 9.83158.35 ± 10.8375.91 ± 20.61
m-cymene535-77-31272127010.3933.08nd1.06 ± 0.30ndnd2.44 ± 0.09ndnd
Terpenelimonene138-86-31194119560.28121.01nd13.01 ± 6.448.28 ± 0.504.28 ± 1.103.69 ± 1.063.41 ± 0.57nd
p-cymene99-87-612661268ndnd2.74 ± 0.49ndndndnd3.23 ± 0.91nd
γ-terpinene99-85-4124212421.905.591.43 ± 0.771.70 ± 0.23ndndndndnd
α-phellandrene99-83-211671166ndndnd5.36 ± 2.482.70 ± 1.322.09 ± 0.782.05 ± 0.23ndnd
Δ-3-carene498-15-711521150ndndnd9.96 ± 1.60nd3.68 ± 1.31nd4.91 ± 2.672.73 ± 0.47
Total 635.88669.93156.66183.89322.73194.97131.60168.7778.45
1. Data are expressed as the mean ± SD; “nd”: Not detected. 2. RI: Retention indices on Carbowax 20M column were determined by n-alkanes. 3. RI lit: Literature Retention indices reported for polar capillary Carbowax 20M column [45].
Table 2. OAV evolution of most representative volatile organic compounds (%area > 1%) with kombucha fermentation time (day) conducted at 30 °C (OAV = concentration/perception threshold).
Raw MatrixKombucha Fermentation Stages
Class CompoundCASRI 1RI li 2Perception Threshold (ppm) [46]Aroma Description [46]Black TeaGreen TeaD0D2D4D7D9D11D14
Carboxylic acidA13-methylbutanoic acid503-74-21665166450Cheesy, dairy, acidic, sourndnd0.120.150.150.280.350.640.81
A2acetic acid546-67-81450145050.5Sour vinegarndndndndndndndnd0.30
A3hexadecanoic acid57-10-32898289075Creamy, waxy7.585.701.071.303.131.571.341.310.64
A4nonanoic acid112-05-02171217410Waxy, dairy, cheesy1.111.670.351.441.821.371.481.39nd
A5tetradecanoic acid544-63-82656266035Faint, waxy, fatty3.843.060.510.601.860,890.630.630.25
AlcoholB1geraniol106-24-1184018363Floral, sweet, rosy14.68nd5.825.455.11nd4.634.264.03
B22-phenylethanol60-12-81897189020Sweet, floral, bready, honey0.10nd1.773.896.7811.2512.1014.4313.66
B3linalool78-70-61546154510Citrus, floral, orange, terpeny22.290.547.374.583.383.844.395.314.87
B43-methylbutan-1-ol123-51-31216121850Fusel, fermented, pungentndnd0.400.540.841.331.232.312.27
AldehydeC1benzaldehyde100-52-71611161750Almond, fruity, nutty0.21nd0.70ndnd0.040.02ndnd
EsterD1methyl 2-hydroxybenzoate119-36-81764176610Sweet, minty, root beer1.70nd1.721.00ndndndndnd
PhenolE14-ethyl-2-methoxyphenol2785-89-92016202030Spicy, sweet vanilla, woodyndnd0.270.390.971.031.031.080.98
TerpeneF1α-farnesene502-61-41687169515Citrus, herbal, lavender, bergamotndndnd10.0920.7812.338.3610.565.06
F2α-phellandrene99-83-21167116620Citrus, herbal, terpeny, greenndndnd0.05ndnd0.120.17nd
F3γ-terpinene99-85-41242124240Oily, woody, terpeny, tropical herbal0.050.140.050.320.210.110.090.08nd
F4limonene138-86-31194119530Citrus, orange, fresh, sweet2.014.030.41nd0.10ndndndnd
F5p-cymene99-87-6126612685.5Woody, spicy, cumin,
oregano
ndnd0.431.810.560.67ndndnd
1. RI: Retention indices on Carbowax 20M column were determined by n-alkanes. 2. RI lit: Literature Retention indices reported for polar capillary Carbowax 20M column [45].
Disclaimer/Publisher’s Note: The statements, opinions and data contained in all publications are solely those of the individual author(s) and contributor(s) and not of MDPI and/or the editor(s). MDPI and/or the editor(s) disclaim responsibility for any injury to people or property resulting from any ideas, methods, instructions or products referred to in the content.

