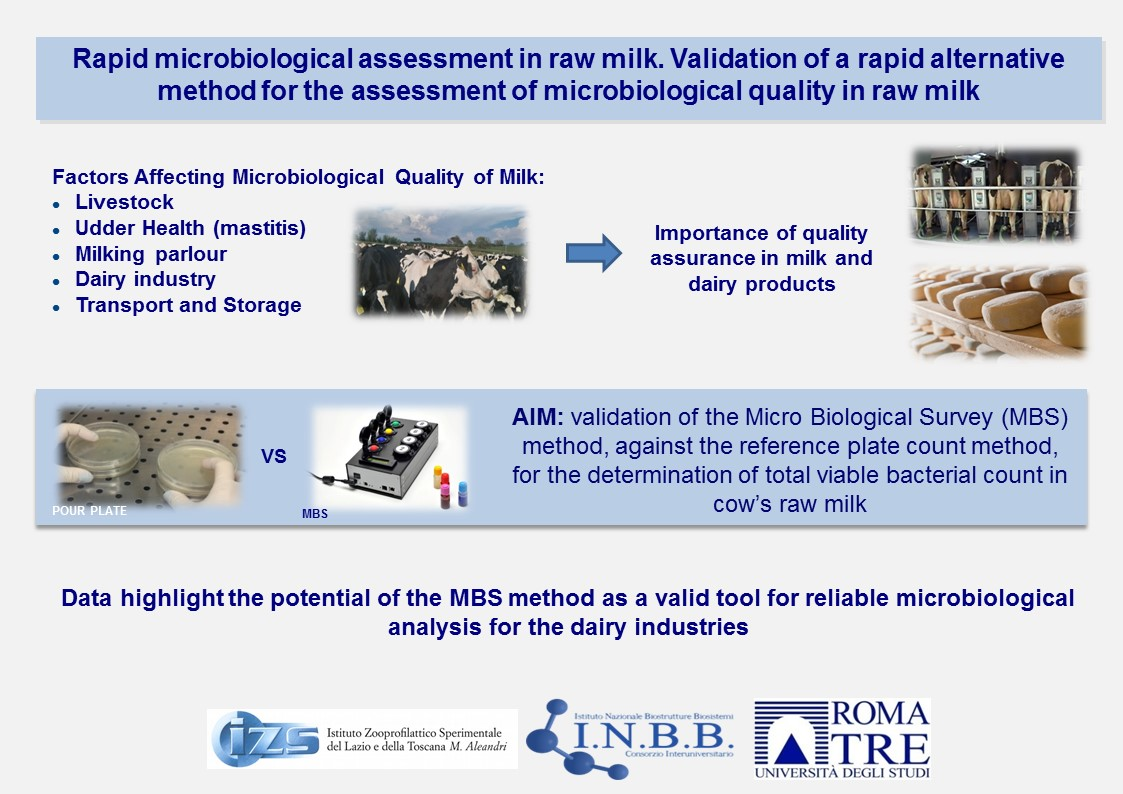
Rapid Microbiological Assessment in Raw Milk: Validation of a Rapid Alternative Method for the Assessment of Microbiological Quality in Raw Milk

 ,
,
Abstract
:
1. Introduction
2. Materials and Methods
3. Results
4. Discussion
5. Conclusions
Author Contributions
Funding
Acknowledgments
Conflicts of Interest
References
- Griffiths, M.W. Improving the Safety and Quality of Milk; Woodhead Publishing Limited: Cambridge, UK, 2010. [Google Scholar]
- Giacometti, F.; Bonilauri, P.; Albonetti, S.; Amatiste, S.; Arrigoni, N.; Bianchi, M.; Bertasi, B.; Bilei, S.; Bolzoni, G.; Cascone, G.; et al. Quantitative Risk Assessment of Human Salmonellosis andListeriosis Related to the Consumption of Raw Milk in Italy. J. Food Prot. 2015, 78, 13–21. [Google Scholar] [CrossRef] [PubMed]
- Barbano, D.M.; Ma, Y.; Santos, M.V. Influence of raw milk quality on fluid milk shelf life. J. Dairy Sci. 2006, 89, E15–E19. [Google Scholar] [CrossRef]
- European Parliament and the Council of 29 April 2004. Regulation (EC) n. 853/2004: Laying Down Specific Hygiene Rules for Food of Animal Origin. Available online: https://eur-lex.europa.eu/legal-content/EN/TXT/PDF/?uri=CELEX:32004R0853&from=EN (accessed on 11 August 2020).
- Ministerodella Salute–Decreto 12 Dicembre 2012. InformazioniObbligatorie e Misure a Tutela del Consumatore di Latte Crudo o Crema Cruda, in Attuazionedell’art. 8, commi 6 e 9, del Decreto-Legge 13 Settembre 2012, n. 158, Recante “DisposizioniUrgenti per Promuovere lo Sviluppo del PaeseMediante un PiùAlto Livello di Tutela dellaSalute” Convertito, con Modificazioni, dallaLegge 8 novembre 2012, n. 189. Available online: https://www.gazzettaufficiale.it/eli/id/2013/01/29/13A00727/sg (accessed on 11 August 2020).
- Giacometti, F.; Bonilauri, P.; Serraino, A.; Peli, A.; Amatiste, S.; Arrigoni, N.; Bianchi, M.; Bilei, S.; Cascone, G.; Comin, D.; et al. Four-year monitoring of foodborne pathogens in raw milk sold by vending machines in Italy. J. Food Prot. 2013, 76, 1902–1907. [Google Scholar] [CrossRef]
- European Parliament and of the Council of 28 January 2002. Regulation (EC) n. 178/2002: Laying Down the General Principles and Requirements of Food Law, Establishing the European Food Safety Authority and Laying Down Procedures in Matters of Food Safety. Available online: https://eur-lex.europa.eu/legal-content/EN/TXT/PDF/?uri=CELEX:32002R0178&from=EN (accessed on 11 August 2020).
- International Standard Organization. ISO 4833-1:2013: Microbiology of the Food Chain—Horizontal Method for the Enumeration of Microorganisms—Part 1: Colony Count at 30 °C by the Pour Plate Technique. Available online: https://www.iso.org/standard/53728.html (accessed on 11 August 2020).
- International Standard Organization. ISO 21187:2004 (IDF 196:2004): Milk—Quantitative Determination of Bacteriological Quality—Guidance for Establishing and Verifying a Conversion Relationship between Routine Method Results and Anchor Method Results. Available online: https://www.iso.org/standard/34434.html (accessed on 11 August 2020).
- Losito, F.; Arienzo, A.; Bottini, G.; Priolisi, F.R.; Mari, A.; Antonini, G. Microbiological safety and quality of Mozzarella cheese assessed by the microbiological survey method. J. Dairy Sci. 2014, 97, 46–55. [Google Scholar] [CrossRef] [PubMed] [Green Version]
- Antonini, G.; Arienzo, A.; Losito, F.; Stalio, O. Comparison of Uncertainty between Traditional and Alternative Methods for Food Microbiological Analysis. Am. J. Food Technol. 2016, 11, 29–36. [Google Scholar] [CrossRef]
- International Standard Organization. ISO 7218:2007/AMD 1:2013: Microbiology of Food and Animal Feeding Stuffs—General Requirements and Guidance for Microbiological Examinations. Available online: https://www.iso.org/standard/36534.html (accessed on 11 August 2020).
- International Standard Organization. ISO 16297:2020: Milk-Bacterial Count-Protocol for the Evaluation of Alternative Methods. Available online: https://www.iso.org/standard/75146.html (accessed on 11 August 2020).
- Antonini, G.; Stalio, O.; Arienzo, A.; Losito, F.; Murgia, L.; Angelini, M.C.; Pizzato, C.; Tenore, C.; Fiori, F. How to Warrant Microbiological Food Safety in Food Companies: Problems and a Possible Solution. Food Stud. Interdiscip. J. 2018, 8, 29–51. [Google Scholar] [CrossRef]
- Antonini, G.; Bottini, G.; Losito, F.; De Ascenti, A.; Priolisi, F.R.; Mari, A. Validation of the Micro Biological Survey Method for Total Viable Count and E. coli in Food Samples. Am. J. Food Technol. 2011, 6, 951–962. [Google Scholar] [CrossRef] [Green Version]
- Antonini, G.; Losito, F.; Bottini, G.; De Ascentis, A.; Priolisi, F.R.; Mari, A.; Tarsitani, G. Qualitative and Quantitative Validation of the Micro Biological Survey Method for Listeria spp., Salmonella spp., Enterobacteriaceae and Staphylococcus aureus in Food Samples. Am. J. Food Technol. 2012, 7, 340–351. [Google Scholar] [CrossRef]
- Arienzo, A.; Stalio, O.; Losito, F.; Murgia, L.; Perrone, I.; Biondi, A.; Tarsitani, G.; Antonini, G. A Simplified and Affordable Trend Analysis to Improve Microbiological Quality of Ready-to-Eat Food Products. Food Stud. Interdiscip. J. 2020, in press. [Google Scholar]


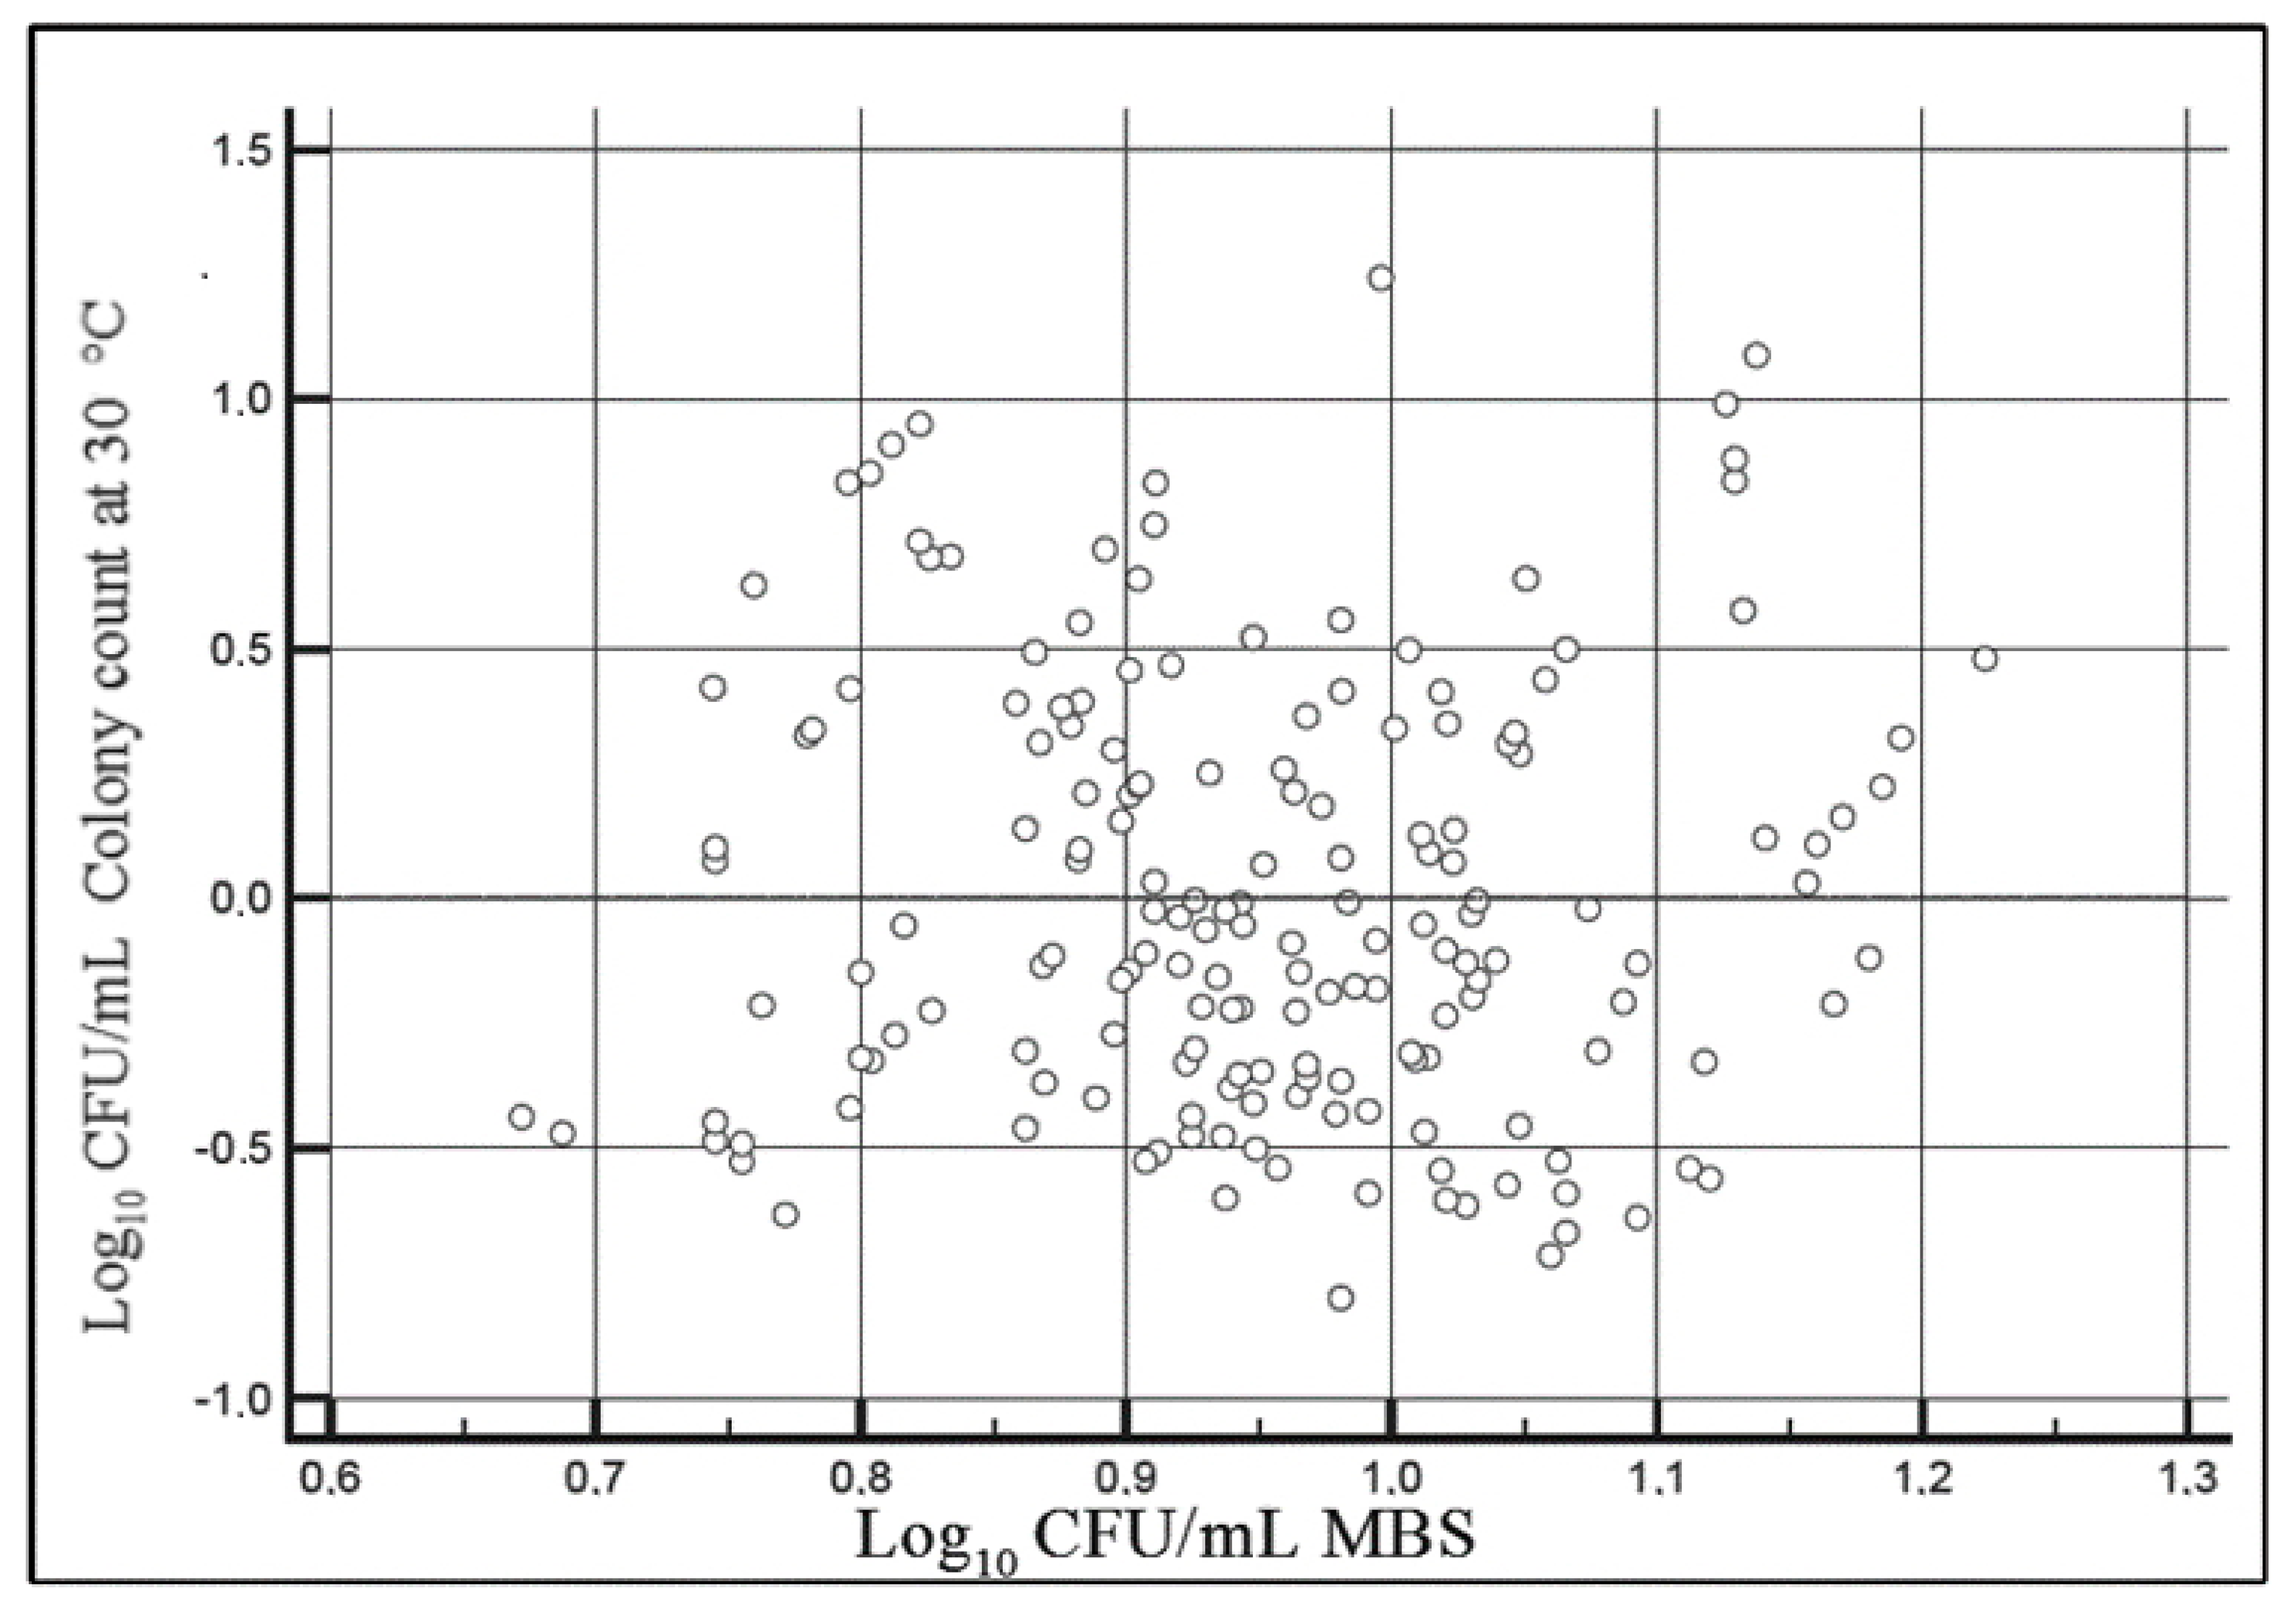
| N Samples | Pearson (r) | R2 | Sy:x | Intercept (Standard Error) | Slope (Standard Error) |
|---|---|---|---|---|---|
| 173 | 0.83 | 0.69 | 0.43 | 0.29 | 0.30 |
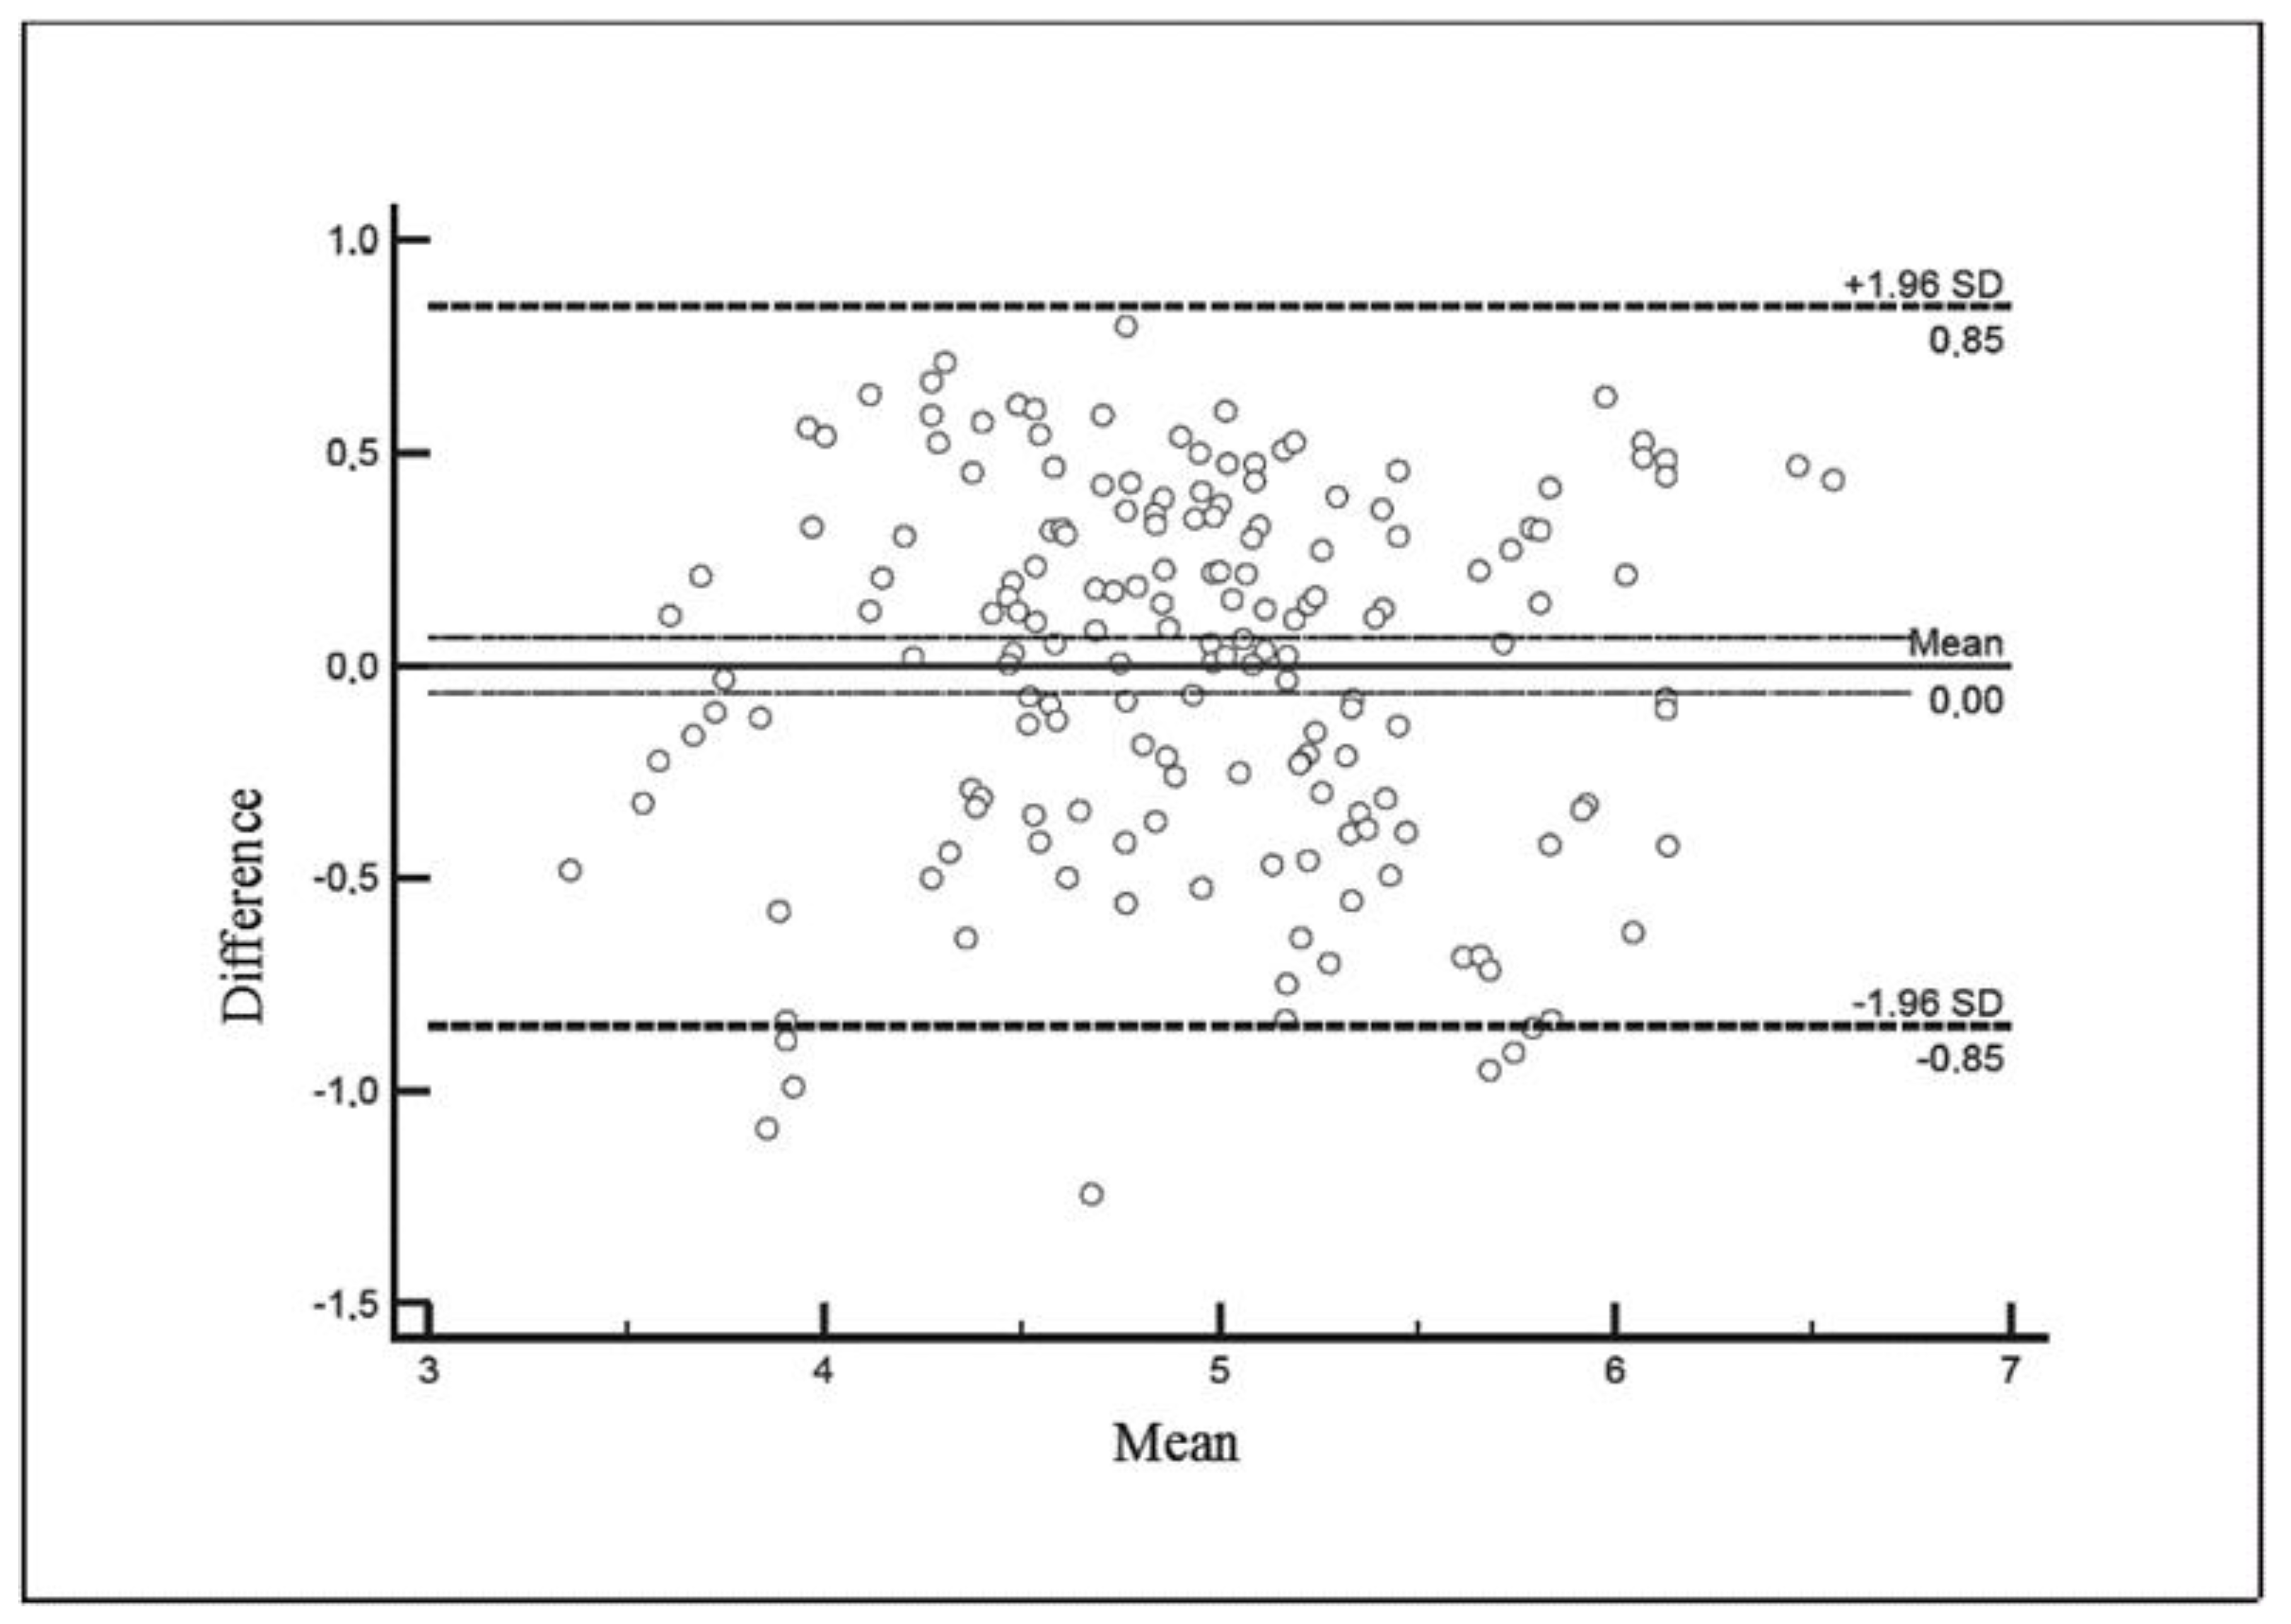
| Group Range (log10 CFU/mL) | 3.40–3.90 | 3.92–4.40 | 4.41–4.90 | 4.91–5.40 | 5.41–5.89 | 5.92–6.67 |
|---|---|---|---|---|---|---|
| Group range (CFU/mL × 1000) | 2.5–8.0 | 8.1–25 | 26–80 | 81–251 | 257–776 | 832–4.677 |
| N samples | 19 | 22 | 47 | 34 | 30 | 21 |
| CI upper | 1.05 | 0.77 | 0.77 | 0.59 | 0.57 | 0.23 |
| CI lower | −0.37 | −0.04 | −0.54 | −0.78 | −0.77 | −1.37 |
© 2020 by the authors. Licensee MDPI, Basel, Switzerland. This article is an open access article distributed under the terms and conditions of the Creative Commons Attribution (CC BY) license (http://creativecommons.org/licenses/by/4.0/).
Share and Cite
Marri, N.; Losito, F.; Le Boffe, L.; Giangolini, G.; Amatiste, S.; Murgia, L.; Arienzo, A.; Antonini, G. Rapid Microbiological Assessment in Raw Milk: Validation of a Rapid Alternative Method for the Assessment of Microbiological Quality in Raw Milk. Foods 2020, 9, 1186. https://0-doi-org.brum.beds.ac.uk/10.3390/foods9091186
Marri N, Losito F, Le Boffe L, Giangolini G, Amatiste S, Murgia L, Arienzo A, Antonini G. Rapid Microbiological Assessment in Raw Milk: Validation of a Rapid Alternative Method for the Assessment of Microbiological Quality in Raw Milk. Foods. 2020; 9(9):1186. https://0-doi-org.brum.beds.ac.uk/10.3390/foods9091186
Chicago/Turabian StyleMarri, Nicla, Francesca Losito, Loris Le Boffe, Gilberto Giangolini, Simonetta Amatiste, Lorenza Murgia, Alyexandra Arienzo, and Giovanni Antonini. 2020. "Rapid Microbiological Assessment in Raw Milk: Validation of a Rapid Alternative Method for the Assessment of Microbiological Quality in Raw Milk" Foods 9, no. 9: 1186. https://0-doi-org.brum.beds.ac.uk/10.3390/foods9091186