
Distinguishing Organisational Profiles of Food Loss Management in Logistics


Institute for Technology and Management, Berlin University of Technology, 10623 Berlin, Germany
Logistics 2022, 6(3), 61; https://0-doi-org.brum.beds.ac.uk/10.3390/logistics6030061
Submission received: 14 June 2022
/
Revised: 13 July 2022
/
Accepted: 12 August 2022
/
Published: 17 August 2022
(This article belongs to the Special Issue Optimal Supply Chain Design and Operations from an Environmental Sustainability Perspective)
Abstract
:Background: Food loss management (FLM), which is discussed at length in the literature, lacks a scientific basis on which to determine the current engagement of actors in the food value chain and what is relevant to derive appropriate measures according to the circumstances in the organisations concerned. Therefore, this paper aims to derive patterns by which the engagement of actors can be distinguished and, on this basis, to make recommendations for further action. Methods: Based on an online survey of 40 participants, a clustering analysis was conducted using the unsupervised learning method and hierarchical clustering (R and R Studio). Results: Five clusters representing different profiles were derived, showing how actors in the food value chain have addressed FLM in the past. The derived profiles do not represent stages of development but rather characteristics of organisations that have addressed FLM in a certain way in the past. Conclusions: For the five organisational profiles, recommendations for action were given for further engagement with FLM. As the level of engagement with FLM increases, organisations should tackle increasingly complex measures to reduce food losses. At the same time, a shift in measures from the tactical to the strategic planning level was derived.
1. Introduction
A growing awareness of sustainable consumption has been observed among consumers for some time [1]. This awareness relates not only to, for example, regionality and reduction in CO2 emissions, but also increasingly to the demand for food value chains to have as few losses as possible [2]. This trend is also reflected in the goals of the global community, which specifically stated in Target 12.3 of the Sustainable Development Goals of the United Nations that food losses should be halved worldwide [3]. Although this target suggests that there is a clear picture of the amount of loss, such information is not available. Accurate data are lacking due to a lack of awareness among stakeholders and the fact that neither a standard for recording losses nor a uniform definition of the delimitation of losses has been established [4]. The Food and Agriculture Organization of the United Nations and the United Nations Environment Program have taken the first steps towards outlining a clearer quantitative picture of global food losses and waste with the Food Loss Index and the Food Waste Index by compiling many publicly available sources with estimates and surveys [5]. In recent years, several scientists have investigated various measures that can contribute to the reduction in lifecycle losses in logistics processes [6,7,8], particularly the implementation of technological solutions that have the potential to reduce food losses [9,10,11,12,13,14].
However, these significant steps do not provide a complete picture that companies and other actors in the food value chain can use to guide their food loss management (FLM) activities.
Minimal focus is being placed on how organisations in food value chains in general are currently addressing FLM and how measures against food losses are selected on the basis of these conditions. Without an understanding of the extent to which organisations have already gained experience in this area, it is difficult to develop measures tailored to the given circumstances in an organisation.
Nonetheless, to address the issue and provide food value chain actors with a way to determine where they stand, a qualitative readiness assessment model of an organisation’s FLM was developed [15]. Based on this model, the question arose as to the actual readiness level of actors in the food value chain in practice. Furthermore, on this basis, it was determined on which fields of action of FLM in logistics these actors should focus their activities on the best case, which resulted in the following research questions:
- RQ1:
- How can organisations of food value chains be differentiated in terms of their readiness levels with regard to the implementation of FLM in logistics?
- RQ2:
- How can this distinction be used to derive recommendations for action for the future implementation of FLM in logistics?
To answer these questions, the theoretical background is presented below. Subsequently, the methodology used for data collection via an online survey and the data analyses using a cluster analysis are described. The five resulting clusters are analysed and explained in the results section. The implication section derives recommendations for action for the company characteristics identified in the clusters.
2. Theoretical Background
This section presents the theoretical background needed to understand the research presented in this paper.
2.1. Food Loss Management in Logistics
Food logistics is defined as:
‘the planning, management and control of the food value network from the source of raw materials to the customer. The focus is on the efficient processing of customer orders with the help of information systems, technologies and management concepts, with special consideration of high item-specific quality and safety requirements of perishable goods in different temperature ranges’[2] (p. 6)
‘Food loss’ is a term for which there are many definitions in the literature, especially when distinguished from the term ‘food waste’ [16,17,18,19]. This paper follows the understanding of the High-Level Panel of Experts (HLPE) on Food Security and Nutrition of the European Union, which defines food loss as the loss of mass food that was intended for human consumption at all stages of the food chain before it reaches the end consumer. By contrast, food waste is defined as the loss of mass food intended for human consumption at the end consumer stage [20].
The following hierarchy (highest to lowest) was developed with regard to the ways in which losses can be addressed: avoidance of losses, reuse (e.g., through food banks), recycling (e.g., further processing into animal feed or composting), recovery (e.g., losses are used for energy generation) and disposal, which should be avoided if possible [21].
Following this understanding, the definition of FLM in logistics was derived as follows:
The organisation of preventive measures within the planning, management and control of the value-added network of food as well as the organisation of re-use, recycling and recovery measures. These measures can have a strategic, tactical or operational character and can be assigned to the following 13 fields of action: transparency, quality management, packaging management, transport optimisation, warehouse management, network structure, physical characteristics, shelf-life optimisation, network cooperation, mindfulness, consumer satisfaction, regulation and financing opportunities.(Table 1)
Various activities with different objectives can be carried out within these fields of action. Considering the most important aspects relevant in logistics, these include measures that contribute to the overall improvement of quality, shorten the time to consumers and/or aim to optimise costs while considering the reduction in food losses.
The framework conditions are primarily the responsibility of administrative and regulatory authorities, which are not the focus of this study; therefore, these fields of action are not analysed further.
The fields of action of FLM can also be categorised in terms of management level (strategic, tactical, operational) and application level (internal, cross-organisational) (see Figure 1).
2.2. Structure of Food Value Chains
Today’s food value chains are often characterised by complex structures and many actors.
By definition, measures undertaken by the end consumer are not included in this work. While the first group of actors is farmers, not all of their activities are discussed in this study. For example, work in the field that leads to losses cannot be directly assigned to FLM in logistics. However, all operational processes of storage and food transport carried out by the farmer belong to it. Thus, this group of actors was considered in FLM in logistics. The process of post-harvesting is also partly carried out by farmers, but it is also carried out by logistics service providers or intermediaries [23,24,25,26].
In international logistics chains in particular, import and export companies are the next actors to handle food. They are usually responsible for the control of cross-border transport, even if they are operationally carried out by logistics service providers. If the consumption or production takes place in the country of origin, the transport carried out by local service providers is the next step in the chain. For products sent for further processing, production follows regardless of the current location. Losses that occur directly through production processes are not the direct focus of FLM in logistics, but processes that are part of production logistics are included. Further transport, whether local or international, follows production to access the consumer markets [25,27,28].
The food then reaches the end customers via markets or wholesalers (retailers, restaurants and caterers). Authorities and regulatory authorities also influence food value chains through guidelines and regulations that influence FLM [16,17,25]. Furthermore, especially in developing countries, NGOs are important actors in the food value chain. Depending on the local situation, they take on different tasks and are thus actors who have to carry out FLM. The structure of the food value chain outlined here is shown in Figure 2.
After introducing the scope of the study, the following section presents how actors in the food value chain can approach FLM.
2.3. Readiness Assessment in Food Loss Management
The discussion of logistical processes includes the following five dimensions: employees, network, technology, strategy and process [29].
Under this structure, presented in Figure 3, the activities of an organisation in the food value chain were examined. At the employee level, the extent to which they were regularly offered training on the reduction in losses was considered, along with the extent to which relevant information on food loss was made available to decision makers, and whether incentive systems were established to encourage employees to contribute ideas for the reduction in food losses.
At the network level, both the strength of cooperation and joint work with network partners on projects to reduce losses were considered. In addition, the extent to which agreements existed with network partners on how losses were dealt with between partners was investigated.
The technology level considered how organisations introduced new technologies to reduce food losses, the extent to which technology was used to achieve loss transparency, and the extent to which technical interfaces were used to communicate with network partners.
The strategy level examined how much knowledge about losses was available in the organisation’s processes, whether and to what extent the organisation made financial commitments to reduce the losses of living resources, and the extent to which management demonstrated the importance of FLM.
The consideration of process levels included the sensitivity of forecasting, the defined processes regarding the handling of food losses and the documentation of FLM processes [15].
3. Research Design
To identify the readiness levels of actors within the food value chain, a hierarchical clustering method was applied using underlying data drawn from an online survey. Due to the resources available and the given circumstances of the COVID-19 pandemic (which made face-to-face interviews impossible), an online survey using the Unipark platform was chosen for data collection.
The cluster analysis used is an exploratory data analysis technique based on interpretation by a researcher who has insight into the original data [30]. The method provides the possibility of finding connections in the data with the help of machine learning, which might be immediately self-evident, and an approach to classifying or grouping observations; thus, it delivers the results necessary for the research questions [30,31]. The method was suitable in the present use case because the database contained many different variables for which the identification of commonalities and patterns would be difficult for humans to discern, and which corresponds directly to the strengths of cluster analysis.
In the following section, the data collection and analysis are described in detail.
3.1. Data Collection
To conduct the cluster analysis, a questionnaire was developed, based on the system described above, to measure the readiness level of FLM in logistics [15]. Using the above-mentioned dimensions of the model, statements were formulated for which an assessment was made on a seven-point Likert scale as to the extent to which this statement applied to the respective structures. The statements were derived from the above theoretical background and modified by feedback from colleagues [29].
Four statements were developed for the employee level:
- The organisation’s employees are regularly trained in food handling and food loss prevention;
- The organisation’s employees are regularly provided with data on the volume of food losses within the organisation to create transparency;
- Employees with decision-making authority are provided with all necessary information regarding food losses to support decision making;
- Employees are motivated to make suggestions for process improvements that will lead to a reduction in food losses through an incentive system.
Five statements were formulated for the network level:
- We provide our direct network partners with information about our food losses on a regular basis;
- Our direct network partners provide us with information about their food losses on a regular basis;
- If we receive spoiled/inappropriate food products from a supplier, we have agreed upon processes with our suppliers regarding how to deal with these food products;
- If our customers receive spoiled/inappropriate food from us, we have agreed upon processes with our customers regarding how to deal with these food products;
- We work with our network partners on joint projects to reduce losses across organisational boundaries.
Four statements were developed for the technology level:
- Information technologies are used efficiently to collect data on food losses;
- Information technologies are used efficiently to increase transparency regarding food losses;
- The organisation regularly reviews new technologies for their potential to improve the organisation’s FLM;
- Electronic data interfaces have been established with network partners to share food loss data.
Seven statements were created for the strategy level:
- We have an exact overview of losses in our processes and can quantify them;
- We have an accurate overview of the financial expenses that cause food losses and can quantify them;
- Management leads by making FLM a key strategic issue and supporting continuous improvement;
- The organisation’s specific FLM objectives and requirements are properly defined;
- FLM activities are included in the organisation’s business plans, and continuous improvement tools are defined;
- For FLM, an organisational structure that demands and utilises the full potential of the workforce is implemented;
- Targeted communication is used to increase food loss awareness and participation and to reinforce the message.
Four statements were formulated for the process level:
- The organisation prepares sales forecasts that regularly reflect reality;
- There is a documented process description that identifies known causes of losses and highlights avoidance strategies;
- The organisation has clear, formalised procedures for collecting food loss data;
- The organisation has specific, formalised procedures for dealing with food losses that occur.
In addition, the following two questions were formulated for the process level, each with the indicated single-choice options:
- Which of the following is the most common form used by the organisation for food losses?
- ○
- No storage strategies in place (scale value 1), last-in, first-out (LIFO) (scale value 3), first-in, first-out (FIFO) (scale value 5), first-expired, first-out (FEFO) (scale value 7);
- What is the organisation’s storage strategy for perishable products?
- ○
- Disposal (scale value 1), recovery energy (e.g., via anaerobic digestion) (scale value 3), recycling food loss into animal feed or composting (scale value 5), re-using surplus food for human consumption through redistribution networks or food banks (scale value 7)
The questionnaire also included a section asking which fields of action of FLM the respondents had already implemented and which of these fields of action should be addressed in the future [22]. Furthermore, general questions on the demographics of the respondents were asked.
This online (and anonymous) questionnaire was sent to 171 companies and organisations involved in the food value chain, during the period 15 January to 28 February 2022. Forty responses were suitable for analysis and evaluation, which translated to a response rate of 23.4%. The average response time was 18 min and 25 s. The number of research items was relatively small; therefore, it cannot be assumed that the sample was representative. The aim of the study was not to make binding statements for all organisations, but rather to make initial deductions on the basis of the information found. Further studies can use this information as a starting point.
3.2. Data Analysis
After the end of the survey period, the data were exported from the Unipark platform. MS Excel was used for the descriptive analysis, and SPSS, as well as R and R Studio, were used for further statistical evaluations and analyses and for the application of the clustering algorithm.
3.2.1. Demographics
Figure 4 shows the participation of the different actors in the food value chain.
The largest group of participants was logistics service providers, with 11 participants, followed by manufacturers with 10 participants, import–export businesses with 9 participants and authorities or NGOs with 6 participants and 4 participants who assigned themselves to the group of farmers. There were no representatives from the group of retailers within the participating organisations. Organisation size was measured by the number of employees and annual revenue. Both indicators are shown in Figure 5.
According to the European Union’s definition, 36 of the participating organisations were small- and medium-sized enterprises [32]. While 5 organisations were micro companies, 10 were small companies and 21 were medium-sized companies.
3.2.2. Cluster Analysis
Clustering is an unsupervised technique for grouping similar objects, whereby the structure of the data determines the best groups. Unsupervised means that the application of the chosen algorithm is carried out by the system without external influence. Thus, the solution path is not necessarily transparent to the applying scientist. The groups therefore resulted from the chosen algorithm. All observations were evaluated based on their ‘distance‘ from one another and grouped into clusters. In this case, the proximity or distance between the observations was calculated using Euclidean distance. For the distance between the clusters, Ward’s D2 method was used [6,31].
To find commonalities in the cases analysed, an index was formed for each of the five dimensions presented and surveyed; these indices were used as variables for clustering. To obtain an overall view of the general engagement with the FLM of an organisation, an overall index was also calculated from five indices, called the FLM index. The decision on the number of clusters was made based on the following criteria: The objective of this research was to identify differences in the ways that organisations address FLM and to derive recommendations for action on this basis. The aim was not to produce a ‘one size fits all’ solution, but rather to respond as specifically as possible to the circumstances identified. Correspondingly, the largest possible number of clusters was found. Based on these preliminary considerations, the minimum number of clusters was set at three. In addition, this procedure also considered the fact that the evaluation was based on a relatively small number of observations. Therefore, it was considered that each cluster contained enough cases to make a meaningful comparison of the cases. When defining clusters, there should be at least three cases in each cluster.
With these prerequisites, clustering was carried out in R Studio. Hierarchical clustering was chosen because it can visually check clusters via a dendrogram. This advantage is also enhanced by the size of the database. The dendrogram is shown in Figure 6.
Visual examination suggested that three, four or five clusters would be appropriate. To decide on the number of clusters, an evaluation was made based on 30 indices, all representing different ways of determining the goodness/quality of the clustering results. This function calculated 30 indices to determine the number of clusters. According to the majority rule, this method suggested the best clustering scheme from the different results obtained by varying all combinations of number of clusters, distance measures and clustering methods. Of the 30 indices, 12 suggested 5 clusters, 9 suggested 4 clusters, and 2 suggested 6 clusters. Five clusters were chosen because all the clusters represented at least three observations. The distribution of the observations to the clusters is shown in Figure 7.
The distribution of the number of cases among the clusters can be seen in Table 2.
Based on these values, coherent descriptions were developed for all clusters to describe the characteristics of the organisations within these groups. The results are presented in the following chapter.
4. Results
In this section, the five identified clusters are explained and the characteristics of the cases they contain in terms of their engagement with FLM are outlined. As addressed in the methodology section, Kleineidam et al.’s (2022) [15] proposed model was applied for the analysis.
The five clusters identified can be viewed in order of increased engagement. Importantly, this does not correspond to the numbering resulting from clustering. Cluster 4, described above, lies between clusters 1 and 2 in the order of increasing engagement.
In this way, an expert profile was identified showing extensive engagement with FLM (overall FLM index of 6.1). Likewise, there was advanced engagement with FLM in the advanced profile (FLM index of 4.3). This was followed by two clusters with intermediate levels of engagement that differed greatly in the dimensions of logistics. As a result, the balanced intermediate profile shows a relatively even development of the logistics dimensions (FLM index of 3.1), and the area-specific intermediate profile shows advanced engagement in two dimensions of logistics but little engagement in the other three dimensions (FLM index of 2.7). Finally, the beginner profile describes organisations with little FLM engagement (FLM index of 1.9).
Table 3 summarises the resulting clusters, with their respective values in the dimensions examined.
Figure 8 provides a visualised overview of the characteristics of all dimensions in the profiles.
The individual profiles and their characteristics are explained in more detail in the following section.
4.1. Beginner Profile
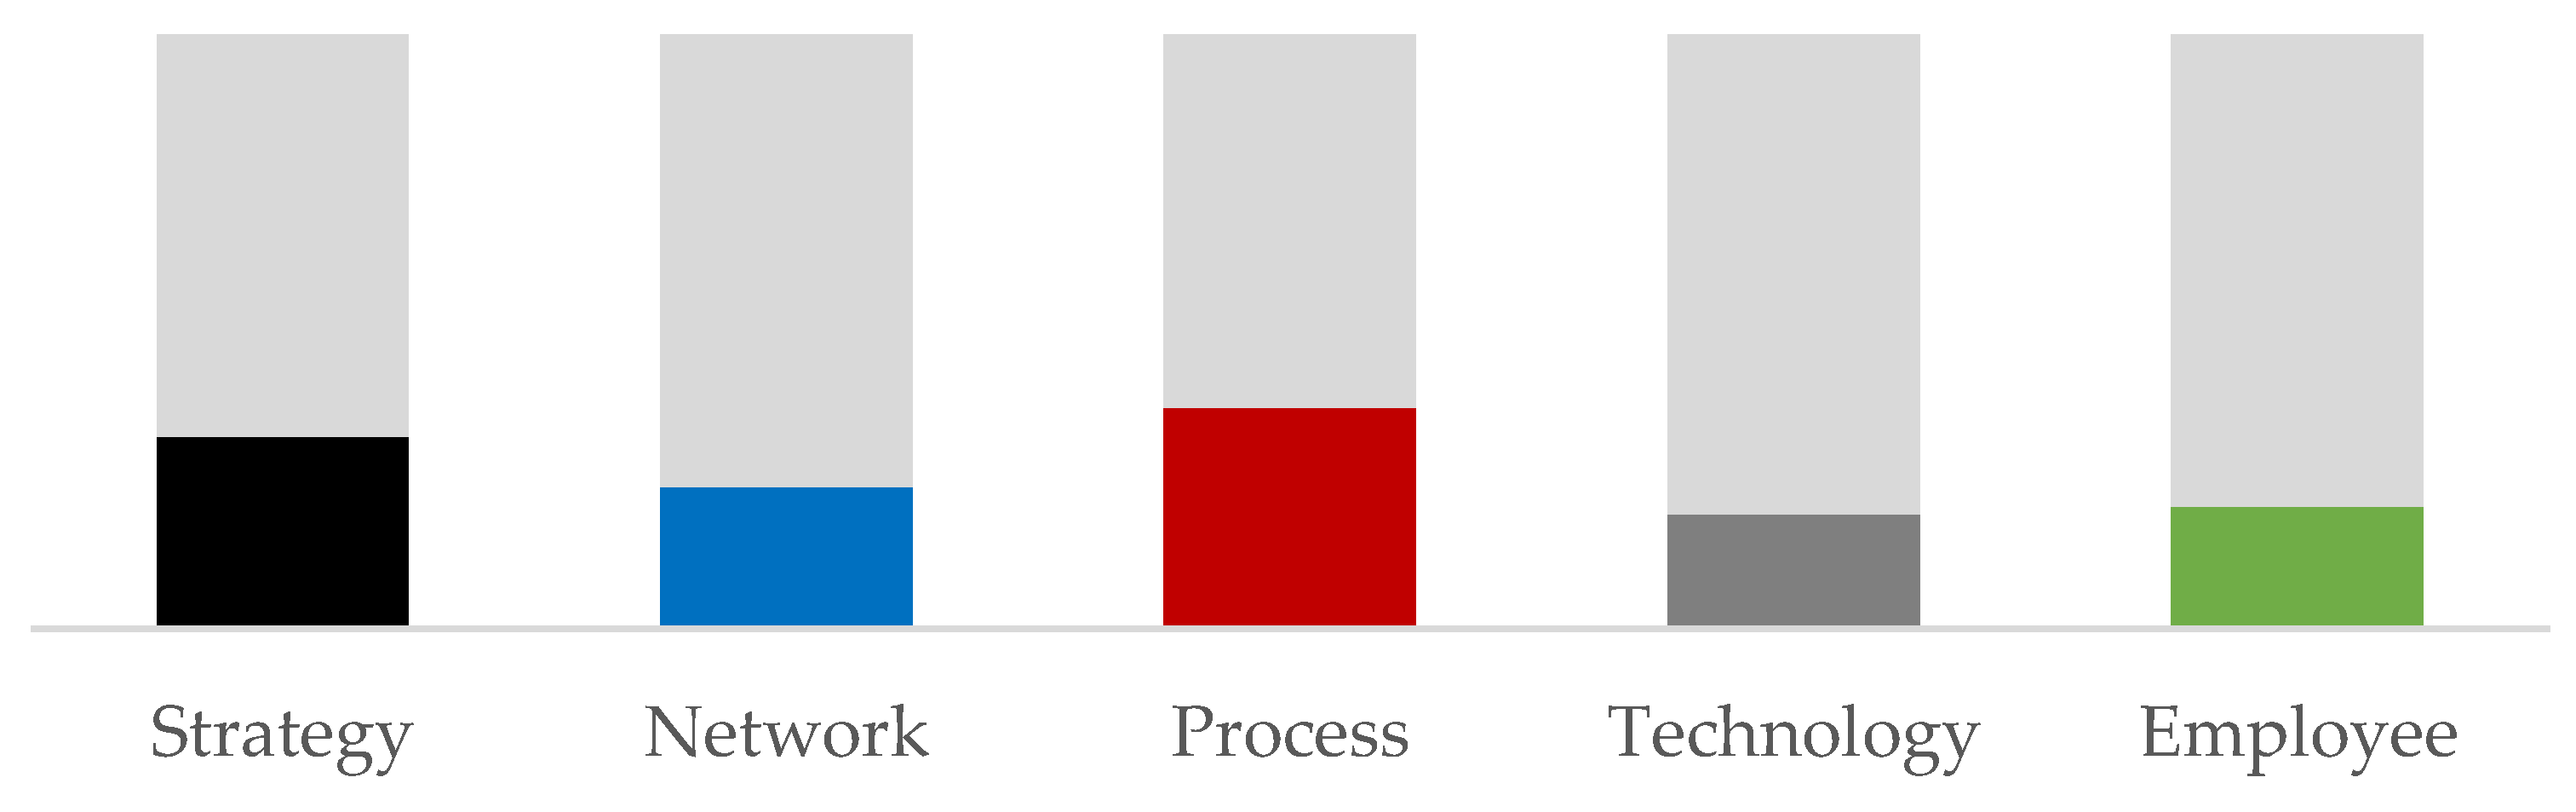
The beginner profile contained 20% of the participating organisations. These participants had extremely low levels of engagement with FLM in all dimensions. The strongest was the process dimension, with an index value of 2.6, followed by strategy with 2.3, network with 1.7, employees with 1.4 and technology with 1.3.
In this cluster, manufacturers and authorities were equally represented, with three organisations each, while logistics service providers had two organisations. With the exception of one small enterprise, all organisations in this group belonged to the category of medium-sized enterprises. With six organisations, all participants had a large number of customers or buyers (>100). Additionally, one organisation stated that it had 20–50 customers or buyers, while another stated that it had 50–100. However, regarding supplier structures, no clear picture could be drawn because 2 organisations stated that they had fewer than 5 suppliers, 3 organisations stated that they had 20–50, one organisation stated that they had 50–100 and 2 organisations claimed to have >100 suppliers.
Figure 9 shows the specification of the dimensions for this profile. None of the organisations in the beginner profile stated that they had already consciously implemented measures against food losses, and none planned to implement one or more such measures. Therefore, the relevance of the topic has yet to be incorporated into the structures of these organisations, as is clearly reflected in the indices of the logistics dimensions.
This was also reflected in the statements these organisations made within the strategy dimension. Not only did the organisations lack a strategy for dealing with food losses, but they also stated that their management attached no particular importance to the issue. As reflected in the other dimensions, no organisation-driven dynamics emerged as a result. The low levels of the technology dimension and the employee dimension were inevitably influenced negatively by this aspect. Overall, the statements made by these organisations show their lack of perceived value in defined and documented processes. The only exception was the fact that the organisations’ forecasts delivered good results on average.
As part of their FLM, organisations with this profile indicated that they would be most likely to implement mindfulness measures themselves.
4.2. Area-Specific Intermediate Profile
The area-specific intermediate profile was characterised by an extremely uneven distribution of indices. The dimensions of network (1.1), strategy (1.2) and process (1.3) were less pronounced than in the organisations of the beginner profile. The dimensions of technology (4.6) and employees (5.1), which were the least pronounced in the beginner profile, were particularly pronounced in this group of organisations. Notably, 8% of the participating organisations belonged to this cluster.
Only logistics service providers were represented at this level, and they all represented different company sizes (micro, medium-sized and large enterprises). Despite the different company sizes, all these organisations stated that they had few customers or clients (5–10), which could be why they were well positioned in the technology dimension; they encountered less coordination work in terms of their information technology connection to customers.
Figure 10 shows the specification of the dimensions for this profile. As in the beginner profile, none of these organisations had consciously implemented measures against food losses, and they were not planning to do so in the near future; this indicated that they did not perceive FLM as a relevant factor within their organisation. However, the high degree of the technology and employee dimensions reflected a special orientation of the organisations in this category. While they were particularly oriented towards their employees, the involvement of employees was institutionalised to a high degree through incentive systems, just as there was a focus on ensuring that employees were regularly trained and receiving optimal transparency about the organisations’ internal processes. Thus, these organisations, which to a large extent still lacked problem awareness of FLM, were nevertheless well positioned in the employee dimension, showing that good FLM is not an isolated action and can be fostered by other factors. Furthermore, these organisations were characterised by special competences in dealing with technologies. As mentioned previously, the small number of customers or clients in most of these organisations could make a positive contribution. However, these organisations were also relatively well positioned in terms of how new technologies were implemented, showing a reflective approach with a simultaneous desire to use the benefits of new technologies to their own advantage as quickly as possible. Organisations in this cluster could therefore be said to have a high affinity for technologies.
4.3. Balanced Intermediate Profile
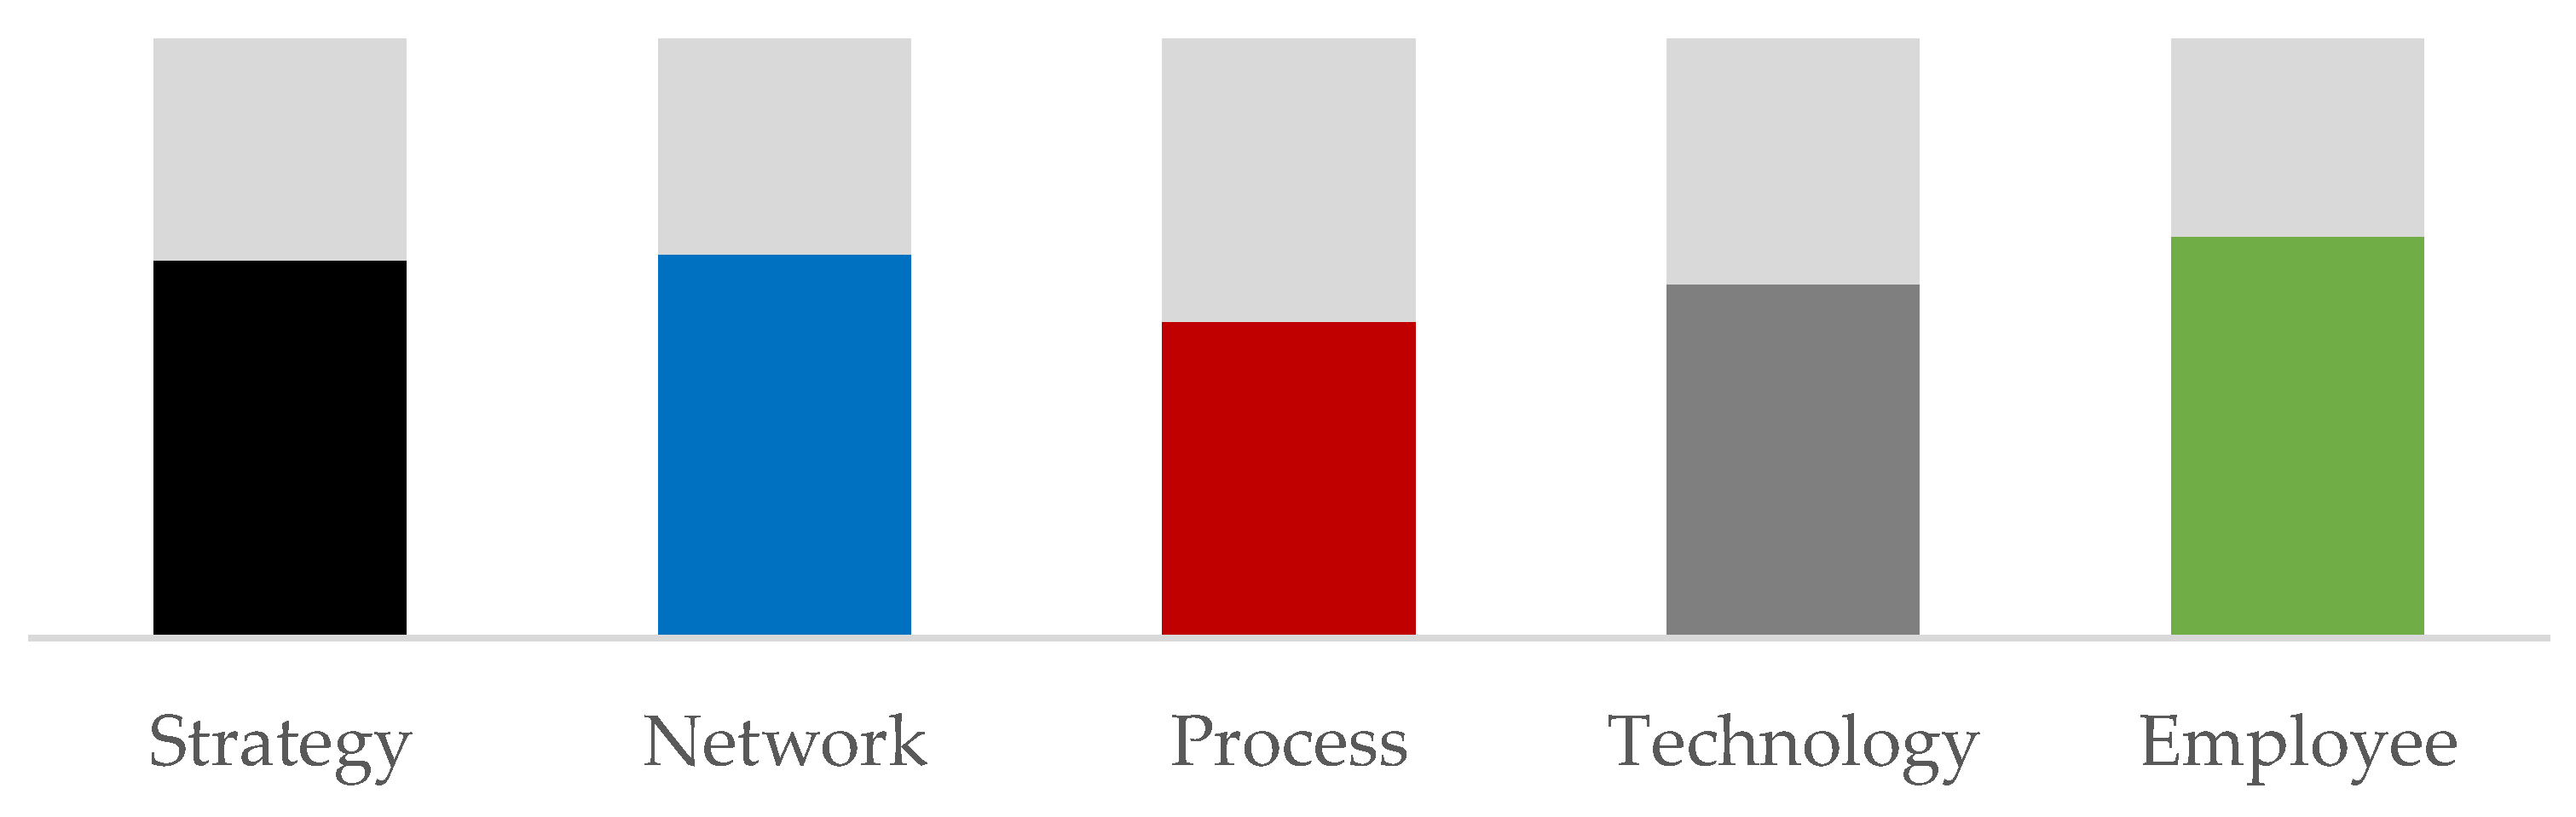
The balanced intermediate profile contained 23% of the participating organisations. The FLM index of this profile was minimally higher than that of the area-specific intermediate profile but showed a different picture in the expression of the dimensions. The network dimension was the most pronounced in this group, with an index value of 4.2, followed by strategy with 3.6, processes with 3.2, employees with 2.3 and technology with 2.1.
Almost half of this group was represented by logistics service providers (four organisations). The rest were distributed as follows: two manufacturers and one farmer, one import/export company; and one representative of an NGO each. Five participants described themselves as medium-sized enterprises, with the remainder claiming to be micro and small enterprises. The suppliers showed clustering, with 4 participants indicating 5–10 suppliers, 1 participant indicating 0–5 suppliers, 2 participants indicating 20–50 suppliers and 2 participants indicating >100 suppliers. A similar accumulation was seen with customers, with 4 participants claiming to have >100 customers, 2 participants each claiming to have 0–5 and 20–50 customers and 1 participant claiming to have 5–10 customers.
Figure 11 shows the specification of the dimensions for this profile. The actors in this group had limited similarities to the key figures considered here. However, overall, the organisations with this profile tended to have large networks that they managed well, given their good performance in the network dimension and their FLM. These organisations could therefore create and coordinate external processes that function well. Conversely, with internal processes, these organisations had low competence in focusing on their employees, dealing with new technologies, recognising the added value of new technologies and using them for their own benefit.
4.4. Advanced Profile
The advanced profile contained the largest share of participating organisations, at 30%. With an FLM index of 4.3, the overall level was above average. The employee dimension was the most pronounced (4.7), followed by network (4.5), strategy (4.4), technology (4.1) and processes (3.7).
Of the 12 participants in this cluster, 5 were import–export companies, 3 were manufacturers, 2 were farmers and one each was a logistics service provider and an NGO. Five participants also described themselves as medium-sized enterprises, three were large enterprises, and two each were small enterprises and micro enterprises. The spread was heterogeneous for suppliers and customers. Among the suppliers, the participants were evenly distributed across the entire range, from 0–5 with one mention and 5–10, 10–20, 50–100 and >100 each with 2 mentions. The 20–50 group had 3 mentions. Regarding customers, 4 participants stated that they had <5 or >100 customers, 2 participants stated that they had 20–50 customers and 1 participant each stated that they had 5–10 and 10–20 customers.
Figure 12 shows the specification of the dimensions for this profile. As in the case of the balanced intermediate profile, the key figures were heterogeneously distributed. The highly different characteristics of the number of suppliers and customers here, coupled with the above-average characteristics of the network dimension, showed that the organisations could position themselves successfully in this area regarding FLM, regardless of the number of network partners. Additionally, the weakest dimension (process) was the only one below average for this profile group. These organisations were thus characterised by a clear weakness in the alignment of their own processes with FLM, although they generally showed an understanding of how to consider FLM. In this context, it is notable that the organisations within the process consideration predominantly lacked a utilisation strategy for surpluses and simply disposed of them. The majority of these organisations also lacked a storage strategy, which was an obvious weakness within the processes, considering that the shelf life of foodstuffs fundamentally influences losses.
4.5. Expert Profile
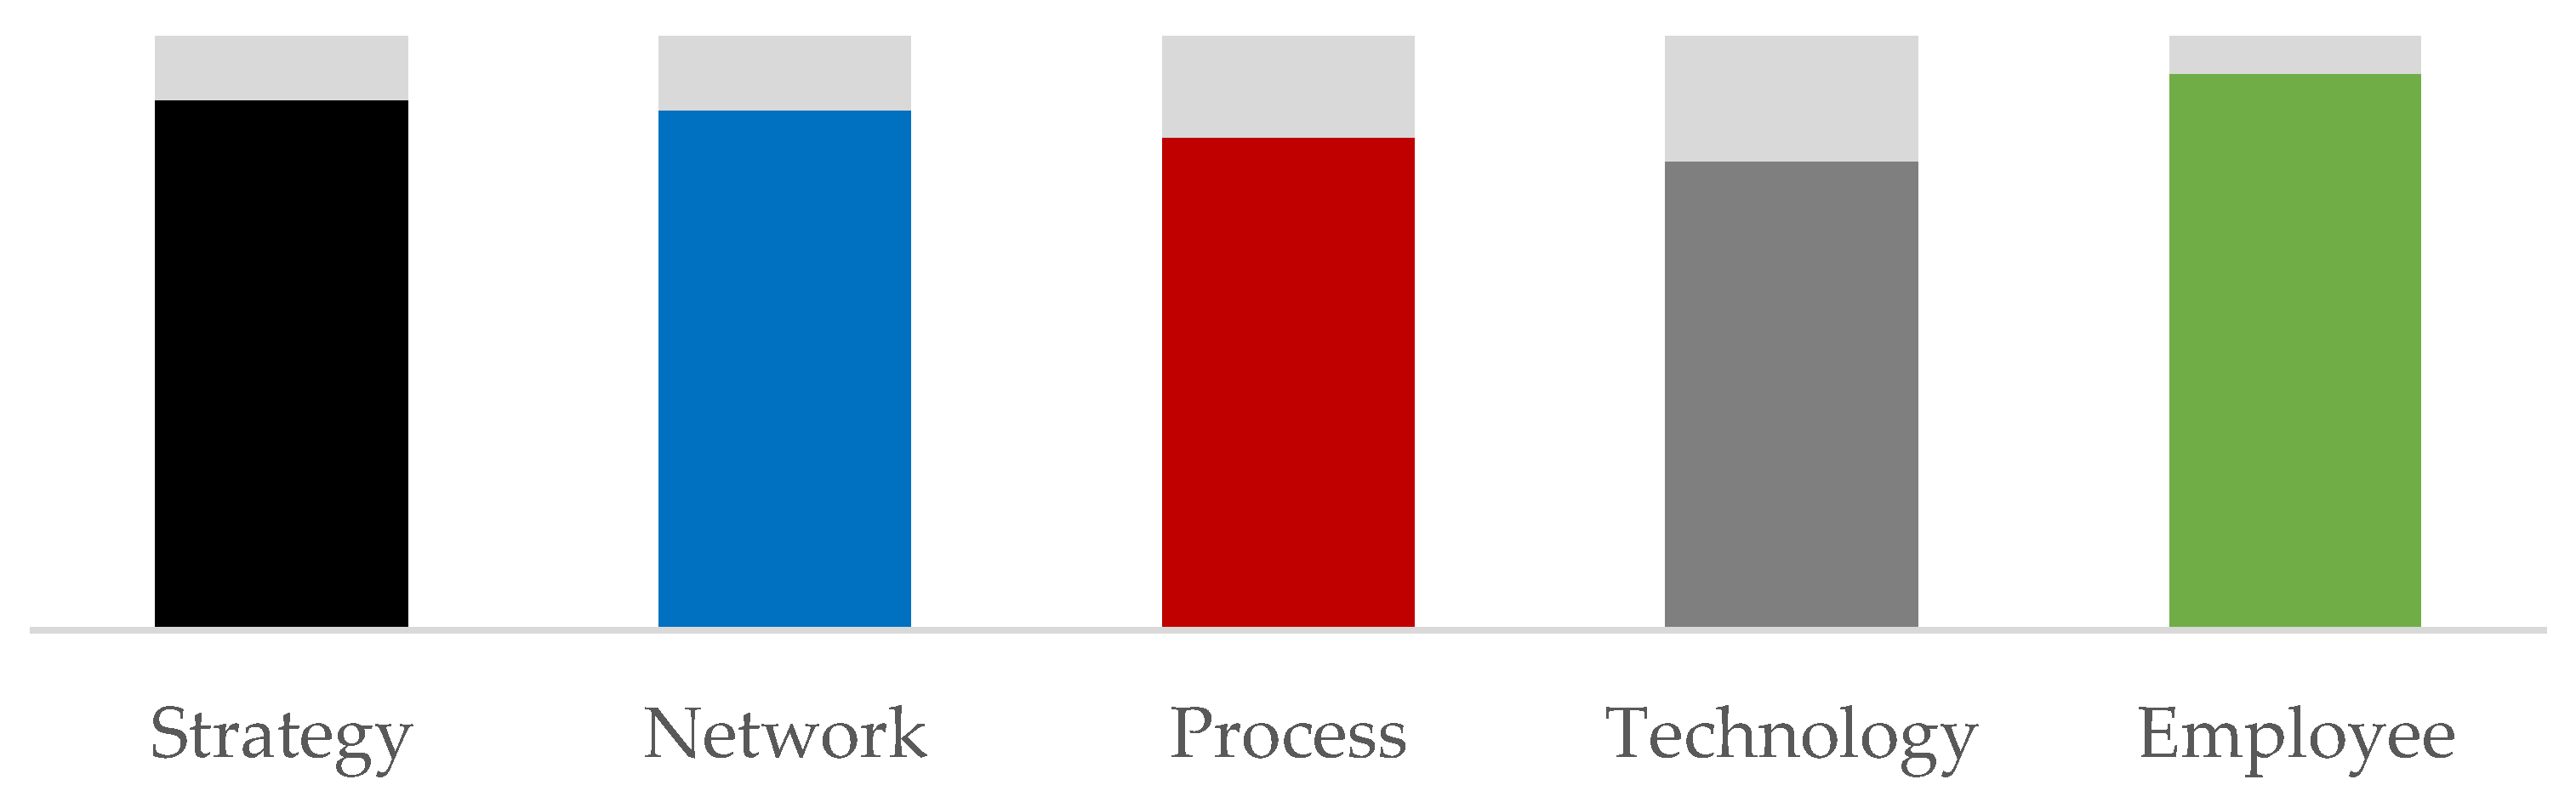
Of the participants, 20% fell into the expert profile, and with an FLM index of 6.1, these organisations were advanced in their engagement with FLM. The most advanced was the employee dimension (6.6), followed by strategy (6.3), network (6.1), process (5.8), and technology (5.5).
This cluster had two representatives each from manufacturers, import–export and logistics service providers, and one representative each came from farmers and authorities. Five enterprises described themselves as small enterprises, and three described themselves as medium-sized enterprises. While 3 participants each stated that they had 10–20 and >100 suppliers, 1 each stated that they had 0–5 and 20–50 suppliers. Half (4) said they had >100 customers, 2 said they had <5 customers and one each said they had 10–20 and 20–50 customers.
Figure 13 shows the specification of the dimensions for this profile. Organisations that displayed this profile showed broad integration of FLM in their structures. They were better in all dimensions than other organisations, especially activities in the dimensions of people and strategy. All organisations with this profile offer their employees extensive training opportunities to strengthen their sensitivity in handling food and to recognise the causes of loss. Similarly, these organisations claimed to have a clear overview of the causes of loss within their own processes. It can be assumed that this supported the good performance of these organisations in the entire FLM.
5. Implications
The profiles presented here reflect groups of organisations that share certain characteristics and have positioned themselves similarly regarding FLM. Notably, these are not developmental profiles that organisations go through until they have fully integrated FLM and are managing it in the best possible way. For an organisation, the question is not how it can reach another profile, but how it can use this assessment to see how it is currently positioned and how it can improve in terms of FLM by building upon its current status. For this reason, the individual clusters will be discussed below, and recommendations for action will be derived based on the characteristics identified and the fields of action surveyed. The recommended activities were derived from the fields of action presented in Section 2.1 and Figure 1, according to Kleineidam (2020) [22].
5.1. Beginner Profile
Organisations with this profile, as described above, indicated that they would be most likely to implement measures in the area of mindfulness. Given the characteristics of the employee dimension, these efforts would be goal oriented. If employees were trained in the requirements of specific products and needed actions, this weak point in their processes would be addressed. However, being mindful of food products should not be limited to operational actions in handling them. An organisation’s management must also be trained accordingly so that all aspects of the conscious reduction in food losses can be considered. Creating awareness of the problem and knowledge of the consequences of one’s own actions in daily tasks is essential. Based on the organisations’ answers, it can be assumed that especially in the organisational structures responsible for logistics, there was no awareness of the connection between individual decisions and the reasons for losses in one’s own structures. Although there was a general awareness of food loss as a global problem, this understanding did not consider one’s own organisation or actions regarding the problem.
Furthermore, the analysis of the organisations with this profile showed that besides the lack of awareness of food losses in relation to their own processes, these organisations also lacked an overview, making it impossible to identify the causes of the losses and to develop suitable measures that fit the identified weak points. The creation of transparency and the implementation of measures in this field of action are therefore the second elementary topic that organisations with this profile should address. Figure 14 shows the fields of action relevant to this profile.
Analysis of the technology dimension also showed that these organisations have great potential to move forward using digital solutions. Given the need to lay the foundation for successful work against food loss, these organisations should monitor the current development of digital technologies and develop a mechanism to evaluate them in terms of their usefulness in their own structures. In this context, it should be emphasised that the technologies used should provide each organisation with a better picture of its own processes. Therefore, the focus is more on the provision of information and not on advanced applications, such as decision support systems or automation systems.
5.2. Area-Specific Intermediate Profile
The wide variation in the indices of organisations with this profile suggests that although there was a basic understanding of the problem within the organisation, there was no structured strategy on how to deal with the problem. The general orientation of the organisation in dealing with its employees also had positive effects on FLM. Here, however, just as in the technology dimension, there was rather a positive ‘bandwagon effect’ due to general competences. The organisations’ statements clearly show that they have not yet focused on the structuring of processes. These organisations have significant potential here. Thus, the field of action in quality management should be emphasised by organisations of this profile. The introduction of measures that monitor the quality of the logistical processes will result in existing general knowledge about the necessity of FLM being integrated into the operational processes.
The organisations surveyed here all stated that they had good to very good digital connections to their network partners. At the same time, when asked about their cooperation with network partners, the organisations rated the relationships as underdeveloped or the exchanges with partners as quite low. This contradiction shows great potential. In these cases, the technological conditions exist to work on cross-organisational measures (i.e., the field of action network cooperation). The organisations in this profile, being logistics service providers, underline this potential. Due to their position in the network, they usually have many network partners and can thus exert a great positive influence on the losses in the network caused by a lack of agreement between the network partners by initiating cross-organisational measures. Figure 15 shows the fields of action relevant to this profile.
5.3. Balanced Intermediate Profile
The organisations with this profile were, as previously presented, on a higher level in the dimension’s strategy and network than in the other three dimensions. However, a more detailed view of the answers found that they had a poor overview of the losses occurring in their organisations and could not quantify them. Similarly, the answers in the dimension of employees showed a lack of provision of relevant information to employees, and those in the dimension of technology showed a lack of use of appropriate technologies to create transparency. Combined with these answers, it can be concluded that these organisations should focus on the field of transparency. As already deduced from the beginner profile, transparency is a prerequisite for structured engagement with FLM. The positioning of organisations with this profile to date reflects that certain successes can be achieved, even without this basis, but this could also be why these organisations showed greater deficits in dealing with FLM in certain sub-areas. In combination with the low use of appropriate technologies, these organisations should implement measures that lead to better information provision.
The organisations themselves stated that they would focus on the field of transport optimisation for future activities in the area of FLM. This focus makes sense insofar as organisations are already at a solid level in the dimension of processes and want to build on a foundation there. The fact that all the organisations surveyed mentioned this field of action precisely within the framework of operational processes suggests that the entry barriers to this type of measure are particularly low. Consequently, this can also be seen as a recommendation for organisations with this profile. Figure 16 shows the fields of action relevant to this profile.
5.4. Advanced Profile
The organisations with this profile had a relatively balanced level across all dimensions. However, as described above, the process dimension was the least pronounced. Given that these organisations fulfil the previously mentioned basics (namely transparency and mindfulness) at a good to very good level, they have the potential to address further measures. Figure 17 shows the fields of action relevant to this profile.
In doing so, they should focus primarily on processes that are not as well developed. The majority (86%) of the organisations surveyed stated that they were currently planning measures in the field of warehouse management or wanted to implement them in the future. This finding aligns with the fact that these organisations consistently stated that they had either not implemented any storage strategies at all or were working with a LIFO principle. Due to the limited lifespan of food, this storage strategy tends to be the cause of losses that could be removed relatively easily through adapted control of the process.
Based on further statements by these organisations, it can be concluded that a focus on improving quality management in logistical processes can make a positive contribution. These organisations, being well positioned technologically, should use this competence in the field of quality management. Here, the existing ability of the organisation to create transparency can also be used. An exemplary measure in this field could be process management to improve the quality of processes.
5.5. Expert Profile
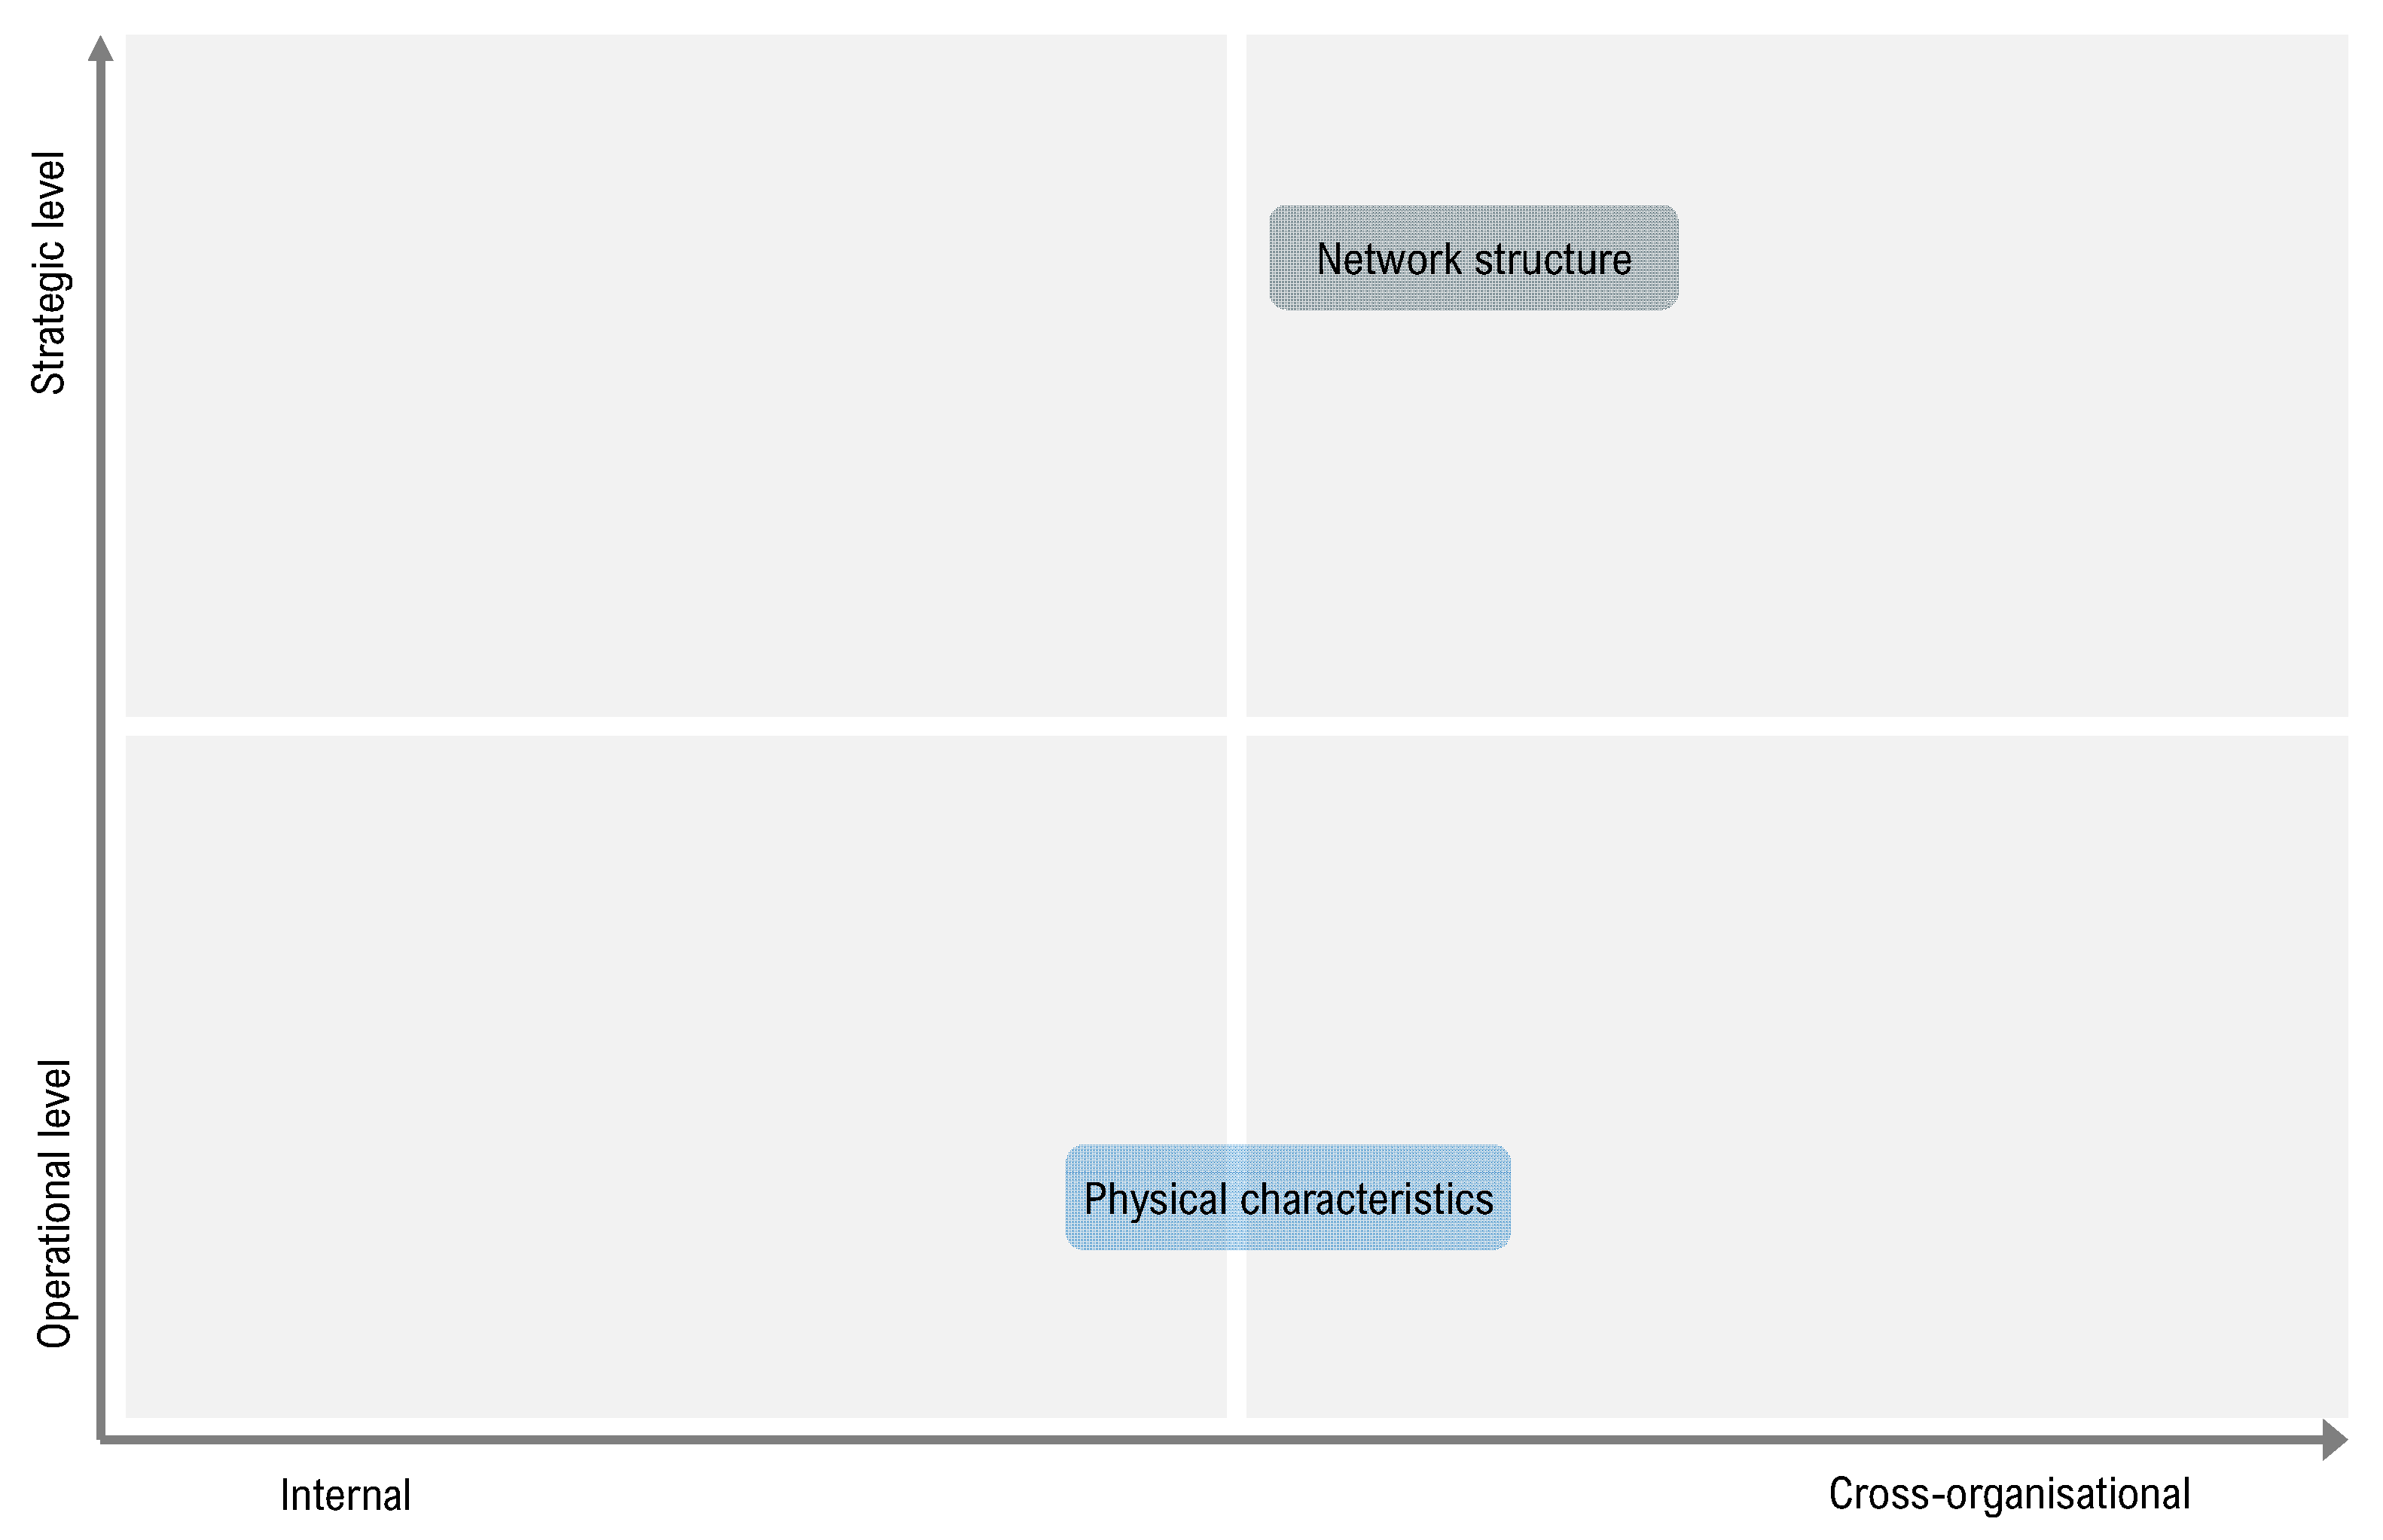
The organisations with this profile already had extensive experience with consciously integrating FLM into their own processes and in cooperation with network partners. However, the potential to further reduce food losses exists. Due to their previous experience with FLM measures, generalised recommendations for action are more difficult to derive than for organisations with the profiles already presented. Nonetheless, the fields of action least focussed on by these organisations include the adaptation of the network structure and the adaptation of the processes to specific product characteristics. Figure 18 shows the fields of action relevant to this profile.
The adaptation of the network structure cannot be implemented in the short term, moving it down the list of fields of action to address. To avoid food losses by changing the network structure, it is necessary to either improve the connections between the nodes or bring them closer together. However, organisations that have already progressed this far should consider these measures.
The high performance of these organisations in the field of technology should encourage them to consider product characteristics. In this context, this means process optimisation with the aim of matching the physical environment of the food to its requirements. This involves factoring in temperature, air composition, humidity and pressure sensitivity. Adapting the physical environment to product properties in an optimal way extends the shelf life of food.
5.6. Summary
The purpose of this study was to answer the following research questions:
- RQ1:
- How can organisations of food value chains be differentiated in terms of their readiness levels with regard to the implementation of FLM in logistics?
- RQ2:
- How can this distinction be used to derive recommendations for action for the future implementation of FLM in logistics?
By deriving profiles from the cluster analysis, RQ1 can be answered: five different organisation profiles were identified, distinguishing between beginner, area-specific intermediate, balanced intermediate, advanced and expert.
To answer RQ2, recommendations for action were derived based on the characteristics of the identified profiles. For this purpose, fields of FLM action were drawn from the literature and compared with the prerequisites of the organisations in the respective profiles. In summary, these organisations showed little engagement with FLM to date and should begin by creating transparency and mindfulness. The further the organisations are in their engagement with FLM, the more complex fields of action should be addressed.
6. Conclusions
The derived profiles of organisations allowed for an initial conclusion regarding an organisation’s previous involvement with FLM. However, to obtain a holistic picture of the framework conditions within a company, further considerations are needed. The fields of action proposed here are a rough guide; no concrete measures with defined activities are recommended. These must be developed appropriately for each specific application. The present study thus has limited implications for science and practice.
6.1. Scientific Implications
To expand the scientific knowledge base, this study provides a systematisation of organisations’ levels of engagement with FLM from a supply chain management perspective. Such an approach does not yet exist in the scientific literature. Other researchers can use this framework as a starting point to launch specific research projects, and on this basis further research projects can be developed based on a concrete company situation.
6.2. Practical Implications
For practical applications, two use cases in particular can be considered. Organisations can determine their own status on the basis of the questions and profiles listed here and derive further procedures for FLM for themselves on the basis of the fields of application. Furthermore, the framework presented here can be applied by aid organisations or governmental organisations that want to support activities in the field of FLM in developing countries. Based on the recommendations contained in this study, projects could be developed in project development workshops.
6.3. Limitations
The respondents were all based in East African countries, so in principle, the results could have been influenced by the framework conditions applied in these countries. To rule this out, it would be beneficial to consider the question by including actors from industrialised countries, for example. Nevertheless, this work provides a first insight into and orientation for actors who want to address FLM in the future. Furthermore, the total number of participants was relatively small. This limitation makes further in-depth analyses and statements derived from them more difficult, such as on the specificities of certain actors in the food value chain. For this reason, these types of further analyses were not included in this study. Therefore, an extension of the study with a different population would be prudent. Other limitations include the application of clustering and the fact that the model was strongly influenced by the selection of the variables used. The choice of other variables could have led to different results. However, through the variables derived from the literature, a logical basis for these results was established. As mentioned in the methodology section, this method depends on the assessment of the involved researchers. Thus, there is a methodological bias of the scientist occurring. By applying and documenting clear criteria for the selection of the clusters, this influence was kept as low as possible.
7. Final Remarks
The goal of this study was to identify differences between organisations’ engagement with FLM and recommend actions for their respective circumstances.
Five clusters were derived representing different profiles, showing how actors in the food value chain have addressed FLM in the past. The derived profiles do not represent stages of development but rather characteristics of organisations that have dealt with FLM in a certain way in the past.
Conclusions: For the five organisational profiles, recommendations for action were given for further engagement with FLM. As the level of engagement with FLM increases, organisations should tackle increasingly complex measures to reduce food losses. At the same time, a shift in measures was derived from the tactical to the strategic planning level.
This study is a first step towards a science-based evaluation of FLM activities of actors in food logistics networks and subsequent recommendations for action. This can therefore only be a first step, as an evaluation is needed to see to what extent the recommendations for action derived from this study lead to the implementation of the desired successes. This is where further research should be conducted to provide a broad scientific basis for the application of successful measures against food losses in food logistics networks.
Funding
We acknowledge support by the German Research Foundation and the Open Access Publication Fund of TU Berlin.
Informed Consent Statement
Informed consent was obtained from all subjects involved in the study.
Acknowledgments
The study has been facilitated by the German Federal Ministry for Economic Cooperation and Development (BMZ) as part of the research project “Log4Jobs—low loss food logistics for jobs in Ethiopia”. All views expressed in the study are the sole responsibility of the authors and should not be attributed to BMZ or any other institution or person.
Conflicts of Interest
The author declares no conflict of interest.
References
- Wojciechowska-Solis, J.; Barska, A. Exploring the Preferences of Consumers’ Organic Products in Aspects of Sustainable Consumption: The Case of the Polish Consumer. Agriculture 2021, 11, 138. [Google Scholar] [CrossRef]
- Nitsche, B.; Figiel, A. Zukunftstrends in der Lebensmittellogistik–Herausforderungen und Lösungsimpulse; Universitätsverlag der TU Berlin: Berlin, Germany, 2016. [Google Scholar]
- United Nations. Sustainable Development Goals: 17 Goals to Transform Our World, Sustainabledevelopment.Un.Org. 2015. Available online: https://sustainabledevelopment.un.org/post2015/transformingourworld/publication (accessed on 18 February 2022).
- United Nations Environment Programme. Food Waste Index Report 2021; United Nations Environment Programme: Nairobi, Kenya, 2021; ISBN 978-92-807-3851-3. [Google Scholar]
- FAO. Guidance on Core Indicators for Agrifood Systems—Measuring the Private Sector’s Contribution to the Sustainable Development Goals; FAO: Rome, Italy, 2021; ISBN 978-92-5-134878-9.
- How, M.-L.; Chan, Y.J.; Cheah, S.-M. Predictive Insights for Improving the Resilience of Global Food Security Using Artificial Intelligence. Sustainability 2020, 12, 6272. [Google Scholar] [CrossRef]
- Magalhães, V.S.; Ferreira, L.M.D.; Silva, C. A Framework to Evaluate and Rank Mitigation Strategies for Food Loss and Waste: An Analysis Along the Fruit and Vegetable Supply Chain. Sustain. Prod. Consum. 2022, 31, 569–581. [Google Scholar] [CrossRef]
- Nitsche, B.; Kleineidam, J.; Straube, F.; Meißner, M. Systematization and Discussion of the Current State of Waste Management in Food Supply Chains: A Systematic Review. J. Jpn. Oper. Manag. Strategy 2018, 8, 1–17. [Google Scholar]
- Brewster, C.; Roussaki, I.; Kalatzis, N.; Doolin, K.; Ellis, K. IoT in Agriculture: Designing a Europe-Wide Large-Scale Pilot. IEEE Commun. Mag. 2017, 55, 26–33. [Google Scholar] [CrossRef]
- Wang, L.; Kowk, S.K.; Ip, W.H. A Radio Frequency Identification-Based Quality Evaluation System Design for the Wine Industry. Int. J. Comput. Integr. Manuf. 2012, 25, 11–19. [Google Scholar] [CrossRef]
- Chuang, C.-H.; Lee, D.-H.; Chang, W.-J.; Weng, W.-C.; Shaikh, M.O.; Huang, C.-L. Real-Time Monitoring via Patch-Type Piezoelectric Force Sensors for Internet of Things Based Logistics. IEEE Sens. J. 2017, 17, 2498–2506. [Google Scholar] [CrossRef]
- Chimphango, A.F.; Görgens, J.F. Postharvest Technology for Advancing Sustainable Bioenergy Production for Food Processing. Br. Food J. 2015, 117, 2850–2862. [Google Scholar] [CrossRef]
- Pinior, B.; Conraths, F.J.; Petersen, B.; Selhorst, T. Decision Support for Risks Managers in the Case of Deliberate Food Contamination: The Dairy Industry as an Example. Omega-Int. J. Manag. Sci. 2015, 53, 41–48. [Google Scholar] [CrossRef]
- Sarpong, S. Traceability and Supply Chain Complexity: Confronting the Issues and Concerns. Eur. Bus. Rev. 2014, 26, 271–284. [Google Scholar] [CrossRef]
- Kleineidam, J.; Coll, A.; Straube, F. Development of a Readiness Assessment Tool as a Result of a Comparative Analysis of Engagement with Food Loss in Ethiopia and Germany; L’Association Internationale de Recherche en Logistique et Supply Chain Management: Clermont-Ferrand, France, 2022; Available online: https://www.airl-scm.com/_files/ugd/95d53e_218359ba63284ffa9f773121490e5def.pdf (accessed on 13 June 2022).
- Parfitt, J.; Barthel, M.; Macnaughton, S. Food Waste Within Food Supply Chains: Quantification and Potential for Change to 2050. Philos. Trans. R. Soc. B Biol. Sci. 2010, 365, 3065–3081. [Google Scholar] [CrossRef] [PubMed]
- Gustavsson, J.; Cederberg, C.; Sonesson, U. Global Food Losses and Food Waste: Extent, Causes and Prevention. In Study Conducted for the International Congress Save Food! At Interpack 2011, [16–17 May], Düsseldorf, Germany; Food and Agriculture Organization of the United Nations: Rome, Italy, 2011; ISBN 978-92-5-107205-9. [Google Scholar]
- Kowalska, A. The Issue of Food Losses and Waste and its Determinants. Logforum 2017, 13, 1. [Google Scholar] [CrossRef]
- Garske, B.; Heyl, K.; Ekardt, F.; Weber, L.; Gradzka, W. Challenges of Food Waste Governance: An Assessment of European Legislation on Food Waste and Recommendations for Improvement by Economic Instruments. Land 2020, 9, 231. [Google Scholar] [CrossRef]
- HLPE. Food Losses and Waste in the Context of Sustainable Food Systems: A Report by the High-Level Panel of Experts on Food Security and Nutrition of the Committee on World Food Security, Rome. 2014. Available online: http://www.fao.org/3/a-i3901e.pdf (accessed on 5 June 2020).
- Papargyropoulou, E.; Lozano, R.K.; Steinberger, J.; Wright, N.; Ujang, Z.B. The Food Waste Hierarchy as a Framework for the Management of Food Surplus and Food Waste. J. Clean. Prod. 2014, 76, 106–115. [Google Scholar] [CrossRef]
- Kleineidam, J. Fields of Action for Designing Measures to Avoid Food Losses in Logistics Networks. Sustainability 2020, 12, 6093. [Google Scholar] [CrossRef]
- Astill, J.; Dara, R.A.; Campbell, M.; Farber, J.M.; Fraser, E.D.; Sharif, S.; Yada, R.Y. Transparency in Food Supply Chains: A Review of Enabling Technology Solutions. Trends Food Sci. Technol. 2019, 91, 240–247. [Google Scholar] [CrossRef]
- Bijman, J.; Omta, S.W.F.; Trienekens, J.H.; Wijnands, J.H.M.; Wubben, E.F.M. (Eds.) International Agri-Food Chains and Network: Management and Organization; Academy Publishers: Wageningen, The Netherlands, 2006; ISBN 978-90-76998-95-4. [Google Scholar]
- Dani, S. Food Supply Chain Management and Logistics: From Farm to Fork; Kogan Page: London, UK; Philadelphia, PA, USA, 2015; ISBN 9780749473648. [Google Scholar]
- Minten, B.; Tamru, S.; Reardon, T. Post-Harvest Losses in Rural-Urban Value Chains: Evidence from Ethiopia. Food Policy 2021, 98, 101860. [Google Scholar] [CrossRef]
- Manners-Bell, J. Global Logistics Strategies: Delivering the Goods; Kogan Page: London, UK, 2013; ISBN 0749470232. [Google Scholar]
- Yu, M.; Nagurney, A. Competitive Food Supply Chain Networks with Application to Fresh Produce. SSRN J. 2012, 224, 273–282. [Google Scholar] [CrossRef]
- Handfield, R.; Straube, F.; Pfohl, H.-C.; Wieland, A. Trends and Strategies in Logistics and Supply Chain Management: Embracing Global Logistics Complexity to Drive Market Advantage; DVV Media Group GmbH: Hamburg, Germany, 2013; ISBN 9783871544811. [Google Scholar]
- Data Science and Big Data Analytics: Discovering, Analyzing, Visualizing and Presenting Data; EMC Education Services; John Wiley & Sons: Indianapolis, IN, USA, 2015; ISBN 1118876059.
- Baesens, B. Analytics in a Big Data World: The Essential Guide to Data Science and Its Applications; Wiley: Hoboken, Germany, 2014; ISBN 9781118892701. [Google Scholar]
- Commission Recommendation of 6 May 2003 Concerning the Definition of Micro, Small and Medium-sized Enterprises: 2003/361/EC. Off. J. Eur. Union 2003, 46, 36–41.
Figure 1.
Classification of the fields of action according to application and company level [22].
Figure 1.
Classification of the fields of action according to application and company level [22].

Figure 2.
Functional areas and actors in international food value chains, own representation based on [16,17,22].

Figure 3.
Readiness assessment model of food loss management in logistics [15].
Figure 3.
Readiness assessment model of food loss management in logistics [15].

Figure 4.
Value chain actors.

Figure 5.
Organisation size by employees and annual revenue in USD.

Figure 6.
Dendrogram of all observations.

Figure 7.
Dendrogram with the allocation of the selected clusters.

Figure 8.
Characteristics of the logistics dimensions in the comparison of clusters.

Figure 9.
Level of the five logistics dimensions for the beginner profile.

Figure 10.
Level of the five logistics dimensions for the area-specific intermediate profile.

Figure 11.
Level of the five logistics dimensions for the balanced intermediate profile.

Figure 12.
Level of the five logistics dimensions for the advanced profile.

Figure 13.
Level of the five logistics dimensions for the expert profile.

Figure 14.
Suggested fields of action for the beginner profile.

Figure 15.
Suggested fields of action for the area-specific intermediate profile.

Figure 16.
Suggested fields of action for the balanced intermediate profile.

Figure 17.
Suggested fields of action for the advanced profile.

Figure 18.
Suggested fields of action for the expert profile.


Table 1.
Description of the food loss management fields of action [22].
Table 1.
Description of the food loss management fields of action [22].
| Field of Action | Description |
|---|---|
| Transparency | Increase transparency (exchange data and information) within the organisation and between organisations of a network. |
| Quality management | Improve early detection of weaknesses. |
| Packaging management | Improve transport and storage processes as well as distribution to the end customer. |
| Transport optimisation | Improve route planning and loading and coordination of vehicles. |
| Warehouse management | Improve use of suitable storage equipment, storage strategies and adapted layout planning. |
| Network structure | Improve strategic network planning and location management. |
| Physical characteristics | Process adaptations designed to fit the specific physical requirements of the product. |
| Shelf-life optimisation | Adapt processes to consider special physical requirements of the products, including temperature, pressure sensitivity and air composition. |
| Network cooperation | Improve cooperation within networks, including information sharing and efforts to develop long-term business relationships. |
| Mindfulness | Promote awareness among employees at all levels in the organisation regarding the importance of process efficiency and reducing food losses in everyday life. |
| Consumer satisfaction | Adapt internal processes with the aim of meeting specific customer requirements. |
| Regulation | Adapt regulations that affect the food value chain and encourage active players to reduce losses. |
| Financing opportunities | Financial support measures for active actors in the food value chain that enable them to reduce losses. |
Table 2.
Number of cases per cluster.
| Cluster 1 | Cluster 2 | Cluster 3 | Cluster 4 | Cluster 5 |
|---|---|---|---|---|
| 8 | 9 | 8 | 3 | 12 |
Table 3.
Dimension specifications of the identified profiles.
| Profiles | Strategy | Network | Process | Technology | Employee | FLM Index |
|---|---|---|---|---|---|---|
| Beginner | 2.3 | 1.7 | 2.6 | 1.3 | 1.4 | 1.9 |
| Area-specific intermediate | 1.2 | 1.1 | 1.3 | 4.6 | 5.1 | 2.7 |
| Balanced intermediate | 3.6 | 4.2 | 3.2 | 2.1 | 2.3 | 3.1 |
| Advanced | 4.4 | 4.5 | 3.7 | 4.1 | 4.7 | 4.3 |
| Expert | 6.3 | 6.1 | 5.8 | 5.5 | 6.6 | 6.1 |
| 3.9 | 3.9 | 3.6 | 3.4 | 3.9 | 3.8 |
Publisher’s Note: MDPI stays neutral with regard to jurisdictional claims in published maps and institutional affiliations. |
© 2022 by the author. Licensee MDPI, Basel, Switzerland. This article is an open access article distributed under the terms and conditions of the Creative Commons Attribution (CC BY) license (https://creativecommons.org/licenses/by/4.0/).
Share and Cite
MDPI and ACS Style
Kleineidam, J. Distinguishing Organisational Profiles of Food Loss Management in Logistics. Logistics 2022, 6, 61. https://0-doi-org.brum.beds.ac.uk/10.3390/logistics6030061
AMA Style
Kleineidam J. Distinguishing Organisational Profiles of Food Loss Management in Logistics. Logistics. 2022; 6(3):61. https://0-doi-org.brum.beds.ac.uk/10.3390/logistics6030061
Chicago/Turabian StyleKleineidam, Julia. 2022. "Distinguishing Organisational Profiles of Food Loss Management in Logistics" Logistics 6, no. 3: 61. https://0-doi-org.brum.beds.ac.uk/10.3390/logistics6030061