Article

Urban Neighbourhood Environments, Cardiometabolic Health and Cognitive Function: A National Cross-Sectional Study of Middle-Aged and Older Adults in Australia

1
Mary MacKillop Institute for Health Research, Australian Catholic University, Melbourne, VIC 3000, Australia
2
School of Public Health, The University of Hong Kong, Hong Kong, China
3
Baker Heart and Diabetes Institute, Melbourne, VIC 3004, Australia
4
Department of Community Medicine, UiT the Artic University of Norway, 9019 Tromsø, Norway
5
School of Public Health and Preventive Medicine, Monash University, Melbourne, VIC 3004, Australia
6
School of Life Sciences, La Trobe University, Melbourne, VIC 3086, Australia
7
School of Population and Global Health, University of Melbourne, Melbourne, VIC 3053, Australia
8
Sydney School of Public Health, The University of Sydney, Camperdown, NSW 2006, Australia
9
Menzies Institute for Medical Research, College of Health and Medicine, University of Tasmania, Hobart, TAS 7000, Australia
10
School of Psychology, University of New South Wales, Randwick, NSW 2052, Australia
11
Neuroscience Research Australia (NeuRA), Sydney, NSW 2031, Australia
*
Author to whom correspondence should be addressed.
Submission received: 7 December 2021 / Revised: 28 December 2021 / Accepted: 5 January 2022 / Published: 7 January 2022

Abstract

:
Population ageing and urbanisation are global phenomena that call for an understanding of the impacts of features of the urban environment on older adults’ cognitive function. Because neighbourhood characteristics that can potentially have opposite effects on cognitive function are interdependent, they need to be considered in conjunction. Using data from an Australian national sample of 4141 adult urban dwellers, we examined the extent to which the associations of interrelated built and natural environment features and ambient air pollution with cognitive function are explained by cardiometabolic risk factors relevant to cognitive health. All examined environmental features were directly and/or indirectly related to cognitive function via other environmental features and/or cardiometabolic risk factors. Findings suggest that dense, interconnected urban environments with access to parks, blue spaces and low levels of air pollution may benefit cognitive health through cardiometabolic risk factors and other mechanisms not captured in this study. This study also highlights the need for a particularly fine-grained characterisation of the built environment in research on cognitive function, which would enable the differentiation of the positive effects of destination-rich neighbourhoods on cognition via participation in cognition-enhancing activities from the negative effects of air pollutants typically present in dense, destination-rich urban areas.

1. Introduction

Population ageing and urbanisation are global phenomena with major consequences for almost all sectors of society [1,2]. The majority of older adults live in cities [3], with migration from rural to urban areas expected to continue in this age group [2]. These trends call for an understanding of the impacts of urban environments on the health and well-being of older people.
One of the most burdensome non-communicable diseases in people aged 60 years or over is dementia [4]. Due to the current global increasing trend in population ageing, the number of dementia cases is expected to double every 20 years and reach over 135 million worldwide in 2050, with major societal implications for both high-income as well as low-middle-income countries [5]. An important cornerstone of a global strategy for long-term dementia risk reduction is cognitive health promotion throughout adulthood, which aims to maintain cognitive function in healthy individuals and minimise cognitive decline in those with cognitive impairment by targeting relevant modifiable risk factors [6]. These factors include several indicators of cardiometabolic health, such as obesity, elevated blood glucose and blood pressure [6] and dyslipidaemia [7].
Urban environments have been identified as important contributors to cardiometabolic health [8] through their influence on health-related lifestyle behaviours (e.g., physical activity and sedentary behaviours) [9,10] and through exposure to environmental stressors, such as air pollutants and noise [11,12,13]. More compact neighbourhoods with interconnected streets and access to amenities and parks were found to promote walking for transport [9] and leisure-time physical activity [14] in older populations and, by doing so, reduce sedentary behaviour [10,15]. A recent systematic review reported beneficial effects of walkable neighbourhoods (typified by higher levels of density, street connectivity and access to services) on changes in cardiometabolic health outcomes, including obesity, type 2 diabetes and hypertension [8]. There is, however, a dearth of studies on neighbourhood environmental characteristics potentially contributing to middle-aged and older adults’ cognitive function and the related role of cardiometabolic risk factors [16,17].
In general, studies on environmental correlates of cognitive function examined a limited range of neighbourhood attributes and often reported mixed findings [16], possibly because of the omission of important environmental confounders [17]. For example, while access to amenities is expected to benefit cognitive function by facilitating social engagement and promoting an active lifestyle and, hence, cardiometabolic health, it is also often associated with higher levels of traffic-related air pollution [18]. In this case, the omission of air pollution indicators from models of cognitive function may lead to the conclusion that destination accessibility is not an important factor [17]. This shortcoming can be addressed by including key sets of environmental attributes in models of cognitive function and considering their interrelationships, as proposed in an ecological model of urban environment effects on cognitive health [17,19], a simplified version of which, adapted to the present study, is presented in Figure 1.
The model in Figure 1 posits that characteristics of the urban built, natural and socio-economic environment and their by-products (air pollution), influence cognitive health indirectly via cardiometabolic health parameters that have been linked to dementia [6,7] and via other pathways (e.g., engagement in social and intellectual activities, attentional restauration) here depicted as ‘direct’ effects. Using this ecological framework, the present study examined the extent to which cardiometabolic health indicators explain associations of interrelated characteristics of the neighbourhood environment with cognitive function in mid-age and older Australians.

2. Materials and Methods

We used data from the Australian Diabetes, Obesity and Lifestyle (AusDiab) study, a three-wave population-based survey designed to examine the prevalence, incidence and determinants of diabetes in Australian adults aged 25 years and over [20,21]. Data were collected from participants living in 42 selected areas consisting of 1,286 contiguous census administrative units (Statistical Areas 1, SA1) across metropolitan and regional cities of seven Australian states/territories. SA1s have an average population size of 400 people. Participants were eligible to participate if they were within the target age bracket, resided at their addresses for at least 6 months prior to the survey, had no physical or intellectual disabilities and provided informed written consent. We used data from the third wave of AusDiab, the only wave in which cognitive function tests were administered and for which relevant environmental exposures were available (ethics approval: Alfred Hospital Ethics Committee, ref. no. 39/11) [21,22,23]. Details about AusDiab data collection procedures are provided elsewhere [20,21,22]. Because this study focused on urban environments, 473 participants who did not reside in urban areas (here defined as towns and cities of 10,000 people or more) were excluded from the analyses, giving an analytical sample of 4141 participants. (The study was conducted according to the guidelines of the Declaration of Helsinki, and approved by the Alfred Hospital Ethics Committee, Melbourne, Australia (ref. no 39/11; 2 March 2011).)

2.1. Measures

2.1.1. Environmental Measures (Exposures)

Neighbourhood built and natural environment measures were generated using Geographic Information Systems (GIS) software. Street-network buffers of a 1-km radius were created around geocoded participants’ residential addresses to define neighbourhoods. A 1-km radius was used because it corresponds to a 10–20 min walk, which is a common definition of a neighbourhood [23]. Four built environment, two natural environment and two ambient air pollution measures were computed. These were population density (persons/ha), street intersection density (intersections/km2), percentage of commercial land use, non-commercial land use mix (range: 0–1), percentage of parkland, percentage of blue spaces (e.g., lakes, coastlines and rivers) and annual average concentrations of nitrogen dioxide (NO2, units: ppb) and fine particulate matter <2.5 µm in aerodynamic diameter (PM2.5, units: μg/m3). Details on these measures are provided elsewhere [23,24,25] and in the Supplementary Materials (Section S1).

2.1.2. Cognitive Function Measures (Outcomes)

Memory and processing speed were the cognitive functions examined in this study because they are essential to learning and reasoning, they typically decline with age, but their decline can be slowed down by leading an active lifestyle and reducing cardiometabolic risk factors [26]. Memory was assessed using the California Verbal Learning Test (CVLT) whereby participants recalled 16 common shopping items after a 20-min delay (score range: 0–16) [27]. Processing speed was measured using the Symbol–Digit Modalities test (SDMT), which requires participants to use a reference key to find and report the numbers (1 to 9) corresponding to nine geometric figures as quickly as possible in 90 s (score range: 0–60) [28].

2.1.3. Cardiometabolic Risk Factors (Potential Mediators)

Cardiometabolic risk factors considered as potential mediators of the associations between neighbourhood environment characteristics and cognitive function included: an adiposity indicator (waist circumference expressed in cm); an indicator of elevated blood pressure (mean arterial pressure expressed in mmHg); an indicator of elevated blood glucose (glycated haemoglobin [HbA1c in mmol/mol]); and three indicators of dyslipidaemia (low-density lipoprotein [LDL] cholesterol (mg/dL), high-density lipoprotein [HDL] cholesterol (mg/dL) and triglycerides (mg/dL)). The assessment of cardiometabolic risk factors in AusDiab has been detailed elsewhere [20,21].

2.1.4. Confounders and Covariates

Several variables were included as potential confounders or covariates as appropriate (see Supplementary Materials, Table S1 for details). These were self-reported sex, age, educational attainment, employment status, household income, living arrangements, ethnicity, history of heart problems or stroke, tobacco smoking status, area-level socio-economic status, relevant medications (hypertension, diabetes and lipid-lowering medications) and residential self-selection.

2.2. Statistical Analyses

Descriptive statistics and the percentage of missing values were computed for all variables. Because 17% of cases had missing data on at least one variable, multiple imputations by chained equations [29] were used to create ten imputed datasets for the regression analyses. Directed acyclic graphs informed the selection of a minimally sufficient set of confounders for regression models estimating exposure-mediator and mediator-outcome relationships (Figure S1). The potential mediating role of cardiometabolic risk factors in the associations between neighbourhood environmental characteristics and cognitive function was examined using the joint-significance test according to which data support mediation if the exposure-mediator associations and the exposure-adjusted mediator-outcome associations are both statistically significant [15]. Generalised additive mixed models (GAMMs; package ‘mgcv’ version 1.8.22 [30] in R) with random intercepts at the SA1 level were used to estimate these associations to allow for possible curvilinear effects. Analyses were conducted in several steps detailed in the Supplementary Materials (Section S2 and Table S1).
Briefly, given that our analyses considered potential causal effects among environmental characteristics, we first estimated the confounder-adjusted total effects of each environmental variable on each cardiometabolic risk factor. Here, ‘total effect’ refers to the sum of effects mediated and unmediated by other environmental variables and is estimated by excluding from the regression model those environmental characteristics that are deemed to be in the pathway between the environmental exposure of interest and the response variable (outcome or mediator). We then estimated the ‘direct effects’ of environmental characteristics on the cardiometabolic risk factors (i.e., unmediated by other environmental variables) by including in the regression models all environmental characteristics hypothesised to mediate the effects of the environmental exposure of interest on the response variable. As we hypothesised that adiposity (waist circumference) would be a determinant of other cardiometabolic risk factors [31,32], we also estimated the direct effects of waist circumference on other cardiometabolic risk factors adjusted for all environmental variables. Finally, a set of models estimated the environmental-exposure-adjusted associations of cardiometabolic risk factors with cognitive function. These models also provided estimates of the effects of environmental characteristics on cognitive function not explained by cardiometabolic risk factors (i.e., ‘direct’ effects of the environment on cognition). In the above models, we also examined whether taking medications for a specific cardiometabolic risk factor moderated the associations of environmental characteristics, waist circumferences with the cardiometabolic risk factor and the associations of the cardiometabolic risk factors with cognitive function.

3. Results

The average age of the sample was 61 years (SD = 11). The majority of participants were of English-speaking background, female and in paid employment (Table 1). Nearly half of the participants were living with a partner but without children. The sample was heterogeneous in socio-economic status, both in terms of educational attainment and household income. Only 6.3% of participants were taking diabetes medications, while lipid-lowering and antihypertensive medications were considerably more prevalent. There was substantial variability in several neighbourhood environmental characteristics. However, the percentage of blue space and commercial land in residential buffers was low. The average annual concentrations of air pollutants were also relatively low, with NO2 at 5.5 ppb and PM2.5 at 6.3 μg/m3.
The total effects of environmental characteristics on cardiometabolic risk factors are reported in Table 2. Population density and NO2 showed mixed total effects on cardiometabolic risk factors. In contrast, intersection density, non-commercial land use mix and PM2.5 were prevalently associated with unfavourable outcomes, while indicators of natural environment tended to show positive effects on cardiometabolic health. Taking diabetes medications moderated the total effect of the percentage of blue space on glycated haemoglobin whereby only those on medication showed a negative association (10% increase in blue space; eb = 0.845; 95% CI: 0.743, 0.962; p = 0.011). Significant total but not direct effects on cardiometabolic risk factors were observed for population density in relation to glycated haemoglobin, percentage of commercial land in relation to mean arterial pressure and non-commercial land use mix in relation to HDL cholesterol and triglycerides (Table 2; Figure 2 and Figure 3). The total effects of these three built environment attributes were fully explained by their impact on other environmental attributes depicted in Figure 2 and Figure 3.
HDL cholesterol mediated some of the associations between environmental characteristics and both cognitive functions (Figure 2 and Figure 3), while waist circumference and glycated haemoglobin were identified as mediators of environment-processing speed associations (Figure 3). Environmental attributes that showed positive indirect effects on both cognitive functions through HDL cholesterol were intersection density, population density (via intersection density) and percentage of blue space (via waist circumference) (Figure 2 and Figure 3). Environmental characteristics that exhibited a detrimental indirect effect on cognitive functions through HDL cholesterol were PM2.5 and environmental attributes that contributed to higher levels of PM2.5 (population density, percentage of commercial land and parkland and non-commercial land use) (Figure 2 and Figure 3). In addition, PM2.5 showed a positive direct effect on memory, NO2 on processing speed and percentage of parkland on both cognitive functions.
PM2.5 and its environmental antecedents had a negative and percentage of blue space a positive, indirect effect on processing speed through waist circumference and glycated haemoglobin (Figure 3). NO2 with its environmental antecedents (population density, percentage of parkland, street intersection density and non-commercial land use mix) had a negative indirect effect on processing speed through glycated haemoglobin. Blue space had a positive indirect effect on processing speed through glycated haemoglobin in those on diabetes medications (Figure 3).

4. Discussion

This study examined the potential effects of characteristics of the neighbourhood built and natural environment on cognitive function in conjunction with ambient air pollution. In doing so, it identified potential pathways of influence via cardiometabolic health indicators. We discuss the findings starting from the environmental attributes more proximal to cognitive function (ambient air pollution) as depicted in the proposed conceptual model of neighbourhood environmental influences on cognitive health (Figure 1).

4.1. Air Pollution

After adjusting for built and natural neighbourhood environmental characteristics, we observed negative indirect effects of PM2.5 and NO2 on cognitive function via cardiometabolic risk factors. These findings were expected because higher levels of these air pollutants have been previously associated with worse cognitive health outcomes in humans [6,18]. Also, animal models showed that PM2.5 and NO2 contribute to neurodegenerative processes via cardiovascular and cerebrovascular diseases, and other pathways key to dementia pathogenesis (e.g., Aβ depositions) [18,33]. In this study, the negative effects of PM2.5 on cognitive function were channelled through indicators of adiposity (waist circumference), elevated blood glucose (glycated haemoglobin) and hyperlipidaemia (low HDL cholesterol), while those of NO2 were mainly explained by elevated blood glucose (glycated haemoglobin). Exposure to air pollution has been previously associated with adiposity [34,35], which, as also suggested by this study, is an established causal factor for elevated blood glucose and dyslipidaemia [36] that, in turn, are harmful to cognitive health [6,37,38,39].
We found negative effects on cognitive function mediated by glycated haemoglobin but independent of waist circumference for NO2 but not PM2.5. In line with these findings, Honda et al. [40], who estimated long-term annual exposure to air pollutants in older Americans, reported stronger negative effects of NO2 than PM2.5 on glycated haemoglobin. Similar associations have also been observed in studies of diabetes prevalence [41,42] suggesting that traffic-related air pollution, of which NO2 is an indicator, may be more important than particulate matter for glycaemic control [40,41] and may impact cognitive function through these particular cardiometabolic risk factors.
In addition to the negative indirect effects of air pollutants on cognitive function, we observed positive direct effects, which were unexpected and likely due to using coarse measures of land use as proxies of access to destinations promoting cognition-enhancing activities (e.g., places in the neighbourhood for social, physical and intellectual activities). Specifically, commercial destinations that offer opportunities for cognition-enhancing activities (e.g., cultural and entertainment venues, food outlets) can be major sources of pollution generated by food preparation and high volumes of visitors and, hence, traffic [24,25,43]. While we adjusted the effects of air pollutants for proxies of destination accessibility, these proxies (non-commercial land use mix and percentage of commercial land) were likely unable to discriminate destinations for cognition-enhancing activities (and higher levels of pollution; e.g., restaurants) from those that were not (e.g., banks or warehouses). This could have led to us observing the positive direct effects of air pollutants on cognitive function. In fact, positive associations of NO2 and PM2.5 with walking for transport were observed in an earlier analysis of AusDiab data [23] and negative associations of NO2 with mean arterial pressure were found in this study, suggesting that destinations supporting engagement in utilitarian walking and other activities were not accurately captured by the land-use measures used in this study. These findings highlight the need for an accurate and comprehensive characterisation of urban neighbourhood environments, encompassing all key interrelated features, in studies of environmental determinants of cognitive function.

4.2. Natural Environment

This study suggests prevalently positive effects of access to parkland on cognitive function, unmediated by cardiometabolic risk factors and mediated by other environmental attributes, albeit some negative indirect effects of parkland via air pollutants and related cardiometabolic risk factors were also observed. Greenspace has been previously found to have positive effects on cognitive function in adults [44], whereas the evidence is less consistent in older adults [45]. The positive effects observed in this study may have been due to various here unmeasured mechanisms, including engagement in physical activity [6,9,14], social activities [46] and attention restoration [47], the latter referring to the restoration of directed attention depleted by attentional tasks for daily living in the context of complex urban environments [47].
Contrary to our expectation that the positive effects of parkland on cognitive function would be in part explained by its mitigating effects on air pollution [48], our measure of greenspace was positively related to both annual average concentrations of PM2.5 and NO2. The positive association with PM2.5 might have been due to natural sources, including wind-blown dust, sea salt and biogenic emissions from parkland [49]. Other parkland-related contributors to neighbourhood-level PM2.5 and NO2 concentrations could be smoke from prescribed fires [50] and maintenance activities utilising petrol-powered machinery (e.g., grass mowing; leaf blowing) [51]. These potential deleterious effects need to be acknowledged when examining the impact of greenspace on cognitive function and related biomarkers.
While no direct effect of blue space on cognitive function was observed in this study, positive indirect effects through waist circumference, HDL cholesterol and glycated haemoglobin (in those on diabetes medications) were observed. These findings may be due to blue spaces promoting an active lifestyle [52] and physical activity contributing to better cardiometabolic health [53]. Alternatively, as access to blue space promotes outdoor activities [54] that increase exposure to solar ultraviolet radiation [55], the beneficial indirect effects of blue space on cognitive function via waist circumference and glycated haemoglobin, in particular, might have been in part due to higher levels of vitamin D from sun UV exposure [56,57].

4.3. Built Environment

We hypothesised that built environment indicators of densification and access to services (e.g., population density, intersection density and land use mix) would show both positive and negative effects on cognitive health given that dense, complex, destination-rich environments provide opportunities for social contacts and other cognition-enhancing activities (e.g., physical activity) but also increase exposures to stressors such as air pollution and noise [17]. In support of this conjecture, we found positive effects as well as air-pollution-mediated negative effects of population and intersection densities on both memory and processing speed via HDL cholesterol. The positive effects of these two built environment attributes may be linked to them facilitating active travel (i.e., walking for transport), as previously observed in this [58] and other cohorts [9,59] and to active travel being associated with healthier blood lipid profiles [60] and better mental and cognitive health [61]. Notably, only after adjusting for air pollutants, we were able to identify the positive and negative effects of population and intersection densities on HDL cholesterol and, thus, cognitive function (NB: the total effects of these attributes on HDL cholesterol were nil). Also, the unfavourable total effects of several built environment attributes on specific cardiometabolic risk factors vanished after adjustment for air pollutants. This showcases the importance of conducting mediation analyses that consider the inter-relationships between activity-promoting features of the urban built environment and its by-products (air pollution) in studies of environmental determinants of cognitive function.
Interestingly, street intersection density and non-commercial land use mix were positively related to cardiometabolic risk factors that did not mediate environment-cognition associations in this study (LDL cholesterol, triglycerides and mean arterial pressure) even after adjustment for air pollutants. Possible contributors to these findings might be access to unhealthy foods (i.e., fast food outlets) [62] and traffic-related and industrial noise [13,63] in neighbourhoods with high levels of non-commercial land use mix (including industrial land) and intersection density [64].
Apart from population density and street intersection density, no other built environmental attribute was directly related to the cardiovascular risk factors associated with cognitive function in this study. However, the percentage of commercial land and land use mix were related to air pollutants which, in turn, showed negative effects on cognitive function mediated by cardiometabolic risk factors and positive effects not mediated by cardiometabolic risk factors. As explained earlier, the latter effects were likely due to air pollutants being indicators of human activities and, hence, opportunities to engage in cognition-enhancing pursuits (socialising, entertainment, intellectual activities) rather than them being beneficial to cognitive health. These findings not only highlight the need for simultaneously examining the effects of key interrelated features of urban environments on cognitive function but also the need for a more fine-grained characterisation of urban environments in terms of destinations that provide attractive opportunities for cognition-enhancing activities (e.g., the density of food outlets, places for socialising, quality of green spaces). This information is essential for the cognitive health impact assessment of neighbourhood environmental features that, in turn, can guide city planning policies.

4.4. Strength and Limitations

A strength of this study is the utilisation of data from a national cohort capturing diverse urban environments in Australia. We examined the joint linear and/or curvilinear effects of the neighbourhood built and natural environment and air pollution on cognitive function, and the potential cardiometabolic mechanisms underpinning them. By doing so, we accounted for neighbourhood self-selection to partially address reverse causality. We examined total, direct and indirect cross-sectional effects of urban environmental features on cognitive function to disentangle their potentially beneficial and harmful impacts. Study limitations include the cross-sectional nature of the available data and the employment of coarse measures of destination accessibility relevant to cognition-enhancing activities. The latter limitation has made it difficult to disentangle the positive (access to destinations supporting healthy behaviours) and negative effects (pollution and access to destinations promoting unhealthy behaviours) of urban densification on cognitive function and related cardiometabolic risk factors. It would have also been desirable to have data on other key covariates, such as estimates of indoor pollution levels in the home. Future research would need to address these limitations by conducting longitudinal studies able to capture changes in exposures and cognitive function [65] and more accurately characterise urban environments that may influence key biological and behavioural risk factors of cognitive decline.

5. Conclusions

In line with a proposed ecological model of neighbourhood environmental influences on cognitive health, this study has found features of urban environments to be directly or indirectly related, via cardiometabolic risk factors, to cognitive function in middle-aged and older Australian adults. Dense, interconnected neighbourhoods may contribute to better cardiometabolic outcomes (e.g., higher HDL cholesterol) and, consequently, better cognitive health by promoting active transportation. While such environments usually provide better opportunities for social contacts and other cognition-stimulating activities, they are often sources of air pollution arising from human activities and vehicular traffic that harm cardiometabolic health and, hence, cognitive function. Our findings also provide support for the positive effects of green and blue spaces on cognitive function via cardiometabolic risk factors and other mechanisms that were not examined in this study (e.g., attention restoration, social contacts or physical activity). Cognition-friendly urban environments appear to be typified by compact, interconnected neighbourhoods with good access to green and blue spaces and low average annual levels of PM2.5 and NO2. Longitudinal studies with a more accurate characterisation of the built environment, the quality of natural spaces and individual activity locations (within and outside the neighbourhood) are needed to better understand how to create cities that can help preserve cognitive function in ageing populations.

Supplementary Materials

The following supporting information can be downloaded at: https://0-www-mdpi-com.brum.beds.ac.uk/article/10.3390/toxics10010023/s1, Section S1: Detailed description of built and natural environmental exposure, Section S2: Detailed description of analytical steps, Section S3: Supplementary results, Figure S1: Directed acyclic graph (DAG) depicting the hypothesised relations between neighbourhood attributes, cardiometabolic risk factors and cognitive function, Figure S2: Curvilinear relationships of population density with street intersection density (A), percentage of commercial land use (B), non-commercial land use mix (panel C) and percentage parkland (panel D) (in 1km residential buffers), Figure S3: Curvilinear relationships of population density with average annual concentrations of NO2 (A) and PM2.5 (B), Figure S4: Curvilinear relationships of street intersection density (A) and non-commercial land use mix (B) with average annual concentrations of NO2, Figure S5: Curvilinear relationships of average annual concentrations of PM2.5 with mean arterial pressure (total effects), Table S1: Outline of regression analyses, Table S2: Relationships between neighbourhood environmental variables, Table S3: Relationships between neighbourhood environmental characteristics and cardiometabolic risk factors—direct effects, Table S4: Relationships of neighbourhood environmental characteristics and cardiometabolic risk factors with cognitive function—direct effects.

Author Contributions

Conceptualization, E.C., A.B., J.E.S. and K.J.A.; methodology, E.C., L.D.K. and K.J.A.; software, E.C., E.M. and L.D.K.; validation, E.C. and A.B.; formal analysis, E.C.; investigation, E.C., J.E.S. and K.J.A.; resources, J.E.S. and L.D.K.; data curation, E.C., J.E.S., E.M. and L.D.K.; writing—original draft preparation, E.C. and A.B.; writing—review and editing, E.C., A.B., J.E.S., E.M., L.D.K., R.T., A.J.W. and K.J.A.; visualization, E.C.; supervision, E.C.; project administration, E.C.; funding acquisition, E.C., A.B., J.E.S. and K.J.A. All authors have read and agreed to the published version of the manuscript.

Funding

This work was supported by a program grant (“The environment, active living and cognitive health: building the evidence base”) from the Australian Catholic University [grant number ACURF18]. Jonathan E. Shaw is supported by a National Health and Medical Research Council (NHMRC) Investigator Grant [grant number 1173952]. Kaarin J. Anstey is funded by an Australian Research Council Laureate Fellowship [grant number FL190100011].

Institutional Review Board Statement

The study was conducted according to the guidelines of the Declaration of Helsinki, and approved by the Alfred Hospital Ethics Committee, Melbourne, Australia (ref. no 39/11; 2 March 2011).

Informed Consent Statement

Informed consent was obtained from all subjects involved in the study.

Data Availability Statement

Data that support the findings of this study are available on request under a license agreement. Written applications can be made to the AusDiab Steering Committee ([email protected]).

Acknowledgments

The AusDiab study, initiated and coordinated by the International Diabetes Institute, and subsequently coordinated by the Baker Heart and Diabetes Institute, gratefully acknowledges the support and assistance given by: B Atkins, B Balkau, E Barr, A Cameron, S Chadban, M de Courten, D Dunstan, A Kavanagh, D Magliano, S Murray, N Owen, K Polkinghorne, T Welborn, P Zimmet and all the study participants. Also, for funding or logistical support, we are grateful to: National Health and Medical Research Council (NHMRC grants 233200 and 1007544), Australian Government Department of Health and Ageing, Abbott Australasia Pty Ltd., Alphapharm Pty Ltd., Amgen Australia, AstraZeneca, Bristol-Myers Squibb, City Health Centre-Diabetes Service-Canberra, Department of Health and Community Services—Northern Territory, Department of Health and Human Services—Tasmania, Department of Health—New South Wales, Department of Health—Western Australia, Department of Health—South Australia, Department of Human Services—Victoria, Diabetes Australia, Diabetes Australia Northern Territory, Eli Lilly Australia, Estate of the Late Edward Wilson, GlaxoSmithKline, Jack Brockhoff Foundation, Janssen-Cilag, Kidney Health Australia, Marian & FH Flack Trust, Menzies Research Institute, Merck Sharp & Dohme, Novartis Pharmaceuticals, Novo Nordisk Pharmaceuticals, Pfizer Pty Ltd., Pratt Foundation, Queensland Health, Roche Diagnostics Australia, Royal Prince Alfred Hospital, Sydney, Sanofi Aventis, sanofi-synthelabo, and the Victorian Government’s OIS Program. We also acknowledge the support from the Australian Research Council Centre of Excellence in Population Ageing Research. We are grateful to Karen Biddiscombe, Yih-kai Chan, Kimberley Keates, Sonia Marchionda, Hannah Richards and Mark Symmons for assisting with the literature searches and summaries of relevant systematic reviews covering the various research fields included in this study, and to David H. Lee for contributing to the computation of environmental data.

Conflicts of Interest

The authors declare no conflict of interest. The funders had no role in the design of the study; in the collection, analyses, or interpretation of data; in the writing of the manuscript, or in the decision to publish the results.

References

  1. United Nations. Global Issues: Ageing. Available online: https://www.un.org/en/global-issues/ageing (accessed on 30 June 2021).
  2. United Nations, Department of Economic and Social Affairs, Population Division. World Urbanization Prospects: The 2018 Revision, online ed.; United Nations: New York, NY, USA, 2018. [Google Scholar]
  3. United Nations, Department of Economic and Social Affairs, Population Division. Urban and Rural Population by Age and Sex, 1980–2015; United Nations: New York, NY, USA, 2014; Available online: https://esa.un.org/unpd/popdev/urpas/urpas2014.aspx (accessed on 30 June 2021).
  4. Prince, M.J.; Wu, F.; Guo, Y.; Gutierrez Robledo, L.M.; O’Donnell, M.; Sullivan, R.; Yusuf, S. The burden of disease in older people and implications for health policy and practice. Lancet 2015, 385, 549–562. [Google Scholar] [CrossRef]
  5. Alzheimer’s Disease International. Policy Brief for G8 Heads of Government—The Global Impact of Dementia 2013–2050; Alzheimer’s Disease International: London, UK, 2013; Available online: http://www.alz.co.uk/research/G8-policy-brief (accessed on 25 August 2014).
  6. Livingston, G.; Huntley, J.; Sommerlad, A.; Ames, D.; Ballard, C.; Banerjee, S.; Brayne, C.; Burns, A.; Cohen-Mansfield, J.; Cooper, C.; et al. Dementia prevention, intervention, and care: 2020 report of the Lancet Commission. Lancet 2020, 396, 413–446. [Google Scholar] [CrossRef]
  7. Li, X.Y.; Zhang, M.; Xu, W.; Li, J.Q.; Cao, X.P.; Yu, J.T.; Tan, L. Midlife modifiable risk factors for dementia: A systematic review and meta-analysis of 34 prospective cohort studies. Curr. Alzheimer Res. 2019, 16, 1254–1268. [Google Scholar] [CrossRef] [PubMed]
  8. Chandrabose, M.; Rachele, J.N.; Gunn, L.; Kavanagh, A.; Owen, N.; Turrell, G.; Giles-Corti, B.; Sugiyama, T. Built environment and cardio-metabolic health: Systematic review and meta-analysis of longitudinal studies. Obes. Rev. 2019, 20, 41–54. [Google Scholar] [CrossRef] [PubMed] [Green Version]
  9. Cerin, E.; Nathan, A.; van Cauwenberg, J.; Barnett, D.W.; Barnett, A.; Council on Environment and Physical Activity (CEPA)—Older Adults working group. The neighbourhood physical environment and active travel in older adults: A systematic review and meta-analysis. Int. J. Behav. Nutr. Phys. Act. 2017, 14, 15. [Google Scholar] [CrossRef] [PubMed] [Green Version]
  10. Barnett, A.; Cerin, E.; Ching, C.S.; Johnston, J.M.; Lee, R.S. Neighbourhood environment, sitting time and motorised transport in older adults: A cross-sectional study in Hong Kong. BMJ Open 2015, 5, e007557. [Google Scholar] [CrossRef] [Green Version]
  11. Gaio, V.; Roquette, R.; Dias, C.M.; Nunes, B. Ambient air pollution and lipid profile: Systematic review and meta-analysis. Environ. Pollut. 2019, 254 Pt B, 113036. [Google Scholar] [CrossRef]
  12. Voss, S.; Schneider, A.; Huth, C.; Wolf, K.; Markevych, I.; Schwettmann, L.; Rathmann, W.; Peters, A.; Breitner, S. Long-term exposure to air pollution, road traffic noise, residential greenness, and prevalent and incident metabolic syndrome: Results from the population-based KORA F4/FF4 cohort in Augsburg, Germany. Environ. Int. 2021, 147, 106364. [Google Scholar] [CrossRef] [PubMed]
  13. Dzhambov, A.M.; Dimitrova, D.D. Residential road traffic noise as a risk factor for hypertension in adults: Systematic review and meta-analysis of analytic studies published in the period 2011–2017. Environ. Pollut. 2018, 240, 306–318. [Google Scholar] [CrossRef]
  14. Van Cauwenberg, J.; Nathan, A.; Barnett, A.; Barnett, D.W.; Cerin, E.; Council on Environment and Physical Activity (CEPA)-Older Adults Working Group. Relationships between neighbourhood physical environmental attributes and older adults’ leisure-time physical activity: A systematic review and meta-analysis. Sports Med. 2018, 48, 1635–1660. [Google Scholar] [CrossRef] [PubMed]
  15. Cerin, E.; Van Dyck, D.; Zhang, C.J.P.; Van Cauwenberg, J.; Lai, P.C.; Barnett, A. Urban environments and objectively-assessed physical activity and sedentary time in older Belgian and Chinese community dwellers: Potential pathways of influence and the moderating role of physical function. Int. J. Behav. Nutr. Phys. Act. 2020, 17, 73. [Google Scholar] [CrossRef]
  16. Besser, L.M.; McDonald, N.C.; Song, Y.; Kukull, W.A.; Rodriguez, D.A. Neighborhood environment and cognition in older adults: A systematic review. Am. J. Prev. Med. 2017, 53, 241–251. [Google Scholar] [CrossRef] [Green Version]
  17. Cerin, E. Building the evidence for an ecological model of cognitive health. Health Place 2019, 60, 102206. [Google Scholar] [CrossRef]
  18. Power, M.C.; Adar, S.D.; Yanosky, J.D.; Weuve, J. Exposure to air pollution as a potential contributor to cognitive function, cognitive decline, brain imaging, and dementia: A systematic review of epidemiologic research. Neurotoxicology. 2016, 56, 235–253. [Google Scholar] [CrossRef] [PubMed] [Green Version]
  19. Cerin, E.; Barnett, A.; Chaix, B.; Nieuwenhuijsen, M.J.; Caeyenberghs, K.; Jalaludin, B.; Sugiyama, T.; Sallis, J.F.; Lautenschlager, N.T.; Ni, M.Y.; et al. International Mind, Activities and Urban Places (iMAP) study: Methods of a cohort study on environmental and lifestyle influences on brain and cognitive health. BMJ Open 2020, 10, e036607. [Google Scholar] [CrossRef] [PubMed] [Green Version]
  20. Dunstan, D.W.; Zimmet, P.Z.; Welborn, T.A.; Cameron, A.J.; Shaw, J.; de Courten, M.; Jolley, D.; McCarty, D.J.; Australian Diabetes, Obesity and Lifestyle Study (AusDiab). The Australian Diabetes, Obesity and Lifestyle Study (AusDiab)—Methods and response rates. Diabetes Res. Clin. Pract. 2002, 57, 119–129. [Google Scholar] [CrossRef] [Green Version]
  21. Tanamas, S.K.; Magliano, D.J.; Lynch, B.M.; Sethi, P.; Willenberg, L.; Polkinghorne, K.R.; Chadban, S.; Dunstan, D.; Shaw, J.E. AusDiab 2012: The Australian Diabetes, Obesity and Lifestyle Study; Baker Heart and Diabetes Institute: Melbourne, Australia, 2013. [Google Scholar]
  22. Anstey, K.J.; Sargent-Cox, K.; Eramudugolla, R.; Magliano, D.J.; Shaw, J.E. Association of cognitive function with glucose tolerance and trajectories of glucose tolerance over 12 years in the AusDiab study. Alzheimer’s Res. Ther. 2015, 7, 48. [Google Scholar] [CrossRef] [Green Version]
  23. Cerin, E.; Barnett, A.; Shaw, J.E.; Martino, E.; Knibbs, L.D.; Tham, R.; Wheeler, A.J.; Anstey, K.J. From Urban Neighbourhood Environments to Cognitive Health: The Role of Physical Activity and Sedentary Behaviours. BMC Public Health 2021, 21, 2320. [Google Scholar] [CrossRef] [PubMed]
  24. Knibbs, L.D.; Coorey, C.P.; Bechle, M.J.; Cowie, C.T.; Dirgawati, M.; Heyworth, J.S.; Marks, G.B.; Marshall, J.D.; Morawska, L.; Pereira, G.; et al. Independent validation of national satellite-based land-use regression models for nitrogen dioxide using passive samplers. Environ. Sci. Technol. 2016, 50, 12331–12338. [Google Scholar] [CrossRef] [PubMed] [Green Version]
  25. Knibbs, L.D.; van Donkelaar, A.; Martin, R.V.; Bechle, M.J.; Brauer, M.; Cohen, D.D.; Cowie, C.T.; Dirgawati, M.; Guo, Y.; Hanigan, I.C.; et al. Satellite-based land-use regression for continental-scale long-term ambient PM2.5 exposure assessment in Australia. Environ. Sci. Technol. 2018, 52, 12445–12455. [Google Scholar] [CrossRef] [Green Version]
  26. Institute of Medicine. Cognitive Aging: Progress in Understanding and Opportunities for Action; The National Academies Press: Washington, DC, USA, 2015. [Google Scholar] [CrossRef]
  27. Delis, D.C.; Kramer, J.H.; Kaplan, E.; Ober, B.A. California Verbal Learning Test; Psychological Corporation Harcourt Brace Jovanovich: San Antonio, TX, USA, 1987. [Google Scholar]
  28. Smith, A. Symbol Digit Modalities Test (SDMT) Manual; Western Psychological Services: Los Angeles, CA, USA, 1982. [Google Scholar]
  29. Van Buuren, S.; Groothuis-Oudshoorn, K. mice: Multivariate Imputation by Chained Equations in R. J. Stat. Softw. 2011, 45, 1–67. [Google Scholar] [CrossRef] [Green Version]
  30. Wood, S.N. Generalised Additive Models: An Introduction with R, 2nd ed.; Chapman & Hall/CRC: Boca Raton, FL, USA, 2017. [Google Scholar]
  31. Klein, S.; Allison, D.B.; Heymsfield, S.B.; Kelley, D.E.; Leibel, R.L.; Nonas, C.; Kahn, R. Waist circumference and cardiometabolic risk: A consensus statement from Shaping America’s Health: Association for Weight Management and Obesity Prevention; NAASO, the Obesity Society; the American Society for Nutrition; and the American Diabetes Association. Obesity 2007, 15, 1061–1067. [Google Scholar] [CrossRef] [PubMed]
  32. Bays, H.E.; Toth, P.P.; Kris-Etherton, P.M.; Abate, N.; Aronne, L.J.; Brown, W.V.; Gonzalez-Campoy, J.M.; Jones, S.R.; Kumar, R.; La Forge, R.; et al. Obesity, adiposity, and dyslipidemia: A consensus statement from the National Lipid Association. J. Clin. Lipidol. 2013, 7, 304–383. [Google Scholar] [CrossRef] [PubMed] [Green Version]
  33. Kilian, J.; Kitazawa, M. The emerging risk of exposure to air pollution on cognitive decline and Alzheimer’s disease—Evidence from epidemiological and animal studies. Biomed. J. 2018, 41, 141–162. [Google Scholar] [CrossRef]
  34. An, R.; Ji, M.; Yan, H.; Guan, C. Impact of ambient air pollution on obesity: A systematic review. Int. J. Obes. 2018, 42, 1112–1126. [Google Scholar] [CrossRef] [PubMed]
  35. Zhang, N.; Wang, L.; Zhang, M.; Nazroo, J. Air quality and obesity at older ages in China: The role of duration, severity and pollutants. PLoS ONE 2019, 14, e0226279. [Google Scholar] [CrossRef] [Green Version]
  36. Fall, T.; Hägg, S.; Ploner, A.; Mägi, R.; Fischer, K.; Draisma, H.H.; Sarin, A.P.; Benyamin, B.; Ladenvall, C.; Åkerlund, M.; et al. Age- and sex-specific causal effects of adiposity on cardiovascular risk factors. Diabetes 2015, 64, 1841–1852. [Google Scholar] [CrossRef] [Green Version]
  37. Kivipelto, M.; Ngandu, T.; Laatikainen, T.; Winblad, B.; Soininen, H.; Tuomilehto, J. Risk score for the prediction of dementia risk in 20 years among middle aged people: A longitudinal, population-based study. Lancet Neurol. 2006, 5, 735–741. [Google Scholar] [CrossRef]
  38. Luchsinger, J.A.; Palmas, W.; Teresi, J.A.; Silver, S.; Kong, J.; Eimicke, J.P.; Weinstock, R.S.; Shea, S. Improved diabetes control in the elderly delays global cognitive decline. J. Nutr. Health Aging 2011, 15, 445–449. [Google Scholar] [CrossRef] [Green Version]
  39. Zhang, X.; Jiang, X.; Han, S.; Liu, Q.; Zhou, J. Type 2 diabetes mellitus is associated with the risk of cognitive impairment: A meta-analysis. J. Mol. Neurosci. 2019, 68, 251–260. [Google Scholar] [CrossRef]
  40. Honda, T.; Pun, V.C.; Manjourides, J.; Suh, H. Associations between long-term exposure to air pollution, glycosylated hemoglobin and diabetes. Int. J. Hyg. Environ. Health 2017, 220, 1124–1132. [Google Scholar] [CrossRef]
  41. Coogan, P.F.; White, L.F.; Jerrett, M.; Brook, R.D.; Su, J.G.; Seto, E.; Burnett, R.; Palmer, J.R.; Rosenberg, L. Air pollution and incidence of hypertension and diabetes mellitus in black women living in Los Angeles. Circulation 2012, 125, 767–772. [Google Scholar] [CrossRef] [PubMed] [Green Version]
  42. Kramer, U.; Herder, C.; Sugiri, D.; Strassburger, K.; Schikowski, T.; Ranft, U.; Rathmann, W. Traffic-related air pollution and incident type 2 diabetes: Results from the SALIA cohort study. Environ. Health Perspect. 2010, 118, 1273–1279. [Google Scholar] [CrossRef] [Green Version]
  43. Knibbs, L.D.; Hewson, M.G.; Bechle, M.J.; Marshall, J.D.; Barnett, A.G. A national satellite-based land-use regression model for air pollution exposure assessment in Australia. Environ. Res. 2014, 135, 204–211. [Google Scholar] [CrossRef] [Green Version]
  44. de Keijzer, C.; Gascon, M.; Nieuwenhuijsen, M.J.; Dadvand, P. Long-term green space exposure and cognition across the life course: A systematic review. Curr. Environ. Health Rep. 2016, 3, 468–477. [Google Scholar] [CrossRef] [PubMed]
  45. de Keijzer, C.; Bauwelinck, M.; Dadvand, P. Long-term exposure to residential greenspace and healthy ageing: A systematic review. Curr. Environ. Health Rep. 2020, 7, 65–88. [Google Scholar] [CrossRef] [PubMed]
  46. Maas, J.; van Dillen, S.M.E.; Verheij, R.A.; Groenwegen, P.P. Social contacts as a possible mechanism behind the relation between green space and health. Health Place 2009, 15, 586–595. [Google Scholar] [CrossRef] [PubMed] [Green Version]
  47. Berman, M.G.; Jonides, J.; Kaplan, S. The cognitive benefits of interacting with nature. Psychol. Sci. 2008, 19, 1207–1212. [Google Scholar] [CrossRef] [PubMed]
  48. Dadvand, P.; Rivas, I.; Basagaña, X.; Alvarez-Pedrerol, M.; Su, J.; De Castro Pascual, M.; Amato, F.; Jerret, M.; Querol, X.; Sunyer, J.; et al. The association between greenness and traffic-related air pollution at schools. Sci. Total Environ. 2015, 523, 59–63. [Google Scholar] [CrossRef] [PubMed]
  49. Chang, L.T.C.; Scorgie, Y.; Duc, H.N.; Monk, K.; Fuchs, D.; Trieu, T. Major source contributions to ambient PM2.5 and exposures within the New South Wales greater metropolitan region. Atmosphere 2019, 10, 138. [Google Scholar] [CrossRef] [Green Version]
  50. Hyde, J.C.; Yedinak, K.M.; Talhelm, A.F.; Smith, A.M.S.; Bowman, D.M.J.S.; Johnston, F.H.; Lahm, P.; Fitch, M.; Tinkham, W.T. Air quality policy and fire management response addressing smoke from wildland fires in the United States and Australia. Int. J. Wildland Fire 2017, 26, 347–363. [Google Scholar] [CrossRef] [Green Version]
  51. Banks, J.L.; McConnell, R. National Emissions from Lawn and Garden Equipment. Available online: https://www.epa.gov/sites/production/files/2015-09/documents/banks.pdf (accessed on 10 June 2021).
  52. Gascon, M.; Zijlema, W.; Vert, C.; White, M.P.; Nieuwenhuijsen, M.J. Outdoor blue spaces, human health and well-being: A systematic review of quantitative studies. Int. J. Hyg. Environ. Health 2017, 220, 1207–1221. [Google Scholar] [CrossRef] [PubMed]
  53. Warburton, D.E.R.; Bredin, S.S.D. Health benefits of physical activity: A systematic review of current systematic reviews. Curr. Opin. Cardiol. 2017, 32, 541–556. [Google Scholar] [CrossRef] [PubMed]
  54. Pasanen, T.P.; White, M.P.; Wheeler, B.W.; Garrett, J.K.; Elliott, L.R. Neighbourhood blue space, health and wellbeing: The mediating role of different types of physical activity. Environ. Int. 2019, 131, 105016. [Google Scholar] [CrossRef] [PubMed]
  55. Snyder, A.; Valdebran, M.; Terrero, D.; Amber, K.T.; Kelly, K.M. Solar ultraviolet exposure in individuals who perform outdoor sport activities. Sports Med.-Open 2020, 6, 42. [Google Scholar] [CrossRef]
  56. Hajhashemy, Z.; Shahdadian, F.; Ziaei, R.; Saneei, P. Serum vitamin D levels in relation to abdominal obesity: A systematic review and dose-response meta-analysis of epidemiologic studies. Obes. Rev. 2021, 22, e12124. [Google Scholar] [CrossRef]
  57. Mirhosseini, N.; Vatanparast, H.; Mazidi, M.; Kimball, S.M. The effect of improved serum 25-hydroxyvitamin D status on glycemic control in diabetic patients: A meta-analysis. J. Clin. Endocrinol. Metab. 2017, 102, 3097–3110. [Google Scholar] [CrossRef] [Green Version]
  58. Cerin, E.; Barnett, A.; Zhang, C.J.P.; Lai, P.C.; Sit, C.H.P.; Lee, R.S.Y. How urban densification shapes walking behaviours in older community dwellers: A cross-sectional analysis of potential pathways of influence. Int. J. Health Geogr. 2020, 19, 14. [Google Scholar] [CrossRef]
  59. Cerin, E.; Rainey-Smith, S.R.; Ames, D.; Lautenschlager, N.T.; Macaulay, S.L.; Fowler, C.; Robertson, J.S.; Rowe, C.C.; Maruff, P.; Martins, R.N.; et al. Associations of neighborhood environment with brain imaging outcomes in the Australian Imaging, Biomarkers and Lifestyle cohort. Alzheimer’s Dement. 2017, 13, 388–398. [Google Scholar] [CrossRef]
  60. Riiser, A.; Solbraa, A.; Jenum, A.K.; Birkeland, K.I.; Andersen, L.B. Cycling and walking for transport and their associations with diabetes and risk factors for cardiovascular disease. J. Trans. Health 2018, 11, 193–201. [Google Scholar] [CrossRef]
  61. Zhang, C.J.P.; Barnett, A.; Sit, C.H.P.; Lai, P.C.; Johnston, J.M.; Lee, R.S.Y.; Cerin, E. To what extent does physical activity explain the associations between neighborhood environment and depressive symptoms in older adults living in an Asian metropolis? Ment. Health Phys. Act. 2019, 16, 96–104. [Google Scholar] [CrossRef]
  62. Malambo, P.; Kengne, A.P.; De Villiers, A.; Lambert, E.V.; Puoane, T. Built environment, selected risk factors and major cardiovascular disease outcomes: A systematic review. PLoS ONE 2016, 11, e0166846. [Google Scholar] [CrossRef] [PubMed]
  63. Zhang, K.; Jiang, F.; Luo, H.; Liu, F. Occupational noise exposure and the prevalence of dyslipidemia in a cross-sectional study. BMC Public Health 2021, 21, 1258. [Google Scholar] [CrossRef] [PubMed]
  64. King, G.; Roland-Mieszkowski, M.; Jason, T.; Rainham, D.G. Noise levels associated with urban land use. J. Urban Health 2012, 89, 1017–1030. [Google Scholar] [CrossRef] [PubMed] [Green Version]
  65. Ellis, K.A.; Szoeke, C.; Bush, A.I.; Darby, D.; Graham, P.L.; Lautenschlager, N.T.; Macaulay, S.L.; Martins, R.N.; Maruff, P.; Masters, C.L.; et al. Rates of diagnostic transition and cognitive change at 18-month follow-up among 1112 participants in the Australian Imaging, Biomarkers and Lifestyle Flagship Study of Ageing (AIBL). Int. Psychogeriatr. 2014, 26, 543–554. [Google Scholar] [CrossRef] [PubMed] [Green Version]
Figure 1. A simplified ecological model of neighbourhood environmental influences on cognitive function. Toxics 10 00023 i001 
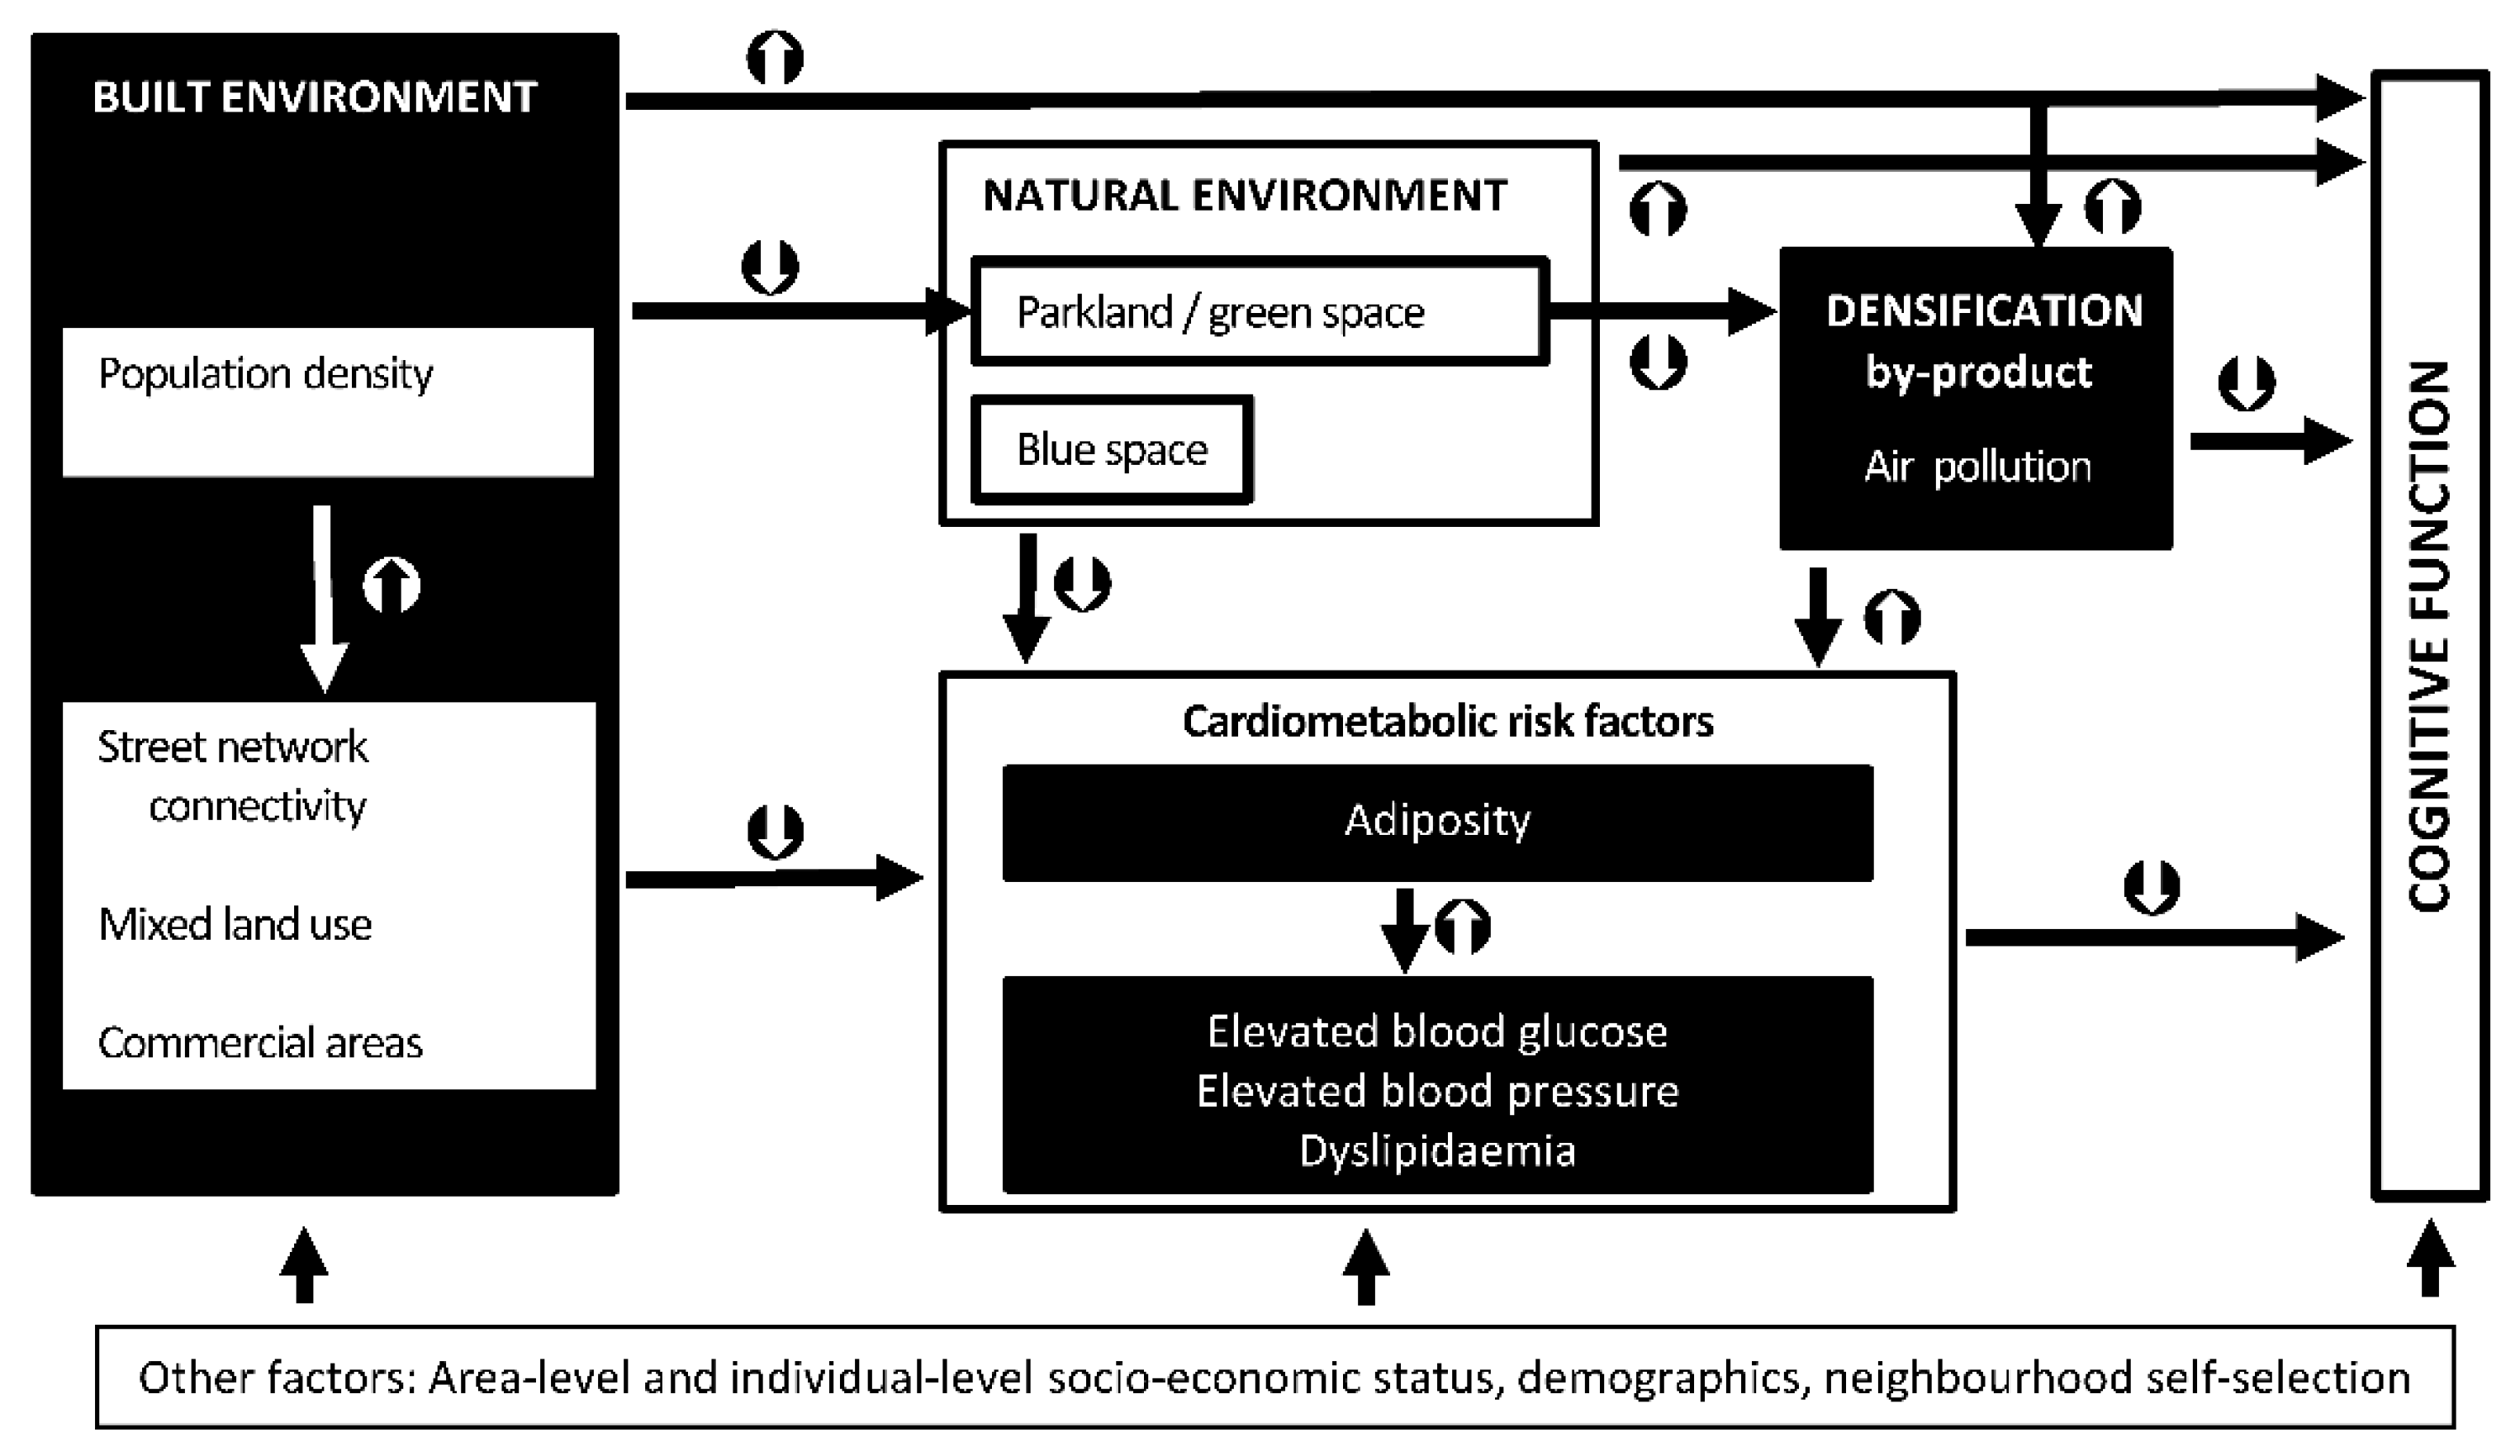
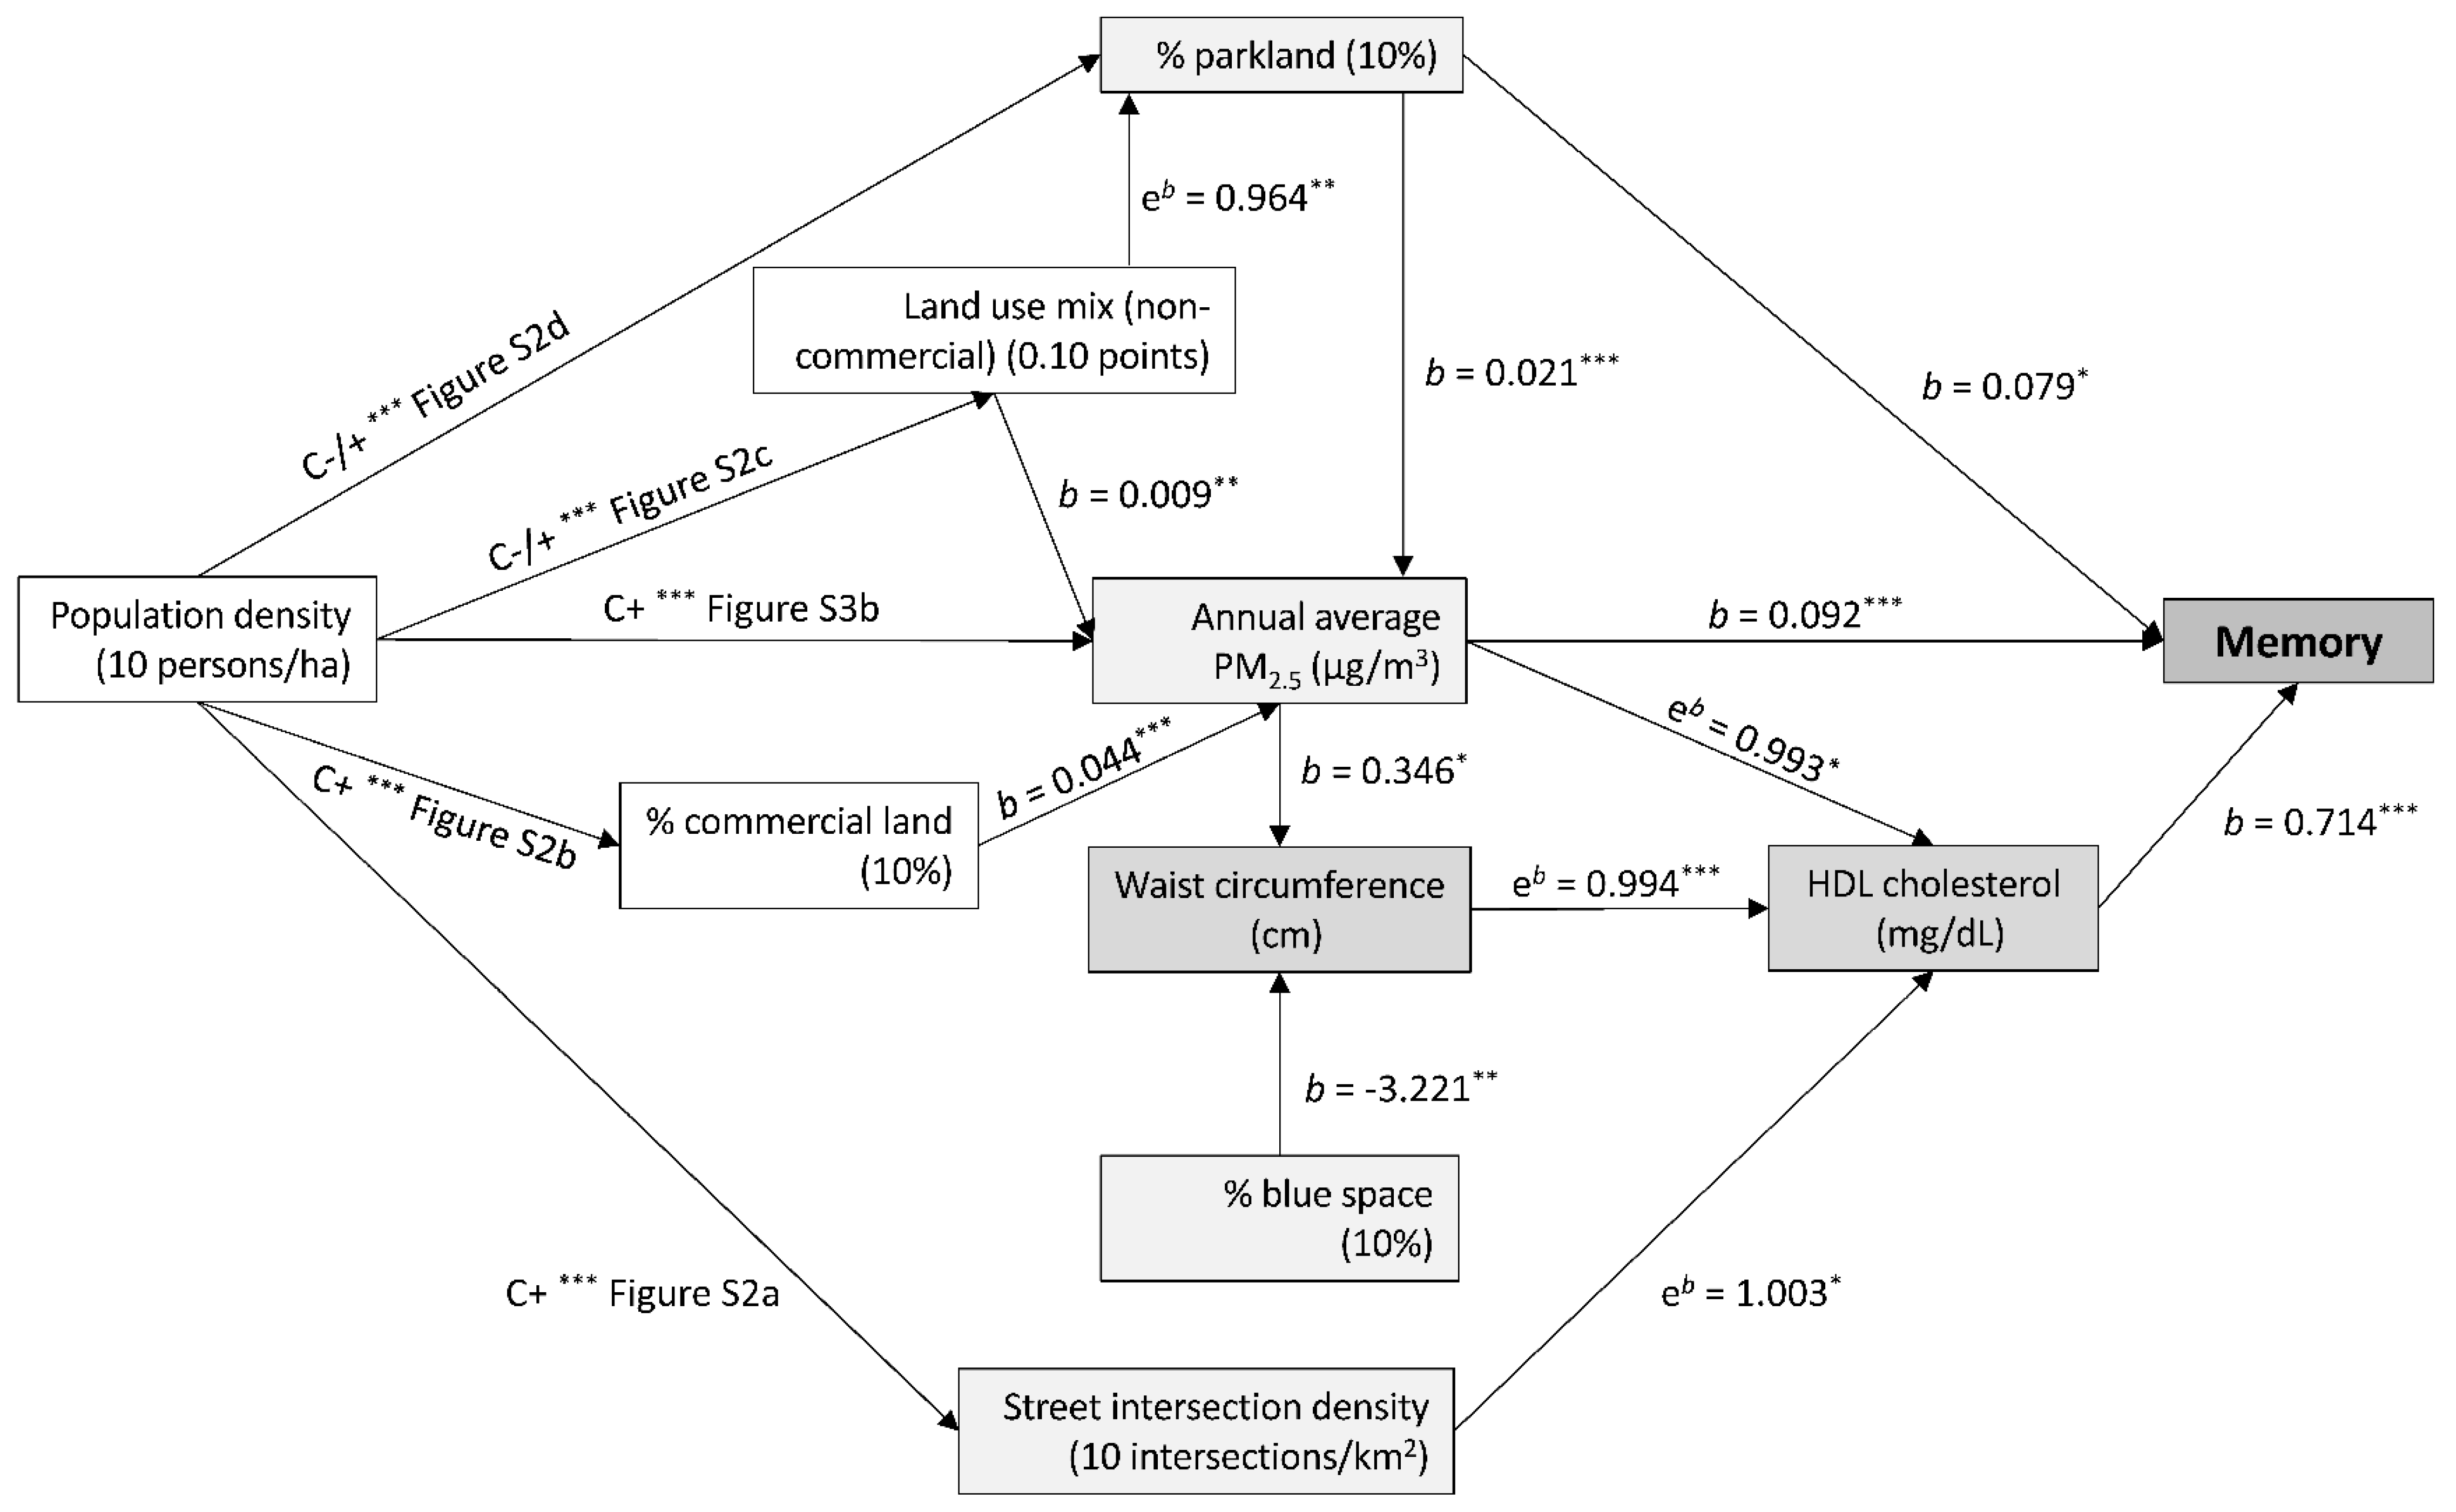
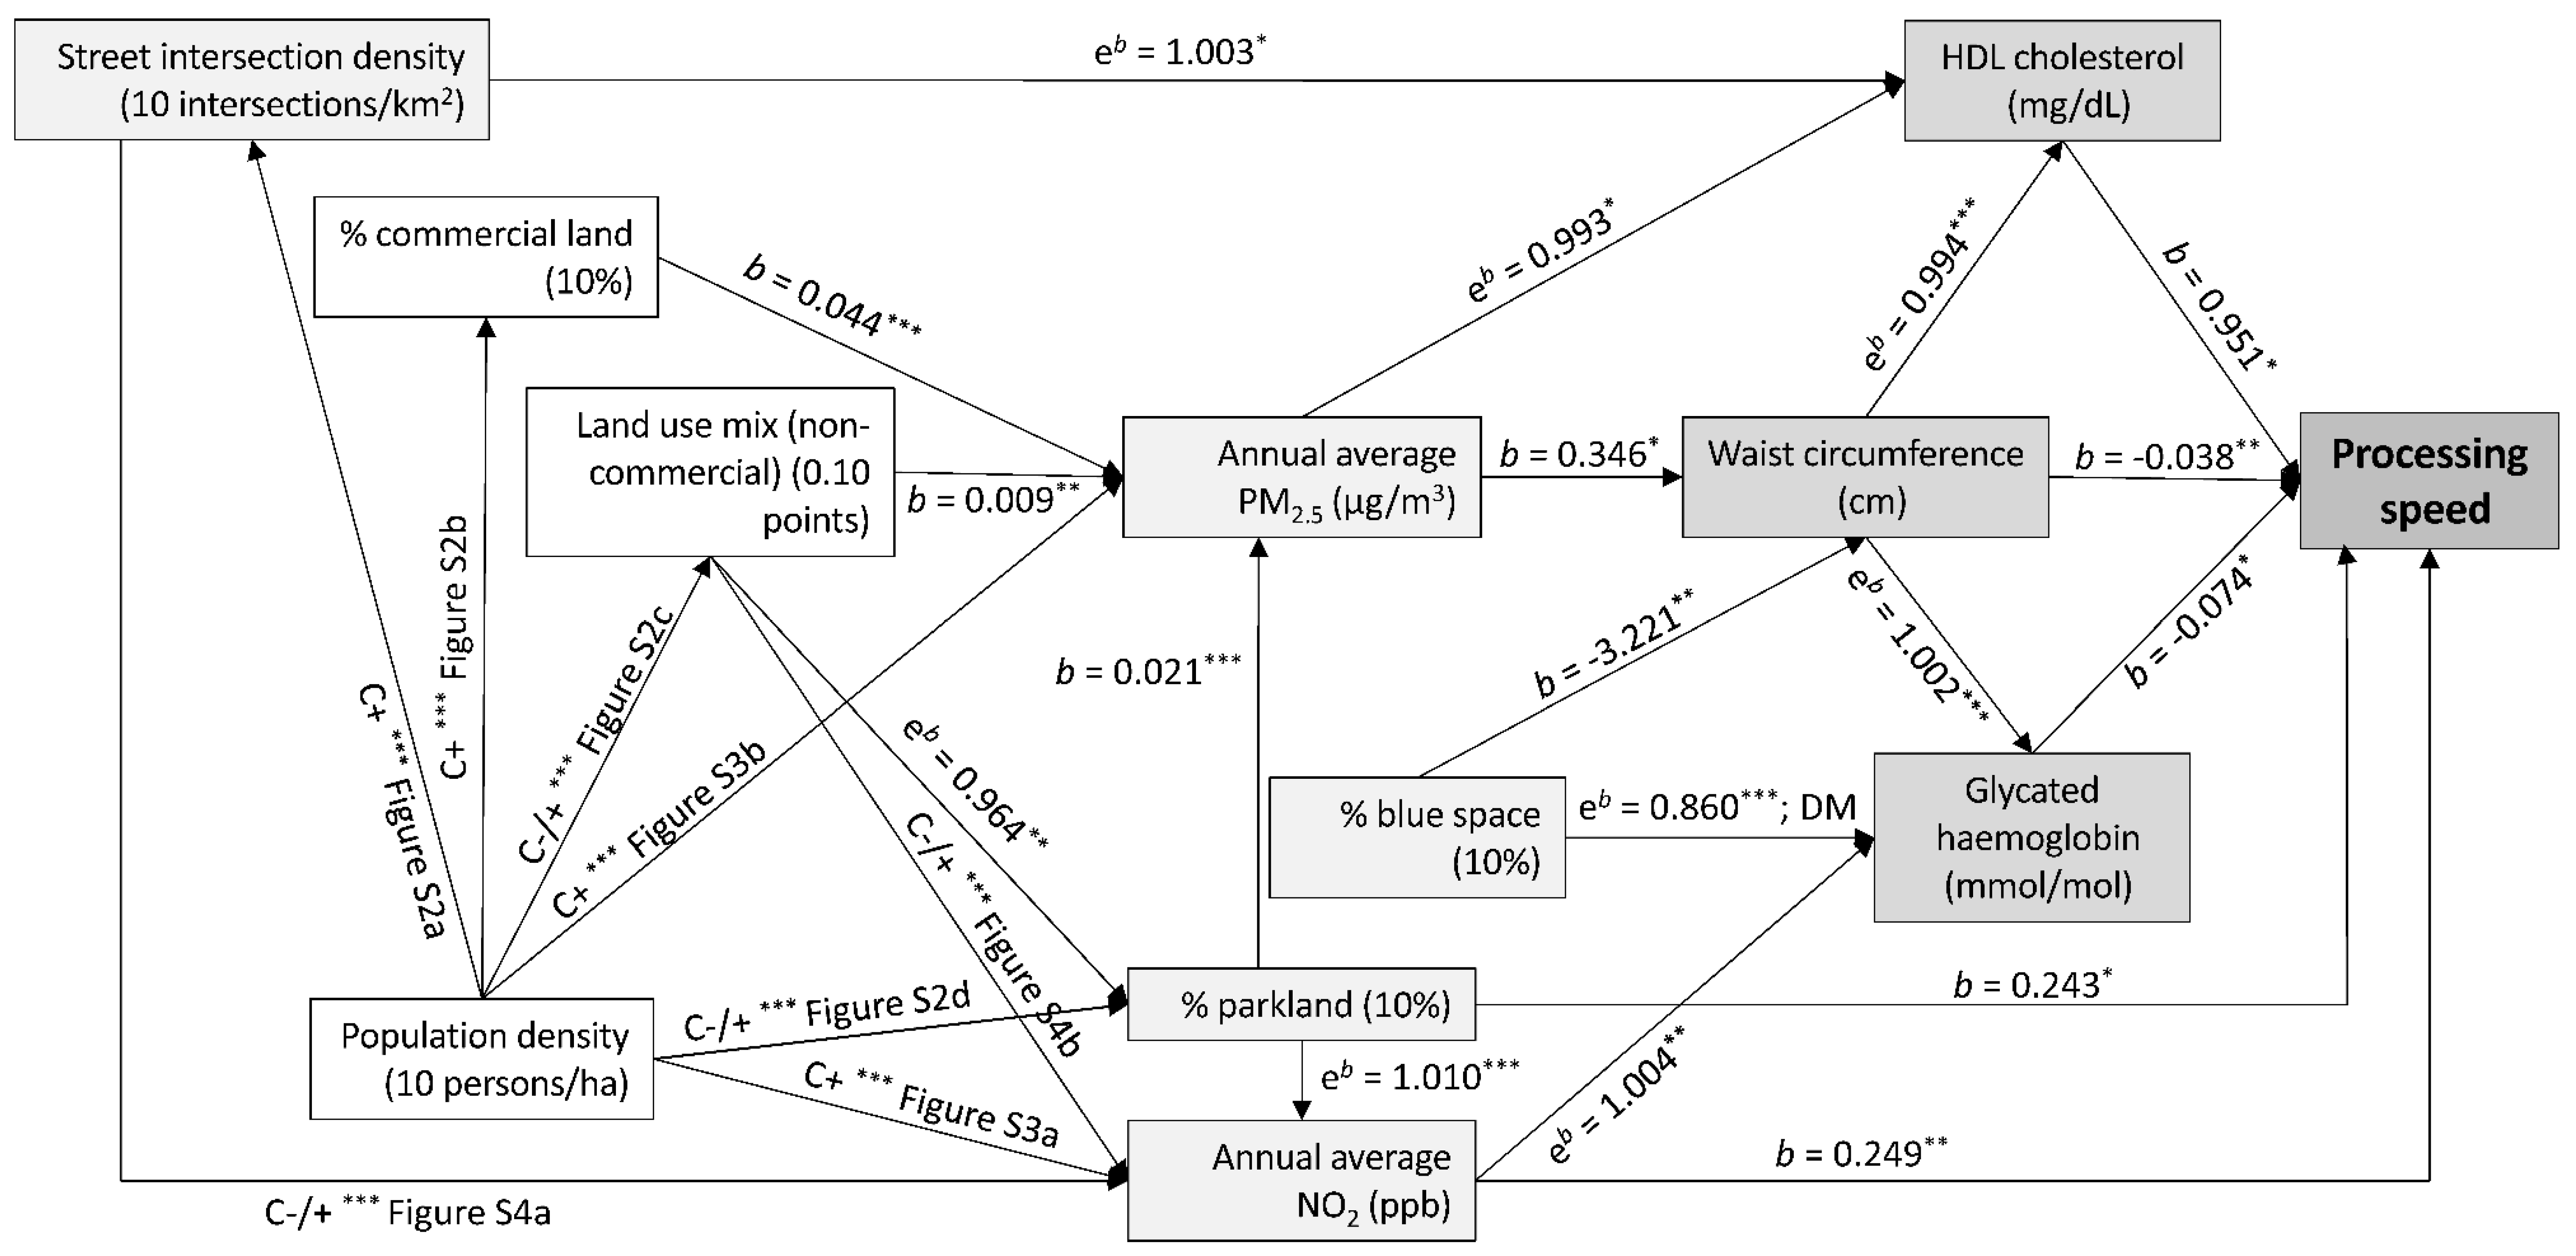
indicate positive associations; Toxics 10 00023 i002 indicate negative associations.
Toxics 10 00023 g001
Figure 2. Effects of neighbourhood environmental characteristics on memory and the mediation roles of cardiovascular risk factors. Arrows linking variables indicate significant associations; b, regression coefficient; eb, exponentiated regression coefficient; ha, hectare; C+, −, +/− = curvilinear positive, negative, non-monotonic association; Figure Sx; the supplementary figure of a curvilinear association. * p < 0.05; ** p < 0.01; *** p < 0.001. Cardiometabolic risk factors are represented by darker grey rectangles; environmental characteristics directly associated with memory or cardiometabolic risk factors are represented by light grey rectangles; environmental attributes indirectly associated with cardiometabolic risk factors through other environmental characteristics are represented by white rectangles. All significant and non-significant associations (regression coefficients and 95% CIs) are presented in the Supplementary Materials (Tables S2–S4). Table S2 also provides the F-ratio of the smooth terms for significant curvilinear associations.
Toxics 10 00023 g002
Figure 3. Effects of neighbourhood environmental characteristics on processing speed and the mediation roles of cardiovascular risk factors. Arrows linking variables indicate significant associations; b, regression coefficient; eb, exponentiated regression coefficient; ha, hectare; C+, −, +/− = curvilinear positive, negative, non-monotonic association; Figure Sx; supplementary figure of a curvilinear association. * p < 0.05; ** p < 0.01; *** p < 0.001. Cardiometabolic risk factors are represented by darker grey rectangles; environmental characteristics directly associated with memory or cardiometabolic risk factors are represented by light grey rectangles; environmental attributes indirectly associated with cardiometabolic risk factors through other environmental characteristics are represented by white rectangles. All significant and non-significant associations (regression coefficients and 95% CIs) are presented in the Supplementary Materials (Tables S2–S4). Table S2 also provides the F-ratio of the smooth terms for significant curvilinear associations.
Toxics 10 00023 g003
Table 1. Sample characteristics (N = 4141).
CharacteristicsStatisticsCharacteristicsStatistics
Socio-demographic characteristics
Age (years), M ± SD61.1 ± 11.4Sex, female, %55.2
Educational attainment, % Employment status, %
Up to secondary32.7Not employed30.4
Trade, associate diploma 43.6Paid employment52.2
Bachelor degree, postgraduate23.1Volunteering15.1
Missing data0.6Missing data2.3
Living arrangements, % Household income (annual), %
Couple without children48.2Up to $49,99932.9
Couple with children26.8$50,000–$99,99926.8
Other22.4$100,000 and over28.9
Missing data2.4Missing data11.5
Area-level IRSAD, M ± SD6.4 ± 2.7English-speaking background, %89.9
Residential self-selection—access to destinations, M ± SD3.0 ± 1.4Residential self-selection—recreational facilities, M ± SD3.1 ± 1.5
Missing data, %7.8Missing data, %7.8
Cardiometabolic risk factors and other health-related variables
Heart problems/stroke history, %8.7Tobacco-smoking status, %
Missing data, %1.0Current smoker7.0
LDL cholesterol, mg/dL, M ± SD3.0 ± 0.9Previous smoker35.9
Missing data, %1.4Non-smoker54.5
HDL cholesterol, mg/dL, M ± SD1.5 ± 0.4Missing data2.6
Missing data, %0.3Waist circumference (cm), M ± SD94.6 ± 14.2
Triglycerides, mg/dL, M ± SD1.3 ± 0.9Missing data, %0.2
Missing data, %0.3
Glycated haemoglobin (HbA1C), mmol/mol, M ± SD39.9 ± 6.3Mean arterial pressure, mmHg, M ± SD92.0 ± 12.3
Missing data, %0.5Missing data, %0.2
Diabetes medication, %6.3Anti-hypertensive medication, %32.0
Missing data, %1.8Missing data, %1.8
Lipid-lowering medication, %24.5
Missing data, %1.8
Cognitive function, M ± SD
Memory, CVLT score6.5 ± 2.4Processing speed, SDMT score49.7 ± 11.6
Missing data, %2.3Missing data, %2.0
Neighbourhood environmental characteristics (1 km-radius street-network buffers), M ± SD
Population density, persons/ha17.4 ± 10.0Street intersection density, intersections/km262.2 ± 32.2
Percentage of commercial land use in residential buffer2.5 ± 6.1Non-commercial land use mix, entropy score (0 to 1)0.14 ± 0.13
Percentage of parkland in residential buffer11.6 ± 12.5Percentage of blue space (waterbody) in residential buffer0.24 ± 1.98
NO2, ppb5.5 ± 2.1PM2.5, μg/m36.3 ± 1.7
Notes. M, mean; SD, standard deviation; IRSAD, Index of Relative Socioeconomic Advantage and Disadvantage; LDL, low-density lipoprotein; HDL, high-density lipoprotein; CVLT, California Verbal Learning Test; SDMT, Symbol–Digit Modalities Test; NO2, nitrogen dioxide; PM2.5, particulate matter <2.5 µm.
Table 2. Total effects of neighbourhood environmental characteristics on cardiometabolic risk factors.
Environmental Characteristic (Units)Waist Circumference (cm)HDL Cholesterol (mg/dL)LDL Cholesterol (mg/dL)Triglycerides (mg/dL)Glycated Haemoglobin (mmol/mol)Mean Arterial Pressure (mmHg)
b (95% CI)eb (95% CI)b (95% CI)eb (95% CI)eb (95% CI)b (95% CI)
Population density−0.1630.998−0.0110.9921.0060.659
(10 persons/ha)(−0.646, 0.320)(0.989, 1.008)(−0.037, 0.014)(0.972, 1.012)(1.002, 1.010)(−1.083, −0.234)
Street intersection density0.1451.0010.0101.0121.0000.706
(10 intersections/km2)(−0.035, 0.326)(0.998, 1.005)(0.001, 0.019)(1.004, 1.019)(0.999, 1.002)(0.553, 0.859)
Percentage of commercial land0.2700.986−0.0101.0260.9980.761
(10%)(−0.504, 1.044)(0.972, 1.001)(−0.051, 0.031)(0.993, 1.060)(0.991, 1.004)(0.086, 1.435)
Non-commercial land use mix0.3770.9900.0141.0151.0020.761
(0.10 score)(−0.004, 0.770)(0.983, 0.997)(−0.006, 0.034)(1.000, 1.031)(0.999, 1.006)(0.424, 1.098)
Percentage of parkland−0.3140.996−0.0211.0031.001−0.303
(10%)(−0.714, 0.087)(0.989, 1.004)(−0.041, −0.001)(0.987, 1.019)(0.997, 1.004)(−0.660, 0.053)
Percentage of blue space−3.2371.041−0.0760.9720.989 *−1.566
(10%)(−5.461, −1.013)(1.003, 1.088)(−0.197, 0.045)(0.882, 1.070)(0.971, 1.006)(−3.477, 0.346)
NO20.0660.999−0.0021.0001.003−0.381
(ppb)(−0.242, 0.373)(0.993, 1.006)(−0.018, 0.015)(0.988, 1.013)(1.000, 1.006)(−0.647, −0.115)
PM2.50.3720.9940.0261.0081.001Curvilinear (see Figure S5)
(μg/m3)(0.064, 0.681)(0.990, 0.999)(0.006, 0.047)(0.996, 1.021)(0.998, 1.006)
Notes. b, regression coefficient; eb, exponentiated regression coefficient; CI, confidence intervals; * effect moderated by diabetes medication. Effects in bold are statistically significant at a probability level of 0.05. Details on regression models, including confounders, are in the Supplementary material (Table S1).
Publisher’s Note: MDPI stays neutral with regard to jurisdictional claims in published maps and institutional affiliations.

