
Metals Bioaccumulation in 15 Commonly Consumed Fishes from the Lower Meghna River and Adjacent Areas of Bangladesh and Associated Human Health Hazards

 , , and
Abstract
:1. Introduction
2. Materials and Methods
2.1. Sample Collection, Preparation and Analysis
2.2. Analytical Quality Control
2.3. Human Health Risk Assessment of Heavy Metals
2.3.1. Metal Pollution Index (MPI)
2.3.2. Estimated Daily Intake (EDI)
2.3.3. Target Hazard Quotient (THQ) for Non-Carcinogenic Risk Assessment
2.3.4. Hazard Index (HI)
2.3.5. Carcinogenic Risk (CR)
2.4. Statistical Analysis
3. Results and Discussion
3.1. The Concentration of Heavy Metals in Fish Muscle Tissue
3.2. Metal Pollution Index (MPI)
3.3. Human Health Risk Assessment
3.3.1. Estimated Daily Intake (EDI)

| Elements | Mean Concentration (mg/kg) | EDI (mg/Day/Person) | Recommended Daily Dietary Allowance (mg/Day/Person) | References | |
|---|---|---|---|---|---|
| Adult | Child | ||||
| Pb | 0.521 | 0.0004 | 0.0018 | 0.25 | [63] |
| Cr | 7.336 | 0.0058 | 0.0257 | 0.23 | [63] |
| Cu | 36.438 | 0.0289 | 0.1257 | 35 | [63] |
| Zn | 113.326 | 0.0899 | 0.3966 | 18–60 a | [97] |
| Mn | 6.637 | 0.0053 | 0.0232 | 2–5 b | [98] |
| Fe | 162.198 | 0.1285 | 0.5677 | 13.6 | [63] |
| Hg | 1.657 | 0.0013 | 0.0058 | 0.03 | [68] |
| Ni | 1.467 | 0.0012 | 0.0051 | 0.3 c | [99] |
3.3.2. THQ and HI
| Species | THQ (Cr) | THQ (Fe) | THQ (Cu) | THQ (Pb) | HI | |||||
|---|---|---|---|---|---|---|---|---|---|---|
| RfD: 0.003 * | RfD: 0.7 ** | RfD: 0.3 * | RfD: 0.002 * | |||||||
| Adult | Child | Adult | Child | Adult | Child | Adult | Child | Adult | Child | |
| Tilapia | 5.75 × 10⁻² | 2.54 × 10⁻¹ | 1.69 × 10⁻⁴ | 7.46 × 10⁻⁴ | 9.55 × 10⁻⁵ | 4.22 × 10⁻⁴ | 1.68 × 10⁻⁴ | 7.44 × 10⁻⁴ | 5.80 × 10⁻² | 2.56 × 10⁻¹ |
| Koi | 2.08 × 10⁻³ | 9.17 × 10⁻³ | 1.66 × 10⁻⁴ | 7.34 × 10⁻⁴ | 8.59 × 10⁻⁵ | 3.79 × 10⁻⁴ | 2.69 × 10⁻⁴ | 1.19 × 10⁻³ | 2.6 × 10⁻³ | 1.15 × 10⁻² |
| Catla | - | - | 1.91 × 10⁻⁴ | 8.44 × 10⁻⁴ | 8.96 × 10⁻⁵ | 3.96 × 10⁻⁴ | 2.26 × 10⁻⁴ | 9.97 × 10⁻⁴ | 5.06 × 10⁻⁴ | 2.24 × 10⁻³ |
| Rui | - | - | 1.67 × 10⁻⁴ | 7.38 × 10⁻⁴ | 8.85 × 10⁻⁵ | 3.79 × 10⁻⁴ | 2.40 × 10⁻⁴ | 1.06 × 10⁻³ | 4.95 × 10⁻⁴ | 2.17 × 10⁻³ |
| Grass carp | 2.03 × 10⁻³ | 8.97 × 10⁻³ | 2.32 × 10⁻⁴ | 1.02 × 10⁻³ | 1.28 × 10⁻⁴ | 1.21 × 10⁻⁴ | 2.10 × 10⁻⁴ | 9.28 × 10⁻⁴ | 2.6 × 10⁻³ | 1.1 × 10⁻² |
| Bighead carp | 1.56 × 10⁻³ | 6.89 × 10⁻³ | 2.36 × 10⁻⁴ | 1.04 × 10⁻³ | 8.81 × 10⁻⁵ | 5.55 × 10⁻⁴ | 2.42 × 10⁻⁴ | 1.07 × 10⁻³ | 2.13 × 10⁻³ | 9.55 × 10⁻³ |
| Kalibaus | - | - | 1.69 × 10⁻⁴ | 7.46 × 10⁻⁴ | 9.98 × 10⁻⁵ | 4.41 × 10⁻⁴ | 2.12 × 10⁻⁴ | 9.37 × 10⁻⁴ | 4.81 × 10⁻⁴ | 2.12 × 10⁻³ |
| Bata | 1.58 × 10⁻³ | 6.99 × 10⁻³ | 1.77 × 10⁻⁴ | 7.83 × 10⁻⁴ | 9.40 × 10⁻⁵ | 4.15 × 10⁻⁴ | 2.51 × 10⁻⁴ | 1.11 × 10⁻³ | 5.22 × 10⁻⁴ | 9.29 × 10⁻³ |
| Pabda | - | - | 1.68 × 10⁻⁴ | 7.43 × 10⁻⁴ | 8.36 × 10⁻⁵ | 3.69 × 10⁻⁴ | 2.10 × 10⁻⁴ | 9.27 × 10⁻⁴ | 4.62 × 10⁻⁴ | 2.04 × 10⁻³ |
| Poa | 2.56 × 10⁻³ | 1.13 × 10⁻² | 2.01 × 10⁻⁴ | 8.87 × 10⁻⁴ | 8.01 × 10⁻⁵ | 3.53 × 10⁻⁴ | 1.50 × 10⁻⁴ | 6.61 × 10⁻⁴ | 2.99 × 10⁻³ | 1.32 × 10⁻² |
| Chiring | 1.94 × 10⁻³ | 8.57 × 10⁻³ | 1.71 × 10⁻⁴ | 7.56 × 10⁻⁴ | 2.24 × 10⁻⁴ | 5.48 × 10⁻⁴ | 2.57 × 10⁻⁴ | 1.13 × 10⁻³ | 2.49 × 10⁻³ | 1.1 × 10⁻² |
| Ricksha | 1.91 × 10⁻³ | 8.44 × 10⁻³ | 2.13 × 10⁻⁴ | 9.41 × 10⁻⁴ | 8.97 × 10⁻⁵ | 3.96 × 10⁻⁴ | 1.90 × 10⁻⁴ | 8.41 × 10⁻⁴ | 2.41 × 10⁻³ | 1.12 × 10⁻² |
| Gulia | - | - | 1.71 × 10⁻⁴ | 7.54 × 10⁻⁴ | 1.23 × 10⁻⁴ | 5.43 × 10⁻⁴ | 2.25 × 10⁻⁴ | 9.94 × 10⁻⁴ | 5.19 × 10⁻⁴ | 2.29 × 10⁻³ |
| Loitta | - | - | 1.69 × 10⁻⁴ | 7.44 × 10⁻⁴ | 9.36 × 10⁻⁵ | 4.13 × 10⁻⁴ | 8.01 × 10⁻⁵ | 3.54 × 10⁻⁴ | 1.18 × 10⁻³ | 1.14 × 10⁻³ |
| Koral | 2.34 × 10⁻³ | 1.03 × 10⁻² | 1.54 × 10⁻⁴ | 6.78 × 10⁻⁴ | 8.31 × 10⁻⁵ | 3.67 × 10⁻⁴ | 1.74 × 10⁻⁴ | 7.66 × 10⁻⁴ | 2.75 × 10⁻³ | 1.21 × 10⁻² |
| Mean | 8.17 × 10⁻³ | 3.61 × 10⁻² | 1.84 × 10⁻⁴ | 8.10 × 10⁻⁴ | 1.03 × 10⁻⁴ | 4.06 × 10⁻⁴ | 2.07 × 10⁻⁴ | 9.14 × 10⁻⁴ | ||
3.3.3. Carcinogenic Risk (CR) Assessment
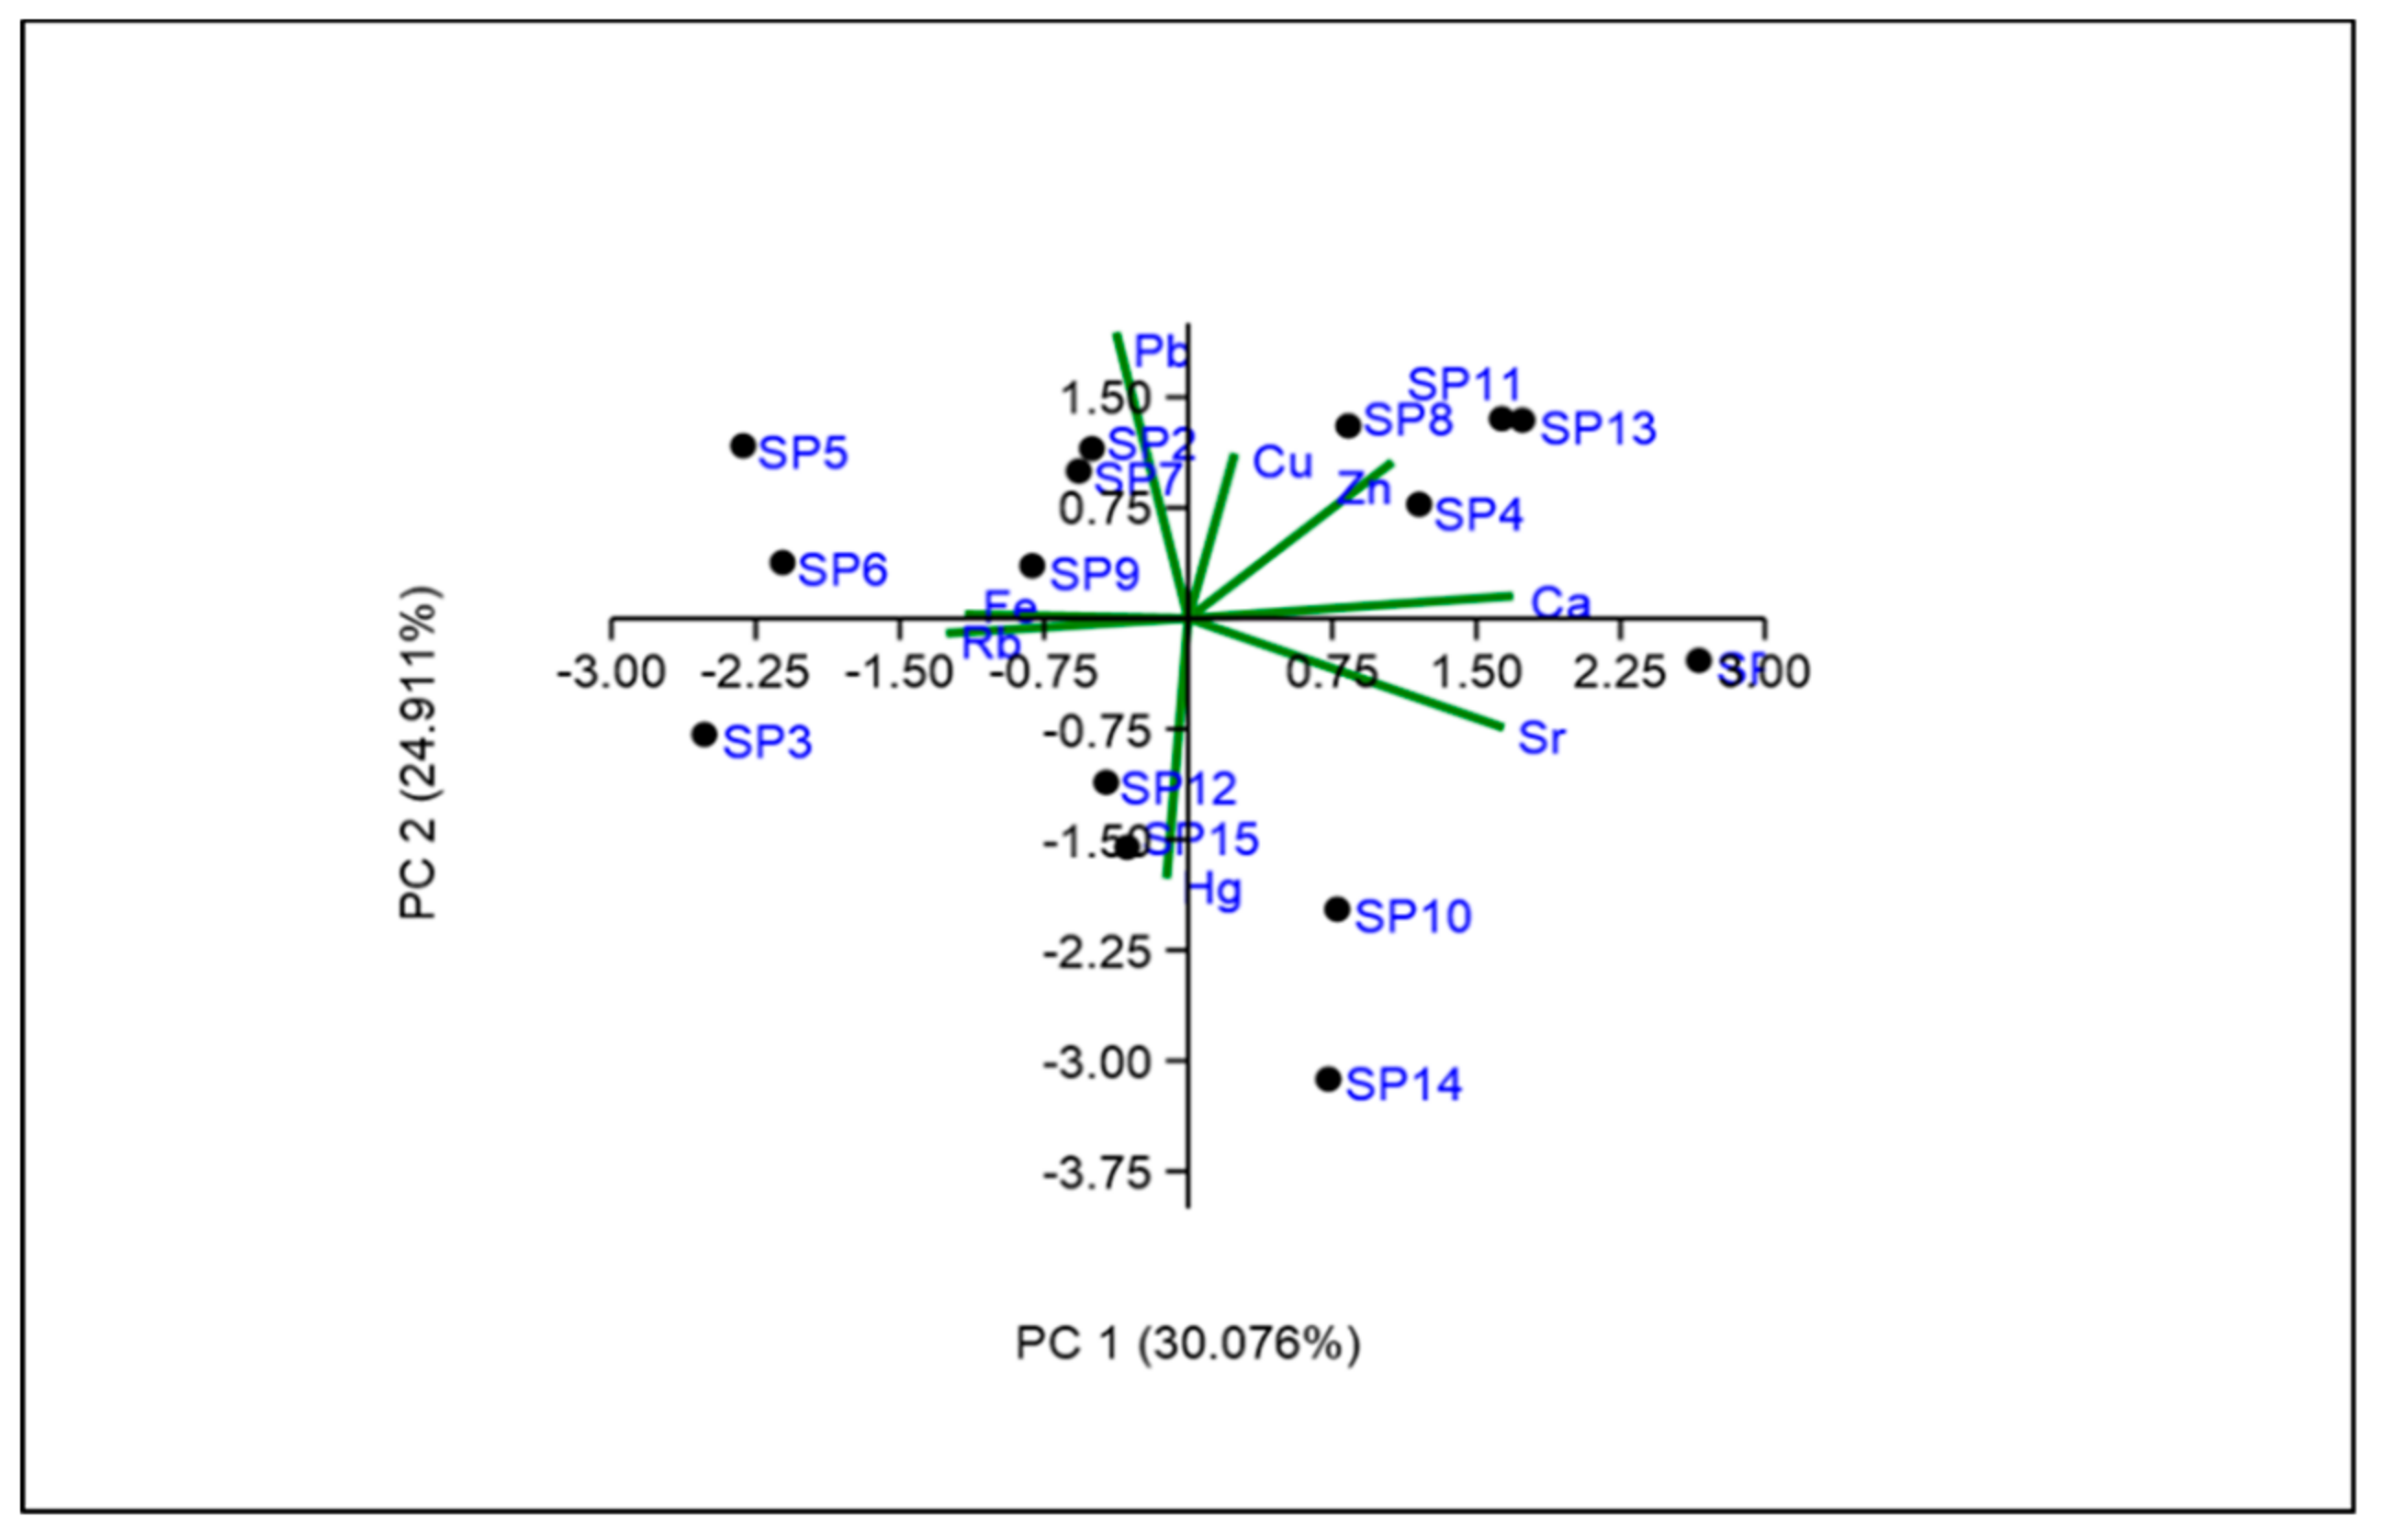
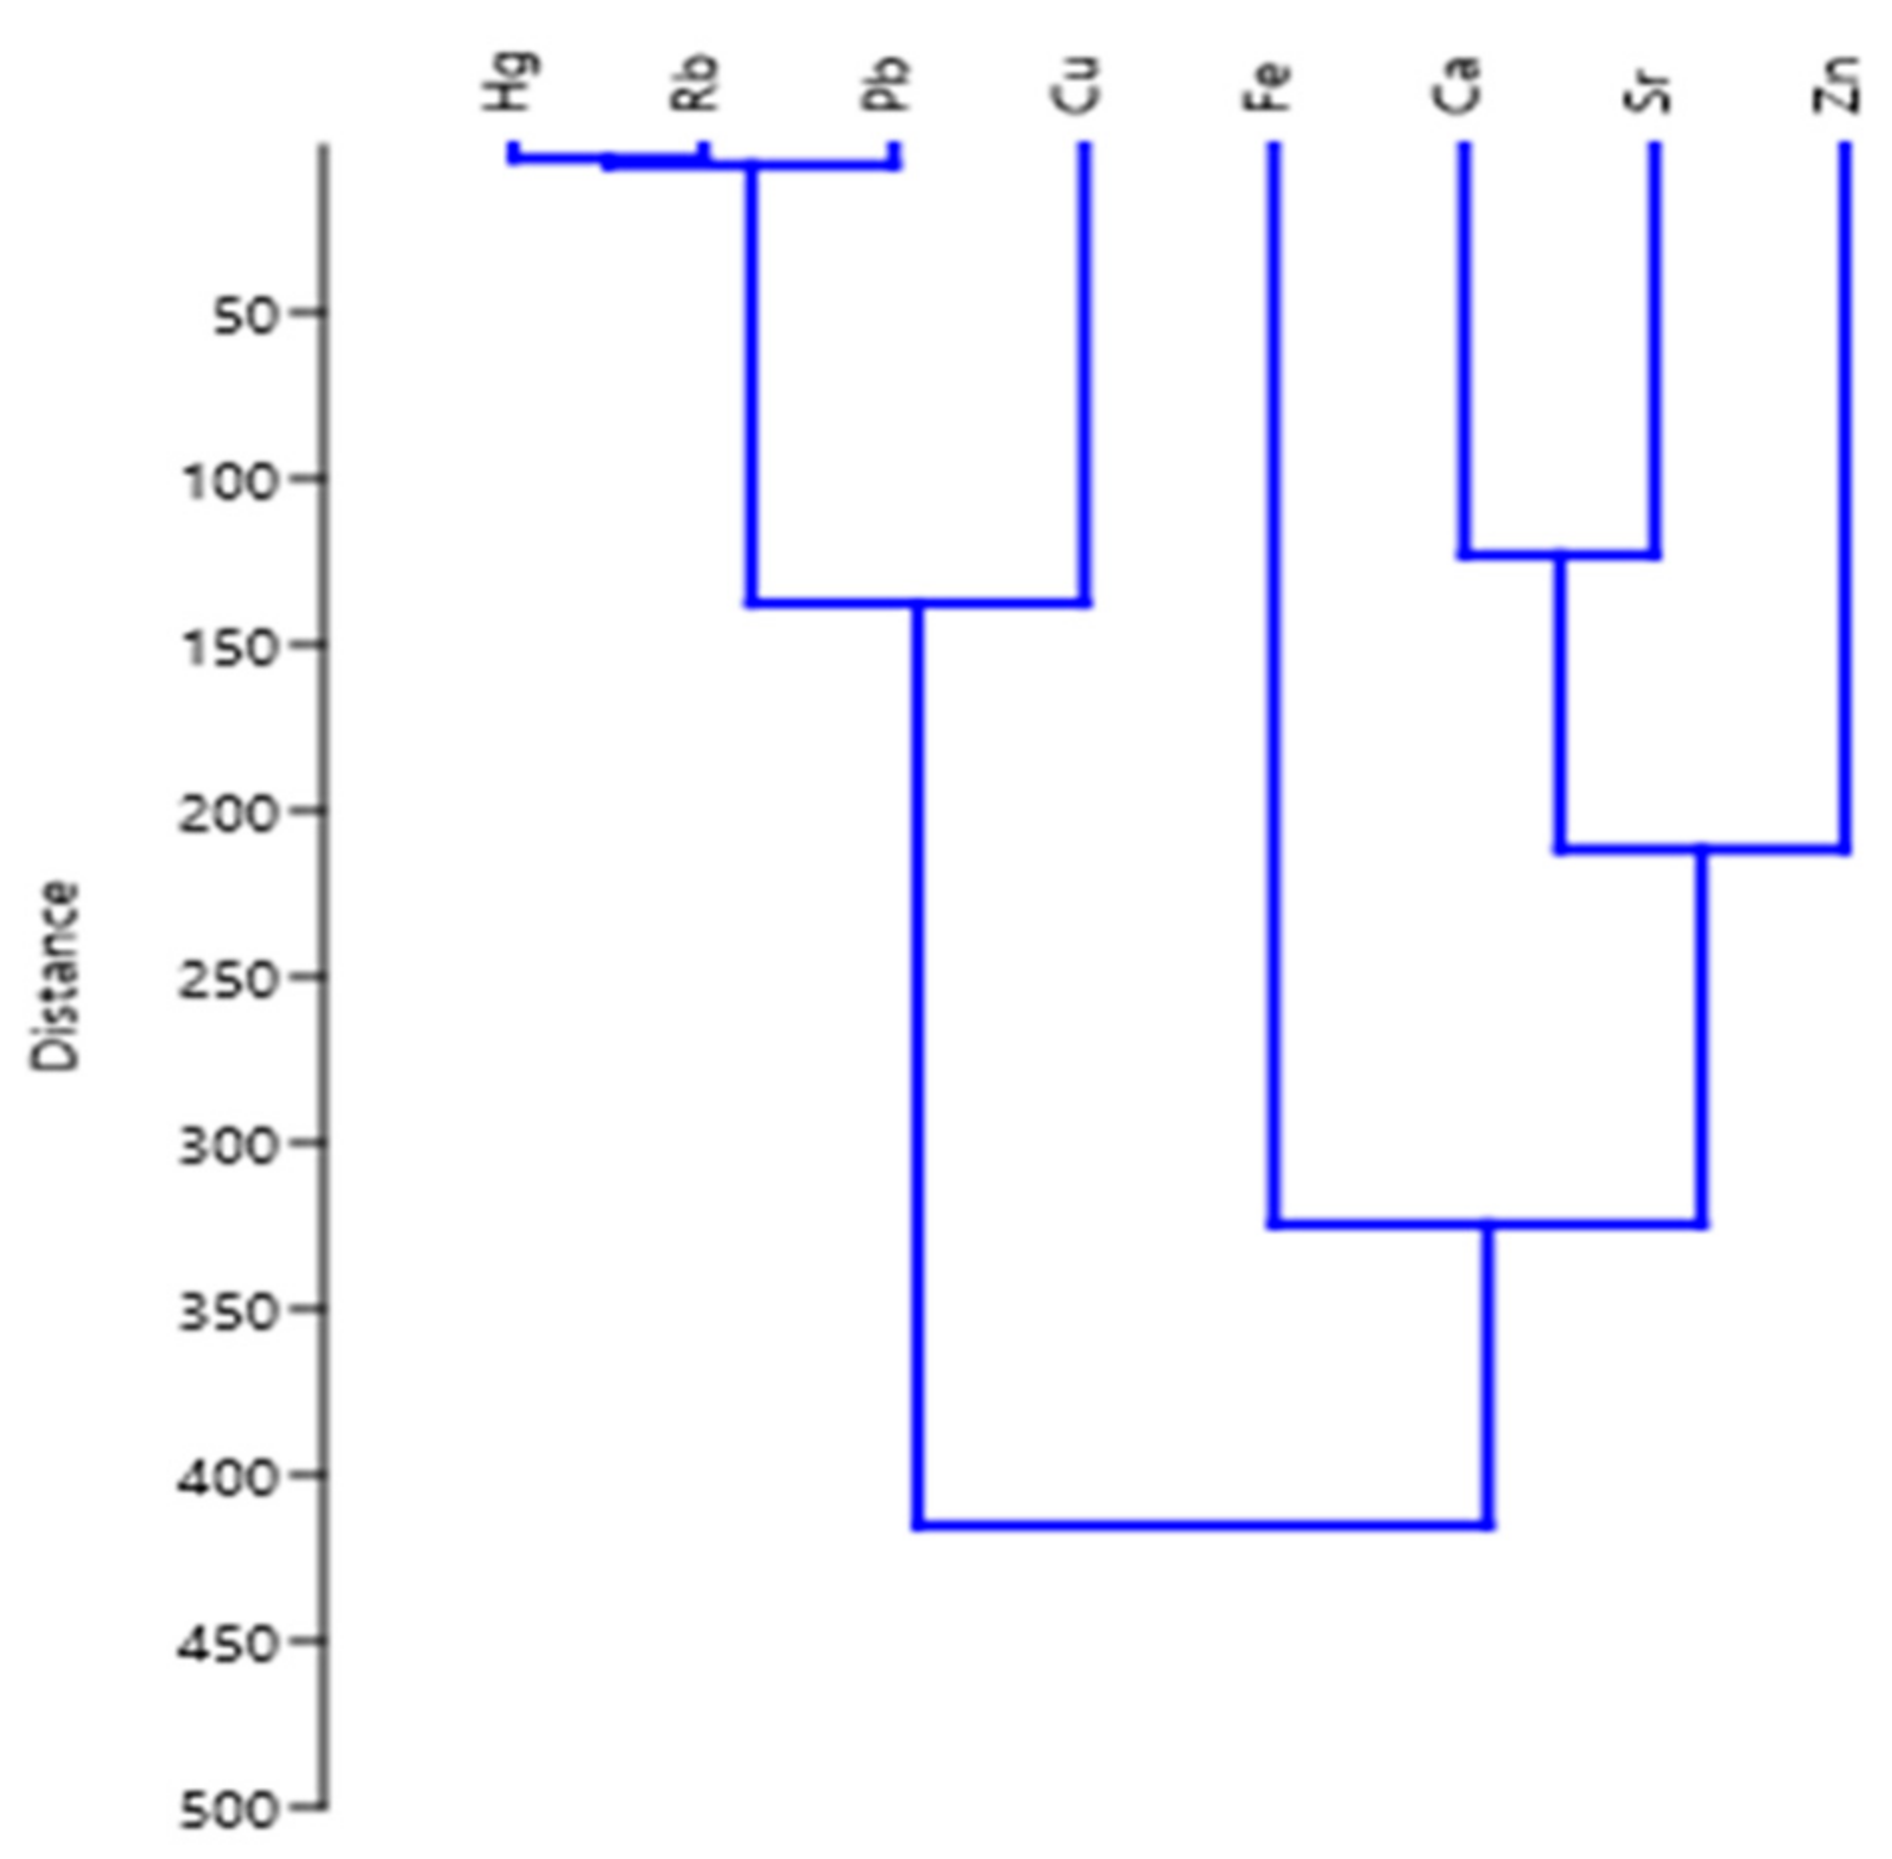
3.4. Source Identification
4. Conclusions
Author Contributions
Funding
Institutional Review Board Statement
Informed Consent Statement
Data Availability Statement
Conflicts of Interest
References
- Miri, M.; Akbari, E.; Amrane, A.; Jafari, S.J.; Eslami, H.; Hoseinzadeh, E.; Zarrabi, M.; Salimi, J.; Sayyad-Arbabi, M.; Taghavi, M. Health risk assessment of heavy metal intake due to fish consumption in the Sistan region, Iran. Environ. Monit. Assess. 2017, 189, 583. [Google Scholar] [CrossRef] [PubMed]
- Okogwu, O.I.; Nwonumara, G.N.; Okoh, F.A. Evaluating heavy metals pollution and exposure risk through the consumption of four commercially important fish species and water from Cross River ecosystem, Nigeria. Bull. Environ. Contam. Toxicol. 2019, 102, 867–872. [Google Scholar] [CrossRef] [PubMed]
- Igwemmar, N.; Kolawole, S.; Odunoku, S. Heavy metal concentration in fish species sold in Gwagwalada market, Abuja. Int. J. Sci. Res. 2013, 2, 7–9. [Google Scholar]
- Gu, Y.-G.; Lin, Q.; Wang, X.-H.; Du, F.-Y.; Yu, Z.-L.; Huang, H.-H. Heavy metal concentrations in wild fishes captured from the South China Sea and associated health risks. Mar. Pollut. Bull. 2015, 96, 508–512. [Google Scholar] [CrossRef] [PubMed]
- Makedonski, L.; Peycheva, K.; Stancheva, M. Determination of heavy metals in selected black sea fish species. Food Control 2017, 72, 313–318. [Google Scholar] [CrossRef]
- Demirak, A.; Yilmaz, F.; Tuna, A.L.; Ozdemir, N. Heavy metals in water, sediment and tissues of Leuciscus cephalus from a stream in southwestern Turkey. Chemosphere 2006, 63, 1451–1458. [Google Scholar] [CrossRef]
- Zazouli, M.A.; Yousefi, Z.; Taghavi, M.; Akbari-adergani, B.; Yazdani Cherati, J. Removing cadmium from aqueous environments using L-cysteine functionalized single-walled carbon nanotubes. J. Maz. Univ. Med. Sci. 2013, 23, 37–47. [Google Scholar]
- Yi, Y.; Yang, Z.; Zhang, S. Ecological risk assessment of heavy metals in sediment and human health risk assessment of heavy metals in fishes in the middle and lower reaches of the Yangtze River basin. Environ. Pollut. 2011, 159, 2575–2585. [Google Scholar] [CrossRef]
- Rahman, M.; Molla, A.; Arafat, S. Status of pollution around Dhaka export processing zone and its impact on Bangshi River water. Bangladesh J. Nat. Sci. Sustain. Technol. 2010, 4, 91–110. [Google Scholar]
- Ebrahimpour, M.; Pourkhabbaz, A.; Baramaki, R.; Babaei, H.; Rezaei, M. Bioaccumulation of heavy metals in freshwater fish species, Anzali, Iran. Bull. Environ. Contam. Toxicol. 2011, 87, 386. [Google Scholar] [CrossRef]
- Saha, N.; Zaman, M. Concentration of selected toxic metals in groundwater and some cereals grown in Shibganj area of Chapai Nawabganj, Rajshahi, Bangladesh. Curr. Sci. 2011, 101, 427–431. [Google Scholar]
- Chen, C.; Qian, Y.; Chen, Q.; Li, C. Assessment of daily intake of toxic elements due to consumption of vegetables, fruits, meat, and seafood by inhabitants of Xiamen, China. J. Food Sci. 2011, 76, T181–T188. [Google Scholar] [CrossRef] [PubMed]
- Sarker, M.; Islam, M.; Rahman, F.; Anisuzzaman, M. Heavy Metals in the Fish Tenualosa ilisha Hamilton, 1822 in the Padma–Meghna River Confluence: Potential Risks to Public Health. Toxics 2021, 9, 341. [Google Scholar] [CrossRef] [PubMed]
- Łuczyńska, J.; Paszczyk, B.; Łuczyński, M.J.; Kowalska-Góralska, M.; Nowosad, J.; Kucharczyk, D. Using Rutilus rutilus (L.) and Perca fluviatilis (L.) as bioindicators of the environmental condition and human health: Lake Łańskie, Poland. Int. J. Environ. Res. Public Health 2020, 17, 7595. [Google Scholar] [CrossRef]
- Djedjibegovic, J.; Marjanovic, A.; Tahirovic, D.; Caklovica, K.; Turalic, A.; Lugusic, A.; Omeragic, E.; Sober, M.; Caklovica, F. Heavy metals in commercial fish and seafood products and risk assessment in adult population in Bosnia and Herzegovina. Sci. Rep. 2020, 10, 13238. [Google Scholar] [CrossRef]
- Parida, S.; Barik, S.; Mohanty, B.; Muduli, P.; Mohanty, S.; Samanta, S.; Pattanaik, A. Trace metal concentrations in euryhaline fish species from Chilika lagoon: Human health risk assessment. Int. J. Environ. Sci. Technol. 2017, 14, 2649–2660. [Google Scholar] [CrossRef]
- Kris-Etherton, P.M.; Harris, W.S.; Appel, L.J. Fish consumption, fish oil, omega-3 fatty acids, and cardiovascular disease. Circulation 2002, 106, 2747–2757. [Google Scholar] [CrossRef]
- Alipour, H.; Pourkhabbaz, A.; Hassanpour, M. Estimation of potential health risks for some metallic elements by consumption of fish. Water Qual. Expo. Health 2015, 7, 179–185. [Google Scholar] [CrossRef]
- Yılmaz, F.; Özdemir, N.; Demirak, A.; Tuna, A.L. Heavy metal levels in two fish species Leuciscus cephalus and Lepomis gibbosus. Food Chem. 2007, 100, 830–835. [Google Scholar] [CrossRef]
- Zhao, S.; Feng, C.; Quan, W.; Chen, X.; Niu, J.; Shen, Z. Role of living environments in the accumulation characteristics of heavy metals in fishes and crabs in the Yangtze River Estuary, China. Mar. Pollut. Bull. 2012, 64, 1163–1171. [Google Scholar] [CrossRef]
- Uysal, K.; Köse, E.; Bülbül, M.; Dönmez, M.; Erdoğan, Y.; Koyun, M.; Ömeroğlu, Ç.; Özmal, F. The comparison of heavy metal accumulation ratios of some fish species in Enne Dame Lake (Kütahya/Turkey). Environ. Monit. Assess. 2009, 157, 355–362. [Google Scholar] [CrossRef]
- Nhiwatiwa, T.; Barson, M.; Harrison, A.; Utete, B.; Cooper, R. Metal concentrations in water, sediment and sharptooth catfish Clarias gariepinus from three peri-urban rivers in the upper Manyame catchment, Zimbabwe. Afr. J. Aquat. Sci. 2011, 36, 243–252. [Google Scholar] [CrossRef]
- Annabi, A.; Said, K.; Messaoudi, I. Cadmium: Bioaccumulation, histopathology and detoxifying mechanisms in fish. Am. J. Res. Commun. 2013, 1, 62. [Google Scholar]
- Sánchez-Chardi, A.; Peñarroja-Matutano, C.; Ribeiro, C.A.O.; Nadal, J. Bioaccumulation of metals and effects of a landfill in small mammals. Part II. The wood mouse, Apodemus sylvaticus. Chemosphere 2007, 70, 101–109. [Google Scholar] [CrossRef] [PubMed]
- Meche, A.; Martins, M.C.; Lofrano, B.E.; Hardaway, C.J.; Merchant, M.; Verdade, L. Determination of heavy metals by inductively coupled plasma-optical emission spectrometry in fish from the Piracicaba River in Southern Brazil. Microchem. J. 2010, 94, 171–174. [Google Scholar] [CrossRef]
- Zheng, N.; Wang, Q.; Zhang, X.; Zheng, D.; Zhang, Z.; Zhang, S. Population health risk due to dietary intake of heavy metals in the industrial area of Huludao city, China. Sci. Total Environ. 2007, 387, 96–104. [Google Scholar] [CrossRef]
- Hossain, S.; Bhowmik, S.; Hasan, M.T.; Islam, M.S.; Hossain, M.A. Socio-economic conditions of Jatka fishers in some selected spots of Meghna estuary. Middle-East J. Sci. Res. 2015, 23, 378–386. [Google Scholar]
- Bhuyan, S.; Islam, S. Present status of socio-economic conditions of the fishing community of the Meghna River adjacent to Narsingdi district. Bangladesh J. Fish. Livest. Prod. 2016, 4, 192. [Google Scholar]
- Ahmed, M.K.; Ahamed, S.; Rahman, S.; Haque, M.R.; Islam, M.M. Heavy metals concentration in water, sediments and their bioaccumulation in some freshwater fishes and mussel in Dhaleshwari River, Bangladesh. Terr. Aquat. Environ. Toxicol. 2009, 3, 33–41. [Google Scholar]
- Wagner, A.; Boman, J. Biomonitoring of trace elements in muscle and liver tissue of freshwater fish. Spectrochim. Acta Part B At. Spectrosc. 2003, 58, 2215–2226. [Google Scholar] [CrossRef]
- Ahmed, M.K.; Baki, M.A.; Islam, M.S.; Kundu, G.K.; Habibullah-Al-Mamun, M.; Sarkar, S.K.; Hossain, M.M. Human health risk assessment of heavy metals in tropical fish and shellfish collected from the river Buriganga, Bangladesh. Environ. Sci. Pollut. Res. 2015, 22, 15880–15890. [Google Scholar] [CrossRef] [PubMed]
- Rahman, M.S.; Molla, A.H.; Saha, N.; Rahman, A. Study on heavy metals levels and its risk assessment in some edible fishes from Bangshi River, Savar, Dhaka, Bangladesh. Food Chem. 2012, 134, 1847–1854. [Google Scholar] [CrossRef] [PubMed]
- Abdel-Khalek, A.A.; Elhaddad, E.; Mamdouh, S.; Marie, M.-A.S. Assessment of metal pollution around sabal drainage in River Nile and its impacts on bioaccumulation level, metals correlation and human risk hazard using Oreochromis niloticus as a bioindicator. Turk. J. Fish. Aquat. Sci. 2016, 16, 227–239. [Google Scholar]
- Usero, J.; Morillo, J.; Gracia, I. Heavy metal concentrations in molluscs from the Atlantic coast of southern Spain. Chemosphere 2005, 59, 1175–1181. [Google Scholar] [CrossRef] [PubMed]
- Varol, M.; Kaya, G.K.; Alp, A. Heavy metal and arsenic concentrations in rainbow trout (Oncorhynchus mykiss) farmed in a dam reservoir on the Firat (Euphrates) River: Risk-based consumption advisories. Sci. Total Environ. 2017, 599, 1288–1296. [Google Scholar] [CrossRef] [PubMed]
- Wei, Y.; Zhang, J.; Zhang, D.; Tu, T.; Luo, L. Metal concentrations in various fish organs of different fish species from Poyang Lake, China. Ecotoxicol. Environ. Saf. 2014, 104, 182–188. [Google Scholar] [CrossRef] [PubMed]
- USEPA. Integrated Risk Information System. 2008. Available online: https://cfpub.epa.gov/ncea/risk/recordisplay.cfm?deid=2776 (accessed on 15 December 2021).
- Vu, C.T.; Lin, C.; Yeh, G.; Villanueva, M.C. Bioaccumulation and potential sources of heavy metal contamination in fish species in Taiwan: Assessment and possible human health implications. Environ. Sci. Pollut. Res. 2017, 24, 19422–19434. [Google Scholar] [CrossRef]
- Abtahi, M.; Fakhri, Y.; Oliveri Conti, G.; Keramati, H.; Zandsalimi, Y.; Bahmani, Z.; Hosseini Pouya, R.; Sarkhosh, M.; Moradi, B.; Amanidaz, N. Heavy metals (As, Cr, Pb, Cd and Ni) concentrations in rice (Oryza sativa) from Iran and associated risk assessment: A systematic review. Toxin Rev. 2017, 36, 331–341. [Google Scholar] [CrossRef]
- Baki, M.A.; Hossain, M.M.; Akter, J.; Quraishi, S.B.; Shojib, M.F.H.; Ullah, A.A.; Khan, M.F. Concentration of heavy metals in seafood (fishes, shrimp, lobster and crabs) and human health assessment in Saint Martin Island, Bangladesh. Ecotoxicol. Environ. Saf. 2018, 159, 153–163. [Google Scholar] [CrossRef]
- Traina, A.; Bono, G.; Bonsignore, M.; Falco, F.; Giuga, M.; Quinci, E.M.; Vitale, S.; Sprovieri, M. Heavy metals concentrations in some commercially key species from Sicilian coasts (Mediterranean Sea): Potential human health risk estimation. Ecotoxicol. Environ. Saf. 2019, 168, 466–478. [Google Scholar] [CrossRef]
- Dadar, M.; Adel, M.; Nasrollahzadeh Saravi, H.; Fakhri, Y. Trace element concentration and its risk assessment in common kilka (Clupeonella cultriventris caspia Bordin, 1904) from southern basin of Caspian Sea. Toxin Rev. 2017, 36, 222–227. [Google Scholar] [CrossRef]
- Fakhri, Y.; Mohseni-Bandpei, A.; Oliveri Conti, G.; Keramati, H.; Zandsalimi, Y.; Amanidaz, N.; Hosseini Pouya, R.; Moradi, B.; Bahmani, Z.; Rasouli Amirhajeloo, L. Health risk assessment induced by chloroform content of the drinking water in Iran: Systematic review. Toxin Rev. 2017, 36, 342–351. [Google Scholar] [CrossRef]
- Fantke, P.; Friedrich, R.; Jolliet, O. Health impact and damage cost assessment of pesticides in Europe. Environ. Int. 2012, 49, 9–17. [Google Scholar] [CrossRef] [PubMed]
- Pepper, I.; Gerba, C.; Brusseau, M. Environmental and Pollution Science; Pollution Science Series; Academic Press: Cambridge, MA, USA, 2012; pp. 212–232. [Google Scholar]
- Fishery, F. Aquaculture Statistics; Yearbook 2010; FAO: Rome, Italy, 2012. [Google Scholar]
- USEPA, U. Risk-Based Concentration Table. 2000. Available online: https://archive.epa.gov/region9/superfund/web/html/index-23.html (accessed on 10 December 2021).
- Hu, B.; Jia, X.; Hu, J.; Xu, D.; Xia, F.; Li, Y. Assessment of heavy metal pollution and health risks in the soil-plant-human system in the Yangtze River Delta, China. Int. J. Environ. Res. Public Health 2017, 14, 1042. [Google Scholar] [CrossRef] [PubMed] [Green Version]
- USEPA. Human Health Risk Assessment. 2010. Available online: https://www.epa.gov/risk/human-health-risk-assessment (accessed on 13 December 2021).
- Liu, Q.; Liao, Y.; Shou, L. Concentration and potential health risk of heavy metals in seafoods collected from Sanmen Bay and its adjacent areas, China. Mar. Pollut. Bull. 2018, 131, 356–364. [Google Scholar] [CrossRef]
- Suresh, G.; Ramasamy, V.; Meenakshisundaram, V.; Venkatachalapathy, R.; Ponnusamy, V. Influence of mineralogical and heavy metal composition on natural radionuclide concentrations in the river sediments. Appl. Radiat. Isot. 2011, 69, 1466–1474. [Google Scholar] [CrossRef]
- Hosseini, M.; Nabavi, S.M.B.; Nabavi, S.N.; Pour, N.A. Heavy metals (Cd, Co, Cu, Ni, Pb, Fe, and Hg) content in four fish commonly consumed in Iran: Risk assessment for the consumers. Environ. Monit. Assess. 2015, 187, 237. [Google Scholar] [CrossRef]
- Jiang, X.; Wang, J.; Pan, B.; Li, D.; Wang, Y.; Liu, X. Assessment of heavy metal accumulation in freshwater fish of Dongting Lake, China: Effects of feeding habits, habitat preferences and body size. J. Environ. Sci. 2022, 112, 355–365. [Google Scholar] [CrossRef]
- Yi, Y.; Tang, C.; Yi, T.; Yang, Z.; Zhang, S. Health risk assessment of heavy metals in fish and accumulation patterns in food web in the upper Yangtze River, China. Ecotoxicol. Environ. Saf. 2017, 145, 295–302. [Google Scholar] [CrossRef] [PubMed]
- Jiang, Z.; Xu, N.; Liu, B.; Zhou, L.; Wang, J.; Wang, C.; Dai, B.; Xiong, W. Metal concentrations and risk assessment in water, sediment and economic fish species with various habitat preferences and trophic guilds from Lake Caizi, Southeast China. Ecotoxicol. Environ. Saf. 2018, 157, 1–8. [Google Scholar] [CrossRef]
- Nowosad, J.; Kucharczyk, D.; Łuczyńska, J. Changes in mercury concentration in muscles, ovaries and eggs of European eel during maturation under controlled conditions. Ecotoxicol. Environ. Saf. 2018, 148, 857–861. [Google Scholar] [CrossRef]
- Łuczyńska, J.; Paszczyk, B.; Nowosad, J.; Łuczyński, M.J. Mercury, fatty acids content and lipid quality indexes in muscles of freshwater and marine fish on the polish market. Risk assessment of fish consumption. Int. J. Environ. Res. Public Health 2017, 14, 1120. [Google Scholar] [CrossRef] [PubMed]
- Nowosad, J.; Kucharczyk, D.; Szmyt, M.; Łuczynska, J.; Tamás, M.; Horváth, L. Changes in Cadmium Concentration in Muscles, Ovaries, and Eggs of Silver European Eel (Anguilla anguilla) during Maturation under Controlled Conditions. Animals 2021, 11, 1027. [Google Scholar] [CrossRef] [PubMed]
- Kwaansa-Ansah, E.E.; Nti, S.O.; Opoku, F. Heavy metals concentration and human health risk assessment in seven commercial fish species from Asafo Market, Ghana. Food Sci. Biotechnol. 2019, 28, 569–579. [Google Scholar] [CrossRef]
- Xie, W.; Chen, K.; Zhu, X.; Nie, X.; Zheng, G.; Pan, D.; Wang, S. Evaluation of heavy metal contents in water and fishes collected from the waterway in Pearl River Delta in south China. J. Agro-Environ. Sci. 2010, 29, 1917–1923. [Google Scholar]
- Travis, C.C. (Ed.) Use of Biomarkers in Assessing Health and Environmental Impacts of Chemical Pollutants; Plenum Press: New York, NY, USA, 2013; Volume 250. [Google Scholar]
- Nauen, C.E. Compilation of legal limits for hazardous substances in fish and fishery products. FAO Fish. Circ. 1983, 764, 102. [Google Scholar]
- WHO. Health Criteria Other Supporting Information, Guidelines for Drinking Water Quality, 2nd ed.; WHO: Geneva, Switzerland, 1996. [Google Scholar]
- ROPME. Regional Report of the State of the Marine Environment; Regional Organization for the Protection of the Marine Environment (ROPME): Kuwait City, Kuwait, 1999; p. 220. [Google Scholar]
- Food and Drug Administration. Fish and Fishery Products Hazards and Controls Guidance; US Department of Health and Human Services Food and Drug Administration: Silver Spring, MD, USA, 2011. [Google Scholar]
- EC. Commission Regulation (EC) No 1881/2006, Setting Maximum Levels for Certain Contaminants in Foodstuffs. 2006. Available online: https://www.ecolex.org/details/legislation/commission-regulation-ec-no-18812006-setting-maximum-levels-for-certain-contaminants-in-foodstuffs-lex-faoc068134/ (accessed on 1 January 2022).
- National Oceanic and Atmospheric Administration. Guidelines for Consumer of Sea Food, 2nd ed.; National Oceanic and Atmospheric Administration: Washington, DC, USA, 2009; Volume 2, pp. 45–211. [Google Scholar]
- Joint FAO/WHO Expert Committee on Food Additives. Evaluation of Certain Food Additives and Contaminants: Sixty-Ninth Report of the Joint FAO/WHO Expert Committee on Food Additives; World Health Organization: Geneva, Switzerland, 2009. [Google Scholar]
- USFDA. Guidance Document for Arsenic in Shellfish; US Food and Drug Administration: Washington, DC, USA, 1993; pp. 25–27. [Google Scholar]
- MOFL. Bangladesh Gazette; SRO No. 233/Ayen; Bangladesh Ministry of Fisheries and Livestock: Dhaka, Bangladesh, 2014. [Google Scholar]
- Food Safety and Standards (Contaminants, Toxins and Residues) Regulations. 2011. Available online: https://www.fssai.gov.in/upload/uploadfiles/files/Compendium_Contaminants_Regulations_20_08_2020.pdf (accessed on 2 January 2022).
- Malaysian Food Act (MFA). Malaysian Food and Drug; MDC Publishers Printer Sdn. Bhd: Kuala Lumpur, Malaysia, 1983. [Google Scholar]
- GB 18421-2001; Marine Biological Quality. National Marine Standards and Metrology Center: Tianjin, China, 2001.
- Rahman, T.; Akter, S.; Jolly, Y.; Mortuza, M.G. Heavy Metal Contamination of Some Fresh Water Fishes: A Market Based Study to Highlight the Possible Health Risk. Univ. J. Zool. Rajshahi. Univ. 2018, 37, 23–27. [Google Scholar]
- Ahmed, A.S.; Rahman, M.; Sultana, S.; Babu, S.O.F.; Sarker, M.S.I. Bioaccumulation and heavy metal concentration in tissues of some commercial fishes from the Meghna River Estuary in Bangladesh and human health implications. Mar. Pollut. Bull. 2019, 145, 436–447. [Google Scholar] [CrossRef]
- Alipour, H.; Banagar, G.R. Health risk assessment of selected heavy metals in some edible fishes from Gorgan Bay, Iran. Iran. J. Fish. Sci. 2018, 17, 21–34. [Google Scholar]
- WHO. Environmental Aspects—Environmental Health Criteria; WHO: Geneva, Switzerland, 1989. [Google Scholar]
- Staniskiene, B.; Matusevicius, P.; Budreckiene, R.; Skibniewska, K. Distribution of Heavy Metals in Tissues of Freshwater Fish in Lithuania. Pol. J. Environ. Stud. 2006, 15, 585–591. [Google Scholar]
- Copat, C.; Bella, F.; Castaing, M.; Fallico, R.; Sciacca, S.; Ferrante, M. Heavy metals concentrations in fish from Sicily (Mediterranean Sea) and evaluation of possible health risks to consumers. Bull. Environ. Contam. Toxicol. 2012, 88, 78–83. [Google Scholar] [CrossRef] [PubMed] [Green Version]
- Saha, N.; Mollah, M.; Alam, M.; Rahman, M.S. Seasonal investigation of heavy metals in marine fishes captured from the Bay of Bengal and the implications for human health risk assessment. Food Control 2016, 70, 110–118. [Google Scholar] [CrossRef] [Green Version]
- Ahmed, M.K.; Baki, M.A.; Kundu, G.K.; Islam, M.S.; Islam, M.M.; Hossain, M.M. Human health risks from heavy metals in fish of Buriganga river, Bangladesh. SpringerPlus 2016, 5, 1697. [Google Scholar] [CrossRef] [PubMed] [Green Version]
- Özparlak, H.; Arslan, G.; Arslan, E. Determination of some metal levels in muscle tissue of nine fish species from the Beyşehir Lake, Turkey. Turk. J. Fish. Aquat. Sci. 2012, 12, 761–770. [Google Scholar] [CrossRef]
- WHO. Mercury: Environmental Aspects—Environmental Health Criteria 86; WHO: Geneva, Switzerland, 1989. [Google Scholar]
- Bury, N.; Grosell, M. Iron acquisition by teleost fish. Comp. Biochem. Physiol. Part C Toxicol. Pharmacol. 2003, 135, 97–105. [Google Scholar] [CrossRef]
- Crichton, R.R.; Wilmet, S.; Legssyer, R.; Ward, R.J. Molecular and cellular mechanisms of iron homeostasis and toxicity in mammalian cells. J. Inorg. Biochem. 2002, 91, 9–18. [Google Scholar] [CrossRef]
- Joint FAO/WHO Expert Committee on Food Additives. Evaluation of Certain Contaminants in Food: Seventy-Second [72nd] Report of the Joint FAO/WHO Expert Committee on Food Additives; World Health Organization: Geneva, Switzerland, 2011. [Google Scholar]
- Amin, M.N.; Begum, A.; Mondal, M.K. Trace element concentrations present in five species of freshwater fish of Bangladesh. Bangladesh J. Sci. Ind. Res. 2011, 46, 27–32. [Google Scholar] [CrossRef] [Green Version]
- De, T.; De, M.; Das, S.; Ray, R.; Ghosh, P. Level of heavy metals in some edible marine fishes of mangrove dominated tropical estuarine areas of Hooghly River, North East Coast of Bay of Bengal, India. Bull. Environ. Contam. Toxicol. 2010, 85, 385–390. [Google Scholar] [CrossRef]
- Ghosh, B.B.; Bagchi, M.M.; De, D.K. Some observations on the status of pollution in the Hooghly estuary (West Bengal) with reference to heavy metals deposited through industrial wastes. J. Inland Fish. Soc. India 1983, 15, 44–53. [Google Scholar]
- Gorell, J.; Johnson, C.; Rybicki, B.; Peterson, E.; Kortsha, G.; Brown, G.; Richardson, R. Occupational exposures to metals as risk factors for Parkinson’s disease. Neurology 1997, 48, 650–658. [Google Scholar] [CrossRef]
- Peterson, S.A.; Ralston, N.V.; Whanger, P.D.; Oldfield, J.E.; Mosher, W.D. Selenium and mercury interactions with emphasis on fish tissue. Environ. Bioindic. 2009, 4, 318–334. [Google Scholar] [CrossRef]
- Ullah, A.A.; Maksud, M.; Khan, S.; Lutfa, L.; Quraishi, S.B. Dietary intake of heavy metals from eight highly consumed species of cultured fish and possible human health risk implications in Bangladesh. Toxicol. Rep. 2017, 4, 574–579. [Google Scholar] [CrossRef] [PubMed]
- Hajeb, P.; Jinap, S.; Ismail, A.; Fatimah, A.; Jamilah, B.; Rahim, M.A. Assessment of mercury level in commonly consumed marine fishes in Malaysia. Food Control 2009, 20, 79–84. [Google Scholar] [CrossRef]
- Ju, Y.-R.; Chen, C.-W.; Chen, C.-F.; Chuang, X.-Y.; Dong, C.-D. Assessment of heavy metals in aquaculture fishes collected from southwest coast of Taiwan and human consumption risk. Int. Biodeterior. Biodegrad. 2017, 124, 314–325. [Google Scholar] [CrossRef]
- Bravo, A.G.; Loizeau, J.-L.; Bouchet, S.; Richard, A.; Rubin, J.F.; Ungureanu, V.-G.; Amouroux, D.; Dominik, J. Mercury human exposure through fish consumption in a reservoir contaminated by a chlor-alkali plant: Babeni reservoir (Romania). Environ. Sci. Pollut. Res. 2010, 17, 1422–1432. [Google Scholar] [CrossRef] [PubMed]
- Raknuzzaman, M.; Ahmed, M.K.; Islam, M.S.; Habibullah-Al-Mamun, M.; Tokumura, M.; Sekine, M.; Masunaga, S. Trace metal contamination in commercial fish and crustaceans collected from coastal area of Bangladesh and health risk assessment. Environ. Sci. Pollut. Res. 2016, 23, 17298–17310. [Google Scholar] [CrossRef]
- Joint FAO/WHO Expert Committee on Food Additives. Evaluation of Certain Food Additives and Contaminants: Twenty-Seventh Report of the Joint FAO; World Health Organization: Geneva, Switzerland, 1983. [Google Scholar]
- Recommended Dietary Allowances. 1989. Available online: https://www.sisterniveditapublicschool.com/wp-content/uploads/2021/11/UNIT-I-Chapter-4-converted.pdf (accessed on 2 January 2022).
- WHO. Trace Elements in Human Nutrition and Health; World Health Organization: Geneva, Switzerland, 1996. [Google Scholar]
- USEPA. Regional Screening Level (RSL) Summary Table. 2015. Available online: https://www.epa.gov/risk/regional-screening-levels-rsls (accessed on 3 January 2022).
- Li, J.; Huang, Z.Y.; Hu, Y.; Yang, H. Potential risk assessment of heavy metals by consuming shellfish collected from Xiamen, China. Environ. Sci. Pollut. Res. 2013, 20, 2937–2947. [Google Scholar] [CrossRef]
- Javed, M.; Usmani, N. Accumulation of heavy metals and human health risk assessment via the consumption of freshwater fish Mastacembelus armatus inhabiting, thermal power plant effluent loaded canal. SpringerPlus 2016, 5, 776. [Google Scholar] [CrossRef] [Green Version]
- USEPA. Risk Assessment Guideline for Superfund Volume 1 Human Evaluation Manual (Part A); Office of Emergency and Remedial Response, U.S. Environmental Protection Agency: Washington, DC, USA, 1989. [Google Scholar]
- Kükrer, S.; Şeker, S.; Abacı, Z.T.; Kutlu, B. Ecological risk assessment of heavy metals in surface sediments of northern littoral zone of Lake Çıldır, Ardahan, Turkey. Environ. Monit. Assess. 2014, 186, 3847–3857. [Google Scholar] [CrossRef]
- Yedjou, C.G.; Tchounwou, H.M.; Tchounwou, P.B. DNA damage, cell cycle arrest, and apoptosis induction caused by lead in human leukemia cells. Int. J. Environ. Res. Public Health 2016, 13, 56. [Google Scholar] [CrossRef] [Green Version]
- Tchounwou, P.B.; Ayensu, W.K.; Ninashvili, N.; Sutton, D. Environmental exposure to mercury and its toxicopathologic implications for public health. Environ. Toxicol. Int. J. 2003, 18, 149–175. [Google Scholar] [CrossRef] [PubMed]
- Boateng, T.K.; Opoku, F.; Acquaah, S.O.; Akoto, O. Pollution evaluation, sources and risk assessment of heavy metals in hand-dug wells from Ejisu-Juaben Municipality, Ghana. Environ. Syst. Res. 2015, 4, 18. [Google Scholar] [CrossRef] [Green Version]
- Suseno, H.; Hudiyono, S.; Wisnubroto, D.S. Effects of concentration, body size and food type on the bioaccumulation of Hg in farmed tilapia Oreochromis mossambicus. Aust. J. Basic Appl. Sci. 2010, 4, 792–799. [Google Scholar]


| Common Name | Scientific Name | Habitat | Feeding Habit | Length (cm) | Weight (gm) |
|---|---|---|---|---|---|
| Tilapia | Oreochromis mossambicus | Freshwater | Omnivorous | 23.75 ± 1.77 | 324.5 ± 4.95 |
| Koi | Anabas testudineus | Freshwater | Carnivorous | 16 ± 5.66 | 116.5 ± 94.04 |
| Catla | Gibelion catla | Freshwater | Planktivorous | 24.5 ± 1.41 | 578.5 ± 26.16 |
| Rui | Labeo rohita | Freshwater | Herbivorous | 33 ± 4.24 | 763.5 ± 23.33 |
| Grass carp | Ctenopharyngodon idella | Freshwater | Herbivorous | 31.5 ± 2.12 | 709 ± 41.01 |
| Bighead carp | Aristichthys nobilis | Freshwater | Plankton and detritus feeder | 32.5 ± 2.12 | 581 ± 36.06 |
| Kalibaus | Labeo calbasu | Freshwater | Detritus feeder | 32.5 ± 0.71 | 440.5 ± 6.36 |
| Bata | Cirrhinus reba | Freshwater | Bottom feeder, herbivorous | 22.5 ± 0.71 | 121 ± 1.41 |
| Pabda | Ompok pabda | Freshwater | Omnivorous | 13.5 ± 0.71 | 24.5 ± 4.95 |
| Poa | Otolothoides pama | Freshwater, brackish, marine | Carnivorous | 24.75 ± 1.06 | 192 ± 5.66 |
| Chiring | Apocryptes bato | Freshwater, brackish, marine | Carnivorous | 16 ± 1.41 | 21 ± 4.24 |
| Ricksha | Polynemus paradiseus | Marine, freshwater, brackish | Feeds mainly on crustaceans (especially shrimps), small fishes, benthic organisms | 13.25 ± 1.06 | 31 ± 11.31 |
| Gulio | Mystus gulio | Brackish water | Carnivorous | 15.75 ± 1.06 | 64 ± 5.66 |
| Loitta | Harpadon nehereus | Marine, brackish | Carnivorous & to some extent cannibalistic | 24.5 ± 2.12 | 118.5 ± 30.40 |
| Koral | Lates calcarifer | Catadromous | Carnivorous | 27.25 ±1.06 | 356.5 ± 12.02 |
| Species | Pb | Cr | Cu | Zn | Mn | Fe | Hg | Ni | Ca | Co | Se | Rb | Sr | As | |
|---|---|---|---|---|---|---|---|---|---|---|---|---|---|---|---|
| Tilapia | Mean | 0.43 | BDL | 36.15 | 122.66 | BDL | 150.09 | 1.26 | BDL | 217.66 | BDL | BDL | 2.64 | 166.36 | BDL |
| SD | 0.03 | 3.11 | 17.23 | 18.46 | 0.16 | 18.26 | 0.12 | 23.04 | |||||||
| Koi | Mean | 0.68 | 7.86 | 32.49 | 107.22 | 7.10 | 146.82 | 0.98 | BDL | 80.23 | BDL | 7.64 | 1.72 | 33.27 | BDL |
| SD | 0.06 | 0.54 | 3.73 | 11.21 | 3.03 | 0 | 0.24 | 70.23 | 0.54 | 0.17 | 15.81 | ||||
| Catla | Mean | 0.57 | BDL | 33.92 | 105.05 | BDL | 168.76 | 2.58 | BDL | 29.21 | BDL | BDL | 3.29 | 14.06 | BDL |
| SD | 0.27 | 1.19 | 1.06 | 7.43 | 0.15 | 4.23 | 0.18 | 3.18 | |||||||
| Rui | Mean | 0.60 | BDL | 32.49 | 131.42 | BDL | 147.55 | 1.57 | BDL | 118.34 | BDL | BDL | 1.31 | 69.53 | BDL |
| SD | 0.10 | 0.40 | 2.95 | 5.64 | 0.13 | 23.83 | 0.43 | 7.23 | |||||||
| Grass carp | Mean | 0.53 | 7.69 | 48.59 | 116.82 | 6.91 | 204.83 | 1.38 | BDL | 44.00 | BDL | 9.75 | 3.60 | 31.65 | BDL |
| SD | 0.05 | 2.10 | 9.94 | 9.20 | 2.23 | 27.69 | 0.12 | 1.89 | 1.71 | 0.96 | 8.50 | ||||
| Bighead carp | Mean | 0.61 | 5.90 | 33.32 | 102.06 | BDL | 208.51 | 1.33 | BDL | 68.34 | BDL | BDL | 2.47 | 35.72 | BDL |
| SD | 0.28 | 1.74 | 2.55 | 4.15 | 13.42 | 0.01 | 17.68 | 0.27 | 5.20 | ||||||
| Kalibaus | Mean | 0.54 | BDL | 37.76 | 108.22 | BDL | 149.18 | 0.72 | BDL | 50.34 | BDL | 9.52 | 1.45 | 27.20 | BDL |
| SD | 0.21 | 9.94 | 8.14 | 0.77 | 0.47 | 5.09 | 0.21 | 0.16 | 5.96 | ||||||
| Bata | Mean | 0.63 | 5.99 | 35.56 | 144.35 | BDL | 156.61 | 1.74 | 1.04 | 76.90 | BDL | 9.15 | 1.23 | 58.38 | BDL |
| SD | 0.10 | 0.18 | 10.55 | 5.20 | 26.15 | 0.55 | 0.08 | 10.95 | 0.01 | 0.14 | 2.77 | ||||
| Pabda | Mean | 0.53 | BDL | 31.63 | 101.88 | 5.485 | 148.63 | 0.79 | 1.55 | 73.84 | BDL | BDL | 2.09 | 31.862 | BDL |
| SD | 0.27 | 1.27 | 6.73 | 0 | 12.82 | 0.15 | 0.46 | 12.20 | 0.003 | 5.43 | |||||
| Poa | Mean | 0.38 | 9.69 | 30.29 | 107.22 | BDL | 177.46 | 2.06 | BDL | 108.62 | BDL | 9.27 | 1.77 | 153.69 | BDL |
| SD | 0.12 | 2.04 | 3.93 | 16.87 | 15.12 | 0.13 | 12.78 | 1.77 | 0.21 | 6.41 | |||||
| Chiring | Mean | 0.65 | 7.35 | 46.98 | 111.81 | BDL | 151.17 | 1.21 | BDL | 127.10 | 4.70 | 8.20 | 1.24 | 135.29 | BDL |
| SD | 0.03 | 3.18 | 24.22 | 6.37 | 1.02 | 0.03 | 3.75 | 2.55 | 1.10 | 0.04 | 74.17 | ||||
| Ricksha | Mean | 0.48 | 7.24 | 33.95 | 101.38 | BDL | 188.15 | 2.03 | BDL | 79.21 | BDL | 8.85 | 1.52 | 96.41 | BDL |
| SD | 0.07 | 3.59 | 4.14 | 8.38 | 29.23 | 0.37 | 54.77 | 0.06 | 0.15 | 55.59 | |||||
| Gulia | Mean | 0.57 | BDL | 46.57 | 129.33 | BDL | 150.81 | 1.42 | BDL | 116.30 | 2.89 | BDL | 1.16 | 103.85 | BDL |
| SD | 0.04 | 12.39 | 13.45 | 3.59 | 0.25 | 39.20 | 0.84 | 0.09 | 42.14 | ||||||
| Loitta | Mean | 0.20 | BDL | 35.40 | 106.72 | BDL | 148.82 | 2.90 | BDL | 76.02 | BDL | 8.12 | 1.51 | 111.32 | BDL |
| SD | 0.02 | 17.83 | 6.02 | 12.56 | 0.37 | 21.23 | 1.94 | 0.15 | 20.19 | ||||||
| Koral | Mean | 0.44 | 8.84 | 31.44 | 103.72 | BDL | 135.58 | 2.33 | BDL | 51.29 | BDL | 9.39 | 1.69 | 58.48 | BDL |
| SD | 0.05 | 0.12 | 2.97 | 13.81 | 9.23 | 0.24 | 49.86 | 1.94 | 0.11 | 43.30 |
| Standards | Cu | Pb | Ni | Hg | Fe | Zn | Cr | References |
|---|---|---|---|---|---|---|---|---|
| Noakhali fish market | 36.44 | 0.521 | 1.467 | 1.657 | 162.198 | 113.326 | 7.336 | This study |
| FAO | 30 | 2 | 55 | 0.5 | 180 | [62] | ||
| WHO | 30 | 0.5 | 30 | 0.5 | 109 | [63] | ||
| ROPME | 0.5–19.5 | 0.01–1.28 | 0.01–0.75 | 1 | 200 | [64] | ||
| FDA | 1.7 | 70 | 0.5–1 | [65] | ||||
| European Commission | 1 | 40 | 0.5–1 | [66] | ||||
| NOAA | 149 | 128 | 52 | 0.5 | 250 | [67] | ||
| FAO/WHO limits | 30 | 0.5 | 333.3 | 100 | [68] | |||
| FSG | 30 | 2 | 80 | 30 | 12–13 | [62,69] | ||
| Bangladesh | 5 | 0.3 | 1 | [70] | ||||
| India | 30 | 0.3 | 0.5 | 50 | [71] | |||
| Malaysia | 30 | 0.3 | 100 | [72] | ||||
| China | 50 | 2 | 0.3 | [73] | ||||
| International criterion | 15 | 0.3 | 0.5 | 60 | [74] | |||
| Bangshi river, Bangladesh | 22.8 | 4.64 | 2.59 | 168.97 | 1.12 | [32] | ||
| Meghna river estuary, Bangladesh | 4.97 | 3.66 | 0.76 | [75] | ||||
| Dhaleshwari river, Bangladesh | 5.17–7.48 | 4.25–8.17 | [29] | |||||
| Gorgan Bay, Iran | 0.43 | 501.65 | 6.4 | [76] | ||||
| Asafo market, Ghana | 0.02–0.156 | 0.054–0.085 | 0.016–0.022 | [59] | ||||
| Pearl river, China | 1.17–6.72 | 0.05–1.94 | 2.62–20.2 | [60] |
| Species | Metal Pollution Index (MPI) |
|---|---|
| Tilapia | 20.73166 |
| Koi | 11.87546 |
| Catla | 13.63232 |
| Rui | 16.83319 |
| Grass carp | 13.24696 |
| Bighead carp | 13.98457 |
| Kalibaus | 11.80463 |
| Bata | 10.97328 |
| Pabda | 9.818907 |
| Poa | 16.12621 |
| Chiring | 11.47850 |
| Ricksha | 14.69736 |
| Gulia | 14.56895 |
| Loitta | 14.80534 |
| Koral | 13.41669 |
| Species | Carcinogenic Risk (Pb) | Carcinogenic Risk (Cr) | ||
|---|---|---|---|---|
| Csf: 0.0085 * | Csf: 0.5 ** | |||
| Adult | Child | Adult | Child | |
| Tilapia | 2.864 × 10⁻⁹ | 1.264 × 10⁻⁸ | 8.629 × 10⁻⁵ | 3.809 × 10⁻⁴ |
| Koi | 4.583 × 10⁻⁹ | 2.023 × 10⁻⁸ | 3.115 × 10⁻⁶ | 1.375 × 10⁻⁵ |
| Catla | 3.838 × 10⁻⁹ | 1.694 × 10⁻⁸ | - | - |
| Rui | 4.074 × 10⁻⁹ | 1.798 × 10⁻⁸ | - | - |
| Grass carp | 3.572 × 10⁻⁹ | 1.577 × 10⁻⁸ | 3.048 × 10⁻⁶ | 1.346 × 10⁻⁵ |
| Bighead carp | 4.111 × 10⁻⁹ | 1.815 × 10⁻⁸ | 2.341 × 10⁻⁶ | 1.033 × 10⁻⁵ |
| Kalibaus | 3.609 × 10⁻⁹ | 1.593 × 10⁻⁸ | - | - |
| Bata | 4.266 × 10⁻⁹ | 1.883 × 10⁻⁸ | 2.374 × 10⁻⁶ | 1.048 × 10⁻⁵ |
| Pabda | 3.569 × 10⁻⁹ | 1.575 × 10⁻⁸ | - | - |
| Poa | 2.547 × 10⁻⁹ | 1.125 × 10⁻⁸ | 3.839 × 10⁻⁶ | 1.695 × 10⁻⁵ |
| Chiring | 4.367 × 10⁻⁹ | 1.928 × 10⁻⁸ | 2.913 × 10⁻⁶ | 1.286 × 10⁻⁵ |
| Ricksha | 3.238 × 10⁻⁹ | 1.429 × 10⁻⁸ | 2.868 × 10⁻⁶ | 1.266 × 10⁻⁵ |
| Gulia | 3.828 × 10⁻⁹ | 1.690 × 10⁻⁸ | - | - |
| Loitta | 1.362 × 10⁻⁹ | 6.009 × 10⁻⁹ | - | - |
| Koral | 2.949 × 10⁻⁹ | 1.302 × 10⁻⁸ | 3.503 × 10⁻⁶ | 1.545 × 10⁻⁵ |
| Mean | 2.932 × 10⁻⁹ | 1.553 × 10⁻⁸ | 1.225 × 10⁻⁵ | 5.409 × 10⁻⁵ |
| Cu | Ca | Fe | Zn | Hg | Pb | Rb | Sr | |
|---|---|---|---|---|---|---|---|---|
| Cu | 1 | |||||||
| Ca | 0.09467 | 1 | ||||||
| Fe | 0.15372 | −0.26686 | 1 | |||||
| Zn | 0.30966 | 0.3802 | −0.2181 | 1 | ||||
| Hg | −0.2560 | −0.23051 | 0.0389 | −0.1159 | 1 | |||
| Pb | 0.21208 | −0.09375 | 0.0699 | 0.28540 | −0.6004 * | 1 | ||
| Rb | 0.09426 | −0.20642 | 0.555 * | −0.2621 | 0.05301 | −0.0289 | 1 | |
| Sr | 0.12102 | 0.8033 ** | −0.1565 | 0.17546 | 0.185543 | −0.4541 | −0.3205 | 1 |
| Metals | PC 1 | PC 2 | PC 3 | PC 4 | PC 5 | PC 6 | PC 7 | PC 8 |
|---|---|---|---|---|---|---|---|---|
| Cu | 0.077094 | 0.35666 | 0.48445 | 0.40975 | −0.63966 | −0.14283 | 0.1046 | −0.15416 |
| Ca | 0.53915 * | 0.048427 | 0.27734 | −0.38842 | 0.25127 | −0.11289 | 0.14619 | −0.61801 |
| Fe | −0.37036 | 0.0087578 | 0.55052 * | −0.05238 | 0.1909 | 0.67073 * | −0.22546 | −0.14067 |
| Zn | 0.33914 | 0.33803 | 0.052466 | 0.56126 * | 0.5497 * | −0.06207 | −0.35525 | 0.14394 |
| Hg | −0.03564 | −0.56239 | 0.028292 | 0.56628 * | 0.18927 | 0.078451 | 0.51397 * | −0.23416 |
| Pb | −0.1196 | 0.61867 * | −0.15557 | −0.05853 | 0.20548 | 0.24232 | 0.67972 * | 0.11118 |
| Rb | −0.4017 | −0.032157 | 0.4909 | −0.13855 | 0.32422 | −0.6287 | 0.14656 | 0.23574 |
| Sr | 0.52369 * | −0.23672 | 0.34145 | −0.14206 | −0.07699 | 0.23022 | 0.20734 | 0.65652 * |
| Eigenvalue | 2.40605 | 1.99291 | 1.36017 | 0.856832 | 0.625241 | 0.488137 | 0.241364 | 0.0292975 |
| % variance | 30.076 | 24.911 | 17.002 | 10.71 | 7.8155 | 6.1017 | 3.0171 | 0.36622 |
| Cumulative Variance % | 30.076 | 54.987 | 71.989 | 82.699 | 90.5145 | 96.6162 | 99.6333 | 99.999 |
Publisher’s Note: MDPI stays neutral with regard to jurisdictional claims in published maps and institutional affiliations. |
© 2022 by the authors. Licensee MDPI, Basel, Switzerland. This article is an open access article distributed under the terms and conditions of the Creative Commons Attribution (CC BY) license (https://creativecommons.org/licenses/by/4.0/).
Share and Cite
Hossain, M.B.; Tanjin, F.; Rahman, M.S.; Yu, J.; Akhter, S.; Noman, M.A.; Sun, J. Metals Bioaccumulation in 15 Commonly Consumed Fishes from the Lower Meghna River and Adjacent Areas of Bangladesh and Associated Human Health Hazards. Toxics 2022, 10, 139. https://0-doi-org.brum.beds.ac.uk/10.3390/toxics10030139
Hossain MB, Tanjin F, Rahman MS, Yu J, Akhter S, Noman MA, Sun J. Metals Bioaccumulation in 15 Commonly Consumed Fishes from the Lower Meghna River and Adjacent Areas of Bangladesh and Associated Human Health Hazards. Toxics. 2022; 10(3):139. https://0-doi-org.brum.beds.ac.uk/10.3390/toxics10030139
Chicago/Turabian StyleHossain, Mohammad Belal, Fatema Tanjin, M. Safiur Rahman, Jimmy Yu, Shirin Akhter, Md Abu Noman, and Jun Sun. 2022. "Metals Bioaccumulation in 15 Commonly Consumed Fishes from the Lower Meghna River and Adjacent Areas of Bangladesh and Associated Human Health Hazards" Toxics 10, no. 3: 139. https://0-doi-org.brum.beds.ac.uk/10.3390/toxics10030139