Relationship between Motor Estimation Error and Physical Function in Patients with Parkinson’s Disease


Abstract
:1. Introduction
2. Materials and Methods
2.1. Participants
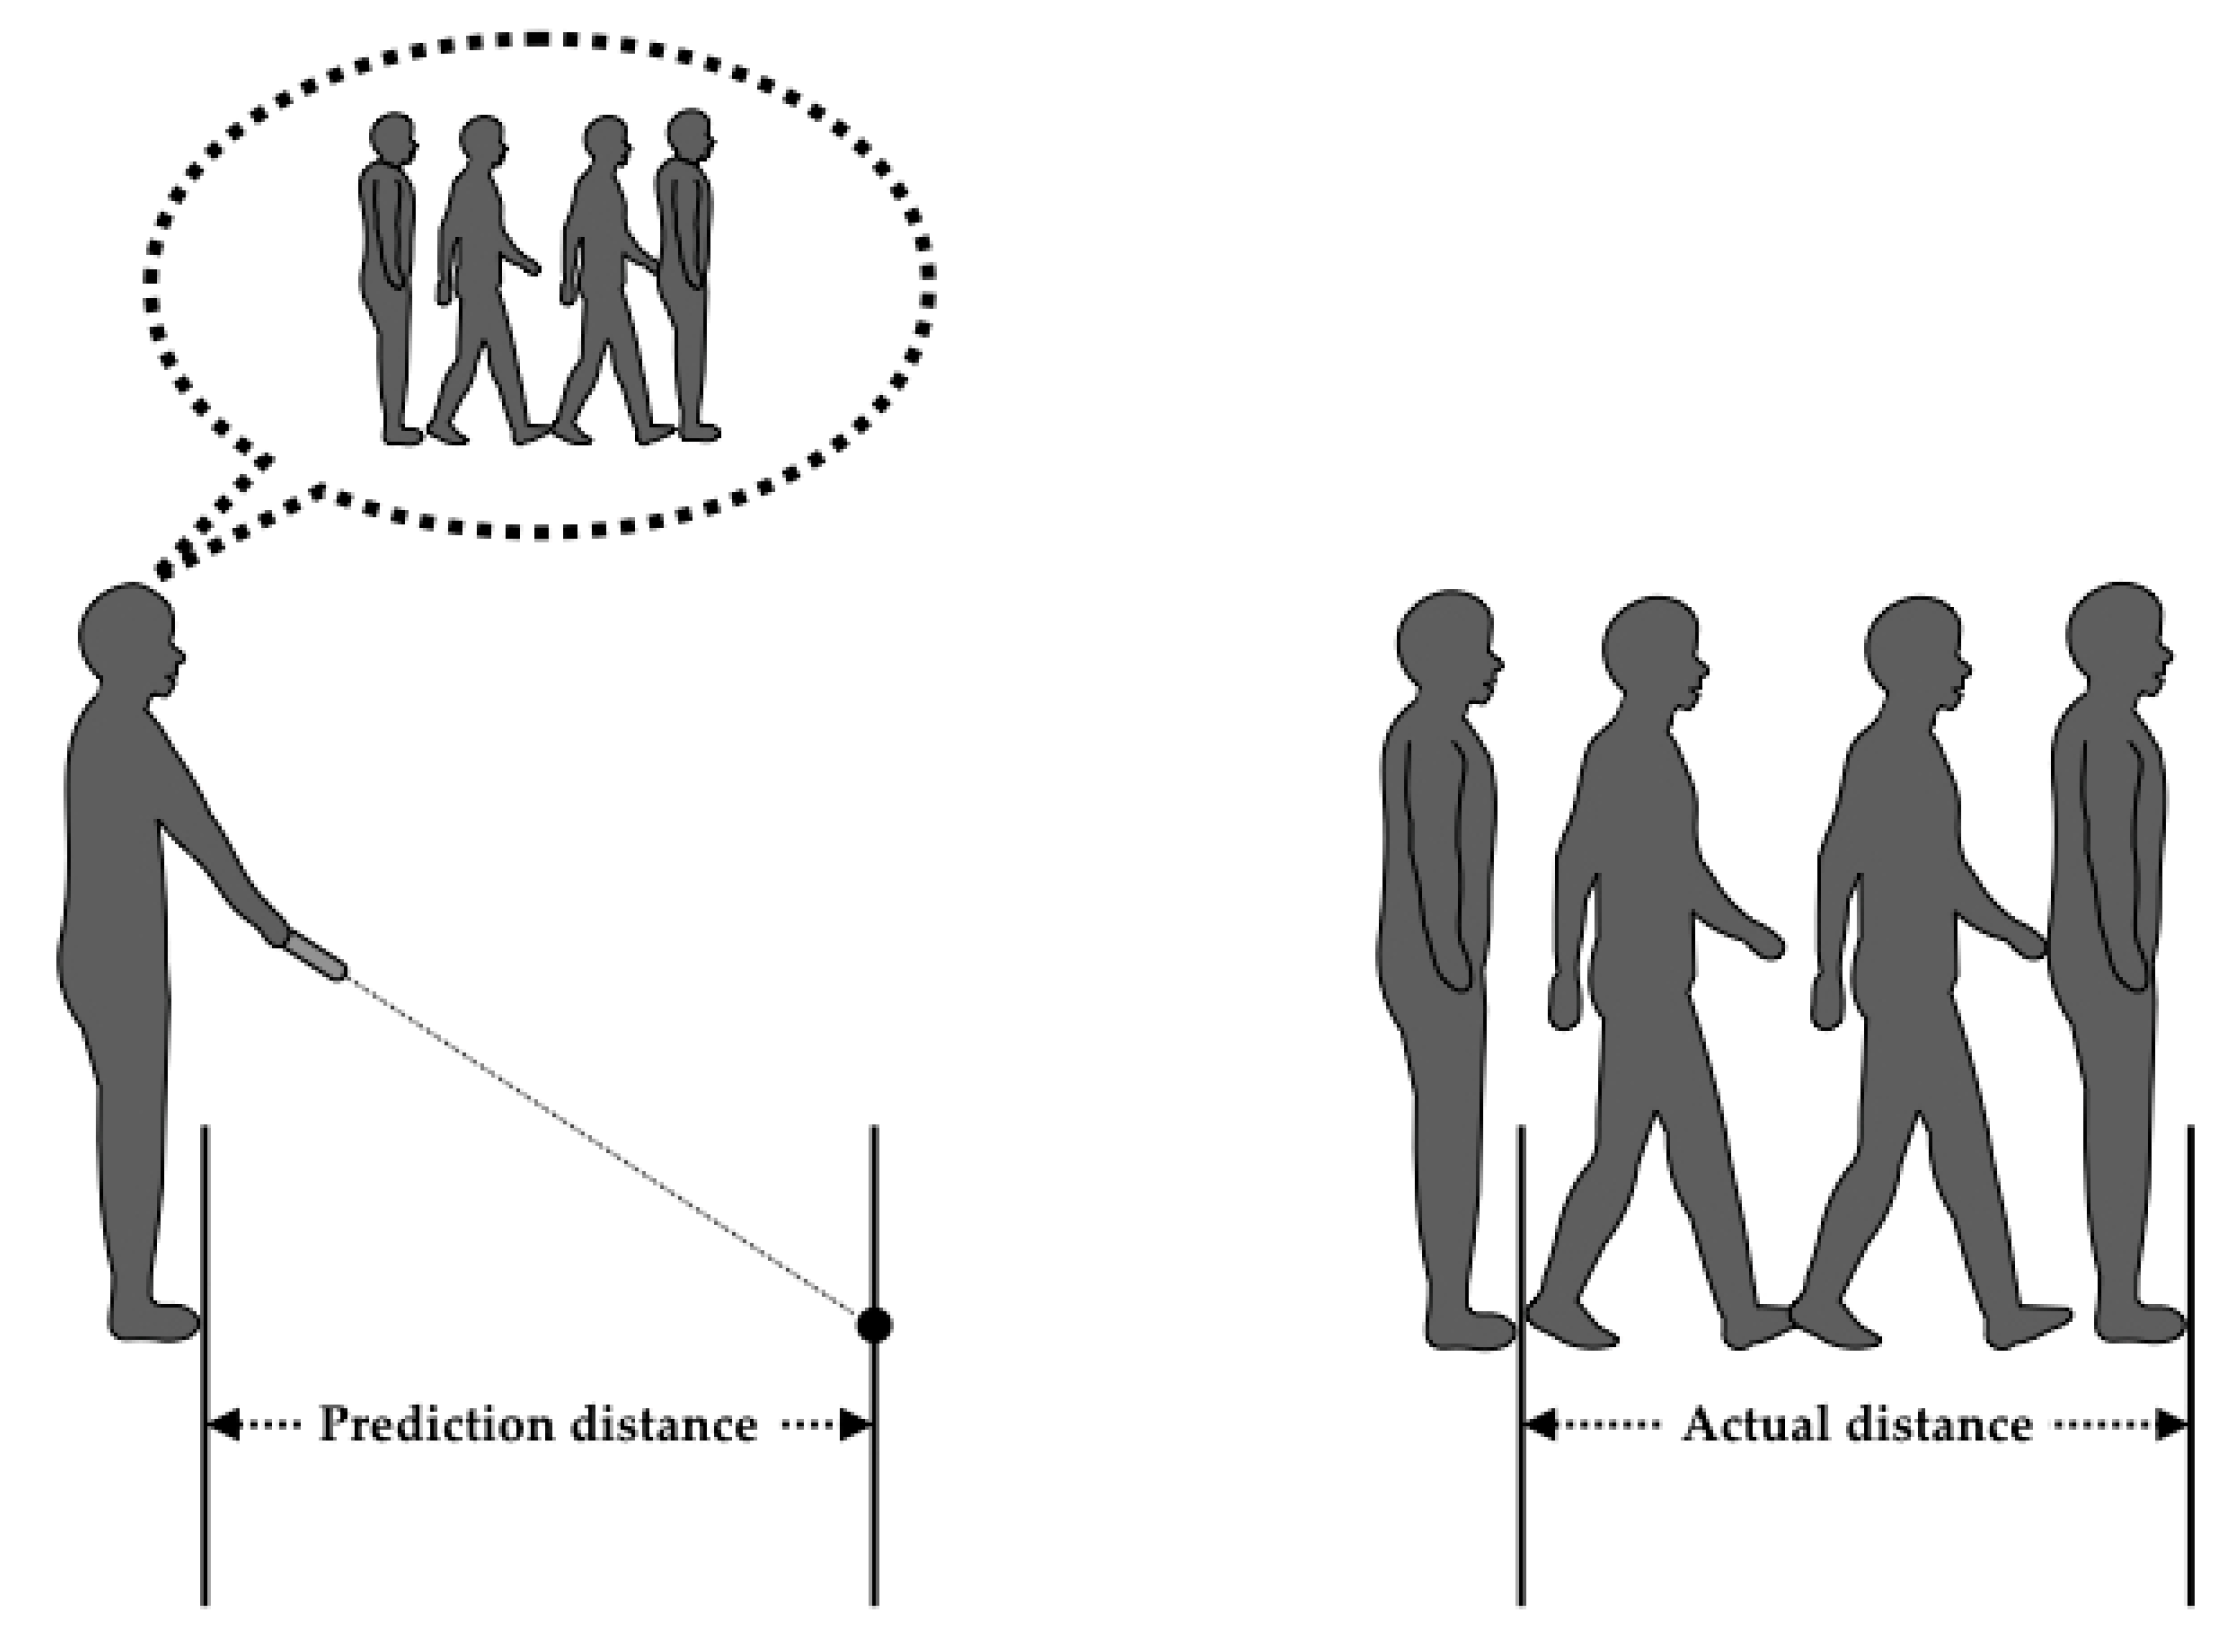
2.2. Procedure
3. Results
3.1. Comparison between Patients with PD and Elderly People with Disabilities
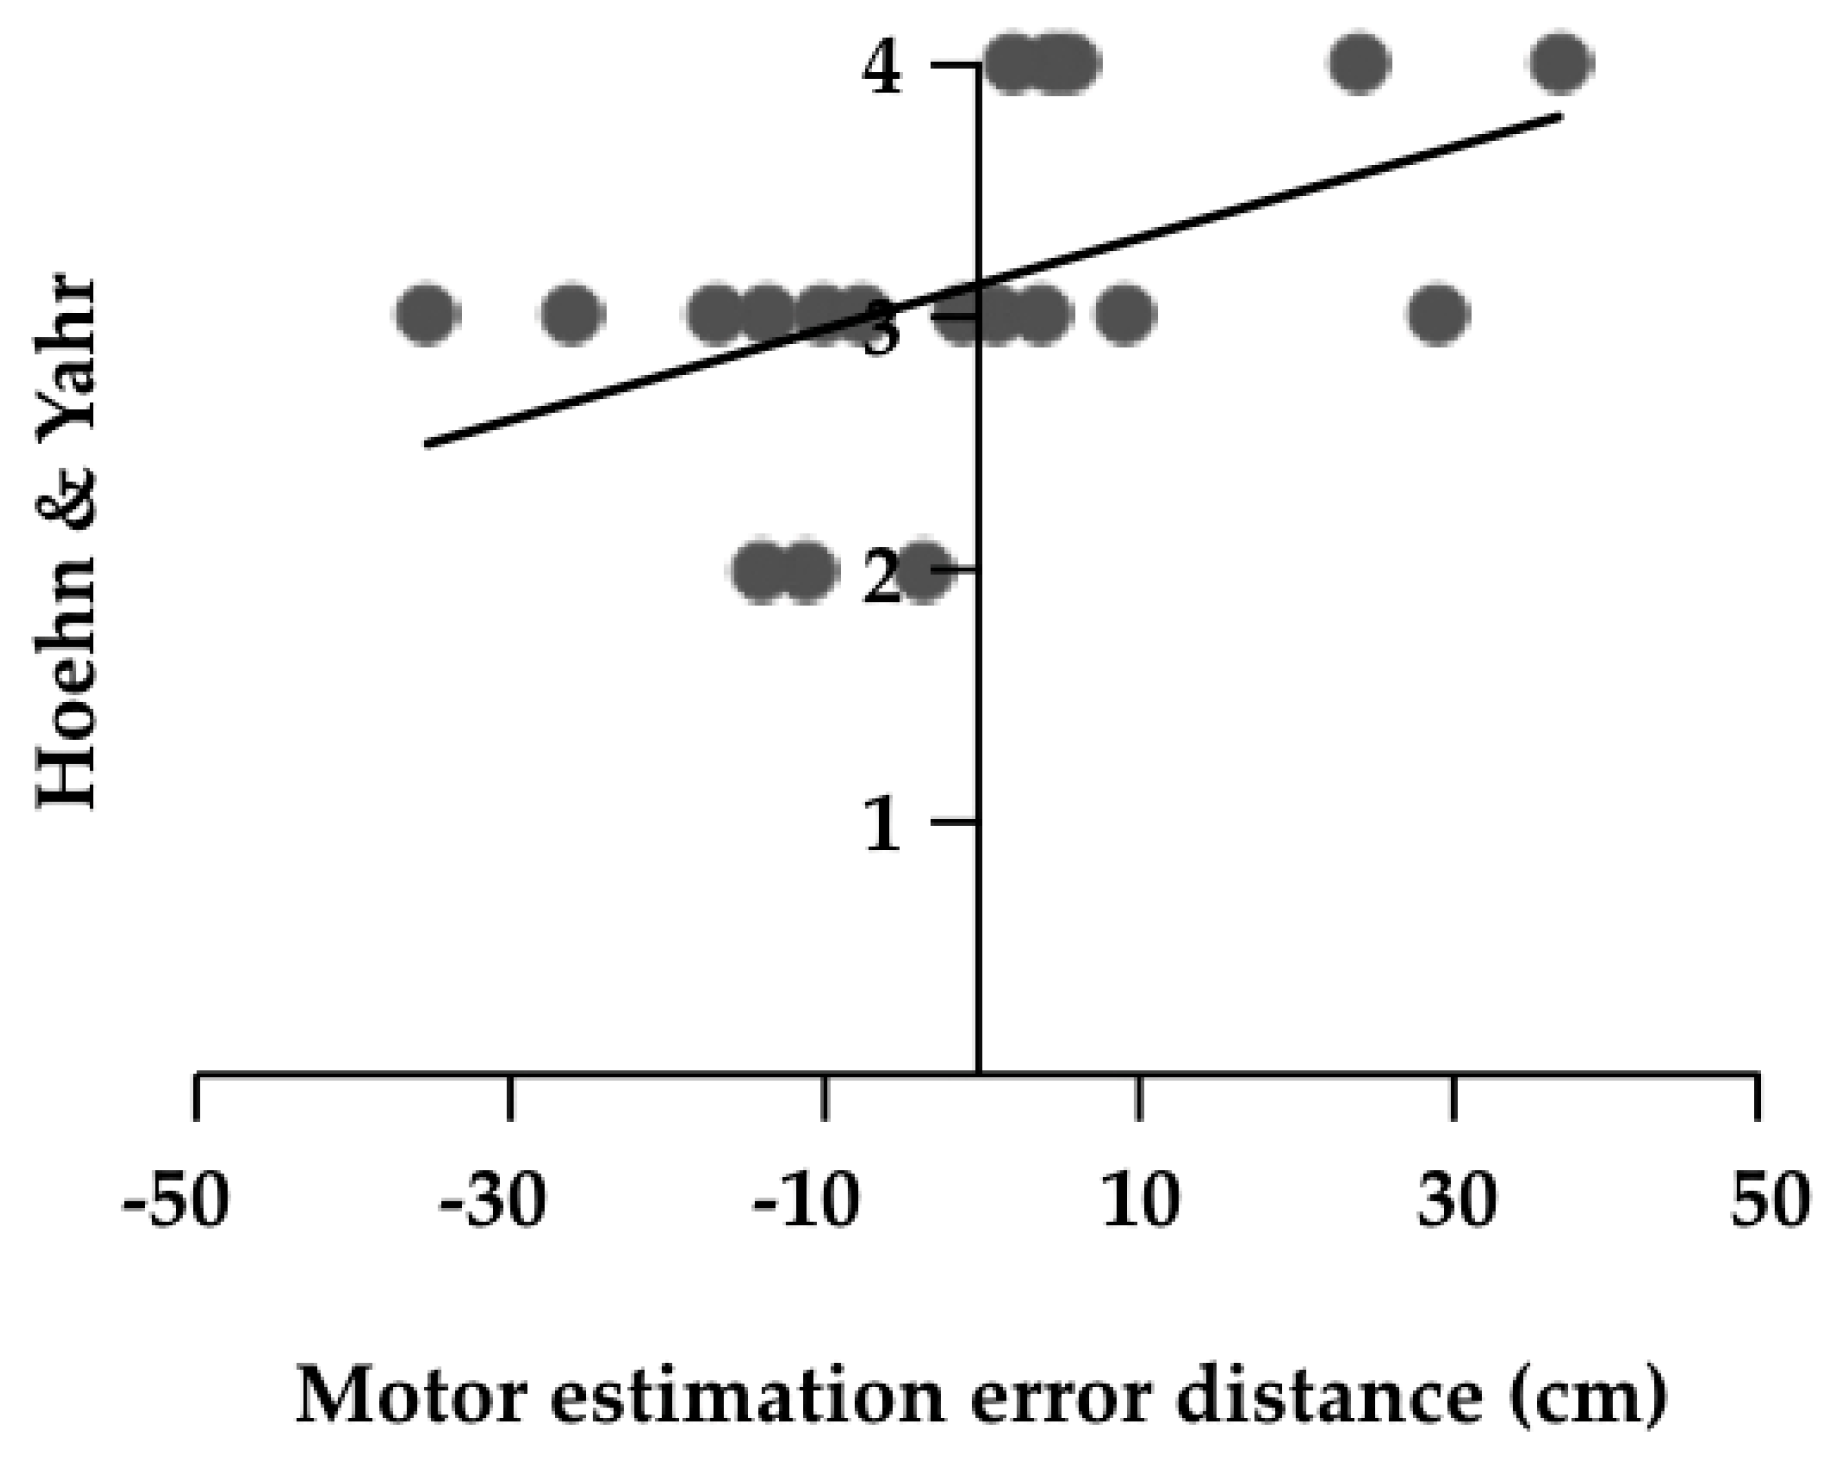
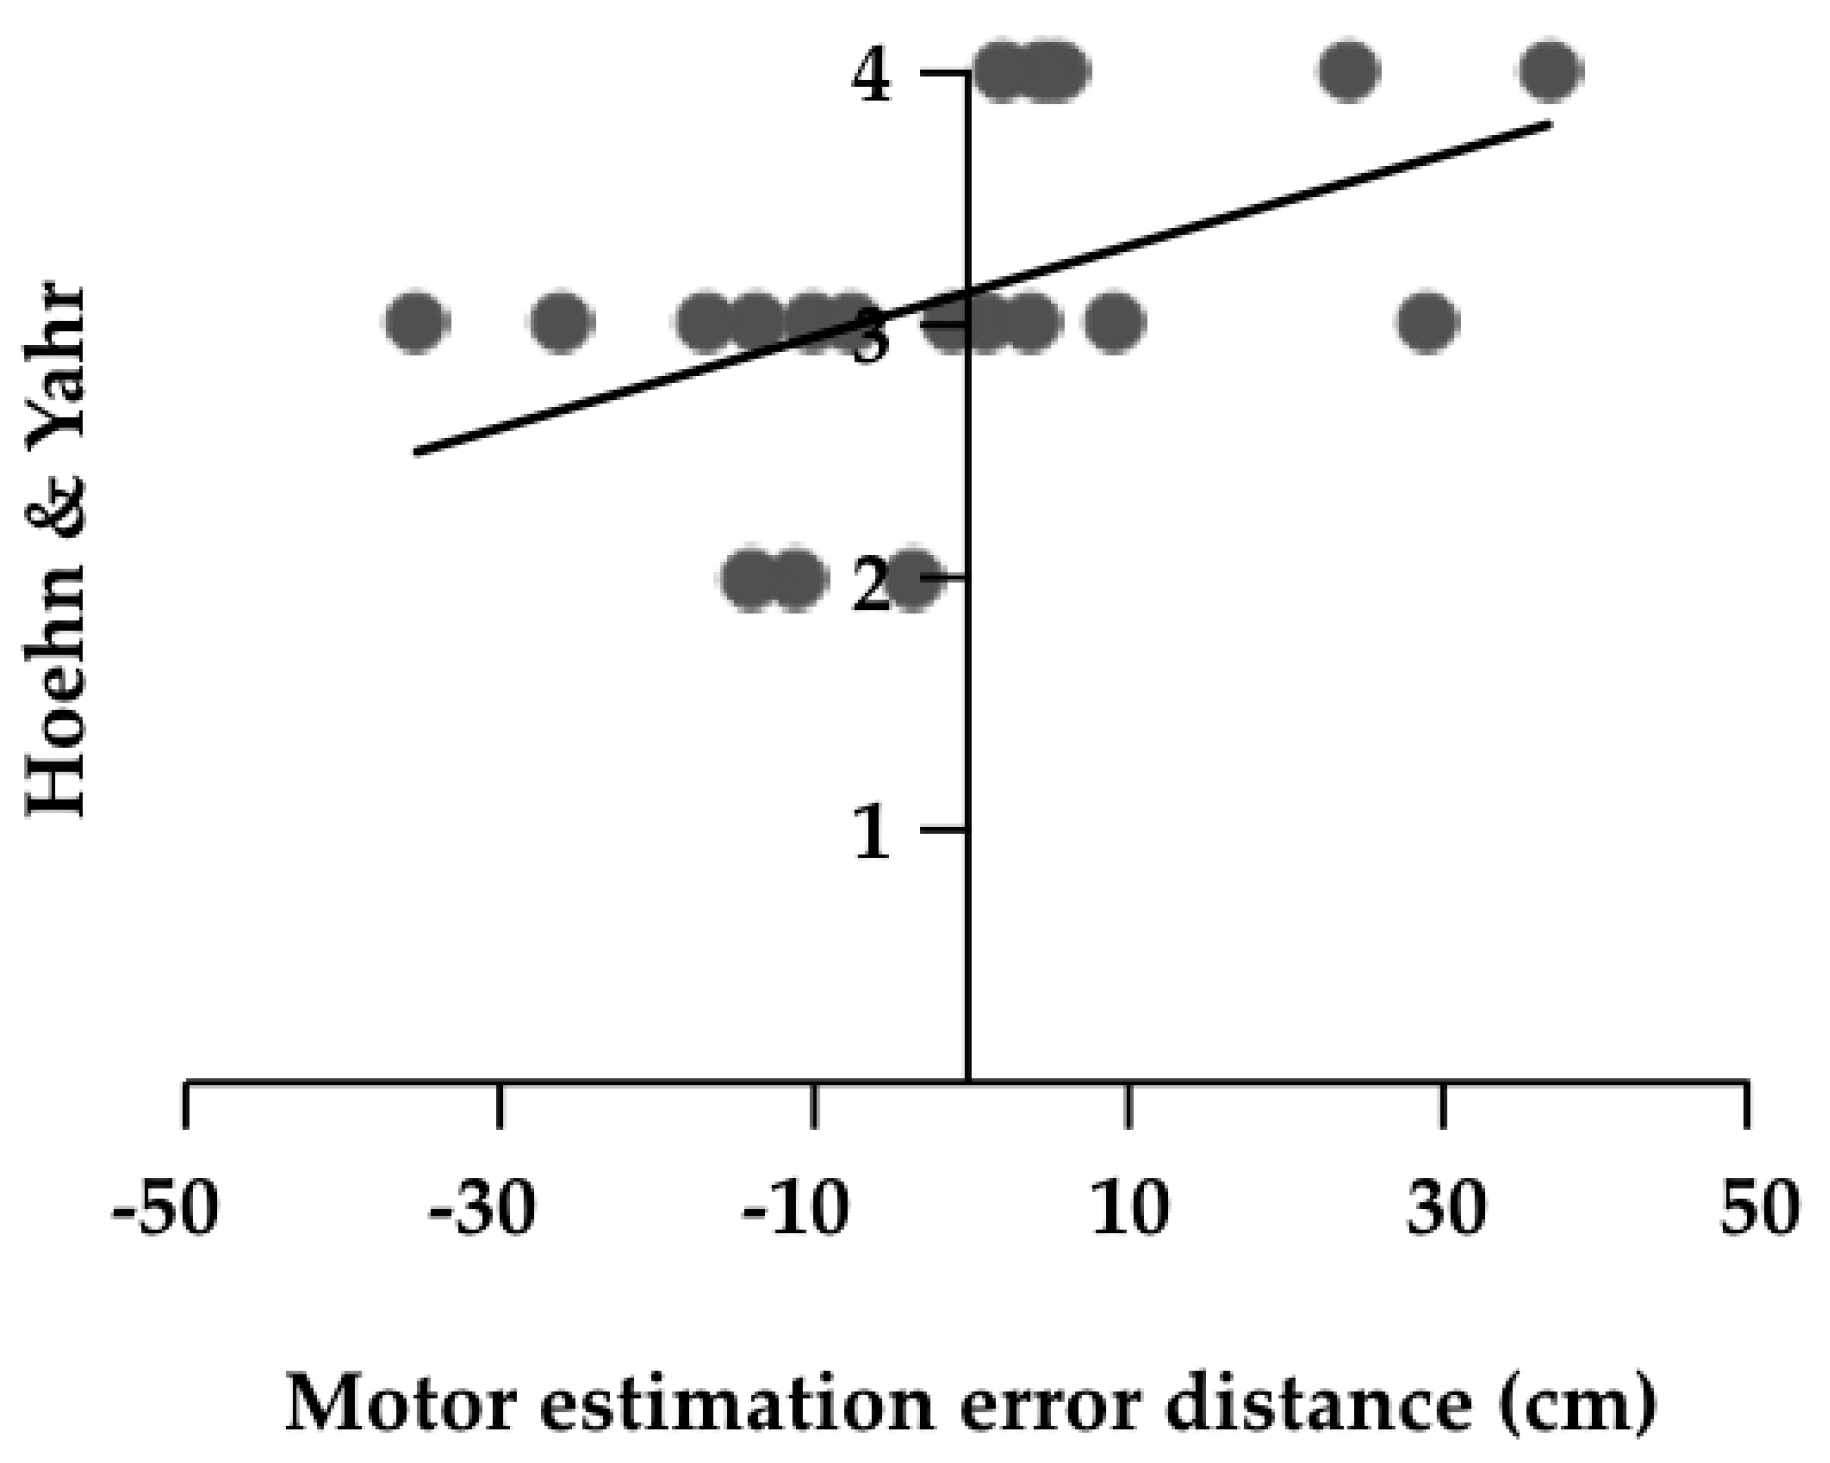
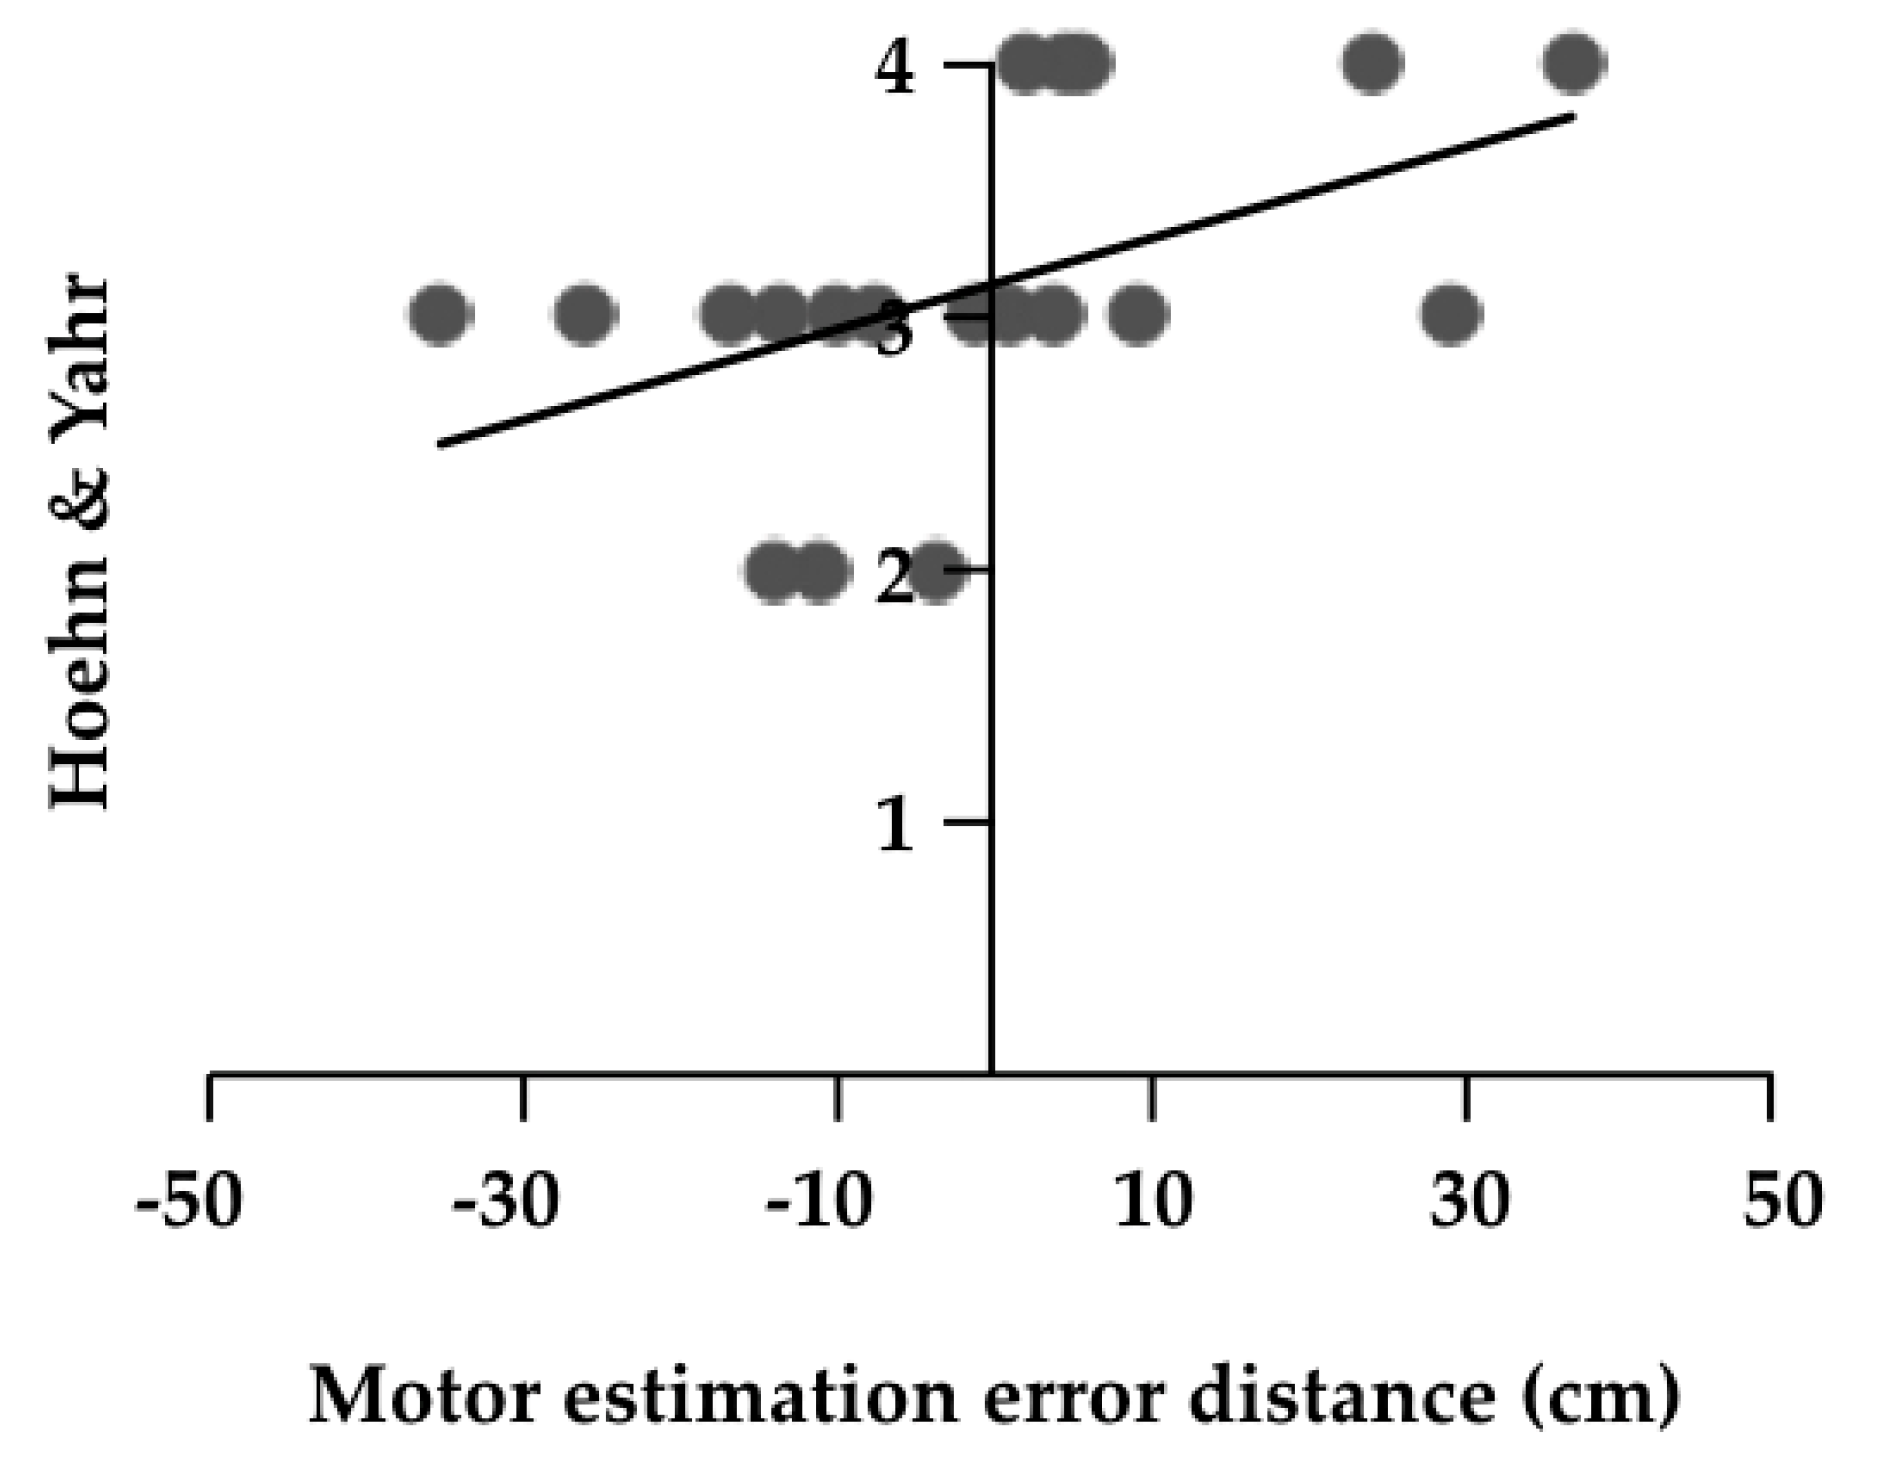
3.2. Relationship between Motor Estimation Error Distance and Clinical Variables in Patients with PD
4. Discussion
4.1. Motor Estimation Error Distance in Patients with PD and Elderly People
4.2. Relationship between Motor Estimation Error and Clinical Variables in Patients with PD
5. Conclusions
Author Contributions
Funding
Acknowledgments
Conflicts of Interest
References
- David, F.J.; Robichaud, J.A.; Leurgans, S.E.; Poon, C.; Kohrt, W.M.; Goldman, J.G.; Comella, C.L.; Vaillancourt, D.E.; Corcos, D.M. Exercise improves cognition in Parkinson’s disease: The PRET-PD randomized, clinical trial. Mov. Disord. 2015, 30, 1657–1663. [Google Scholar] [CrossRef] [PubMed] [Green Version]
- Kelly, N.A.; Ford, M.P.; Standaert, D.G.; Watts, R.L.; Bickel, C.S.; Moellering, D.R.; Tuggle, S.C.; Williams, J.Y.; Lieb, L.; Windham, S.T.; et al. Novel, high-intensity exercise prescription improves muscle mass, mitochondrial function, and physical capacity in individuals with Parkinson’s disease. J. Appl. Physiol. 2014, 116, 582–592. [Google Scholar] [CrossRef] [PubMed] [Green Version]
- Northey, J.M.; Cherbuin, N.; Pumpa, K.L.; Smee, D.J.; Rattray, B. Exercise interventions for cognitive function in adults older than 50: A systematic review with meta-analysis. Br. J. Sports Med. 2017, 52, 154–160. [Google Scholar] [CrossRef] [PubMed]
- Seppi, K.; Weintraub, D.; Coelho, M.; Perez-Lloret, S.; Fox, S.H.; Katzenschlager, R.; Hametner, E.M.; Poewe, W.; Rascol, O.; Goetz, C.G.; et al. The movement disorder society evidence-based medicine review update: Treatments for the non-motor symptoms of Parkinson’s disease. Mov. Disord. 2011, 3, S42–S80. [Google Scholar] [CrossRef] [PubMed]
- Heremans, E.; Feys, P.; Nieuwboer, A.; Vercruysse, S.; Vandenberghe, W.; Sharma, N.; Helsen, W. Motor imagery ability in patients with early and mid-stage Parkinson disease. Neurorehabil. Neural Repair. 2011, 25, 168–177. [Google Scholar] [CrossRef] [PubMed]
- Cohen, R.G.; Chao, A.; Nutt, J.G.; Horak, B. Freezing of gait is associated with a mismatch between motor imagery and motor execution in narrow doorways, not with failure to judge doorway pass ability. Neuropsychologia 2011, 49, 3981–3988. [Google Scholar] [CrossRef] [Green Version]
- Kamata, N.; Matsuo, Y.; Yoneda, T.; Shinohara, H.; Inoue, S.; Abe, K. Overestimation of stability limits leads to a high frequency of falls in patients with Parkinson’s disease. Clin. Rehabil. 2007, 21, 357–361. [Google Scholar] [CrossRef]
- Sakurai, R.; Fujiwara, Y.; Ishihara, M.; Higuchi, T.; Uchida, H.; Imanaka, K. Age-related self-overestimation of step-over ability in healthy older adults and its relationship to fall risk. BMC Geriatr. 2013, 13, 44. [Google Scholar] [CrossRef] [Green Version]
- Sakurai, R.; Fujiwara, Y.; Yasunaga, M.; Suzuki, H.; Sakuma, N.; Imanaka, K.; Montero-Odasso, M. Older adults with fear of falling show deficits in motor imagery of gait. J. Nutr. Health Aging 2017, 21, 721–726. [Google Scholar] [CrossRef]
- Robinovitch, S.N.; Cronin, T. Perception of postural limits in elderly nursing home and day care partici- pants. J. Gerontol. A Biol. Sci. Med. Sci. 1999, 54, 124–130. [Google Scholar] [CrossRef] [Green Version]
- Kawasaki, T.; Mikami, K.; Kamo, T.; Aoki, R.; Ishiguro, R.; Nakamura, H.; Tozawa, R.; Asada, N.; Hiiragi, Y.; Yamada, Y.; et al. Motor planning error in Parkinson’s disease and its clinical correlates. PLoS ONE 2018, 13, e0202228. [Google Scholar] [CrossRef] [PubMed]
- Baker, P.S.; Bodner, E.V.; Allman, R.M. Measuring life-space mobility in community dwelling older adults. J. Am. Geriatr. Soc. 2003, 51, 1610–1614. [Google Scholar] [CrossRef] [PubMed]
- Martínez-Martín, P.; Gil-Nagel, A.; Gracia, L.M.; Gόmez, J.B.; Martínez-Sarriés, J.; Bermejo, F. Unified Parkinson’s disease rating scale characteristics and structure. Mov. Disord. 1994, 9, 76–83. [Google Scholar] [CrossRef]
- Giladi, N.; Shabtai, H.; Simo, E.S.; Biran, S.; Tal, J.; Korczyn, A.D. Construction of freezing of gait questionnaire for patient with Parkinsonism. Parkinsonism Relat. Disord. 2000, 6, 165–170. [Google Scholar] [CrossRef]
- Tinetti, M.E.; Richman, D.; Powell, L. Falls efficacy as a measure of fear of falling. J. Gerontol. 1990, 45, 239–243. [Google Scholar] [CrossRef]
- Zigmond, A.S.; Snaith, R.P. The hospital anxiety and depression scale. Acta Psychiatr. Scand. 1983, 67, 361–370. [Google Scholar] [CrossRef] [Green Version]
- Ogata, T.; Muranaga, S.; Ishibashi, H.; Ohe, T.; Izumida, R.; Yoshimura, N.; Iwaya, T.; Nakamura, K. Development of a screening program to assess motor function in the adult population: A cross-sectional observational study. J. Orthop. Sci. 2015, 20, 888–895. [Google Scholar] [CrossRef] [Green Version]
- Avanzino, L.; Pelosin, E.; Martino, D.; Abbruzzese, G. Motor timing deficits in sequential movements in Parkinson disease are related to action planning: A motor imagery study. PLoS ONE 2013, 8, e75454. [Google Scholar] [CrossRef]
- Pickett, K.A.; Peterson, D.S.; Earhart, G.M. Motor imagery of gait tasks in individuals with Parkinson disease. J. Parkinsons Dis. 2012, 2, 19–22. [Google Scholar] [CrossRef] [Green Version]
- Peterson, D.S.; Pickett, K.A.; Earhart, G.M. Effects of levodopa on vividness of motor imagery in Parkinson disease. J. Parkinsons Dis. 2012, 2, 127–133. [Google Scholar] [CrossRef] [Green Version]
- Maki, B.E. Gait changes in older adults: Predictors of falls or indicators of fear. J. Am. Geriatr. Soc. 1997, 45, 313–320. [Google Scholar] [CrossRef] [PubMed]
- Maki, B.E.; Holliday, P.J.; Topper, A.K. Fear of falling and postural performance in the elderly. J. Gerontol. 1991, 46, M123–M131. [Google Scholar] [CrossRef] [PubMed]
- Delbaere, K.; Crombez, G.; Vanderstraeten, G.; Willems, T.; Cambier, D. Fear-related avoidance of activities, falls and physical frailty. A prospective community-based cohort study. Age Ageing 2004, 33, 368–373. [Google Scholar] [CrossRef] [PubMed] [Green Version]
- Mehdizadeh, M.; Martinez-Martin, P.; Habibi, S.A.; Nikbakht, N.; Alvandi, F.; Bazipoor, P.; Panahi, A.; Taghizadeh, G. The association of balance, fear of falling, and daily activities with drug phases and severity of disease in patients with Parkinson. Basic Clin. Neurosci. 2019, 10, 355–362. [Google Scholar] [CrossRef] [PubMed]


| Basic Characteristics | Patients with PD (n = 19) | Elderly People with Disabilities (n = 58) | p Value |
|---|---|---|---|
| Age (years) | 75.68 ± 8.26 | 77.40 ± 11.89 | 0.562 |
| Males/Females | 11/7 | 25/33 | 0.196 |
| Height (cm) | 155.30 ± 8.74 | 157.11 ± 10.46 | 0.499 |
| Weight (kg) | 51.29 ± 9.09 | 55.49 ± 11.78 | 0.160 |
| BMI (kg/m2) | 21.18 ± 2.75 | 22.40 ± 4.00 | 0.219 |
| H & Y | 3 (2–4) | - |
| Assessments | Patients with PD (n = 19) | Elderly People with Disabilities (n = 58) | p Value |
|---|---|---|---|
| Two-step distance (cm) | 96.74 ± 34.73 | 100.26 ± 40.42 | 0.734 |
| Two-step value | 0.62 ± 0.21 | 1.09 ± 0.86 | 0.022 * |
| Two-step predicted distance (cm) | 95.68 ± 38.11 | 102.18 ± 44.30 | 0.575 |
| Motor estimation error distance (cm) | −1.06 ± 18.09 | 1.91 ± 24.34 | 0.627 |
| Error rate (%) | 15.76 ± 12.63 | 18.31 ± 18.74 | 0.582 |
| FRT (cm) | 18.74 ± 6.55 | 18.01 ± 6.61 | 0.679 |
| LSA (points) | 39.00 ± 28.74 | 30.68 ± 21.53 | 0.184 |
| UPDRS part I (points) | 1.36 ± 1.77 | - | - |
| UPDRS part II (points) | 11.05 ± 8.06 | - | - |
| UPDRS part III (points) | 13.63 ± 10.13 | - | - |
| UPDRS part IV (points) | 3.31 ± 3.11 | - | - |
| UPDRS total (points) | 29.36 ± 19.57 | - | - |
| FOGQ (points) | 10.05 ± 5.99 | - | - |
| L-dopa dose (mg/day) | 435.76 ± 282.54 | - | - |
| FES (points) | 26.00 ± 8.32 | - | - |
| HADS anxiety (points) | 2.83 ± 2.73 | - | - |
| HADS depression (points) | 5.39 ± 4.79 | - | - |
| Assessments | Assessments | Correlation Coefficient | p Value |
|---|---|---|---|
| Two-step distance | Two-step value | 0.983 | 0.001 |
| Two-step predicted distance | 0.881 | 0.001 | |
| FRT | 0.469 | 0.043 | |
| LSA | 0.628 | 0.004 | |
| Two-step value | Two-step predicted distance | 0.902 | 0.001 |
| LSA | 0.562 | 0.012 | |
| Two-step predicted distance | LSA | 0.692 | 0.001 |
| H & Y | 0.469 | 0.043 | |
| Motor estimation error distance | H & Y | 0.580 | 0.009 |
| UPDRS part II | 0.469 | 0.049 | |
| Error rate | FES | −0.470 | 0.042 |
| FRT | FES | 0.522 | 0.022 |
| LSA | FES | 0.585 | 0.009 |
| UPDRS part II | UPDRS part III | 0.851 | 0.001 |
| UPDRS total | 0.926 | 0.001 | |
| FOGQ | 0.555 | 0.014 | |
| FES | −0.482 | 0.037 | |
| UPDRS part III | UPDRS part IV | 0.499 | 0.030 |
| UPDRS total | 0.962 | 0.001 | |
| FES | −0.508 | 0.026 | |
| UPDRS part IV | UPDRS total | 0.594 | 0.007 |
| FOGQ | 0.544 | 0.016 | |
| L-dopa dose | 0.727 | 0.001 | |
| HADS anxiety | 0.798 | 0.001 | |
| UPDRS total | FOGQ | 0.583 | 0.009 |
| L-dopa dose | 0.504 | 0.028 | |
| FES | −0.517 | 0.023 | |
| HADS anxiety | 0.507 | 0.027 | |
| FOGQ | L-dopa dose | 0.467 | 0.044 |
| L-dopa dose | HADS anxiety | 0.686 | 0.001 |
© 2020 by the authors. Licensee MDPI, Basel, Switzerland. This article is an open access article distributed under the terms and conditions of the Creative Commons Attribution (CC BY) license (http://creativecommons.org/licenses/by/4.0/).
Share and Cite
Sakai, K.; Kawasaki, T.; Ikeda, Y.; Tominaga, K.; Kurihara, K. Relationship between Motor Estimation Error and Physical Function in Patients with Parkinson’s Disease. Medicines 2020, 7, 43. https://0-doi-org.brum.beds.ac.uk/10.3390/medicines7080043
Sakai K, Kawasaki T, Ikeda Y, Tominaga K, Kurihara K. Relationship between Motor Estimation Error and Physical Function in Patients with Parkinson’s Disease. Medicines. 2020; 7(8):43. https://0-doi-org.brum.beds.ac.uk/10.3390/medicines7080043
Chicago/Turabian StyleSakai, Katsuya, Tsubasa Kawasaki, Yumi Ikeda, Keita Tominaga, and Kohei Kurihara. 2020. "Relationship between Motor Estimation Error and Physical Function in Patients with Parkinson’s Disease" Medicines 7, no. 8: 43. https://0-doi-org.brum.beds.ac.uk/10.3390/medicines7080043