Article

Factors That Determine the Adhesive Strength in a Bioinspired Bone Tissue Adhesive

1
Applied Material Science, Department of Engineering, Uppsala University, 75121 Uppsala, Sweden
2
Department of Orthopaedics, Sahlgrenska University Hospital Gothenburg/Mölndal, 43180 Mölndal, Sweden
3
Institute of Clinical Sciences, Sahlgrenska Academy, University of Gothenburg, 40530 Gothenburg, Sweden
*
Author to whom correspondence should be addressed.
Submission received: 4 February 2020 / Revised: 18 March 2020 / Accepted: 20 March 2020 / Published: 21 March 2020

Abstract

:
Phosphoserine-modified cements (PMCs) are a family of wet-field tissue adhesives that bond strongly to bone and biomaterials. The present study evaluated variations in the adhesive strength using a scatter plot, failure mode, and a regression analysis of eleven factors. All single-factor, continuous-variable correlations were poor (R2 < 0.25). The linear regression model explained 31.6% of variation in adhesive strength (R2 = 0.316 p < 0.001), with bond thickness predicting an 8.5% reduction in strength per 100 μm increase. Interestingly, PMC adhesive strength was insensitive to surface roughness (Sa 1.27–2.17 μm) and the unevenness (skew) of the adhesive bond (p > 0.167, 0.171, ANOVA). Bone glued in conditions mimicking the operating theatre (e.g., the rapid fixation and minimal fixation force in fluids) produced comparable adhesive strength in laboratory conditions (2.44 vs. 1.96 MPa, p > 0.986). The failure mode correlated strongly with the adhesive strength; low strength PMCs (<1 MPa) failed cohesively, while high strength (>2 MPa) PMCs failed adhesively. Failure occurred at the interface between the amorphous surface layer and the PMC bulk. PMC bonding is sufficient for clinical application, allowing for a wide tolerance in performance conditions while maintaining a minimal bond strength of 1.5–2 MPa to cortical bone and metal surfaces.

Graphical Abstract

1. Introduction

A number of adhesives have been proposed for tissue reconstruction. Aside from non-degradable adhesives [1], most biocompatible and biodegradable tissue adhesives utilize crosslinking mechanisms inspired by natural (marine) adhesives. The most common approach to creating adhesion is to incorporate a modified amino acid, L-DOPA (e.g., as a pendant group, onto a polymer) [2,3]. Coacervation and nanoscale electrostatic interactions are also sufficient to create relatively strong tissue adhesion [4,5,6,7]. Recently, strong adhesion has been created in biomaterials that are not adhesive (bioceramics) by incorporating a modified amino acid (phosphoserine) [8,9,10]. Phosphoserine-modified cements (PMCs) display a unique microstructure, appearing amorphous rather than crystalline [10], can stabilize bioactive phases and remodel into precursors of hydroxyapatite [11], and display significantly improved healing, compared to unmodified cements [12,13,14,15]. PMCs are particularly suited for hard tissue applications, with a stronger compressive and (adhesive) shear strength than human cancellous bone [10,16], because they remodel into bone in vivo [10,12,13,14]. Prior in vivo studies have demonstrated that PMCs are safe (no adverse reactions) and readily remodel into bone [8,12,13,14]. Therefore, the focus of the present study was the physical (e.g., bond strength), rather than biological properties of PMCs.
To achieve reproducible adhesive strength in the laboratory many factors must be accounted for: bond thickness, applied load during curing, displacement speed during testing, cure time, and cure conditions (e.g., humidity), etc. [17,18,19,20,21]. Bone tissue reconstruction is particularly challenging, as bone fracture surfaces are uneven, unpolished, and covered in blood, fat and other fluids that typically interfere with adhesive curing [22]. Numerous studies have investigated how adhesive strength is affected by sources of bond failure in structural and industrial adhesives and, less often, for tissue adhesives [17,18,19,23]. The various studies investigating novel bone adhesives use differing cure conditions, applied load during curing, rarely investigate the adherend (tissue) surface properties [24], and do not report the setting/curing time of the formulation, or the adhesive bond thickness [25,26,27,28]. As in the field of dental resins [29], bone tissue adhesive research requires a standardized test method and sample preparation conditions, particularly because no predicates exist, that allow for (a) reproducible laboratory results; (b) a meaningful correlation between in vitro results and adhesive strength when used in vivo (predictive value); and (c) an exploratory investigation into alternative chemistries and chemical analogues that may improve bonding, at the risk of increased complexity in the testing regimen (e.g., changes in pKa, solubility/solvation/dissolution rate, nanoscale surface interactions, etc.) [30].
There is a mismatch between the requirements for optimal laboratory test performance of a bone adhesive, and its clinical requirements under more unpredictable surgical conditions. In the operating theatre other decisive factors, such as the mixing and delivery method, curing conditions, and handling properties are more critical than the “theoretical” laboratory adhesive strength [29,31]. Surgeons would require a tissue adhesive to cure rapidly (1–3 min), and reliably between uneven and variably porous fracture surfaces, in the presence of physiological fluids, with minimal pressure applied by the surgeon (300 g or 3 N) during fixation/ reconstruction to produce a thin, even bond line [22]. At present, surgeons do not have access to a bone adhesive, which has received regulatory approval for clinical use, against which to benchmark user needs. In laboratory testing of the surface properties (e.g., surface roughness) of the adherend, the sample preparation conditions (e.g., curing in liquids) and bond thickness are critical parameters that are rigorously controlled [29,32]. Both laboratory and clinical testing conditions are designed to produce and evaluate adhesive strength; not to identify mechanisms and chemistry underlying adhesion. An entirely distinct range of test conditions are needed to correctly identify what creates adhesion, while also taking into account washout, reaction speed, solubility, pKa, etc. [30].
Two factors, known to contribute to bond failure, have been studied extensively in synthetic adhesives: adhesive bond layer thickness, and adherend surface properties (roughness). An increase in surface roughness increases the available surface area for adhesive bonding and increases the surface energy and wettability, though excessively high roughness can lead to stress concentration and an increased likelihood of defects [19]. Increases in bond thickness can improve toughness and adhesive strength via increased volume available for load dissipation, though [19], more often, thicker bond lines increase the likelihood of failure via increased probability of defects or cracks, bending, and interfacial stress between the different layers of the adhesive (e.g., surface “adhesive zone layer”, “hybrid” layers if the adhesive penetrates into the adherend surface, cohesive bulk, or the interlayer(s) between the surface and bulk layers) [18,19,23,33]. For clarity, the term “adhesive interface” will be avoided as it is unclear whether this refers to the interface between the adherend surface and the adhesive surface (hereafter referred to as the adhesive zone layer) or the interface between the surface layer and bulk of the PMC. These factors are difficult to control in biological adhesives and, therefore, are not often investigated. The only attempts to identify different sources of variability in adhesive bonding, for tissue adhesives, have been conducted in dental adhesives (resins) [33].
On the molecular level, the bond strength of an adhesive reflects a compromise between: (a) the adhesive strength, where adhesive failure occurs via load dissipation between the adhesive and adherend surfaces (e.g., deformation of bonds between poly-methyl methacrylate (PMMA) and a metal or tissue surface (physical interlocking and van der Waals’ interactions)) [34,35]; and (b) the cohesive strength of the polymeric matrix (e.g., crosslinking density), or between the matrix/binder and other phases (e.g., in asphalt) [36]. In a shear test, the source of adhesive strength, between polymer and metal surfaces, is predominantly adsorption (wetting) and mechanical interlock [34]. Adsorption and mechanical interlock are also likely to explain much of PMC adhesion to biological surfaces, though ionic bonding (chelation and coordination), surface interpenetration, and additional contributions from the ceramic phase are also possible.
The mechanical properties of PMCs have been well described [8,10]. In contrast, PMC adhesive strength has not been investigated under varied test conditions, and in situations mirroring clinical complications (e.g., very uneven adhesive bond thickness). Thus far, no studies have investigated how (PMC) adhesive strength is affected by different curing, and handling conditions (e.g., laboratory testing versus conditions for clinical use). The purpose of this study was to (a) to identify which factors contribute to the adhesive strength of PMCs, (b) to lay the foundation for subsequent exploratory studies into the mechanisms underlying the adhesion of PMCs, and to identify how to increase the adhesive strength by c) bridging disparate test conditions, thereby allowing for comparisons/predictions on how PMC behaves in both the laboratory and the clinic.

2. Materials and Methods

2.1. Materials

Unless otherwise indicated, all materials were purchased from Sigma-Aldrich (AB Sigma-Aldrich, Stockholm, Sweden). O-phospho-L-serine (phosphoserine) was purchased from Flamma SpA (>95%, Flamma SpA, Bergamo, Italy). Alpha tricalcium phosphate (αTCP, Ca3(PO4)2) was synthesized as described previously [9,10]. Palacos, a clinical poly-methyl methacrylate (PMMA) was obtained from Heraeus Kulzer (Medical GmbH, Hanau, Germany). Silicon carbide polishing paper was purchased from Streurs (Struers A/S, Bromma, Denmark) in 80, 320 and 1200 grit (US).

2.2. Material Characterization and Sample Preparation

The powders used for making PMC samples have been previously characterized [9,10]. Alpha tricalcium phosphate (αTCP,) powder was synthesized as previously described. Briefly, alpha tricalcium phosphate (Ca3(PO4)2) was synthesized by heating (Carbolyte oven CWF1300, AB Ninolab, Stockholm, Sweden) monocalcium phosphate anhydrous (MCPA) and calcium carbonate, at a 2:1 molar ratio on a zirconia setter plate at 1450 °C for 12 h. αTCP powder was dry milled (Reitsch PM400, AB Ninolab, Stockholm, Sweden) in a 500-mL zirconia milling jar, at 300 RPM for 15 min, with 100 g of powder per 100 zirconia milling balls (10 mm diameter).
The particle size was determined by laser diffraction, on 0.2 g of powder in 15 mL of isopropanol dispersed with sonication (Elmasonic S50R, Elma Schmidbauer, Singen, Germany) for 5 min. Approximately 7.5 mL was loaded (obscuration of 10–20%) into a Mastersizer 3000, with a hydroEV wet dispersion unit (Malvern Instruments Nordic AB, Uppsala, Sweden). The values 0.1, 1.63, and 1.39 were used for the particle absorption index, refractive index, and dispersant refractive index, respectively. The particle size data were analyzed with software provided by the manufacturer (Mastersizer 3000, version 3.5). The x-ray diffractograms (XRD) of powder samples were obtained on a Bruker D800 advance (Bruker Daltonics Scandinavia AB, Solna, Sweden), with a step size of 0.03 degrees per step, from 3 to 60 degrees. The phase composition was determined using Rietveld refinement on Profex software (https://profex.doebelin.org), with the following references: PDF# 04-010-4348 αTCP; #01-074-0565 hydroxyapatite, #04-008-8714 βTCP.
Steel and aluminum cubes (1 cm3) were prepared at the Uppsala University workshop, by cutting steel or aluminum rods to a height of 1.1 mm, and polishing the surface to 1.0 mm, with USA80 grit roughness. Aluminum cubes were fabricated using an identical process, with cube surfaces polished to either US #80, 320, or 1200 grit roughness. Fresh adult bovine bone was obtained from Lovstakott (Uppsala, Sweden), with approval from the department of agriculture. Cortical tissue from bovine humeral diaphyseal shaft was cut into cubes (1 cm3), using a bone band saw (IMEB Inc., USA) and a diamond blade, and stored in phosphate-buffered saline at −20 °C. The surfaces of the cortical cubes were not polished further and were used as obtained from the diamond blade. The surface roughness was not determined for cortical cubes, as this was not the focus for testing on biological/tissue samples.
Metal cube surface roughness was determined with a Zygo Nexview NX2 optical profiler (Middlefield, CT, USA). A 10× magnification lens, 0.5× zoom (field of view), was used in CSI measurement mode, with high dynamic range (HDR) enabled, and signal oversampling. The data were analyzed with Zygo Mx software. Each surface was partitioned into 64 zones (1.68 × 1.68 mm in total), and 4 evenly dispersed zones were selected for testing from 3 cubes, for each group. The following parameters were recorded: Sa (arithmetic mean), Sq (root-mean square height), Sku (kurtosis, sharpness), and a 2D roughness measurement (Ra, arithmetic mean) traversing the diagonal of the 4 zones, for each cube.
Adhesive (shear) samples were prepared by mixing a total sample size of 0.375 g of PMC, comprising (αTCP: phosphoserine): 0.3 g:0.075 g (27% mole); 0.2325 g:0.1425 g (50% mole); 0.1575 g:0.2175 g (70% mole); 0.0563 g:0.3188 g (90% mole); with 75 uL of deionized water (liquid to powder ratio of 0.2 mL·g−1). All samples were prepared at 22.1 °C, in 30% relative humidity (ambient conditions). After mixing with a spatula for 25–30 s, or a cap shaker (ESPE Capmix; 3M ESPE AG, Seefeld, Germany) for 2 s, 0.1 g was applied to each cube surface, and the cubes were fixated with an applied force (3 N or 31 N) for 1 min, 5 min, or 24 h. All shear samples were allowed to cure/set for 5 min at ambient conditions before exposure to a defined curing environment (100% relative humidity, water, or phosphate-buffered saline (PBS)) for 24 h, at 37 °C, unless otherwise indicated. PMMA (shear) samples were prepared per the manufacturer instructions; briefly, 400 mg of powder and 200 uL of liquid were mixed manually for 25 s, and 0.15 g was applied to the cube surface. Each sample was fixated with universal grips (31 N) and cured for 5 min in ambient conditions, before transferring to cure in PBS for 24 h, at 37 °C.
The fixation force, during curing, was applied via Cocraft universal spring grips (Clas Ohlson, Uppsala, Sweden) with an average grip force of 31 N, or with 300-g weights (3 N). The average grip force of 16 individual grips was measured with a Futek UB250 button load cell (250 N max load). The average bond thickness was calculated by measuring the height of each four corners of the test cubes with digital calipers. Each metal cube was etched with a cube number for tracking purposes. To determine the average thickness of the adhesive bond (tave): the total height of each of the four corners of the glued cube pair (h1–2) was measured and the height of each individual corner was subtracted (e.g., for a pair of glued cubes, 1 (h1) and 2 (h2), the height of the 1st (h1) corner of the top cube, and the opposing 4th (h4) corner of the bottom cube were measured) (Equation (1)).
t a v e = 1 4 ( h 1 4 1 2 ( h 1 1 + h 4 2 ) ) + h 2 3 1 2 h 2 1 + h 3 2 + h 3 2 1 2 h 3 1 + h 2 2 + h 4 1 1 2 h 4 1 + h 1 2
The sum of the measured bond thicknesses at each corner was averaged. One of the four surfaces, adjacent to the bond line, was etched to orient each cube pair. The bond skew (k) was calculated by normalizing the difference, between the thickest and thinnest bond, to the average bond thickness for a given sample (Equation (2)), where the average thickness is as follows:
k = ( ( T m a x T m i n ) / T a v e ) × 100 %
After testing, each cube surface was cleaned with 0.5 M citric acid (5 min, sonicated), followed by washing with deionized water (5 min, sonicated). All raw data images were rescaled to 600DPI resolution using Gimp software.

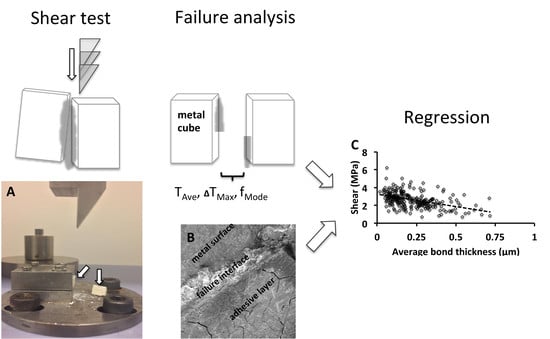
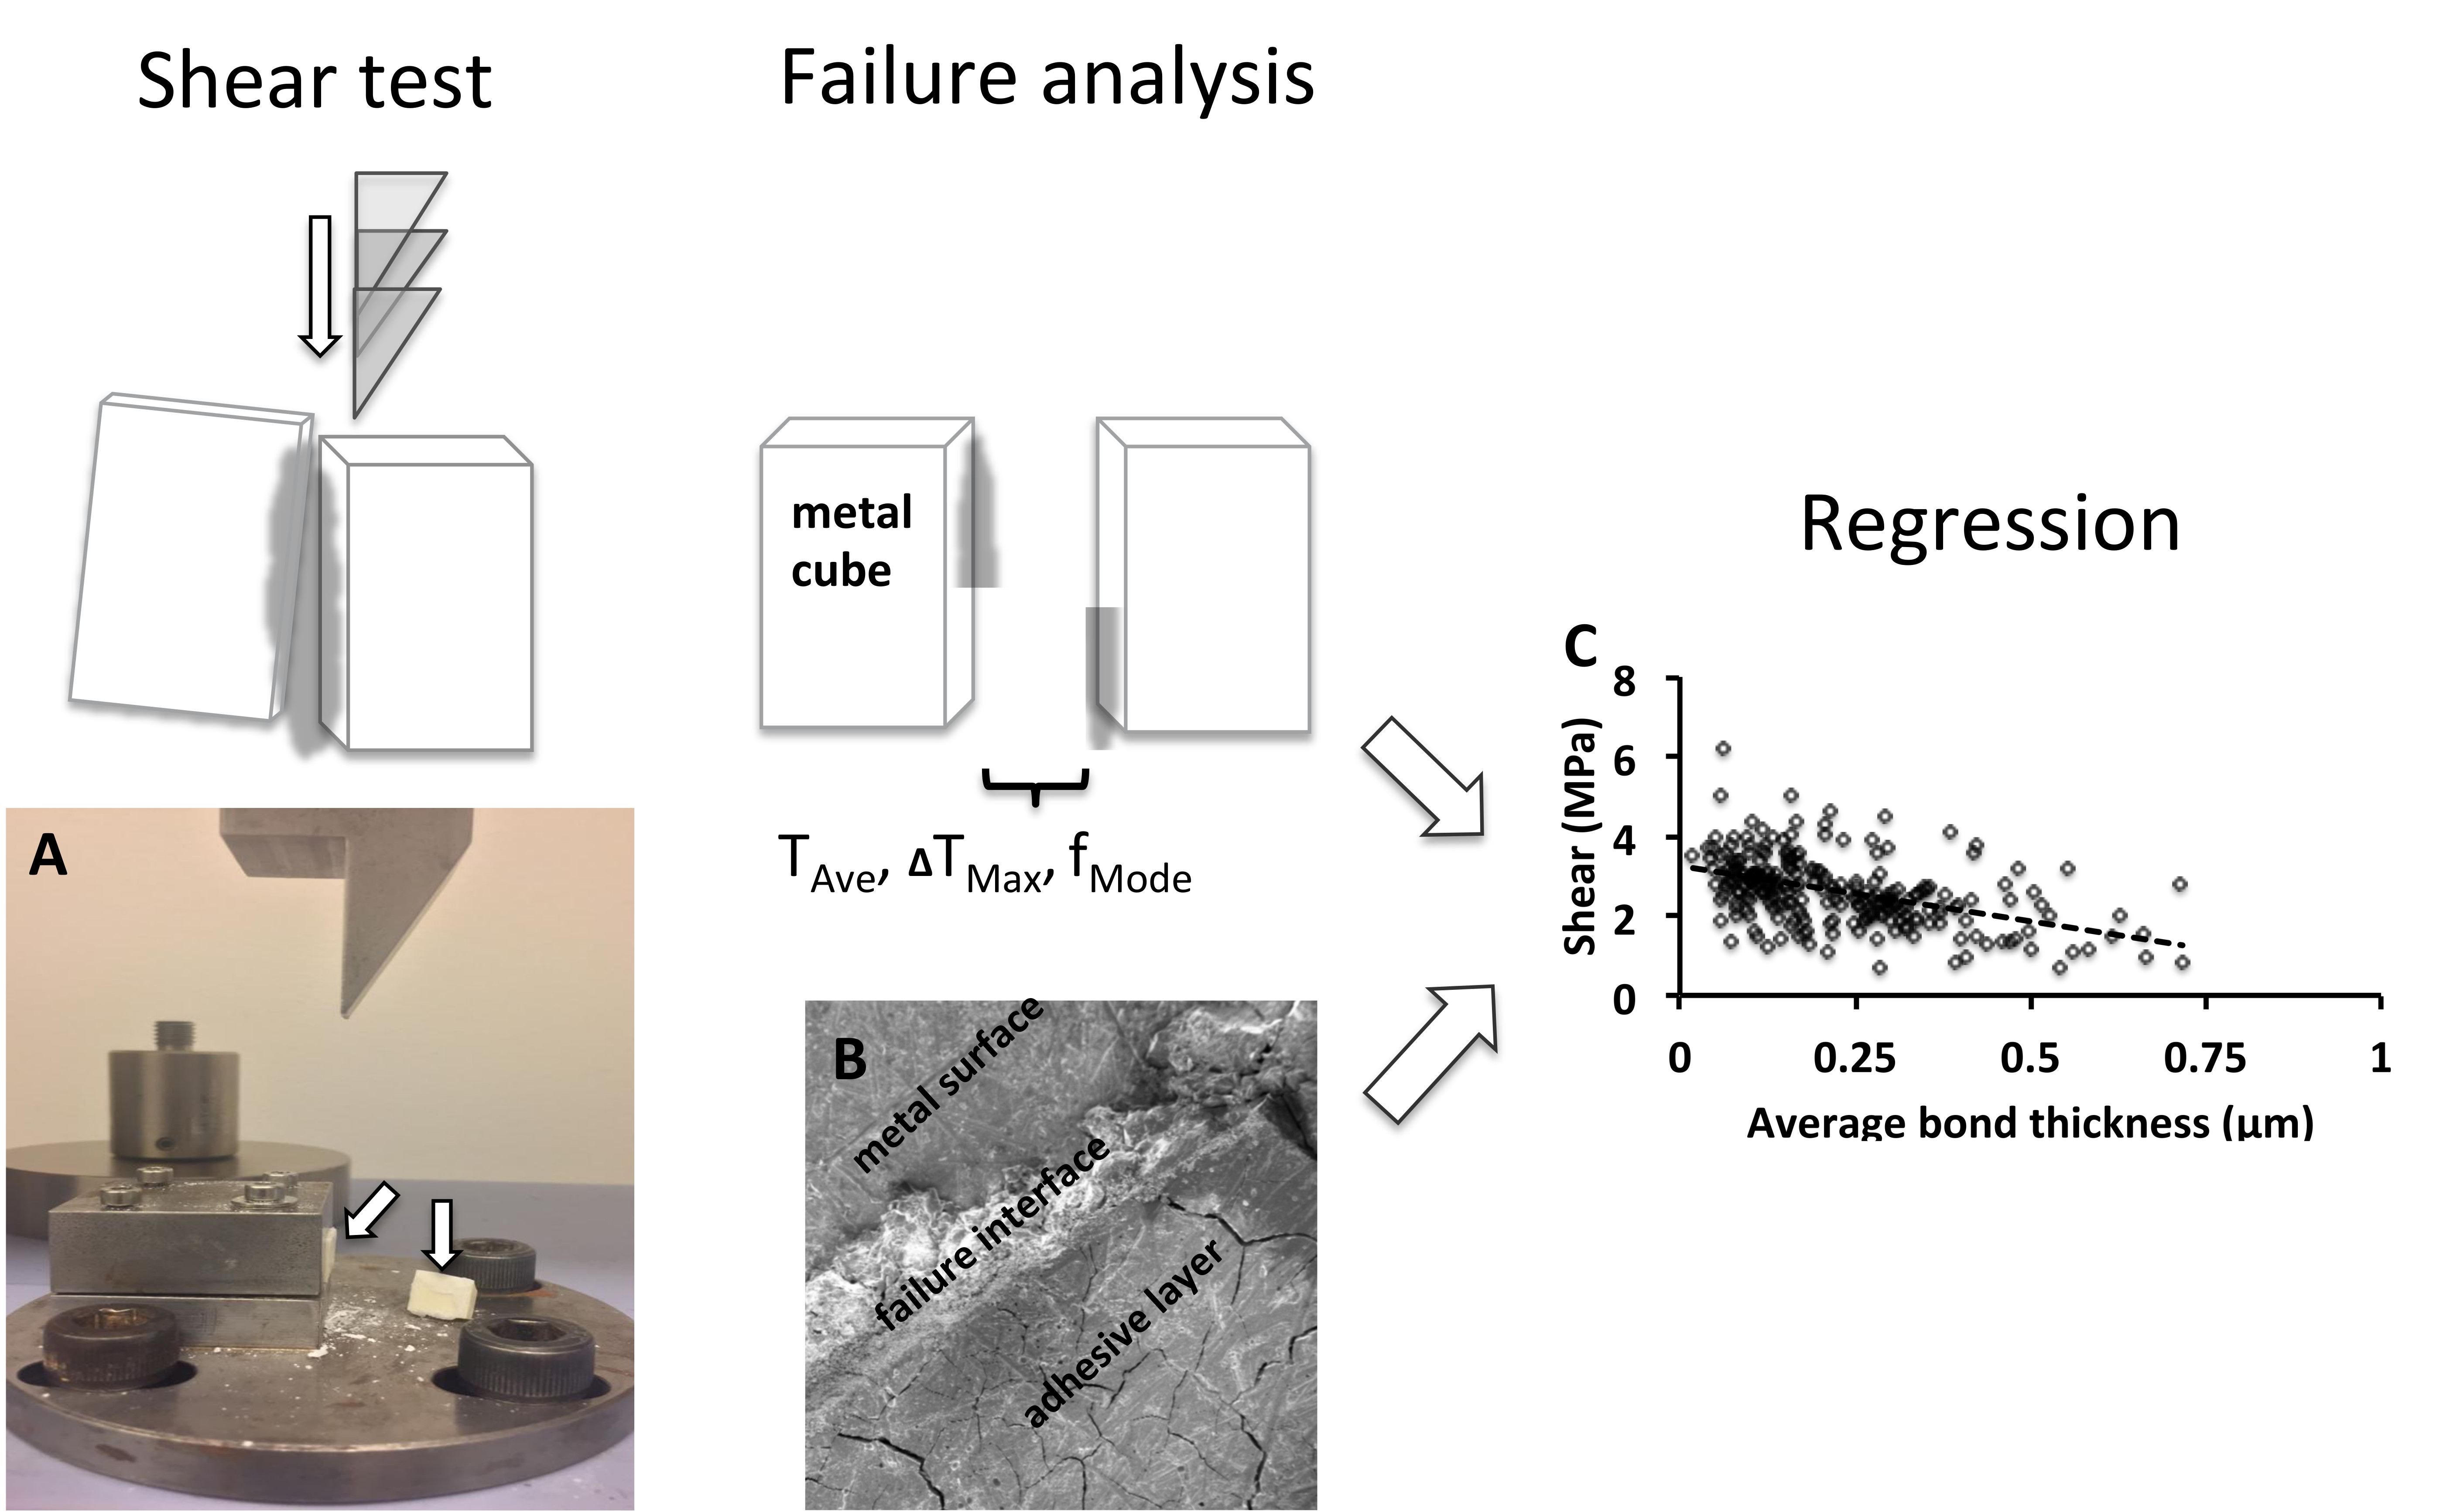
2.3. Mechanical Testing

Shear testing was conducted on an AGS-X mechanical testing machine (MTS, Shimadzu Europa Gmbh, Duisburg, Germany). The cubes were fixated in a custom designed shear rig, and a shear force was applied at a displacement rate of 1 mm·min−1, with a 5-kN load cell (Shimadzu Europa Gmbh, Duisburg, Germany). The peak force at failure was recorded for each sample. Since the dimensions of bone cubes varied due to cutting technique, the obtained shear force was normalized to the average surface area, for each group.

2.4. Failure Analysis

The failure mode was assessed semi-quantitatively by manual scoring, and qualitatively by scanning electron microscopy (SEM). Failure scoring was based upon the percentage of the cube surface coverage, with the least amount of adhesive remaining attached after testing [19]: 0% surface coverage scored as “1” (adhesive failure—the adhesive layer remained unbroken, attached to only 1 surface); 0% < x < 100% surface coverage (mixed mode failure involving adhesive failure at the adhesive/cube interface (adhesive zone) and cohesive failure within the adhesive layer) scored as “2”; a combination of adhesive and cohesive failure, where these failure types occupied distinct regions, hereafter referred to as “combined mode” failure, scored as “3”, or 100% (purely cohesive failure—the adhesive layer failed leaving adhesive on both surfaces, while adhesive failure was not observed) scored as “4”. The selected samples from each group were investigated with SEM (Merlin field emission microscope, AB Carl Zeiss, Stockholm, Sweden), with a secondary electron in-lens detector, an acceleration voltage of 3 keV, and a 195-pA current. The SEM samples were dried for 24 h in ambient conditions, and were not sputter coated.

2.5. Statistical Analysis

Single factor comparisons, between group means, were conducted via ANOVA (SPSS v1.0.0.1347). Tukey or Games-Howell post-hoc analysis was used when variance was homogeneous, or inhomogeneous (Levene’s test), respectively. Single comparisons were made with “group” as the independent variable, and “shear strength” as the dependent continuous variable for the following intergroup comparisons: (groups #1–6), (groups #3, 6–12, 33–34), (groups #3, 13–21), and (groups #24–32). A comparison of means (ANOVA) was also made between independent variable “group”, and dependent variable “failure mode”. The failure mode was coded as an ordinal variable, with possible values of: 1 (adhesive), 2 (mixed mode), 3 (combined), or 4 (cohesive). Finally, the mean surface roughness (Sa) was compared between, and within, each cube group, (ANOVA) to determine whether the differences were statistically significant.
Linear regression was evaluated using the linear regression and general linear model procedure in SPSS. In the first linear regression, all samples were repetitions of a single formulation of 27% PMC, tested under varied curing and handling conditions (groups #1–13). The dependent variable was “shear strength”, and the fixed factors were “cure type”, “grip force”, “grip time”, and “mix method”. The following factors were added as covariates, stepwise, to evaluate whether their inclusion improved the linear regression: “average thickness”, “unevenness (abbreviated as “skew”)”, “failure mode”, and “application time”. A second linear regression was conducted on different formulations (27–90% PMC, groups #3, 13–21), with the dependent variable “shear strength”, and the fixed factors “cure type”, “grip time”, and “formulation”. The following factors were added as covariates, stepwise, to evaluate whether their inclusion improved the linear regression: “average thickness”, “unevenness (skew)”, “failure mode”, and “application time”. The significance criteria were set at p = 0.05. Heteroskedasticity was evaluated with White’s test.

3. Results

An overview of the experimental design is shown in Figure 1. Preliminary testing identified a number of factors, and covariates, that could contribute to the adhesive strength after curing for 24 h (Table 1). The assignment of each factor or covariate, for each group, is shown in Table A1.

3.1. Material Characterization

The average particle size and composition of synthesized αTCP is shown in Table 2. The average particle size and purity were comparable to materials used in prior PMC studies [9].

3.2. Surface Roughness of Test Cubes

Two different types of cubes were used for shear testing: steel cubes (US #80 grit) were used for linear regression modeling, and aluminum cubes polished with different grit silicon carbide (US #80, 320, or 1200 grit) were used to evaluate how surface roughness affected shear strength. Preliminary testing revealed that identical values for roughness were obtained for high (50x lens) and medium (10x lens) magnification profilometer surface measurements (n = 6, p = 0.803, T-test). All subsequent measurements were made using a wide field of view (10x lens and 0.5x field of view). Representative 3D roughness profiles are shown for steel cubes in Figure 2A, and for aluminum cubes in Figure 2B–D (images A–D, F, and G represent the total field of view of 1.681 mm × 1.681 mm). A macroscale and profilometer light image of a steel cube surface is shown in Figure 2E,F. The two-dimensional roughness measurement (Ra) of a single field, from each group, is shown in Figure 2G (note that the absolute values of each aluminum Ra have been shifted, consecutively, by 15 μm to allow for comparison).
The average surface roughness (Sa; Ra) of four regions, from three separate steel or aluminum cubes in each group, is shown in Table 3. The difference in roughness between each aluminum group was statistically significant (ANOVA p < 0.001; Steel 80 g vs. Aluminum 80 g and 320 g, Games-Howell p < 0.001; Aluminum 80 g vs. 32 0 g vs. 1200 g, Games-Howell p < 0.024; Levene’s test p = 0.005), while the intragroup differences between the average surface roughness within the steel cube group were not significant (ANOVA p = 0.882; Levene’s test p = 0.886).

3.3. Adhesive (Shear) Strength of PMC Adhesive

3.3.1. Effect of Curing/Handling Conditions on PMC Adhesive Strength

The curing environment did not affect the adhesive strength of PMC. The average shear strength after 24 h was comparable in humid, aqueous, and saline conditions (Figure 3A, groups #1–6 means: 2.44, 2.77, 3.00, 2.63, 2.71, 2.75 MPa; p = 0.475 ANOVA; Levine p = 0.046), regardless of whether samples were held together with universal grips (31 N) for 5 min before curing (red box) or for the entire cure period (24 h, blue box). The applied grip (fixation) force (31 N vs. 3 N), the duration of gripping (1 min, 5 min, or 24 h), and the mixing method (manual mixing or high speed mixing) only significantly affected the adhesive strength when comparing the conditions that produced optimal strength (e.g., group #3, PBS, 24-h grip at 30 N, manual mixing), to lower grip force, or to shorter grip duration (Figure 3B group 3, 6–12, 33–34 means; group #3 vs. 7 or 10; p = 0.02 ANOVA; 3.00 vs. 2.12 or 2.18 MPa, p = 0.013 or p = 0.013 Games-Howell; p = 0.001 Levine).
These results are in good agreement with prior studies on PMC [9,10,11], where universal grips (a 31-N applied load) were applied for 24 h to achieve a consistent, thin adhesive layer. In contrast, a 3-N applied load, particularly for short times (less than 5 min), represents the approximate force applied by a surgeon during an actual reconstructive surgery. Considering the varied test conditions, there was no clear trend indicating that higher grip force, grip duration, curing method, or mixing method consistently altered the adhesive strength. Interestingly, identical adhesive shear strength was obtained on polished steel surfaces and unpolished bone (Figure 3B, group #8 vs. 33, and group #12 vs. 34; 2.42 vs. 2.44 MPa and 2.87 vs. 1.96 MPa; p = 1.00, 0.308; green border samples indicate bone surface). Based upon these results, it appears that consistent adhesive strength can be expected from PMCs, in both clinical and laboratory settings.
Since the group means were comparable regardless of test conditions (Figure 3B), the molar ratio of the amino acid to calcium phosphate was varied to produce PMCs with a range of adhesive strengths [10]. When cured in PBS, the adhesive strength declined sharply for formulations with >50% mole % (Figure 3C, red box and brackets). The failure mode included cohesive failure (Section 3.4) and granular, which suggested an incomplete curing reaction, or washout of phase(s) containing the amino acid. The setting time was determined by the amino acid content, with 27% PMC curing within 4 min, and >50% PMCs taking >15 min to set. It should be noted that the “initial setting time” (Gilmore needle) may not be the most appropriate measure of PMC curing. Since PMCs display properties of both ceramics and polymeric adhesives, it is unclear which method should be used to determine the curing time. In order to distinguish between poor adhesive strength due to setting related effects (e.g., washout or incomplete curing), or due to a true reduction in adhesiveness (e.g., altered wetting properties, or chemistry), the sample formulations were retested with an accelerator (25% wt% H3PO4 in place of the liquid). The setting time was reduced, and this second set of samples was cured in ambient conditions for 15 min, rather than 5 min to prevent washout, before exposure to PBS.
H3PO4 increased the adhesive strength of low strength PMC (Figure 3C, 70% PMC, 0.41 vs. 1.20 MPa, p < 0.001, Games-Howell, red box and brackets), though it decreased the adhesive strength of stronger PMCs (50%, 3.72 vs. 2.12 MPa, p < 0.001, Games-Howell, pink box and brackets). A separate set of PMC formulations were cured in humidity rather than PBS, to avoid complications from washout and setting related effects, and any confounding effects of the accelerator on adhesiveness (e.g., altered wetting properties, etc.). The shear strength of 70% PMC was much stronger in 100% humidity, compared to PBS, and comparable to 70% cured in PBS with H3PO4 (0.21 vs. 1.20 vs. 1.27 MPa, PBS vs. + H3PO4 vs. humid, 70% PMC; p < 0.001, =0.013; Games-Howell). Comparable shear strength was obtained for 27% and 50% PMC regardless of curing environment (3.00 vs. 2.98 MPa, PBS vs. humid, 27% PMC; 3.72 vs. 4.13 MPa, PBS vs. humid, 50% PMC; p = 1.00, 0.98, Games-Howell), confirming that differing curing conditions do not alter the adhesive strength for high strength formulations of PMC. These results suggest that the curing environment can affect adhesive strength of PMCs when the amount of amino acid is excessive (>50%), or when the formulation cures too slowly, or incompletely (washout).

3.3.2. Effect of Surface Roughness on PMC Adhesive Strength

A separate set of shear samples (PMMA, 27%, or 90% PMC) were prepared on aluminum cubes (Figure 3D) with differing levels of surface roughness (Table 3). Palacos PMMA, a biomaterial approved by the food and drug administration (FDA) for augmentation of orthopaedic devices, was used as a material control. Since the mechanism underlying PMMA adhesion to metal surfaces is expected to be similar for PMCs (physical bonding and Van der Waals forces [37]), we hypothesized that similar (e.g., a decrease in shear strength with increased surface roughness) trends would be observed for both materials. Palacos was noticeably tacky during mixing, similar to PMCs. The bond strength of PMMA to metal was expected to range from 4–10 MPa [38,39], roughly 1 to 2 times as strong as PMCs. Palacos produced an average shear strength of 7.04 MPa on the roughest (2.17 μm), and 4.44 MPa on the smoothest (1.27 μm) surfaces, respectively. The average shear strength decreased with decreasing roughness only for PMMA samples (Figure 3D, group #24 vs. 25 and 26, 27 vs. 28 and 29, 30 vs. 31 and 32; p < 0.001 ANOVA; p = 0.023 PMMA 2.17 μm vs. 1.72 μm; p > 0.167, 27% PMC 2.17 μm vs. 1.72 μm, p > 0.999, 90% PMC 2.17 vs. 1.72 μm; Games-Howell; p < 0.001 Levene). Surface roughness (range of Sa 2.17 to 1.27 μm) did not affect PMC bond strength, for the high (27% PMC) strength formulation. Adhesive failure is often attributed to the presence of defects, and lower bond strength adhesives are expected to be more sensitive to defects. Therefore, we hypothesized that a low strength formulation (90% PMC) might be more sensitive to surface roughness. When comparing between different formulations of PMC, with significantly different adhesive strength, the failure mode is expected to shift from adhesive to cohesive failure as the adhesive strength decreases. Indeed, this was the case in the present study (Figure 4). However, regardless of failure mode, the adhesive strength was not affected by surface roughness (Figure 3D, group #27 vs. 28 and 29, 30 vs. 31 and 32; p > 0.167, p > 0.999; Games-Howell). Collectively, these results suggest that PMCs are relatively insensitive to surface roughness.

3.4. Failure Mode Analysis

The observed failure modes (Figure 4, Figure 5(A1–A4)) included: (a) purely cohesive failure (100% of both surfaces covered with adhesive), (b) pure adhesive failure (0% of one surface covered with adhesive), (c) mixed mode failure (no overlapping regions of cohesive failure, but adhesive remained on both surfaces), and (d) combined mode failure, a unique form of mixed mode failure where adhesive and cohesive failure occurred distinctly, in separate regions within the adhesive layer [17]. An increase in amino acid content changed the failure mode from adhesive failure towards predominantly cohesive failure (Figure 4A). When comparing between different strength formulations of PMC (Figure 4B–D), the failure mode correlated with the adhesive strength, and cure conditions; higher strength formulations (27%–50% PMC) failed by adhesive and mixed mode failure, while weaker formulations (>50% PMC) failed via cohesive and combined failure modes. H3PO4 accelerated the setting time and altered the failure mode towards adhesive failure in the 70% PMC formulation (Figure 4C), suggesting that the low shear strength of formulations with excess amino acid may reflect incomplete curing or washout-related effects.
In low-strength PMC formulations (<1 MPa) 100% of the samples failed cohesively (Figure 4A–D, 0.41, 0.47 MPa; group #15, 18; 70%, 90% PMC). In PMC formulations with adhesive strengths of ~1 MPa (1.20 or 1.27 MPa; group #17, 21, 70% + H3PO4, 70% PMC humid), 100% of the samples failed via the combined mode. When comparing among all groups (Figure 5B), differences in failure mode were only observed among PMC formulations with a distinctly differing adhesive strength. Further investigation into cohesive and combined modes of failures with SEM (Figure 5C cohesive failure, Figure 5E combined mode failure), revealed that these failure modes reflected washout (organic phase was missing, leaving behind granular particles), and aberrant curing. An organic surface layer (Figure 5E, inset image, organic layer “OL”), which wetted and adhered to surfaces, was often found attached to the adherend surface at points of failure (Figure 5D), though small areas, where the organic layer remained bound to the adhesive bulk, were visible at the adhesive failure interface (Figure 5E, red arrows). In cases of adhesive failure, and mixed mode failure, the interface between the surface layer and the bulk often failed at leaving behind fragments attached to both the metal surface and adhesive layer (Figure 5D, high magnification image of organic layer shown in inset). The surface of the fractured adhesive layer, in cases of adhesive and mixed mode failure, appeared amorphous (Figure 5E inset image of fracture cross section), while cohesive and combined mode failure samples (low strength PMC) displayed granular, unreacted calcium phosphate particles.
In moderate-strength (2–3 MPa) PMC formulations (2.12, 2.55, 2.98 or 3.00 MPa; group #3, 13, 19, 20; 50% + H3PO4, 27% + H3PO4, 27% in PBS, 27% PMC humid), failure occurred via two types of adhesive failure: purely adhesive failure (33-50% of samples) or mixed mode failure (failure within the adhesive bond line, 50%–67% of samples). Mixed mode failure was, predominantly, a form of adhesive failure where either the adhesive had dissipated sufficient force to exceed the cohesive strength, or a flaw was present within the bond line, or at the interface, leading to failure within the adhesive. In high strength (>3 MPa) PMC formulations (3.72 or 4.13 MPa; group #14, 16; 50% in PBS, 50% PMC humid) all samples failed via mixed mode (adhesive) failure. PMMA samples (group #22, 23) failed via adhesive (66–77% of samples) and mixed mode (23%–34% of samples) failure. The difference in failure mode, between low, medium and high strength PMC formulations, is summarized in Figure 4.
While the surface layer appeared amorphous and organic, prior studies have identified that the surface of PMC is actually mineralized with nanoscale, disordered calcium phosphate [10]. In most cases of adhesive and mixed mode failures, failure occurred at the interface between the organic surface layer and the bulk of PMC (adhesive zone). A close visual inspection revealed that: (a) predominantly, the organic surface layer remained bound to the surface of the opposing metal cube, rather than bound to the adhesive layer (Figure 5E, red arrows); and (b) both the surface and underlying bulk layer of PMC display topography matching the surface features of the opposing cube (Figure 5E, red arrows). It is likely that both the surface layer and limited portions of the PMC bulk engage in physical bonding (mechanical inter-digitation) with the opposing adherend surface.
Collectively, the mechanical test and failure mode analysis suggest that: (a) PMCs with a low shear strength (>1 MPa) typically fail cohesively, suggesting the limited cohesive strength prevents an evaluation of the true adhesive strength in these samples; (b) PMCs with strengths between 1–2 MPa failed via a mixture of adhesive and cohesive failure modes, suggesting that failure did not arise exclusively from the adhesive zone layer, and that the observed shear strength did not reflect the true adhesive strength; (c) PMCs with strengths above 2 MPa failed via purely adhesive, and mixed mode failure, suggesting that failure is occurring in the adhesive zone layer and internally (cohesive), and that the true adhesive strength of PMC is within this range (2–4 MPa); (d) some PMC formulations (e.g., high amino acid containing formulations) produce different adhesive strengths depending upon handling and curing conditions, therefore multiple conditions should be evaluated to confirm the true strength is measured, with 100% humidity recommended; (e) considering that washout and curing properties are critical, and may not be obvious until after adhesive testing is completed (e.g., failure mode analysis), laboratory testing in 100% humidity rather than liquids is recommended; and most importantly, (f) though there appeared to be a relationship between failure mode and the adhesive strength, high strength PMC formulations (27–50%) were equally insensitive to surface roughness as lower strength PMC (70%–90%), suggesting that the true (theoretical) adhesive strength of PMC may reflect the wetting and bonding properties of the organic surface layer, while the observed (laboratory) adhesive strength reflects the likelihood of failure outside the adhesion zone layer (e.g., at the interface between the surface and bulk of PMC, or within the bulk in cases of cohesive failure).

3.5. Linear Regression and Scatter Plot Analysis

3.5.1. Scatter Plot Analysis

The following factors were controlled in this study: surface roughness, curing conditions, grip force, grip duration, PMC formulation, and mixing method. The following covariates (uncontrolled factors) were recorded for each sample: application time, average bond thickness, the thickest bond, or thinnest bond thickness, bond unevenness (difference between the thickest and thinnest bond, normalized to the average bond thickness for the sample), and the failure mode (Table 1). The correlation strength between each individual factor and the outcome measure (adhesive strength), was explored in scatter plots, with replications of a single formulation of PMC (Figure 6A–D, n = 242 total, n = 12 or 36 per group, 27% PMC, groups #1–13), or a series of PMC formulations with differing amounts of phosphoserine (Figure 6E–H, n = 12 or 36 per group, 27–90% PMC, groups #3, 14–21).
The coefficient of determination (R2) was less than 0.25 for all continuous variable scatter plots (Figure 6A–D, 27% PMC, groups #1–13), comparing shear strength to: application time (Figure 6A), average bond thickness (Figure 6B), the thinnest (red) and thickest (black) bond (Figure 6C), and bond unevenness (Figure 6D). No trend was obvious in the sample mean distribution using categorical scatter plots for: cure type, grip force, grip time, or mixing method (data not shown). A second set of scatter plots (aggregated) evaluated the relationship between different strength PMC formulations (Figure 6E–H, n = 12 or 36 per group, 27%–90% PMC, groups #3, 13–21), and: application time (Figure 6E), average bond thickness (Figure 6F), the thinnest (red) and thickest bond (Figure 6G), and bond unevenness (Figure 6H).
A number of studies have investigated the relationship between bond thickness and adhesive strength, with some reporting similar results (poor correlation) [33,34,40], a positive correlation [23,41], or a negative correlation [21,42]. The downward trend between bond thickness and adhesive strength suggests that the average shear strength of PMC decreased with increasing bond thickness (Y = −2.7772x + 3.2501) at a rate of approximately −8.54% per an increase in bond thickness of 100 um (R2 = 0.218) assuming a linear relationship. It is likely there are other factors not explored in this study that may account for the remaining, unexplained variability.

3.5.2. GLM, Linear Regression

A stepwise linear regression model revealed that: (a) the correlation between shear strength and the fixed factors “cure condition”, “grip force”, “grip duration”, and “mixing method” was poor (R2 = 0.069), in agreement with the scatter plot analysis; (b) the inclusion of the following covariates, stepwise in separate “blocks”, improved the correlation model: average bond thickness (R2 = 0.273), unevenness (R2 = 0.282), and failure mode (R2 = 0.308). The selected factors were used in a general linear model and the following factors were significant contributors (p < 0.05) to the model accuracy: average bond thickness and failure mode (Table 4, model significance p < 0.001, Whites test p = 0.590). This model was built using replications of a single formulation of PMC (Table 4, n = 242 total, n = 12 or 36 per group, 27% PMC, groups #1–13). Three covariates were excluded from the linear regression model, “application time”, “thickest bond thickness” and “thinnest bond thickness”, because they were collinear with other factors.
The second regression model was built using different formulations (phosphoserine mole %) of PMC (Table 4, n = 142 total, n = 12 or 36 per group, 27%–90% PMC, groups #3, 13–21). A stepwise linear regression model revealed that: (a) the correlation between shear strength and the fixed factors “cure condition”, “grip duration”, and “formulation” was weak (R2 = 0.216); (b) inclusion of the following covariates, stepwise in separate “blocks”, improved the correlation model: average bond thickness (R2 = 0.237), unevenness (R2 = 0.243), and the failure mode (R2 = 0.377). The selected factors were used in a general linear model and the following factors were significant contributors to the model accuracy: average bond thickness, formulation, and the failure mode (Table 4, model significance p < 0.001, Whites test p = 0.106). Three covariates were excluded from the linear regression model, “application time”, “thickest bond thickness”, and “thinnest bond thickness”, because they were collinear with other factors.
The results of linear regression analysis suggest that: (a) the various curing conditions, grip force and grip duration, and the mixing method were not significant predictors of adhesive shear strength; (b) variations in the adhesive strength of PMC are correlated with the bond thickness; and (c) adhesive strength was strongly correlated with the failure mode.

4. Discussion

The purpose of this study was (a) to identify which factors contribute to adhesive strength in PMCs, and (b) to bridge disparate test conditions, thereby allowing for comparisons/predictions on how PMC formulations behave in both the laboratory and the clinic. In the present study, we have shown that PMC is relatively insensitive to the adherend surface properties (consistent average strength of 2–3 MPa, and minimal strength of 1.5–2 MPa, on metals and bone over a range of 1.27–2.17 μm). Surgeons are more concerned with the minimal strength of an adhesive since premature failure or poor bonding can impair healing or lead to secondary injury. In the clinic, an adhesive must perform consistently in challenging physiological environments, on uneven surfaces, and when the surgeon cannot ensure a thin adhesive layer. Uneven bond lines can lead to stress concentration, and multi-mode loading (bending, tension and shear), which is known to produce shear strengths that do not correlate with bond thickness [42]. We have shown that PMCs are not affected by uneven bond lines and adhere with comparable strength to steel, aluminum, and cortical bone surfaces.
Of the factors investigated, the average bond thickness and amino acid content were the strongest predictors of adhesive strength. The dependence of adhesive strength on bond thickness has been studied extensively, though the optimal bond thickness and benefits of thicker, or thinner bonds, appear to be relative to each individual adhesive material [17,18,19,23]. While bond thickness is a critical determinant of structural adhesive strength, tissue adhesives, such as dental resins show poor correlations [33]. PMCs with a range of adhesive strengths have been created, previously, by varying the amino acid content [8,10]. We now extend those findings to include test conditions that mimic the clinic, and conditions that are conducive to exploratory, mechanistic testing (e.g., 100% humidity) [30]. In ongoing/future studies, a library of alternative amino acids, organic analogues, or synthetic analogues will be used to explore the mechanisms underlying adhesion, and how amino acid chemistry affects the adhesive strength and the interaction between the organic and inorganic phases in PMCs. The present work represents a necessary precursor to these ongoing studies by: (a) establishing how PMC behaves in conditions that minimize confounding effects (e.g., mixing method, washout resistance, etc.), and (b) providing a large dataset of variability in adhesive strength for subsequent power analysis, of the required sample size, to identify differences in adhesive strength due to varied chemistries.
Perhaps most importantly, we have identified a previously unrecognized source of interfacial failure that occurs in PMCs. Prior studies have suggested that the failure mode correlates poorly with adhesive strength for adhesive- and mixed-mode failure because failure can arise from multiple sources [34,40]. Even when the adhesive strength is significantly greater than the cohesive strength, if defects are present, interfacial stress concentrates within the bulk, or normal forces (bending) occur, a strong adhesive can fail cohesively [19]. In the present study, the failure mode strongly correlated with PMC adhesive strength, with high-adhesive-strength PMCs (>2 MPa) failing adhesively (including mixed mode failures), and low adhesive strength PMCs (<1.5 MPa) failing cohesively (including combined mode failures). The change in failure mode appeared to reflect an increase in the cohesive strength (high amino acid %, low adhesive strength PMCs did not cure completely), rather than changes in the adhesive strength. As the bulk strength increased, crack/failure initiation shifted from the bulk, to the next weakest phase: the interface between the surface layer (adhesive zone layer) and the bulk of PMC [21,37,43]. Since failure occurred primarily at the interface between the adhesion zone layer and PMC bulk, and since high- and low-strength PMCs were insensitive to surface roughness, we hypothesize that higher adhesive strengths might be obtained by strengthening interpenetration and bonding between the surface and the bulk layers of PMC. Strengthening the dissipative matrix is a common approach to improve the toughness and adhesive strength [36,37,44]. Additional studies are needed to confirm these results, quantitatively, and to investigate the nanoscale properties of the surface layer of PMC.
There are a number of factors that are likely to impact adhesive strength that were not investigated in the present study (e.g., curing temperature). It should be noted that select tissues have low oxygen content, particularly cartilage. While PMCs have shown good bond strength to such tissues ex vivo [10], additional testing is needed to confirm whether the adhesive effect or setting reactions are affected by hypoxia. The predictive power of the linear regression model (R2 = 0.358) and single factor correlations (R2 = 0.218) was quite low. As a result, roughly 70%–80% of the variability in adhesive strength remains unexplained.
While the present study sought to predict the behavior of PMC on tissues, large variability in the surface properties, sample preparation (e.g., cutting with band saw, polishing, etc.), and tissue architecture (variation between regions of the bone, within and between different animal tissue sources, etc.) could easily obscure the correlation results. Therefore, in the present study, metal samples were used to ensure control of the surface properties and the reproducibility of the testing methods and results. In the present study, the use of proteins was also avoided (e.g., fetal bovine serum in the curing liquid). Despite rigorous surface cleaning methods, proteins are difficult to remove completely, and leftover proteins can affect how the surface of the adhesive orients, nucleates, and bonds to the surface of the metal cube. Protein was also avoided, as a possible source of variation, because the correlation model developed in the present study would require duplication of a large number of samples, to account for the effects of protein on the correlation model. It should be noted that protein-rich bone cubes were used in the present study, and comparable bond strengths were obtained, compared to metal cubes. In future studies, the adhesive strength should be tested in actual physiological liquids (e.g., human plasma) and on live tissues (in vivo) to identify the reliability, and variations in adhesive strength following actual clinical use.

5. Patents

The following authors are co-inventors on the following patents: #WO2019106173, #SE1651271, and #WO2018060289: Michael Pujari-Palmer (M.P.-P.), Gerard Insley (G.I), Philip Procter (P.P.), and Hakan Engqvist (H.E.).

Author Contributions

Conceptualization, M.P.-P., R.G.; methodology, M.P.-P., R.G.; validation, M.P.-P., R.G.; formal analysis, M.P.-P., R.G., P.P., H.E.; investigation, M.P.-P., R.G.; resources, P.P., H.E.; data curation, M.P.-P.; writing—original draft preparation, M.P.-P., P.P, G.I., A.B., H.E.; visualization, M.P.-P.; writing—review and editing, M.P.-P., R.G., P.P, G.I., A.B., H.E.; visualization, M.P.-P.; supervision, M.P.-P., P.P., H.E.; project administration, P.P., H.E.; funding acquisition, P.P., H.E. All authors have read and agreed to the published version of the manuscript.

Funding

This research was funded by Swedish Science Foundation (#RMA15-0110, crossref funder ID 501100001729), and the European Institute of Innovation and Technology (EIT Health) HeadStart grant (2018 HS PoC 2018-HS-0046, crossref funder ID 501100000811).

Acknowledgments

The authors would like to acknowledge David Wenner for assistance with materials preparation, Magnus Heldin for assistance with force measurements, and Cecilia Persson for helpful discussions.

Conflicts of Interest

The following authors declare partial ownership in a company that owns all related intellectual property, GPBio LTD: Michael Pujari-Palmer (M.P.-P.), Gerard Insley (G.I), Philip Procter (P.P.), and Hakan Engqvist (H.E.). The funders (SSF and EIT) had no role in the design of the study; in the collection, analyses, or interpretation of data; in the writing of the manuscript, or in the decision to publish the results.

Appendix A

Table A1. Varied factors in each study group.
GroupFormulaCureForce (N)TimeMixCubeRough (μm)
127%Humidity3124hHandSteel1.23
227%Water3124hHandSteel1.23
327%PBS3124hHandSteel1.23
427%Humid315mHandSteel1.23
527%Water315mHandSteel1.23
627%PBS315mHandSteel1.23
727%PBS315mAutoSteel1.23
827%PBS311mHandSteel1.23
927%PBS324hHandSteel1.23
1027%PBS35mHandSteel1.23
1127%PBS35mAutoSteel1.23
1227%PBS31mAutoSteel1.23
1327%Humid311mHandSteel1.23
1450%PBS3124hHandSteel1.23
1570%PBS3124hHandSteel1.23
1650%Humid311mHandSteel1.23
1770%Humid311mHandSteel1.23
1890%Humid311mHandSteel1.23
1927% *PBS3124hHandSteel1.23
2050% *PBS3124hHandSteel1.23
2170% *PBS3124hHandSteel1.23
22PMMAPBS3124hHandSteel1.23
23PMMAPBS311mHandSteel1.23
24PMMAPBS311mHandAluminum2.17
25PMMAPBS311mHandAluminum1.72
26PMMAPBS311mHandAluminum1.27
2727%PBS311mHandAluminum2.17
2827%PBS311mHandAluminum1.72
2927%PBS311mHandAluminum1.27
3090%PBS311mHandAluminum2.17
3190%PBS311mHandAluminum1.72
3290%PBS311mHandAluminum1.27
3327%PBS311mHandBone
3427%PBS31mHandBone
* Contained 25% phosphoric acid as liquid

References

  1. Granskog, V.; García-Gallego, S.; von Kieseritzky, J.; Rosendahl, J.; Stenlund, P.; Zhang, Y.; Petronis, S.; Lyvén, B.; Arner, M.; Håkansson, J.; et al. High-Performance Thiol–Ene Composites Unveil a New Era of Adhesives Suited for Bone Repair. Adv. Funct. Mater. 2018, 28, 1800372. [Google Scholar] [CrossRef] [Green Version]
  2. Han, L.; Wang, M.; Li, P.; Gan, D.; Yan, L.; Xu, J.; Wang, K.; Fang, L.; Chan, C.W.; Zhang, H.; et al. Mussel-Inspired Tissue-Adhesive Hydrogel Based on the Polydopamine-Chondroitin Sulfate Complex for Growth-Factor-Free Cartilage Regeneration. ACS Appl. Mater. Interfaces 2018, 10, 28015–28026. [Google Scholar] [CrossRef] [PubMed]
  3. Hofman, A.H.; van Hees, I.A.; Yang, J.; Kamperman, M. Bioinspired Underwater Adhesives by Using the Supramolecular Toolbox. Adv. Mater. 2018, 30, 1704640. [Google Scholar] [CrossRef] [PubMed]
  4. Kim, S.; Huang, J.; Lee, Y.; Dutta, S.; Yoo, H.Y.; Jung, Y.M.; Jho, Y.; Zeng, H.; Hwang, D.S. Complexation and coacervation of like-charged polyelectrolytes inspired by mussels. Proc. Natl. Acad. Sci. USA 2016, 113, E847–E853. [Google Scholar] [CrossRef] [PubMed] [Green Version]
  5. Liu, H.; Peng, Y.; Yang, C.; Wang, M. Silica Nanoparticles as Adhesives for Biological Tissues? Re-Examining the Effect of Particles Size, Particle Shape, and the Unexpected Role of Base. Part. Part. Syst. Charact. 2017, 34, 1700286. [Google Scholar] [CrossRef]
  6. Rose, S.; Prevoteau, A.; Elziere, P.; Hourdet, D.; Marcellan, A.; Leibler, L. Nanoparticle solutions as adhesives for gels and biological tissues. Nature 2014, 505, 382–385. [Google Scholar] [CrossRef]
  7. Stewart, R.J.; Wang, C.S.; Shao, H. Complex coacervates as a foundation for synthetic underwater adhesives. Adv. Colloid Interface Sci. 2011, 167, 85–93. [Google Scholar] [CrossRef] [Green Version]
  8. Kirillova, A.; Kelly, C.; von Windheim, N.; Gall, K. Bioinspired Mineral–Organic Bioresorbable Bone Adhesive. Adv. Healthc. Mater. 2018, 7, 1800467. [Google Scholar] [CrossRef]
  9. Liu, X.; Pujari-Palmer, M.; Wenner, D.; Procter, P.; Insley, G.; Engqvist, H. Adhesive Cements That Bond Soft Tissue Ex Vivo. Materials 2019, 12, 2473. [Google Scholar] [CrossRef] [Green Version]
  10. Pujari-Palmer, M.; Guo, H.; Wenner, D.; Autefage, H.; Spicer, D.C.; Stevens, M.M.; Omar, O.; Thomsen, P.; Edén, M.; Insley, G.; et al. A Novel Class of Injectable Bioceramics That Glue Tissues and Biomaterials. Materials 2018, 11, 2492. [Google Scholar] [CrossRef] [Green Version]
  11. Bystrom, L.J.; Pujari-Palmer, M. Phosphoserine Functionalized Cements Preserve Metastable Phases, and Reprecipitate Octacalcium Phosphate, Hydroxyapatite, Dicalcium Phosphate, and Amorphous Calcium Phosphate, during Degradation, In Vitro. J. Funct. Biomater. 2019, 10, 54. [Google Scholar] [CrossRef] [PubMed] [Green Version]
  12. Mai, R.; Lux, R.; Proff, P.; Lauer, G.; Pradel, W.; Leonhardt, H.; Reinstorf, A.; Gelinsky, M.; Jung, R.; Eckelt, U.; et al. O-phospho-L-serine: A modulator of bone healing in calcium-phosphate cements. Biomed. Tech. (Berl) 2008, 53, 229–233. [Google Scholar] [CrossRef] [PubMed]
  13. Offer, L.; Veigel, B.; Pavlidis, T.; Heiss, C.; Gelinsky, M.; Reinstorf, A.; Wenisch, S.; Lips, K.S.; Schnettler, R. Phosphoserine-modified calcium phosphate cements: Bioresorption and substitution. J. Tissue Eng. Regen. Med. 2011, 5, 11–19. [Google Scholar] [CrossRef] [PubMed]
  14. Reinstorf, A.; Hempel, U.; Olgemöller, F.; Domaschke, H.; Schneiders, W.; Mai, R.; Stadlinger, B.; Rösen-Wolff, A.; Rammelt, S.; Gelinsky, M.; et al. O-phospho-L-serine modified calcium phosphate cements—Material properties, in vitro andin vivo investigations. Mater. Werkst. 2006, 37, 491–503. [Google Scholar] [CrossRef]
  15. Dorozhkin, S.V. Calcium orthophosphates as bioceramics: State of the art. J. Funct. Biomater. 2010, 1, 22–107. [Google Scholar] [CrossRef] [Green Version]
  16. Procter, P.; Pujari-Palmer, M.; Hulsart-Billström, G.; Wenner, D.; Insley, G.; Larsson, S.; Engqvist, H. A biomechanical test model for evaluating osseous and osteochondral tissue adhesives. BMC Biomed. Eng. 2019, 1, 11. [Google Scholar] [CrossRef] [Green Version]
  17. Adnan, A.; Sun, C.T. Effect of Adhesive Thickness on Joint Strength: A Molecular Dynamics Perspective. J. Adhes. 2008, 84, 401–420. [Google Scholar] [CrossRef]
  18. Armstrong, S.; Geraldeli, S.; Maia, R.; Raposo, L.H.; Soares, C.J.; Yamagawa, J. Adhesion to tooth structure: A critical review of "micro" bond strength test methods. Dent. Mater. 2010, 26, e50–e62. [Google Scholar] [CrossRef]
  19. Boutar, Y.; Naïmi, S.; Mezlini, S.; da Silva, L.F.M.; Hamdaoui, M.; Ben Sik Ali, M. Effect of adhesive thickness and surface roughness on the shear strength of aluminium one-component polyurethane adhesive single-lap joints for automotive applications. J. Adhes. Sci. Technol. 2016, 30, 1913–1929. [Google Scholar] [CrossRef]
  20. Klocke, A.; Kahl-Nieke, B. Influence of cross-head speed in orthodontic bond strength testing. Dent. Mater. 2005, 21, 139–144. [Google Scholar] [CrossRef]
  21. Xu, W.; Wei, Y. Strength and interface failure mechanism of adhesive joints. Int. J. Adhes. Adhes. 2012, 34, 80–92. [Google Scholar] [CrossRef] [Green Version]
  22. Farrar, D.F. Bone adhesives for trauma surgery: A review of challenges and developments. Int. J. Adhes. Adhes. 2012, 33, 89–97. [Google Scholar] [CrossRef]
  23. Arenas, J.M.; Narbón, J.J.; Alía, C. Optimum adhesive thickness in structural adhesives joints using statistical techniques based on Weibull distribution. Int. J. Adhes. Adhes. 2010, 30, 160–165. [Google Scholar] [CrossRef] [Green Version]
  24. Shekhawat, V.K.; Laurent, M.P.; Muehleman, C.; Wimmer, M.A. Surface topography of viable articular cartilage measured with scanning white light interferometry. Osteoarthr. Cartil. 2009, 17, 1197–1203. [Google Scholar] [CrossRef] [Green Version]
  25. Jo, Y.K.; Choi, B.-H.; Zhou, C.; Ahn, J.-S.; Jun, S.H.; Cha, H.J. Bioengineered mussel glue incorporated with a cell recognition motif as an osteostimulating bone adhesive for titanium implants. J. Mater. Chem. B 2015, 3, 8102–8114. [Google Scholar] [CrossRef]
  26. Kandalam, U.; Bouvier, A.J.; Casas, S.B.; Smith, R.L.; Gallego, A.M.; Rothrock, J.K.; Thompson, J.Y.; Huang, C.Y.; Stelnicki, E.J. Novel bone adhesives: A comparison of bond strengths in vitro. Int. J. Oral. Maxillofac. Surg. 2013, 42, 1054–1059. [Google Scholar] [CrossRef]
  27. Schreader, K.J.; Bayer, I.S.; Milner, D.J.; Loth, E.; Jasiuk, I. A polyurethane-based nanocomposite biocompatible bone adhesive. J. Appl. Polym. Sci. 2013, 127, 4974–4982. [Google Scholar] [CrossRef]
  28. Young, A.M.; Man Ho, S.; Abou Neel, E.A.; Ahmed, I.; Barralet, J.E.; Knowles, J.C.; Nazhat, S.N. Chemical characterization of a degradable polymeric bone adhesive containing hydrolysable fillers and interpretation of anomalous mechanical properties. Acta Biomater. 2009, 5, 2072–2083. [Google Scholar] [CrossRef]
  29. Kelly, J.R.; Benetti, P.; Rungruanganunt, P.; Bona, A.D. The slippery slope: Critical perspectives on in vitro research methodologies. Dent. Mater. 2012, 28, 41–51. [Google Scholar] [CrossRef]
  30. Spicer, C.; Pujari-Palmer, M.; Autefage, H.; Insley, G.; Procter, P.; Engqvist, H.; Stevens, M. Synthesis of Phospho-Amino Acid Analogues as Tissue Adhesive Cement Additives. Cent. Sci. 2020, 6, 226–231. [Google Scholar] [CrossRef]
  31. Perrin, B.R.; Dupeux, M.; Tozzi, P.; Delay, D.; Gersbach, P.; von Segesser, L.K. Surgical glues: Are they really adhesive? Eur. J. Cardiothorac. Surg. 2009, 36, 967–972. [Google Scholar] [CrossRef] [PubMed]
  32. Sirisha, K.; Rambabu, T.; Shankar, Y.; Ravikumar, P. Validity of bond strength tests: A critical review: Part I. J. Conserv. Dent. 2014, 17, 305–311. [Google Scholar] [CrossRef] [PubMed] [Green Version]
  33. Cho, B. Effects of the acetone content of single solution dentin bonding agents on the adhesive layer thickness and the microtensile bond strength. Dent. Mater. 2004, 20, 107–115. [Google Scholar] [CrossRef]
  34. Kim, W.-S.; Yun, I.-H.; Lee, J.-J.; Jung, H.-T. Evaluation of mechanical interlock effect on adhesion strength of polymer–metal interfaces using micro-patterned surface topography. Int. J. Adhes. Adhes. 2010, 30, 408–417. [Google Scholar] [CrossRef]
  35. Sun, F.; Li, H.; Lindberg, H.; Leifer, K.; Gamstedt, E.K. Polymer fracture and deformation during nanosectioning in an ultramicrotome. Eng. Fract. Mech. 2017, 182, 595–606. [Google Scholar] [CrossRef]
  36. Xu, G.; Wang, H. Study of cohesion and adhesion properties of asphalt concrete with molecular dynamics simulation. Comput. Mater. Sci. 2016, 112, 161–169. [Google Scholar] [CrossRef]
  37. Von Fraunhofer, J.A. Adhesion and cohesion. Int. J. Dent. 2012, 2012, 951324. [Google Scholar] [CrossRef]
  38. Krishnan, A.; Xu, L.R. Systematic Evaluation of Bonding Strengths and Fracture Toughnesses of Adhesive Joints. J. Adhes. 2011, 87, 53–71. [Google Scholar] [CrossRef]
  39. Shimizu, K.; Malmos, K.; Holm, A.H.; Pedersen, S.U.; Daasbjerg, K.; Hinge, M. Improved adhesion between PMMA and stainless steel modified with PMMA brushes. ACS Appl. Mater. Interfaces 2014, 6, 21308–21315. [Google Scholar] [CrossRef]
  40. Castagnetti, D.; Spaggiari, A.; Dragoni, E. Effect of Bondline Thickness on the Static Strength of Structural Adhesives Under Nearly-Homogeneous Shear Stresses. J. Adhes. 2011, 87, 780–803. [Google Scholar] [CrossRef]
  41. Akhavan-Safar, A.; Ayatollahi, M.R.; da Silva, L.F.M. Strength prediction of adhesively bonded single lap joints with different bondline thicknesses: A critical longitudinal strain approach. Int. J. Solids Struct. 2017, 109, 189–198. [Google Scholar] [CrossRef]
  42. Azari, S.; Papini, M.; Spelt, J.K. Effect of adhesive thickness on fatigue and fracture of toughened epoxy joints—Part I: Experiments. Eng. Fract. Mech. 2011, 78, 153–162. [Google Scholar] [CrossRef]
  43. Bascom, W.D.; Timmons, C.O.; Jones, R.L. Apparent interfacial failure in mixed-mode adhesive fracture. J. Mater. Sci. 1975, 10, 1037–1048. [Google Scholar] [CrossRef]
  44. Li, J.; Celiz, A.D.; Yang, J.; Yang, Q.; Wamala, I.; Whyte, W.; Seo, B.R.; Vasilyev, N.V.; Vlassak, J.J.; Suo, Z.; et al. Tough adhesives for diverse wet surfaces. Science 2017, 357, 378–381. [Google Scholar] [CrossRef] [Green Version]
Figure 1. Overview of the experimental design. (A) A visual representation of the shear test on metal cubes and adhesive (top), and an image of the shear test rig after testing (bottom, tested samples indicated with arrows). (B) An analysis of the tested samples, including measurement of the bond thickness (TAve), bond unevenness (ΔTMax), and failure mode (fMode) (top), and of the failure interface (bottom, scanning electron microscopy (SEM) image). (C) The measured factors were used in scatter plot analysis, and to build a linear regression model.
Chemengineering 04 00019 g001
Figure 2. Surface properties of cubes used for shear testing. (A–D) 3D profiles of representative steel (A, Sa = 1.23 μm) and aluminum cube surfaces (BD, Sa = 2.17, 1.72, 1.27 μm, respectively). Each profile represents a surface 1.681 mm × 1.681 mm. (E) Steel cubes following shear testing with Phosphoserine-modified cement (PMC) remaining on the surface. (F) Optical image (profilometer) of steel surface, with the scale (0–1681 μm) indicated on the X- and Y-axis. (G) One dimensional surface roughness plot of a representative surface from each group (Sa values for each sample indicated). The scale bars in A–D and F are in μm.
Chemengineering 04 00019 g002
Figure 3. Adhesive strength of PMC in varied preparation/application, and the cure conditions. (A) Different curing environments (phosphate-buffered saline (PBS), water, or 100% humidity) and grip duration (24 h, blue box; or 5 min, red box) before curing did not affect the adhesive strength of 27% PMC (from left to right: groups #1, 4, 2, 5, 3, 6). (B) When the grip duration was shortened and the grip force reduced to mimic clinical conditions, comparable adhesive strength was observed in all samples except the automated mixing sample (red border) and low grip force (3 N) samples gripped for 5 min (from left to right: groups #3, 9, 6, 10, 7, 11, 8, 12, 33, 34; the red border indicates high speed mixing; green border indicates bone samples). (C) Different mole ratios of phosphoserine to αTCP, and cure conditions, affected adhesive strengths (from left to right: groups #3, 14, 15; 19–21; 13, 16–18) (100% humidity samples were gripped for 1 min). (D) Adhesive strength of PMMA, 27%, or 90% PMC, to aluminum cubes with different surface roughness (gripped 1 min). All samples were prepared by hand mixing, gripped (31 N) for 24 h in PBS, using 27% PMC, unless otherwise indicated. Box plots represent the mean (midline), 75th (top box), and 25th percentile (bottom box), while whiskers represent the highest and lowest values in each group. Statistical comparisons made in 3C between different formulations, with an identical cure condition, are indicated by black brackets; while comparisons made between different cure conditions with identical formulation are indicated by colored brackets matching the group color in the legend (e.g., 70% PMC compared between PBS vs. PBS + H3PO4 vs. humid, pink bracket). In Figure 3C, within each cure condition, comparisons were made between the mean of 50% PMC and all other formulations. Comparison between group means were conducted with ANOVA (Tukey or Games-Howell post hoc analysis, for samples with homogeneous, or inhomogeneous variance), with * indicating p-values below 0.05, and ** indicating p-value below 0.01.
Chemengineering 04 00019 g003
Figure 4. Failure mode analysis. (A) The failure mode distribution of PMC formulations shown in Figure 3C plotted against shear strength. (BD) Box plots of failure mode include the average shear strength (line plot overlayed) for PMCs cured in PBS (B), in PBS with accelerant H3PO4 (C), or 100% humidity (D). Boxes located above the shear strength data point represent the proportion of samples that failed adhesively (adhesive and mixed mode failure), boxes located below the shear strength data point represent the proportion of samples that failed cohesively (combined and cohesive failure mode). Box color: dark blue indicates adhesive failure, light blue indicates mixed mode failure, pink indicates combined mode failure, and red indicates cohesive failure.
Chemengineering 04 00019 g004
Figure 5. Failure modes observed in PMC. (A1–A4) Representative samples showing cohesive (A1, 90% PMC, scored as “4” in the failure mode), adhesive (A2, PMMA, scored as “1” in the failure mode), mixed (A3, 50% PMC, scored as “2” in the failure mode), and combined (A4, 70% PMC, scored as “3” in failure mode) modes of failure. Note the distinct regions of cohesive (edge) and adhesive (central square region) failure in A4. The dimension of all metal cube surfaces was 1 × 1 cm. (B) The distribution of the failure mode by group (values of 0–1 adhesive; 1–2 mixed mode; 2–3 combined mode; 3–4 cohesive). (C–E) SEM image of the adhesive interface in regions of cohesive (C, 90% PMC), adhesive (D, 70% PMC), or combined (E, 70% PMC + H3PO4) mode failure. In (C) and (D), the metal surface is clearly distinguished by the polished roughness pattern. In (E), the interface between cohesive failure (left side) and adhesive failure (right side of image) is shown. The inset images in C show a higher magnification image of the calcium phosphate particle surface; in D show a high magnification image of the organic surface layer fragments that remain bound to the opposing cube surface, and in E show a cross section of a fractured disc of 70% PMC. The inset image in E was from a separate set of 70% PMC that was cured (ambient conditions) as a disc, on a polyethylene surface, to allow for undisturbed formation and imaging of the organic layer. The inset scale bars represent 1 μm, 200 nm, and 2 μm for C, D, and E, respectively.
Chemengineering 04 00019 g005
Figure 6. Scatter plot of PMC adhesive strength. (AD) A scatter plot correlation of 27% PMC, cured in different conditions, between shear strength and application time, bond thickness, the thickest (black)/thinnest (red) bond, and bond unevenness. (EH) A scatter plot correlation of different PMC formulations (27%–90%) between shear strength and application time, bond thickness, the thickest/thinnest bond, and bond unevenness.
Chemengineering 04 00019 g006
Table 1. Fixed factors and covariates for linear regression and scatter plot analysis.
FactorLevel 1Level 2Level 3Level 4
Cure conditions100% humidwaterPBS
Grip force (N)31 N3 N
Grip time (min)1 min5 min1440 min
Formula (mole%)27%50%70%90%
Mix typemanualautomated
Apply time (sec)
* Ave. thick (μm)
* Thickest (μm)
* Thinnest (μm)
* Skew (%)
* Failure modeadhesivemixedcombinedcohesive
* Covariates.
Table 2. Particle size and x-ray diffraction (XRD) analysis.
MaterialD(0.9) μmD(0.5) μmαTCP (wt%)HA (wt%)bTCP (wt%)
Surface12.82.08
Volume33.9
XRD 97.661.870.47
Table 3. Average profilometer value of surfaces used in shear testing.
GroupSa (um)Ra (um)Sq (um)Sku
Steel (US80 grit)1.23 ± 0.211.30 ± 0.261.69 ± 0.335.75 ± 0.78
Aluminum (US80 grit)2.17 ± 0.442.17 ± 0.582.94 ± 0.486.99 ± 3.18
Aluminum (US320 grit)1.72 ± 0.191.78 ± 0.312.30 ± 0.286.12 ± 1.61
Aluminum (US1200 grit)1.27 ± 0.321.33 ± 0.381.74 ± 0.429.60 ± 5.96
Table 4. General linear model significance (p) values
R2* R2CureMixForceTimeFormulaThickSkewFail
Shear10.3580.3160.5180.3170.2480.404-<0.0010.1140.004
Shear20.8000.782---0.930<0.001<0.0010.6870.001
* Adjusted R2.

