
Effects of Pore Connectivity on the Sorption of Fluids in Nanoporous Material: Ethane and CO2 Sorption in Silicalite


School of Earth Sciences, The Ohio State University, 275 Mendenhall Laboratory, 125 S Oval Mall, Columbus, OH 43210, USA
*
Author to whom correspondence should be addressed.
ChemEngineering 2021, 5(3), 55; https://0-doi-org.brum.beds.ac.uk/10.3390/chemengineering5030055
Submission received: 22 July 2021
/
Revised: 24 August 2021
/
Accepted: 26 August 2021
/
Published: 30 August 2021
(This article belongs to the Special Issue Feature Papers in Chemical Engineering)
Abstract
:Adsorption of fluids in nanoporous materials is important for several applications including gas storage and catalysis. The pore network in natural, as well as engineered, materials can exhibit different degrees of connectivity between pores. While this might have important implications for the sorption of fluids, the effects of pore connectivity are seldom addressed in the studies of fluid sorption. We have carried out Monte Carlo simulations of the sorption of ethane and CO2 in silicalite, a nanoporous material characterized by sub-nanometer pores of different geometries (straight and zigzag channel like pores), with varied degrees of pore connectivity. The variation in pore connectivity is achieved by selectively blocking some pores by loading them with methane molecules that are treated as a part of the rigid nanoporous matrix in the simulations. Normalized to the pore space available for adsorption, the magnitude of sorption increases with a decrease in pore connectivity. The increased adsorption in the systems where pore connections are removed by blocking them is because of additional, albeit weaker, adsorption sites provided by the blocker molecules. By selectively blocking all straight or zigzag channels, we find differences in the absorption behavior of guest molecules in these channels.
Keywords:
pore connectivity; CO2; ethane; adsorption; silicalite; GCMC simulation; methane; pore blockage; pore geometry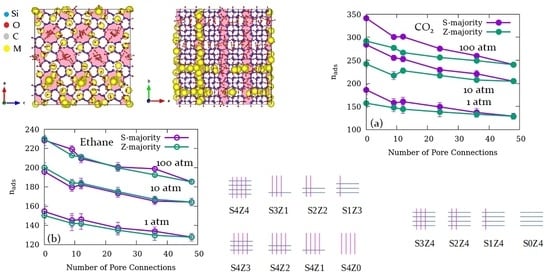
1. Introduction
Sorption of fluids in porous media is an essential aspect to understand the fluid-substrate interaction [1]. Sorption in nanoporous materials has also been suggested as a strategy for the storage of fluids, notably hydrogen and CO2, among others [2]. Estimates of fluid sorption in nano-porous materials have, therefore, been made using both experimental as well as computational tools [3,4]. While experiments on real nanoporous materials found in nature have been carried out, computational studies mainly deal with idealized versions of the nanoporous materials [5,6]. In real nanoporous materials, deviation from model pore structure can result from several factors. In recent computational studies, we have addressed the deviations caused by the inter-crystalline space that can be found in real samples of silicalite [7] and Mg-MOF-74 [8]. The models of silicalite and Mg-MOF-74 used in these computations had artificially inserted inter-crystalline space to represent a real powder sample used in the experiments. Silicalite is an all-silica analogue of ZSM-5 zeolite, and it is a model nanoporous material often used to study fluid-substrate interactions and confined fluid behavior [9,10,11,12,13,14]. With its network of ~0.55 nm diameter elliptical channels running along the crystallographic axis b and interconnected by channels of similar size running in a sinusoidal or zigzag fashion in the plane a–c, ZSM-5 provides a good opportunity to understand severe confinement with different pore geometries [12,13,14]. Further, the all-silica analogue—silicalite—makes the system chemically simpler.
Another factor that gives rise to deviation from the ideal nanopore structure often used in computer simulations is the variable degree of inter-connectivity of pores [15,16,17]. This is an important aspect as nanoporous matrices found in nature commonly have pores with different degrees of connectivity. For example, shale samples have been found to have different degrees of pore connectivity that affects their sorption capabilities [18]. In silicalite, pore connectivity may be reduced due to blockage of some channels that connect channels running perpendicular to them.
To address the effects that different degrees of pore connectivity might have on the sorption capabilities of silicalite, we report grand canonical Monte Carlo (GCMC) simulation studies of sorption of CO2 and ethane in silicalite. Different degrees of pore connectivity are realized by selectively blocking some channels with immobile methane molecules, which are treated as part of silicalite in the simulations. By selectively blocking all straight or zigzag channels, we find differences in the absorption behavior of guest molecules in these channels.
2. Materials and Methods
A model ZSM-5 pore network was generated using the co-ordinates provided by Koningsveld et al. [19]. As stated above, this zeolite has a network of ~0.55 nm diameter channels running straight and parallel to the crystallographic b axis and sinusoidally in the a–c plane crossing each other leading to slightly larger intersections. To model the adsorbent, a unit cell of ZSM-5 was replicated in the three Cartesian directions to get a 2 × 2 × 3 supercell of dimensions 40.044 × 39.798 × 40.149 Å3. The degree of connectivity between the pores was varied by selectively blocking some of the pore space. To accomplish this, initially methane was adsorbed in the supercell at −73 °C (200 K) and 200 atm pressure completely filling all the pore space in the supercell. GCMC simulation employing TraPPE-UA [20] force-field for methane and ClayFF [21] for the silicalite supercell was carried out using DL_Monte [22] for this. Subsequently, methane molecules were removed from some channels/pores selectively making them open and available for adsorbing other fluids (see Figure 1). The methane molecules act as analogues of organic matter blocking the pores in natural porous matrices and the left-over seed material in zeolites. In all, 12 model adsorbents were obtained with variable pore connectivity and total porosity. They are listed in Table 1 along with the corresponding number of pore connections and other relevant attributes. All these 12 model adsorbents are represented schematically in Figure 2, where free straight channels are represented by magenta vertical lines and free sinusoidal (zigzag) channels by blue horizontal lines. Channels blocked with methane are represented by absence of the corresponding line. For convenience, we name the different adsorbents using SnZm nomenclature, where the letters n and m denote, respectively, the fraction (out of 4) of straight (S) and zigzag (Z) channels that are open for imbibition and adsorption. For example, S4Z4 stands for the unmodified (without any methane) silicalite, while S2Z2 stands for the silicalite whose half straight and zigzag channels are either blocked or open. Initially, one molecule each of CO2 or ethane was loaded in silicalite. GCMC simulations were then carried out on the simulation cell obtained using DL-Monte [22]. During the simulation, the guest molecules, i.e., ethane or CO2, could be inserted/deleted, translated, or rotated with respective probabilities of 0.5, 0.25, and 0.25, while all silicalite atoms, along with the methane molecules blocking the pores, were kept rigid. All simulations were carried out using a series of gas partial pressures (up to 100 atm) at 35 °C. To make a direct comparison between ethane and CO2, both guest molecules, as the immobile methane were also modeled with the TraPPE-UA force field [20,23], while CLAYFF force field [21] was used to model the interactions of silicalite atoms. All cross-term interactions were calculated using the Lorentz-Berthelot mixing rules [6]. Two million Monte Carlo steps were sufficient to obtain statistically meaningful configurations. Of these, the first 500,000 steps were discarded to ensure the best values at equilibrium. Coordinates were sampled every 10,000 steps. Each simulation step yielded the number of adsorbed guest molecules. These were averaged over the production run and statistical measures of uncertainties obtained for the number of adsorbed molecules from this averaging. We note that GCMC simulations reported here are used to estimate the amount of fluid physi-sorbed in the substrate while ignoring any possibility of chemi-sorption.
3. Results
3.1. Effects of the Relative Number of Open Channels Available for Adsorption and Pore Connections
Complete adsorption isotherms for the partial pressures between 0.05 and 100 atm. for all systems listed in Table 1 are shown in Figure 3 (CO2), and Figure 4 (ethane). These isotherms demonstrate that the amount of adsorption of both fluids increases as expected when, progressively, a higher number of channels is made freely available for adsorption. For an even comparison, the adsorbed amount needs to be normalized with respect to the volume available for adsorption. For this, we focus on systems where half of all channel volume comprising straight, and zigzag channels is free while the other half is blocked. This is true for the five systems of S4Z0, S3Z1, S2Z2, S1Z3, and S0Z4 (see Table 1, yellow highlighted portion). The pore space available for sorption in all these systems is equal. Figure 5 shows the adsorption amounts of the two fluids at three gas partial pressures in these systems as a function of the percentage of straight channel space that is available for adsorption. The points in these plots represent the systems S0Z4–S4Z0 going from left to right. Note that the extreme cases of S0Z4 and S4Z0 involve no dual pore connectivity, while pore connectivity is highest in S2Z2. Thus, it can be inferred from Figure 5 that pore connectivity leads to a lowering of the amount of fluid sorption. For ethane, there is no significant difference in the amount of fluid adsorbed in S4Z0 or S0Z4, whereas for CO2, the amount of fluid adsorbed is clearly higher for S4Z0 compared to S0Z4. This suggests a preference for residing in the straight channels and intersections, vis a vis the zigzag channels by CO2, and is consistent with observations made earlier using MD simulations [24].
While Figure 5 shows that the adsorbed amount is unfavorably impacted by variable pore connectivity, the data shown in this figure encompasses only three different number of pore connections—0, 9, and 12. We therefore calculated the number of adsorbed fluid molecules normalized to free pore volume available in S4Z4 (unmodified silicalite). This normalized adsorption amount (nads) is shown in Figure 6 as a function of the number of pore connections. As shown in Table 1, a given number of pore connections can be achieved by making a larger number of straight or zigzag channels free for adsorption (systems highlighted in red and blue text color, respectively). We call these systems S-majority and Z-majority systems, respectively. Note that systems S4Z4 and S2Z2 are an exception to this, and while the data for S4Z4 are included in Figure 6 (rightmost data points in the plots), those for S2Z2 are not included. When normalized to the available space, the adsorbed amount of both fluids decreases with increase in the number of pore connections as also suggested by Figure 5. Unlike Figure 5 however, the decrease in the normalized amount of adsorption with an increase in pore connectivity is unambiguous and the difference in extreme cases is clearly beyond the uncertainty involved. While the nads values of ethane in both S-majority and Z-majority systems are similar within the uncertainties involved, those for CO2 get progressively more distinct beyond uncertainty as the number of pore connections is decreased—a consequence of CO2 preferring to reside in the straight channels as observed above.
3.2. Fluid-Fluid and Fluid-Substrate Interactions in S2Z2
In Figure 7, we show the radial distribution functions (RDF) representing the fluid-fluid and fluid-substrate pair interactions for CO2 (a) and ethane (b), adsorbed in S2Z2 at 100 atm. The highest-pressure simulation is selected for better statistics. CO2 and ethane are represented by the constituent peripheral atoms, namely oxygen (labeled Oc) for CO2 and the pseudo-atom CH3 for ethane. Oxygen and silicon atoms belonging to silicalite framework (labeled Os and Si respectively) and the blocker methane molecule/pseudo atom (labeled M) represent the substrate. The RDF of fluid-fluid pairs for CO2 exhibit peaks at smaller r values compared to ethane because of a higher fluid number density of CO2 at 100 atm compared to that of ethane. In general, the interactions of the substrate atoms with CO2 are stronger than that with ethane as can be seen by the position of the first peak in the RDF of substrate-fluid pairs in Figure 7a, as compared to that in Figure 7b. Of all the substrate atoms, the first RDF peak occurs at the farthest distance for both fluid-Si pairs. This is because the silicon atoms are occluded by oxygen atoms of silicalite, and only the latter interact directly with the adsorbed fluids. The first peaks of the RDF corresponding to CH3-M and Oc-M occur significantly earlier (at lower r) than the those for fluid-Si pairs and are comparably closer to the fluid-Os pairs in both cases. This suggests that the interaction of fluid molecules with the blocker is direct unlike that with the silicon atoms. Thus, the blocker can be seen as an additional adsorption site for the fluid molecules, albeit a weaker one in comparison to that provided by the oxygen atoms of silicalite. This explains the increase in nads as pore connections are reduced by blocking parts of intersecting pores with methane molecules.
3.3. Effect of Pore Connectivity on the Orientational Distribution of Fluid Molecules in the Straight Channels
Orientational distribution of fluid molecules can offer useful insights on the fluid–substrate and, in the present case, fluid-blocker interactions. In the case of silicalite, however, as the fluid molecules in the zigzag channels may show a high degree of disorder due to the geometrical restrictions imposed on them by the sinusoidal shape of the channels, it is more illustrative to consider the orientational distribution of fluid molecules adsorbed in the straight channels. This is because, with their simple geometry, the straight channels impose a unidirectional restriction on the adsorbed molecules. In Figure 8, we show the orientational distribution of fluid molecules in the straight channels of silicalite in terms of the angle made by the axis of the fluid molecule with the axis of the straight channels (i.e., Cartesian Y direction). The data is a sum of 200 equivalent configurations generated by the simulations consistent with the given pressure and temperature conditions. For comparison, the distribution expected for an isotropic medium with no preferred orientation is also included as a black line. We note that the number of available molecules becomes progressively smaller from S4Z0 to S0Z4 because of the decreasing number of free straight channels. However, it is noteworthy that, despite having all straight channels blocked in in S0Z4, some molecules in the zigzag channels might occupy the intersection of these channels with the straight channels. The intersections are blocked in the sense that their access from a straight channel is obstructed by an immobile methane molecule, while that from a zigzag channel is free (see inset, Figure 8a). These molecules will be counted as occupying straight channels too. Thus, the number of adsorbed molecules in the straight channels is non-zero even in the case of S0Z4. In S4Z0, all zigzag channels are blocked, and all the blocking methane molecules lie on the walls of straight channels in opposite pairs across the pore, whereas in S0Z4, the blockers occupy the straight channels along their axes, leaving intersections free (see inset, Figure 8a). Thus, the orientation of the pair of blocking molecules turns 90 degrees between S4Z0 and S0Z4. In S4Z0, CO2 shows a tendency for lying perpendicular to the pore axis, and ethane prefers to lie, making an angle of ~30degrees with it. The effect of progressively blocking the straight channels is a monotonous increase in the tendency of both molecules to orient perpendicular to the channel axis.
3.4. Effect of Pore Connectivity on the Distribution of Fluid Molecules in the Channels
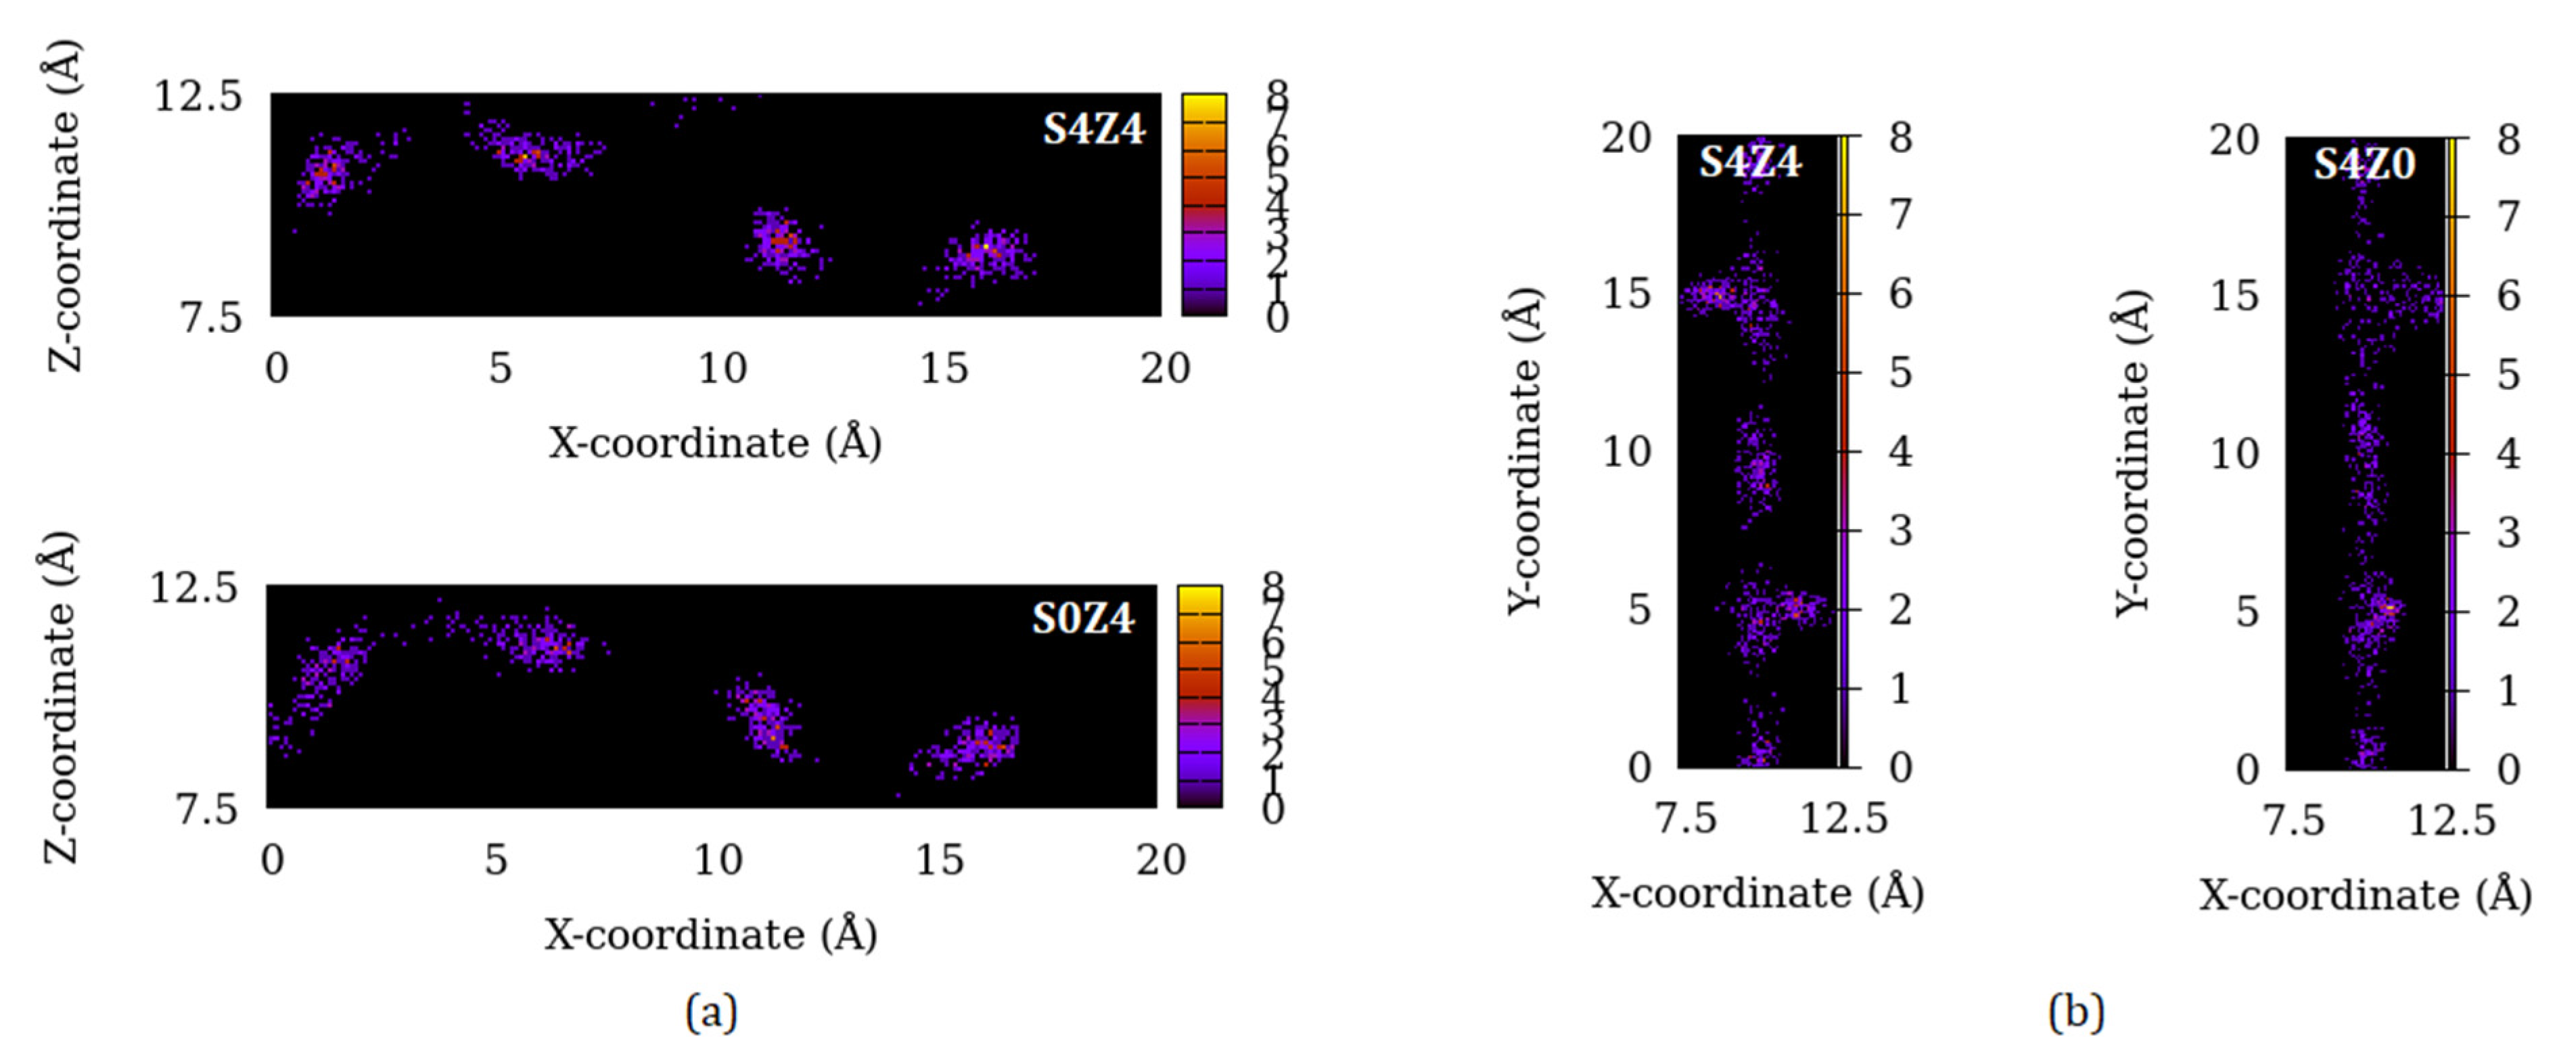
Figure 9 and Figure 10 show the distribution of CO2 and ethane molecules, respectively, in parts of the simulation cell indicated with the coordinates, when they are adsorbed at 100 atm in the systems S0Z4 (zigzag channels, left horizontal panels) and S4Z0 (straight channels, right vertical panels) compared with the unmodified silicalite (S4Z4). Figure 9a compares the distribution of CO2 molecules in the zigzag channels in S4Z4 (without any blocker molecules) with that in S0Z4 (with all straight channels blocked). The effect of the blocking pore connections within straight channels is to push the fluid molecules into narrower regions of high intensity that are better separated from each other. A similar, albeit relatively weaker, narrowing can also be seen in the straight channels (Figure 9b).
Compared to CO2, the distribution of ethane molecules (Figure 10) is characterized by more clearly defined separated regions of stronger adsorption. In straight channels, ethane molecules are restricted to narrower regions compared to CO2. This is because of a stronger interaction with the substrate due to the quadrupole moment CO2 molecules that adsorb closer to the channel walls compared to ethane molecules, which are pushed into the channel center. This is also visible in the RDF plots (Figure 7) where the RDF for CO2 atom pairs peak earlier than those involving ethane. Further, the effect of blocking of pore connections in ethane is weaker than that in CO2.
4. Discussion
The effect of pore connectivity studied in terms of blocked pore intersections is to increase the amount of adsorption normalized to volume. This is a result of additional adsorption sites provided by the methane molecule. Zhang et al. [25] have made a similar observation on the effects of amorphous organic carbon (AOC) on the CO2 adsorption in black carbon, wherein presence of AOC was found to enhance the adsorption amounts. In a natural material, the pore intersections can be blocked by the organic matter or by the inherent discontinuation of the pores. In the latter case, the role of the pore blocker is played by atoms of the constituent material itself. In case of a silica rich material one can therefore expect the methane here to be replaced by silica units, which will act as even stronger additional sites of adsorption. Further, if the Si/Al ratio in the substrate is finite, the counter-ions may also act as blocking molecules. With strong electrostatic interactions, these counter-ions may act as stronger adsorption sites compared to the methane used as blocker here. An inherent discontinuation of the pores can also be expected for porous materials that have a random distribution of pores. For example, it is possible to control the microstructure and pore sizes in nanoporous metals by controlling the conditions and strategies of synthesis [26]. Results presented above suggest that this control can be used to enhance the sorption capabilities of such nanoporous materials in addition to providing a way of controlling nanofluidic transport [27].
Figure 8 shows that, as more and more straight channels are blocked, both fluid molecules exhibit a tendency to lie perpendicular to the channel axis of the straight pore and therefore lie in the plane of zigzag pores. This orientation facilitates minimal interaction with the pore surface. As a result, the sorbed molecules occupy the pore center. This is consistent with the distribution of both fluid molecules in the channels getting narrower on reducing the pore connectivity (Figure 9 and Figure 10) and suggests that the fluid-fluid interactions become stronger than the fluid-substrate interactions. This may have important implications for the dynamical behavior of the adsorbed fluids as weaker fluid-substrate interactions may facilitate fluid diffusion in silicalite with lower degrees of pore connectivity. Indeed, pore connectivity has been found to suppress diffusion in an earlier work with a different way of connecting the pore [15]. In a future study, we plan to use the SnZm models developed here to study the effects of pore connectivity in silicalite on the dynamics of adsorbed fluids.
Although the pore connectivity is found to enhance the volume of normalized sorption amounts (nads) in general, for both fluids, the effects of selectively blocking the straight or zigzag pores differs significantly on CO2 sorption (Figure 6). The effects of pore geometry are thus apparently significant only for CO2 while for ethane pores of both types of geometry are equivalent. This could be because for ethane molecules that occupy mostly the central regions of the pore, the tortuosity of the zigzag pore geometry is not important, while for CO2, which interacts strongly with the pore surface, any twisting in the pore surface will have effects and so CO2 molecules exhibit a preference to occupy the straight channels instead of the zigzag channels.
5. Conclusions
We have obtained adsorption isotherms at 35 °C of CO2 and ethane in silicalite, with varying degrees of pore connectivity, in a range of gas partial pressures between 0.05 and 100 atm, using grand canonical Monte Carlo simulations. The degree of pore connectivity is varied between 100 and 0% for a total of 48 pore connections in the unmodified silicalite, by selectively blocking some channels with methane molecules that serve as pore blockers. By comparing the amount of fluid adsorbed in the different silicalite models normalized to the pore volume available in the unmodified silicalite, we observed that reducing the number of pore connections by blocking with methane molecules results in a higher adsorption for a given pore volume. This is because in a pore connection that is blocked, the blocker molecules provide an additional weaker site for fluid adsorption. By selectively blocking all straight or zigzag channels, we found differences in the absorption behavior of guest molecules in these channels. Comparing radial distribution functions and the distribution of adsorbed molecules in the channels reveals differences between the fluid-substrate interaction for CO2 and ethane. Although the degree of pore connectivity is found to have unambiguous effects on the adsorption of fluids, the effects of pore connectivity can be expected to be stronger on the dynamics of the adsorbed fluids with important practical implications for chemical separation and carbon capture. We plan to address these effects in a separate study that will use the models developed in this study.
Author Contributions
Conceptualization, formal analysis, investigation, methodology, validation, software, writing original draft, S.G.; funding acquisition, D.R.C.; writing—review and editing, S.G. and D.R.C. All authors have read and agreed to the published version of the manuscript.
Funding
This research was funded by the U. S. Department of Energy, Office of Basic Energy Sciences, Division of Chemical Sciences, Geosciences and Biosciences, Geosciences Program, grant number DESC000687.
Data Availability Statement
All data supporting the findings of this study are available within this article.
Acknowledgments
We would like to acknowledge STFC’s Daresbury Laboratory for providing the package DL-Monte which was used in this work. Figures shown in this manuscript were prepared using the visualization package VESTA [28] and general-purpose plotting software gnuplot [29]. A part of this work used the computational resources provided by A. P. Sloan Foundation funded Deep Carbon Observatory and hosted at the Rensselaer Polytechnic Institute. We gratefully acknowledge the support provided by our late colleague Peter Fox in this regard.
Conflicts of Interest
The authors declare that there is no conflict of interest.
References
- Králik, M. Adsorption, chemisorption, and catalysis. Chem. Pap. 2014, 68, 1625–1638. [Google Scholar] [CrossRef]
- Modak, A.; Jana, S. Advances in porous adsorbents for CO2 capture and storage. In Carbon Dioxide Chemistry, Capture and Oil Recovery; Books on Demand: Norderstedt, Germany, 2018; pp. 165–183. [Google Scholar]
- Klewiah, I.; Berawala, D.S.; Walker, H.C.A.; Andersen, P.Ø.; Nadeau, P.H. Review of experimental sorption studies of CO2 and CH4 in shales. J. Nat. Gas Sci. Eng. 2020, 73, 103045. [Google Scholar] [CrossRef]
- Smit, B.; Maesen, T.L.M. Molecular simulations of zeolites: Adsorption, diffusion, and shape selectivity. Chem. Rev. 2008, 108, 4125–4184. [Google Scholar] [CrossRef] [PubMed]
- Gautam, S.S.; Ok, S.; Cole, D.R. Structure and dynamics of confined C-O-H fluids relevant to the subsurface: Application of magnetic resonance, neutron scattering, and molecular dynamics simulations. Front. Earth Sci. 2017, 5, 43. [Google Scholar] [CrossRef] [Green Version]
- Allen, M.P.; Tildesley, D.J. Computer Simulation of Liquids; Oxford University Press: Oxford, UK, 2017. [Google Scholar]
- Gautam, S.; Cole, D.R. Effects of inter-crystalline space on the adsorption of ethane and CO2 in silicalite: Implications for enhanced adsorption. Phys. Chem. Chem. Phys. 2020, 22, 13951–13957. [Google Scholar] [CrossRef]
- Gautam, S.; Cole, D. CO2 Adsorption in Metal-Organic Framework Mg-MOF-74: Effects of Inter-Crystalline Space. Nanomaterials 2020, 10, 2274. [Google Scholar] [CrossRef]
- Zhen, S.; Seff, K. Structures of organic sorption complexes of zeolites. Microporous Mesoporous Mater. 2000, 39, 1–18. [Google Scholar] [CrossRef]
- García-Pérez, E.; Parra, J.B.; Ania, C.; García-Sánchez, A.; Van Baten, J.M.; Krishna, R.; Dubbeldam, D.; Calero, S. A computational study of CO2, N2, and CH4 adsorption in zeolites. Adsorption 2007, 13, 469–476. [Google Scholar] [CrossRef] [Green Version]
- Razavian, M.; Fatemi, S.; Masoudi-Nejad, M. A comparative study of CO2 and CH4 adsorption on silicalite-1 fabricated by sonication and conventional method. Adsorpt. Sci. Technol. 2014, 32, 73–87. [Google Scholar] [CrossRef] [Green Version]
- Gautam, S.; Liu, T.; Patankar, S.; Tomasko, D.; Cole, D. Location dependent orientational structure and dynamics of ethane in ZSM5. Chem. Phys. Lett. 2016, 648, 130–136. [Google Scholar] [CrossRef] [Green Version]
- Dhiman, I.; Bhowmik, D.; Shrestha, U.R.; Cole, D.; Gautam, S. Effect of molecular shape on rotation under severe confinement. Chem. Eng. Sci. 2018, 180, 33–41. [Google Scholar] [CrossRef]
- Dhiman, I.; Shrestha, U.; Bhowmik, D.; Cole, D.; Gautam, S. Influence of molecular shape on self-diffusion under severe confinement: A molecular dynamics study. Chem. Phys. 2019, 516, 92–102. [Google Scholar] [CrossRef] [Green Version]
- Kummali, M.; Cole, D.; Gautam, S. Effect of Pore Connectivity on the Behavior of Fluids Confined in Sub-Nanometer Pores: Ethane and CO2 Confined in ZSM-22. Membranes 2021, 11, 113. [Google Scholar] [CrossRef]
- Sakai, M.; Sasaki, Y.; Kaneko, T.; Matsukata, M. Contribution of Pore-Connectivity to Permeation Performance of Silicalite-1 Membrane; Part I, Pore Volume and Effective Pore Size. Membranes 2021, 11, 382. [Google Scholar] [CrossRef]
- Sakai, M.; Sasaki, Y.; Kaneko, T.; Matsukata, M. Contribution of Pore-Connectivity to Permeation Performance of Silicalite-1 Membrane; Part II, Diffusivity of C6 Hydrocarbon in Micropore. Membranes 2021, 11, 399. [Google Scholar] [CrossRef]
- Chandra, D.; Vishal, V.; Bahadur, J.; Sen, D. A novel approach to identify accessible and inaccessible pores in gas shales using combined low-pressure sorption and SAXS/SANS analysis. Int. J. Coal Geol. 2020, 228, 103556. [Google Scholar] [CrossRef]
- Van Koningsveld, H.; Van Bekkum, H.; Jansen, J.C. On the location and disorder of the tetrapropylammonium (TPA) ion in zeolite ZSM-5 with improved framework accuracy. Acta Crystallogr. Sect. B Struct. Sci. 1987, 43, 127–132. [Google Scholar] [CrossRef] [Green Version]
- Martin, M.G.; Siepmann, J.I. Transferable potentials for phase equilibria. 1. United-atom description of n-alkanes. J. Phys. Chem. B 1998, 102, 2569–2577. [Google Scholar] [CrossRef]
- Cygan, R.T.; Liang, J.-J.; Kalinichev, A. Molecular models of hydroxide, oxyhydroxide, and clay phases and the development of a general force field. J. Phys. Chem. B 2004, 108, 1255–1266. [Google Scholar] [CrossRef]
- Purton, J.A.; Crabtree, J.C.; Parker, S.C. DL_MONTE: A general purpose program for parallel Monte Carlo simulation. Mol. Simul. 2013, 39, 1240–1252. [Google Scholar] [CrossRef]
- Potoff, J.J.; Siepmann, J.I. Vapor-liquid equilibria of mixtures containing alkanes, carbon dioxide, and nitrogen. AIChE J. 2001, 47, 1676–1682. [Google Scholar] [CrossRef]
- Gautam, S.; Liu, T.; Cole, D. Sorption, Structure and Dynamics of CO2 and Ethane in Silicalite at High Pressure: A Combined Monte Carlo and Molecular Dynamics Simulation Study. Molecules 2019, 24, 99. [Google Scholar] [CrossRef] [Green Version]
- Zhang, J.; Sequaris, J.-M.; Klumpp, E. Effects of natural organic matter on the microporous sorption sites of black carbon in a Yangtze River sediment. Environ. Sci. Pollut. Res. 2013, 20, 6992–6998. [Google Scholar] [CrossRef] [PubMed]
- Xue, Y.; Markmann, J.; Duan, H.; Weissmüller, J.; Huber, P. Switchable imbibition in nanoporous gold. Nat. Commun. 2014, 5, 4237. [Google Scholar] [CrossRef] [Green Version]
- Koya, A.N.; Zhu, X.; Ohannesian, N.; Yanik, A.A.; Alabastri, A.; Zaccaria, R.P.; Krahne, R.; Shih, W.-C.; Garoli, D. Nanoporous Metals: From Plasmonic Properties to Applications in Enhanced Spectroscopy and Photocatalysis. ACS Nano 2021, 15, 6038–6060. [Google Scholar] [CrossRef] [PubMed]
- Momma, K.; Fujio, I. VESTA: A three-dimensional visualization system for electronic and structural analysis. J. Appl. Crystallogr. 2008, 41, 653–658. [Google Scholar] [CrossRef]
- Williams, T.; Kelley, C.; Lang, R.; Kotz, D.; Campbell, J. Gnuplot 4.6: An Interactive Plotting Program. 2014. Available online: http://gnuplot.info (accessed on 2 June 2021).
Figure 1.
Simulation snapshots of CO2 adsorption in the system S2Z2 at 100 atm in the crystallographic planes a–c (a) and a–b (b). The straight channels in the silicalite samples are highlighted in pink. Half of the straight and zigzag channels are blocked by stuffing them with methane molecules, which are shown as yellow spheres.

Figure 2.
Schematic showing the definition of different systems. Each vertical line in magenta shows free straight channels while blue horizontal lines show free zigzag channel. The blocked channels are marked by an absence of the corresponding line. S4Z4 corresponds to the unmodified silicalite with no pore blocked with methane.

Figure 3.
Adsorption isotherms of CO2 in silicalite from GCMC simulations of (a) S-majority, (b) Z-majority, and (c) half-blocked models as included in Table 1.
Figure 3.
Adsorption isotherms of CO2 in silicalite from GCMC simulations of (a) S-majority, (b) Z-majority, and (c) half-blocked models as included in Table 1.

Figure 4.
Adsorption isotherms of ethane in silicalite from GCMC simulations of (a) S-majority, (b) Z-majority, and (c) half-blocked models as included in Table 1.
Figure 4.
Adsorption isotherms of ethane in silicalite from GCMC simulations of (a) S-majority, (b) Z-majority, and (c) half-blocked models as included in Table 1.

Figure 5.
Number of fluid molecules (a) CO2 and (b) ethane adsorbed in systems with half of the pore space in the unmodified silicalite blocked/free (systems in the portion of Table 1 highlighted in yellow), as a function of the percentage of straight channels that are open. The X-axis can also be read as the percentage of open zigzag channels, decreasing from 100 (left-most data point) to 0 (rightmost data point).

Figure 6.
Amount of fluid adsorbed, (a) CO2 and (b) ethane, normalized to the pore volume available in the unmodified silicalite (S4Z4) as a function of the number of pore connections. Bars on symbols signify the extent of uncertainty in the calculations.
Figure 6.
Amount of fluid adsorbed, (a) CO2 and (b) ethane, normalized to the pore volume available in the unmodified silicalite (S4Z4) as a function of the number of pore connections. Bars on symbols signify the extent of uncertainty in the calculations.

Figure 7.
Radial distribution functions of the fluid-fluid and fluid-substrate pairs for (a) CO2 and (b) Ethane adsorbed in S2Z2 at 100 atm.
Figure 7.
Radial distribution functions of the fluid-fluid and fluid-substrate pairs for (a) CO2 and (b) Ethane adsorbed in S2Z2 at 100 atm.

Figure 8.
Distribution of angles between the axis of the straight channels and the molecular axis of (a) CO2 and (b) ethane molecules adsorbed in the half-blocked systems (yellow portion of Table 1) at a pressure of 100 atm. The schematic in inset of (a) shows the position of methane molecules blocking the approach to zigzag or straight channels in the systems S4Z0 and S0Z4. A part of a typical straight channel is shown as a cylinder here, and the methane molecules are shown as yellow discs.

Figure 9.
Distribution of the center of mass of CO2 molecules adsorbed in (a) zigzag and (b) straight channels of unmodified silicalite (S4Z4) and silicalite with all straight (S0Z4) and zigzag (S4Z0) channels blocked. The intensity corresponds to the number of fluid molecules found at a location in 200 configurations of the system.

Figure 10.
Distribution of the center of mass of ethane molecules adsorbed in (a) zigzag and (b) straight channels of unmodified silicalite (S4Z4) and silicalite with all straight (S0Z4) and zigzag (S4Z0) channels blocked. The intensity corresponds to the number of fluid molecules found at a location in 200 configurations of the system.


Table 1.
Different systems simulated and the corresponding number of pore connections. S4Z4 is the unmodified silicalite. Systems with a larger number of straight channels that are free, compared to free zigzag channels, are highlighted with red-colored text (S-majority), while those with a larger number of free zigzag channels, compared to free straight channels, are highlighted in blue-colored text (Z-majority). Systems where half of the free space available in the unmodified silicalite is blocked/free are highlighted with yellow background and the system S2Z2 with half each of the straight and zigzag channels blocked/free is shown in green text color.
| System name | Open Straight Channels (% of Total) | Open Sinusoidal Channels (% of Total) | Number of Pore Connections | Fraction of Total Pore Volume Available |
|---|---|---|---|---|
| S4Z4 | 100 | 100 | 48 | 1.0 |
| S4Z3 | 100 | 75 | 36 | 0.875 |
| S4Z2 | 100 | 50 | 24 | 0.75 |
| S4Z1 | 100 | 25 | 12 | 0.625 |
| S4Z0 | 100 | 0 | 0 | 0.50 |
| S3Z1 | 75 | 25 | 9 | 0.50 |
| S2Z2 | 50 | 50 | 12 | 0.50 |
| S1Z3 | 25 | 75 | 9 | 0.50 |
| S0Z4 | 0 | 100 | 0 | 0.50 |
| S1Z4 | 25 | 100 | 12 | 0.625 |
| S2Z4 | 50 | 100 | 24 | 0.75 |
| S3Z4 | 75 | 100 | 36 | 0.875 |
Publisher’s Note: MDPI stays neutral with regard to jurisdictional claims in published maps and institutional affiliations. |
© 2021 by the authors. Licensee MDPI, Basel, Switzerland. This article is an open access article distributed under the terms and conditions of the Creative Commons Attribution (CC BY) license (https://creativecommons.org/licenses/by/4.0/).
Share and Cite
MDPI and ACS Style
Gautam, S.; Cole, D.R. Effects of Pore Connectivity on the Sorption of Fluids in Nanoporous Material: Ethane and CO2 Sorption in Silicalite. ChemEngineering 2021, 5, 55. https://0-doi-org.brum.beds.ac.uk/10.3390/chemengineering5030055
AMA Style
Gautam S, Cole DR. Effects of Pore Connectivity on the Sorption of Fluids in Nanoporous Material: Ethane and CO2 Sorption in Silicalite. ChemEngineering. 2021; 5(3):55. https://0-doi-org.brum.beds.ac.uk/10.3390/chemengineering5030055
Chicago/Turabian StyleGautam, Siddharth, and David R. Cole. 2021. "Effects of Pore Connectivity on the Sorption of Fluids in Nanoporous Material: Ethane and CO2 Sorption in Silicalite" ChemEngineering 5, no. 3: 55. https://0-doi-org.brum.beds.ac.uk/10.3390/chemengineering5030055