
Chemical Model for Thermal Treatment of Sewage Sludge


Department of Energy and Process Engineering, Norwegian University of Science and Technology, 7491 Trondheim, Norway
*
Author to whom correspondence should be addressed.
ChemEngineering 2022, 6(1), 16; https://0-doi-org.brum.beds.ac.uk/10.3390/chemengineering6010016
Submission received: 23 December 2021
/
Revised: 19 January 2022
/
Accepted: 25 January 2022
/
Published: 7 February 2022
(This article belongs to the Special Issue Thermal Treatment of Biomass and Solid Municipal Waste)
Abstract
:Sewage sludge is here studied as a valuable source for processing or energy conversation thanks to its high nutrition and energy content. However, various origins of the wastewater, different water cleaning technologies, and seasonal and regional dependencies lead to the high variability of the sewage sludge properties. In thermal treatment units, that is, incineration, gasification and pyrolysis, sewage sludge serves as feedstock or fuel, hence a proper characterization and a mathematical description of the sewage sludge are required to estimate product streams and to formulate numerical simulations and optimization methods. The presented work introduces a surrogate concept that allows replication of sewage sludge’s ultimate composition, moisture, and ash content. The surrogate approach aims to model the decomposition of any sewage sludge sample, opposite to the established determination of kinetic rates for individual samples. Based on chemical solid surrogate species and corresponding reaction mechanisms, the thermal decomposition path is described. Sewage sludge is represented by a combination of lignocellulosic species, proteins, sugars, lipids, and representative inorganic species. The devolatilization and heterogeneous reactions are formulated such that they can be used together with a detailed gas-phase model, including tar oxidation and emission models for nitrogen and sulfur oxides, recently proposed by the authors. The developed chemical model is applied using a zero-dimensional gasification reactor in order to model weight loss within the thermogravimetric analysis, pyrolysis, gasification and combustion conditions. Weight loss, the composition of product gases, and emission release (nitrogen and sulfur oxides) are captured well by the model. The flexible surrogate approach allows us to represent various sewage sludge samples.
1. Introduction
Sewage sludge is a by- or waste product accumulating in the wastewater cleaning process. Municipal wastewater combines domestic, industrial and surface water, and hence, the sewage sludge includes leftovers from households, industry, and agriculture. As with other waste streams, nowadays, sewage sludge is considered a resource, and the recovery of materials and energy content are targeted [1]. The sludge typically has high contents of nutrients such as nitrogen (1.5–5.6 wt% dry) and phosphorus (0.6–2.8 wt% dry) [2,3,4], which makes it an attractive fertilizer for agriculture as well as raw material for composting [5,6]. Nevertheless, due to the diverse origin of the wastewater, sewage sludge contains different harmful contaminants. These contaminants consist of inorganic compounds, for example, heavy metals [3,4,6], and organic substances, for example, pesticides, pharmaceuticals [7,8]. Because of this potential hazard to the environment and human health, legislative restrictions are implemented for direct agricultural use or depositing to land-fillings [4,9]. At the same time, with a growing world population, the accumulated volume of sewage sludge is rising [6,9]. Thermal treatment of sewage sludge is a measure for waste management and the integration of the resource into the future circular economy [6]. Different thermal treatment units allow for the re-use of the waste, recovering materials or energy and, thanks to the high temperatures, sterilization or destruction of toxic organic compounds [4,10]. The processes are incineration, gasification, pyrolysis, or a combination of these technologies. During incineration, the sludge’s energy content is used for heat generation, and the volume of the solid waste stream is reduced by 90% [8]. In gasification devices, the sewage sludge is partially oxidized to yield a high caloric producer gas or syngas used for heat and power generation [8,11] and a char fraction. Pyrolysis is the endothermic conversion under a reducing atmosphere and favors the formation of tar (oils) and char. Thermodynamic conditions and residence time decide on the quality and amount of the products (oil, gas, and char) [8]. Depending on the origin of the wastewater and its treatment process, the properties of sewage sludge vary widely. For all thermal treatment processes, the varying feedstock is one of the key challenges. Here, the most relevant properties are the moisture content, due to the high energy demand for drying [6,12], the ratio of volatile components and ash—since this is correlated to the lower heating value of the sewage sludge [13]—and the content of elements involved in emission formation processes, that is, nitrogen, sulfur and chlorine [14,15,16,17,18]. To handle this challenging fuel, often sewage sludge is mixed with other solid fuels, such as biomass wastes, in co-gasification [19] and co-incineration in the cement industry [4,20].
In order to support the further technological development of thermal treatment units, it is desirable to employ simulations to understand further and optimize the processes. Goals are improved thermal efficiency, amount and quality of the products, and minimal emission formation. Since the variability of the sewage sludge properties is a determining factor within the conversion process, the model formulation must be sensitive to changes in the feedstock. The classical approach in biomass and waste research is to determine kinetic parameters for specific waste fractions and their mixtures [15,21,22,23,24,25,26,27,28,29] or to determine pseudo representative species for an individual feedstock [30]. These methods are based on empirical material-specific apparent reaction rates and cannot directly be transferred to other feedstocks [31]. Contrary, the flexible representation of various solid fuels using reoccurring characteristic surrogate species offers the description of the needed dependencies of the solid fuel and the gas phase products (gas, tar, and emission precursors) [31,32,33]. The surrogate concept is the state-of-the-art in liquid (e.g., Diesel and gasoline) and gaseous fuels modeling and has previously been used within the solid fuel conversion of coal and biomass [32,33,34,35,36,37,38]. For example, Debiagi et al. [36] achieved the mathematical description of more than 500 biomass and waste fraction samples, such as woods, grass plants, algae and food industry wastes, with nine reference species, including moisture and ash. Recently, the concept was also applied to describe the heterogeneous feedstock of municipal solid waste (MSW) [31]. Žnidarčič et al. [39] empathized the ability of a surrogate model to account for different sewage sludge properties and introduced a surrogate model for the description of the gas phase. However, to the author’s best knowledge, the literature lacks a surrogate description and corresponding model ranging from the solid feedstock via its thermal conversion to the resulting gas-phase products and emission precursors.
The presented work aims to formulate a mathematical description of sewage sludge to model thermal treatment units. The model is formulated by selecting existing surrogate components from the literature [31,32,38] and their devolatilization schemes and combing them with corresponding gas-phase chemistry [31]. The model development is described in Section 2.2, discussing the surrogate species selection (Section 2.2.1), their devolatilization scheme (Section 2.2.2), and their combination to a sewage sludge surrogate (Section 2.2.3). The approach is validated towards ultimate composition measurements (Section 3.1) and thermogravimetric (TG) measurements (Section 3.2), for pyrolysis and gasification in a technical scale application (Section 3.3) and the emission release under an incineration atmosphere (Section 3.3).
2. Materials and Methods
2.1. Numerical Model
The stochastic gasification model available in LOGEresearch version 1.10 [40] is chosen for the chemical model development and validation against different experiments from the literature. It is selected since it is targeted to solve large detailed chemistry schemes and to resolve the devolatilization, heterogeneous reactions of solid and gas phase, and reactions in the gas phase. Depending on the provided chemistry and operating conditions, it allows us to model pyrolysis, gasification, and combustion applications [31,41,42].
This gasification model is based on three physical phases—the solid particles, the pore gas within the particles, and the bulk gas. The reactor’s volume is discretized into non-dimensional virtual packages. These virtual packages are, in the following, called stochastic particles and include each of the three phases. The conversion process of the solid fuel is governed by stochastic heating, mixing of the gas phase, and chemistry integration. Preheated gas flows and hot reactor walls can heat up the reactor. In the mixing step, heat is also transferred between the wall and solid particles, between solid particles, and between stochastic particles’ gas phases. The stochastic mixing mimics the turbulent gas flow and is controlled via the mixing time. The mixing time is correlated to the turbulent kinetic energy and its dissipation ratio and describes the mixing events within a numerical time step. Infinitely fast mixing would result in a homogeneous mixture, while low mixing conserves and evolves inhomogeneity within the reactor [42]. Highly turbulent flows, as in entrained flow gasifiers, are described by mixing times between 0.001 to 0.05 s [40], while for grate-fired applications, 1 s is assumed to be representative [42], which results in one mixing event per time step. The stochastic heat transfer and the mixing lead to a temperature distribution over the stochastic particles. This temperature field leads to locally different (stochastic particle level) predictions of species and heat release. This changes in the discrete realization of the joint probability density function of species and enthalpy that is further evolved in each time step. While the ensemble of the stochastic particles reproduces a distribution in species concentrations (gas and solid phase) and temperatures within the reactor, their concentration within a stochastic particle is assumed to be homogeneous in order to close the chemistry source terms. In the chemistry step, the equations for devolatilization and the surface reactions are first solved together with that of the mass transfer. Second, gas-phase kinetics and radiation are addressed. The mass source term from solid to gas phase is used to update the representative diameters of the solid particles. A more detailed description of the model is provided elsewhere [40,41,42].
2.2. Chemical Model Development
2.2.1. Selection of the Surrogate Species
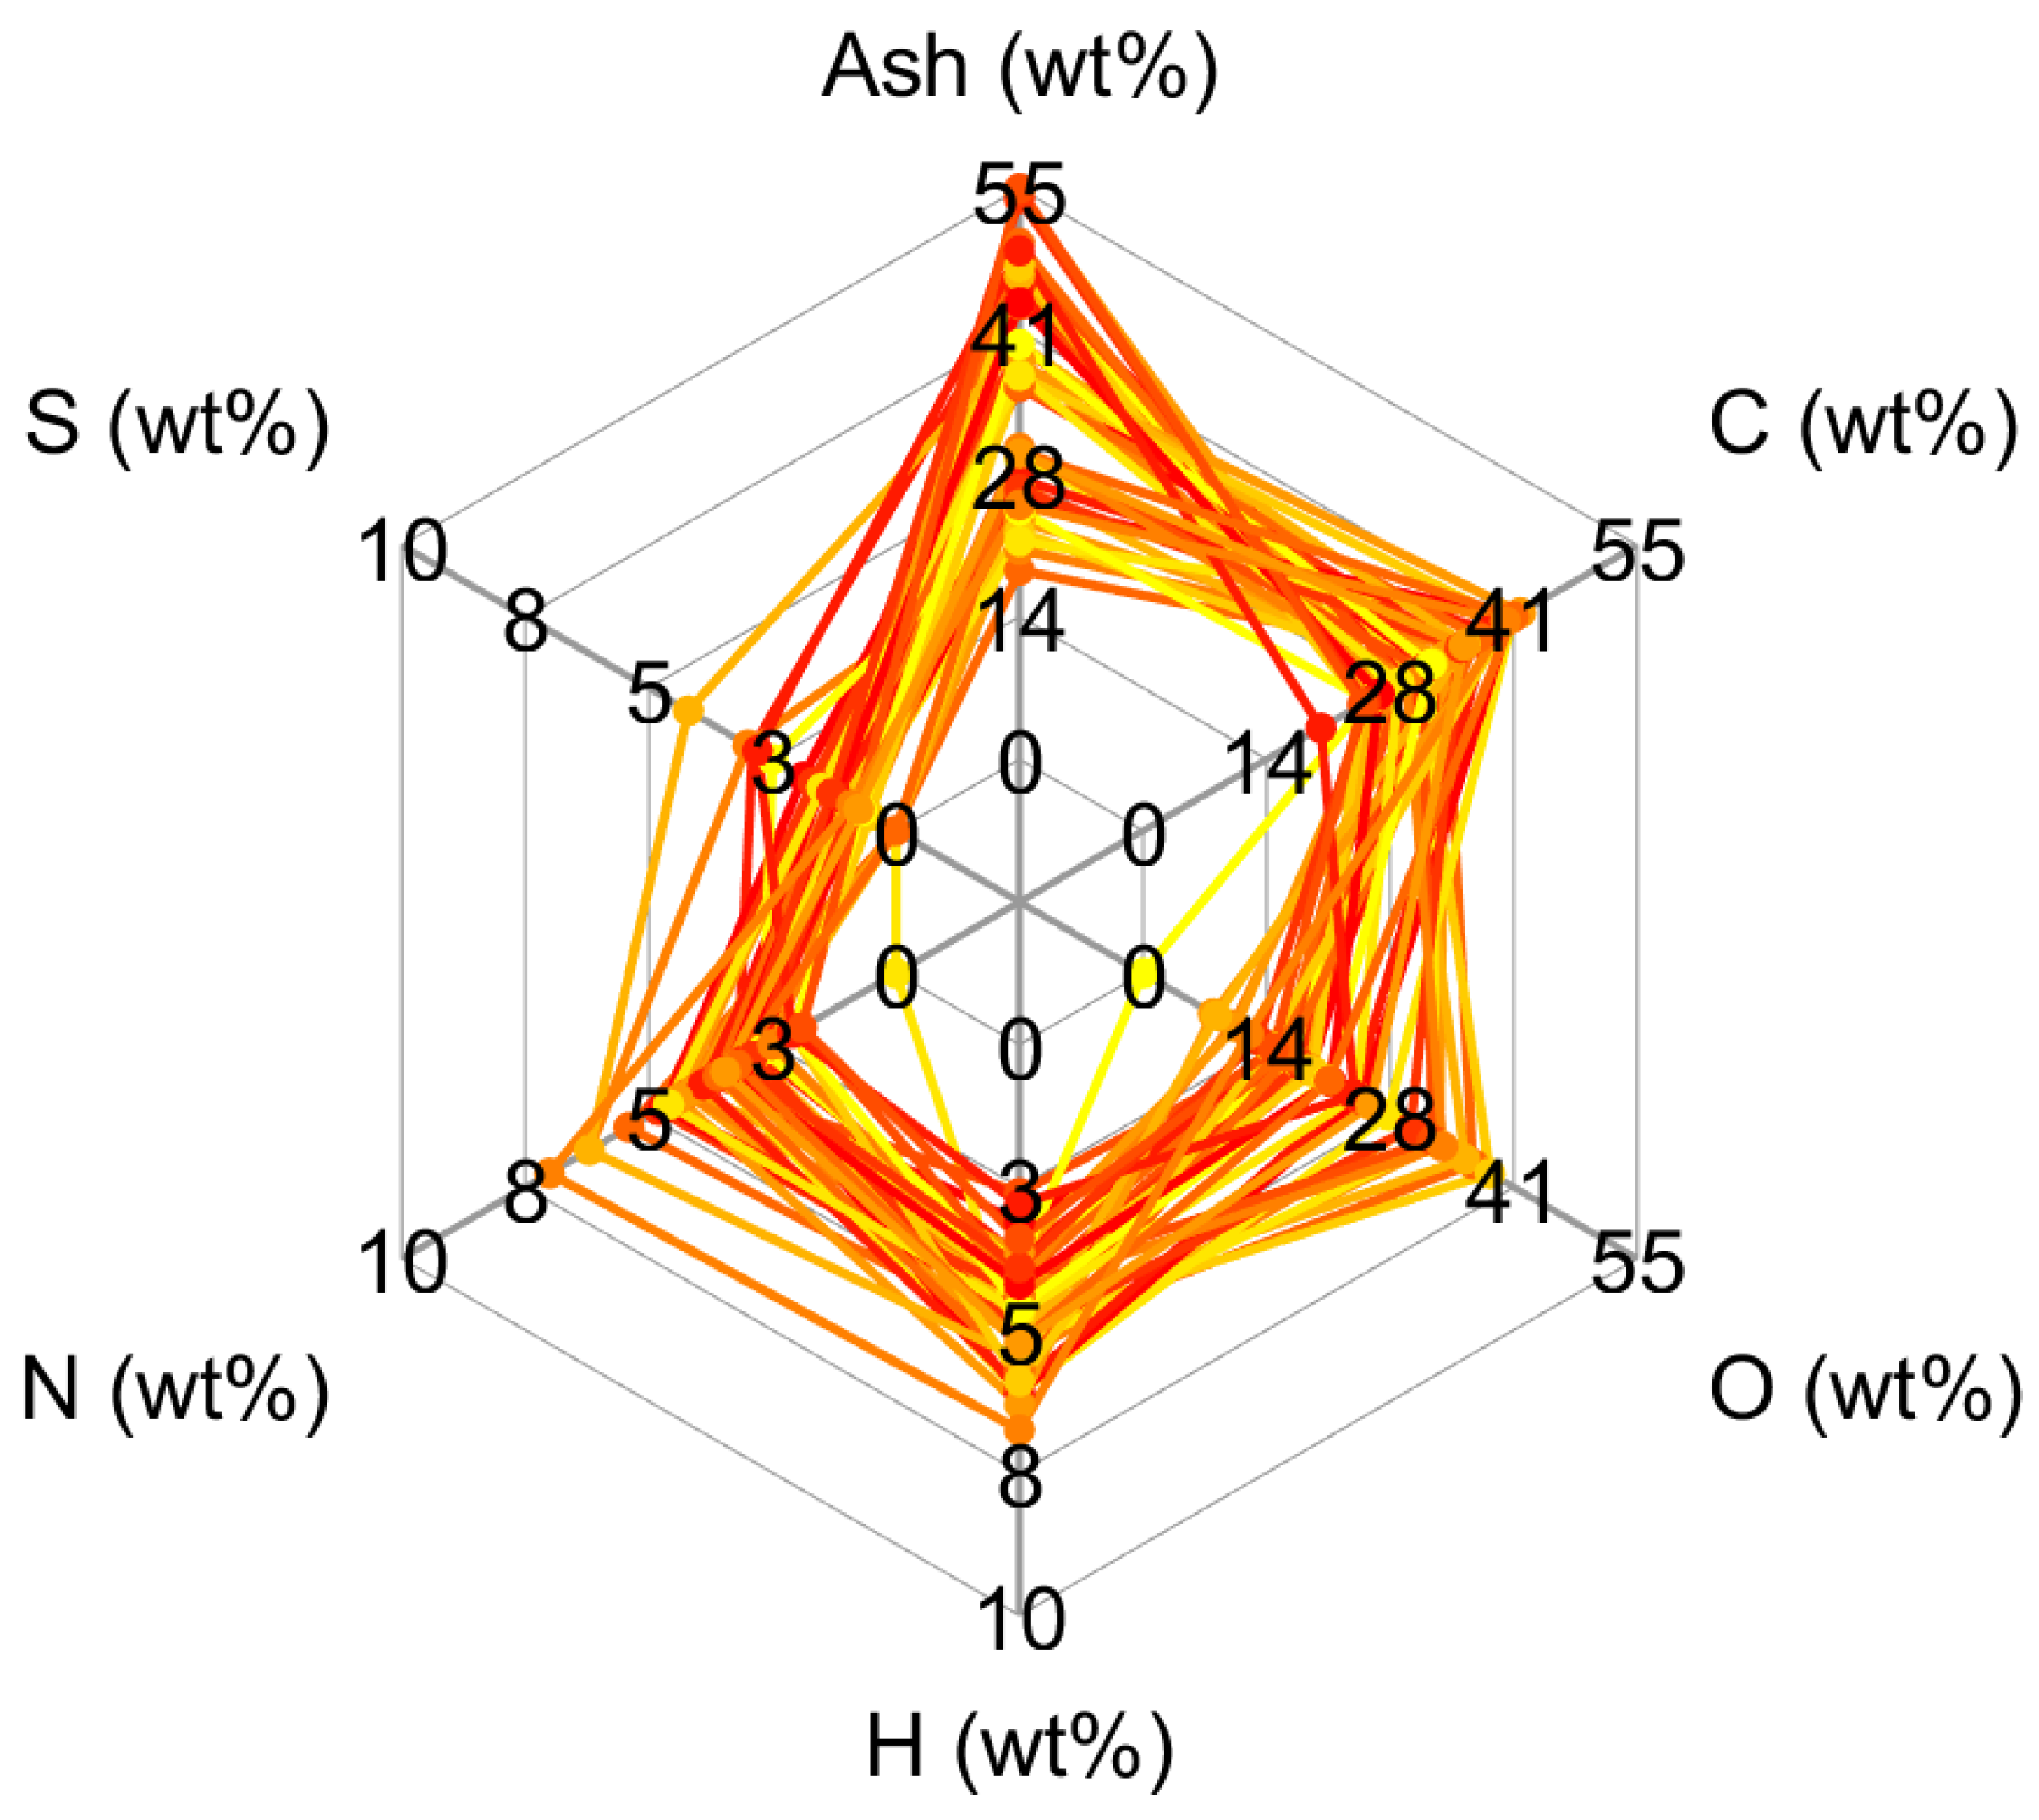
Sewage sludge typically has a content of 40 wt% to 60 wt% of volatile solid matter (mass percent, dry, ash-included) considered a valuable bio-originated energy source [4]. This volatile matter has due to their domestic, industrial and agriculture origin a complex composition including carbohydrates, protein, oil, lignocellulosic compounds, humic substances and more [3]. The sludges composition depends on the origin and the applied wastewater treatment technology, and varies largely. The ultimate composition (mass percent, dry, ash-included) can vary; for carbon from 20 wt% to 42 wt%, for hydrogen from 2.5 wt% to 6.8 wt%, oxygen from 8 wt% to 38 wt% and nitrogen from 2 wt% to 7 wt%. These ranges are rounded minimum and maximum values reported in the literature [10,43,44] and accessed via the Phyllis2 database [45,46,47,48,49,50,51]. Their variation is summarized in Figure 1.
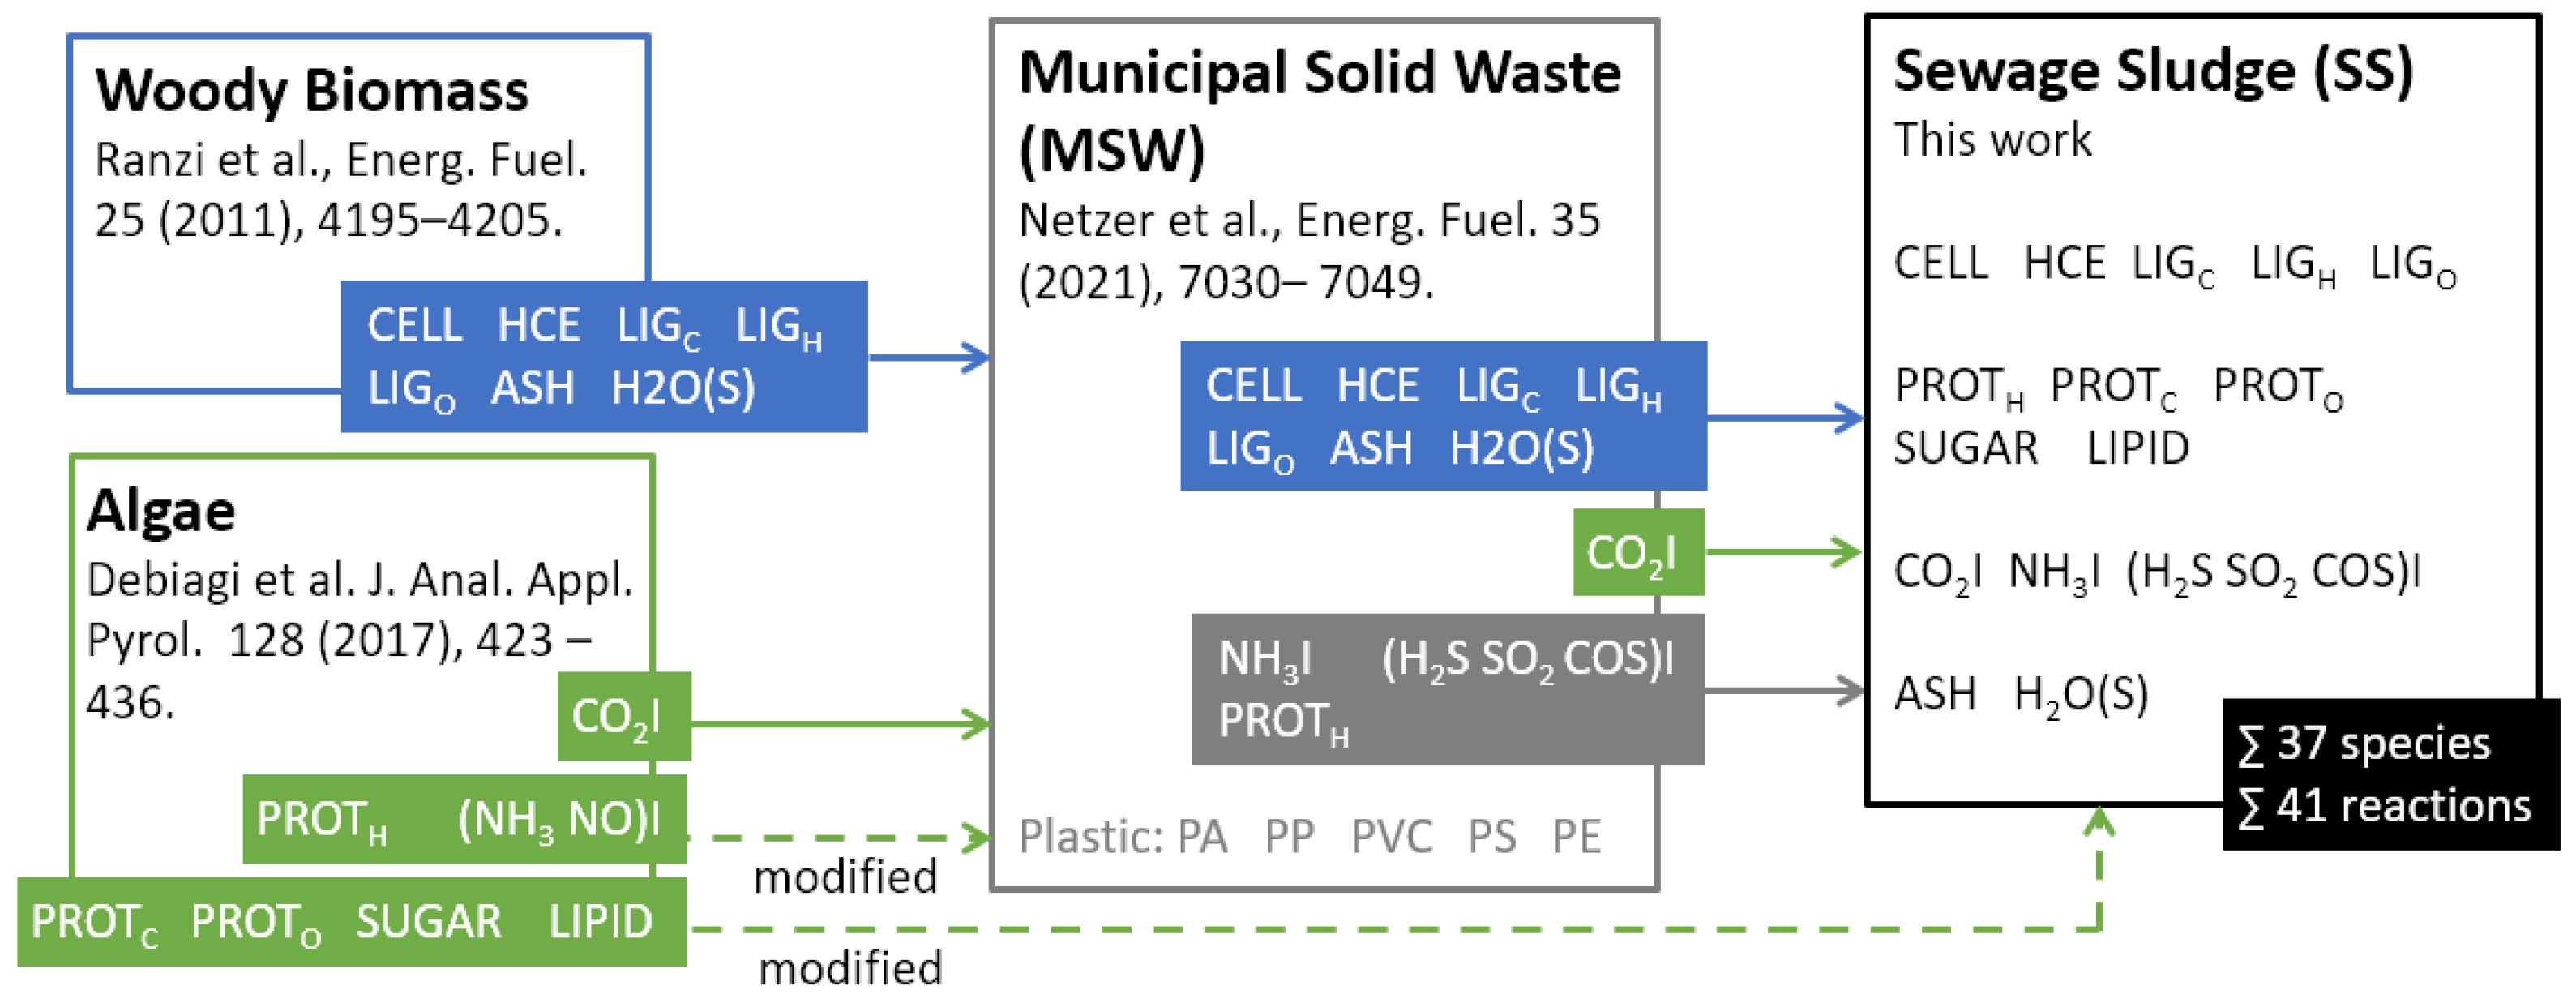
Proteins make up a significant amount of the volatile matter (20 wt% to 40 wt%), followed by lignin with 23 wt% to 30 wt%, and other lignocellulosic compounds and their decomposition product such as sugars [3,4]. For example, Adar et al. [3] have analyzed three sewage sludge samples regarding their organic component composition and reported their average values with 30.09 wt% lignin, 27.40 wt% crude proteins, 11.11 wt% cellulose (9.60 wt% crude cellulose), 4.12 wt% hemicellulose, and 2.45 wt% sugar. Other investigations show that a low oxygen content indicates a high content of oil and grease [52]. In the present numerical scheme, the lignocellulosic compounds are described using the biomass devolatilization mechanism and its respective surrogate species by Ranzi et al. [32]. It includes cellulose (CELL), hemicellulose (HCE), and three types of lignin (LIG, LIG, and LIG). The three proteins (PROT, PROT and PROT), introduced by Debiagi et al. [37] represent the group of proteins. A species representing sugars (SUGAR), and a species representing oils and grease (LIPID), is adopted from the same reaction scheme for the thermal decomposition of algae biomass.
The inorganic components present in the solid matter of sewage sludge are also modeled, describing their product gases of reactions of the inorganic components and the gas phase. The model includes the release of ammonia (NH), carbon dioxide (CO) and sulfur species, wich are hydrogen sulfide (HS), sulfur dioxide (SO) and carbonyl sulfide (COS). The reactions are inherited from Debiagi et al. [37] and Netzer et al. [31]. The ash content of 18 wt% to 55 wt% is assumed to be inert and represented by ash (ASH), consisting of only silicon Si. The moisture content is modeled by the surrogate species HO(S) that describes the drying process via an Arrhenius type equation [32]. All surrogate species and their molecular composition are listed in Table 1 and the model development and origin of the surrogate species is summarized in Figure 2.
2.2.2. Reaction Scheme of the Surrogate Species
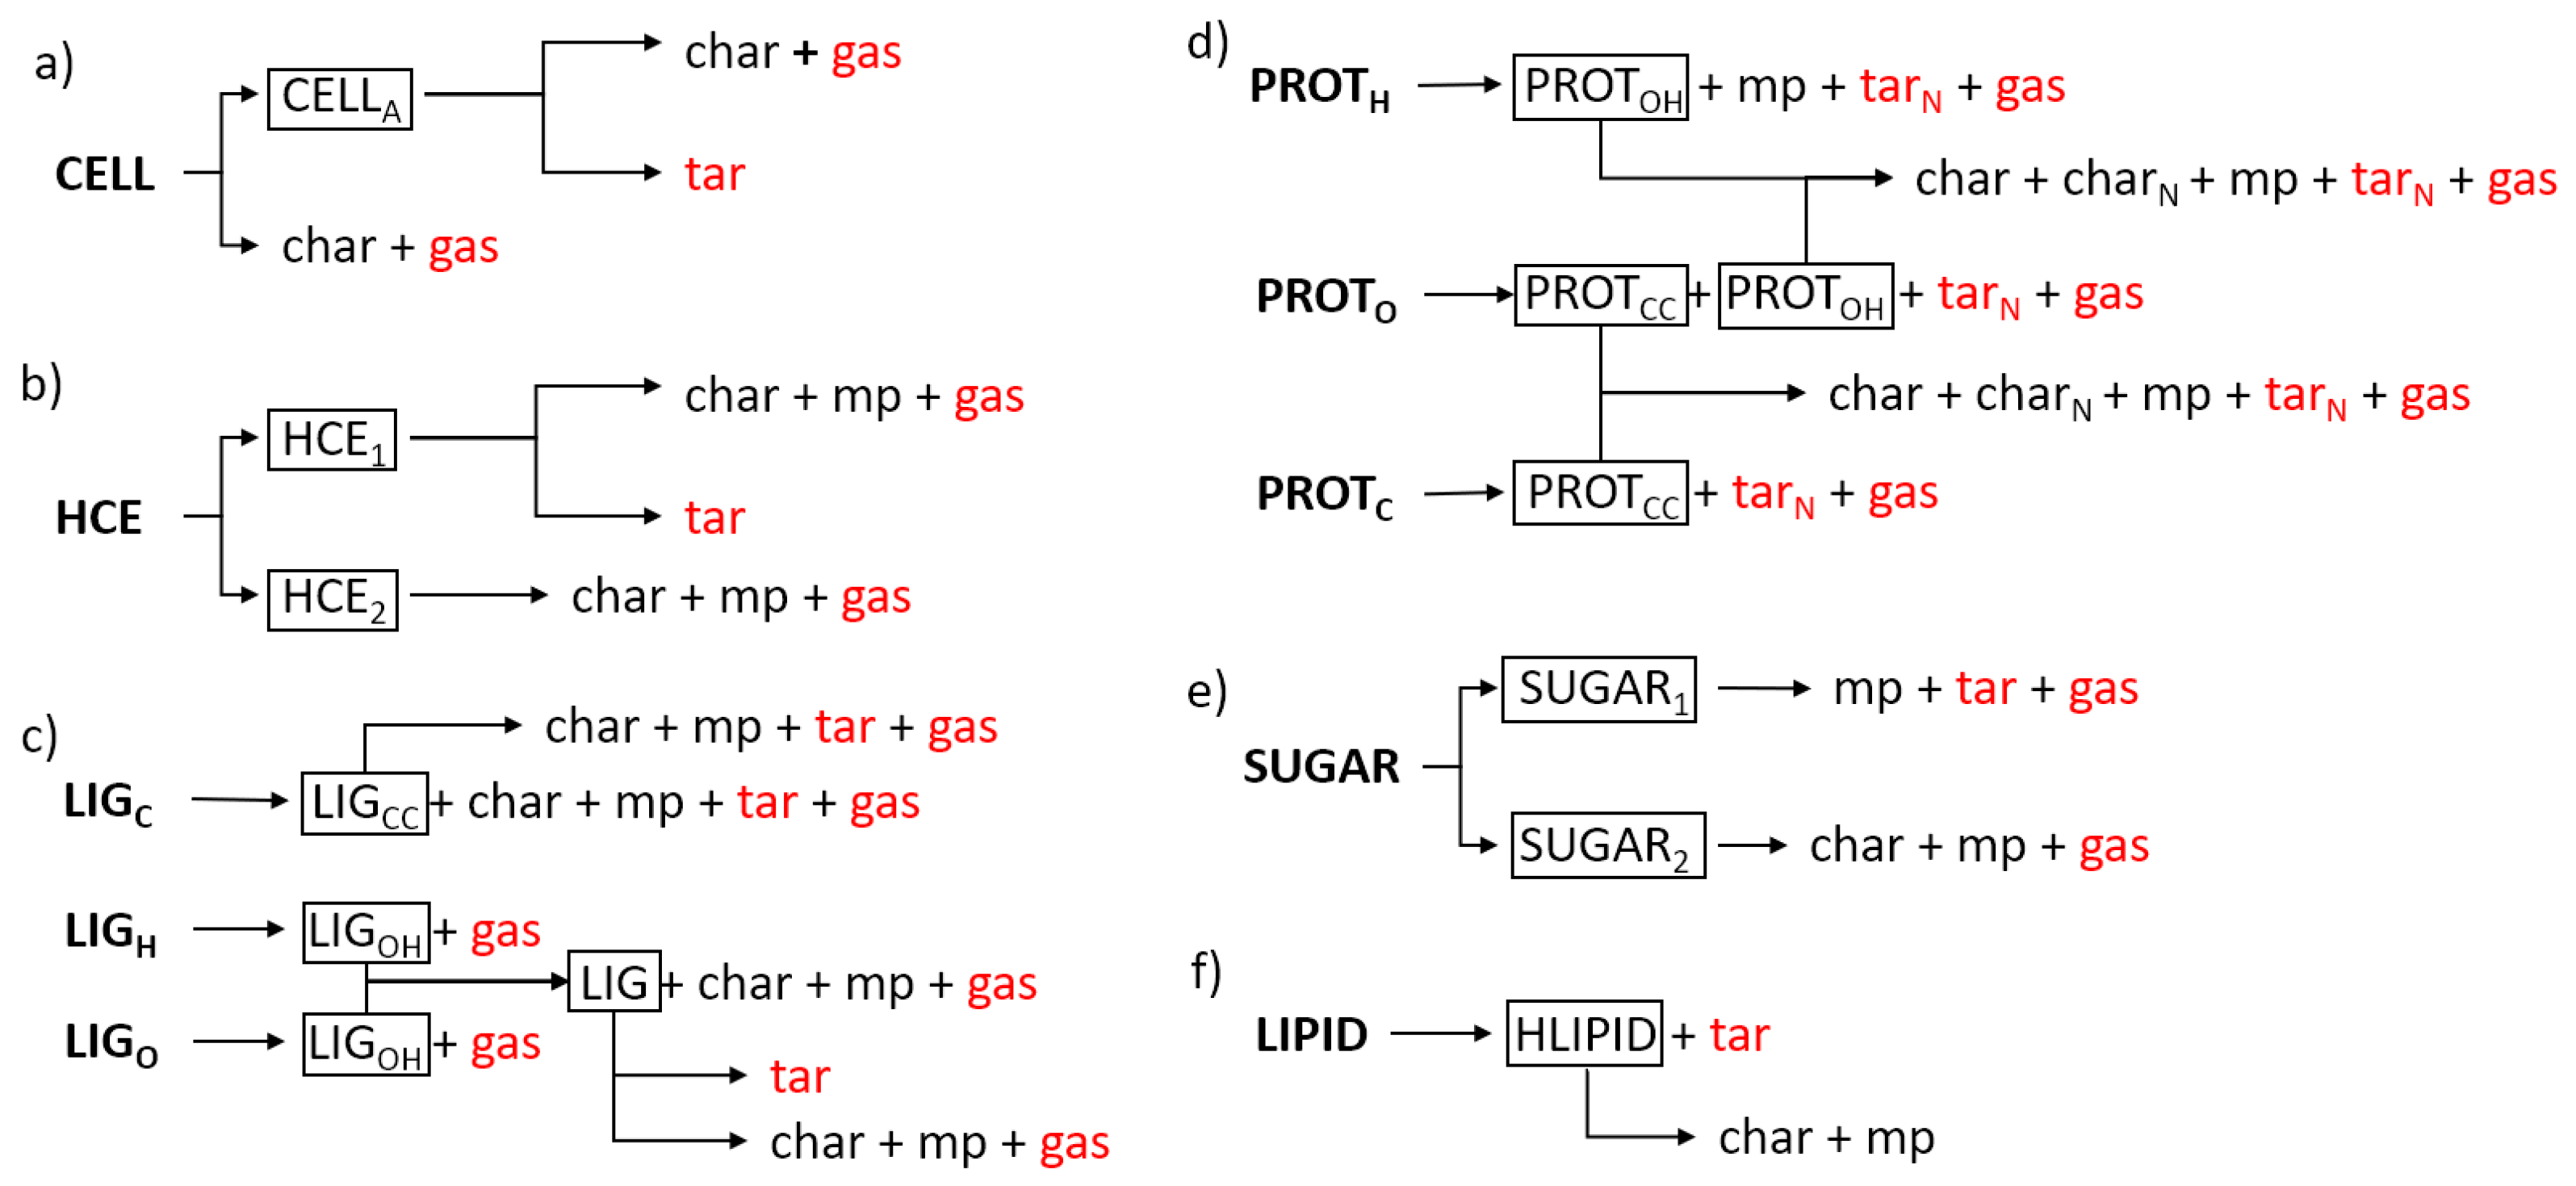
The devolatilization schemes for the volatile species are adopted from [32,37] and are illustrated in Figure 3. The typical pattern involves a first decomposition step forming a reduced or activated solid species. In this first decomposition step, depending on the surrogate species, char, metaplastic species (mp, gaseous species that are trapped in the solid phase) and products released to the gas phase (tar and gas) are formed. In successive steps, the intermediate solid species are further decomposed. Heterogeneous reactions of the char with the surrounding gas phase and Ahrrenius type formulations for the release of the metaplastic species complete the description. The inorganic species are freed in a one-step reaction, except for sulfur, modeled by a two-step release. In the following, only reactions that are modified from their original scheme to connect devolatilization and gas-phase chemistry are discussed. All modified reactions to connect the devolatilization model [37] and the gas-phase scheme [31] are listed in Table 2. The complete set of equations is provided in the Supplementary Materials.
Introduced modifications are based on further specification by Debiagi et al. [37], the discussions and modifications by Netzer et al. [31] and group distribution methods, and are discussed in the following. The nitrogen-containing tar (tar), released by the protein species, is assumed to consist of pyrrole (CHN), pyridine (CHN) and malondialdehyde (CHO) [31]. These species have been introduced to represent the cyclic molecule structure and the ketone group in the original proposed equimolar mixture of pyrrole, pyridine, and diketopiperazine [37]. The introduced species are modeled using available gas-phase mechanisms [32,53,54]. In the present mechanism, tar is given by [31]:
Oxygen-containing tar species (tar) in the formulation by Debiagi et al. [37] are written out based on the description in their original mechanism. The anhydrous monomer of polysaccharides (CHO) is replaced by xylosan included in the hemicellulose chemistry. Xylosan is the dehydrated product of the xylose sugar monomer and is considered representative here since the main purpose in this step is to keep the elemental balance and comparable speciation.
As specified in Debiagi et al. [37], tar is described by an equimolar mixture of glyoxal, acetol and furfural, and tar by a mixture of methanol, ethanol and acetic acid. These are all included in the gas phase chemistry and hence the species can be formulated as:
No representative of free-fatty acids (FFA) is present in the selected gas-phase chemistry. FFA is decomposed using the group contribution method, using the species present in the gas phase mechanism not to further extend the size of the gas phase mechanism and hence the computational cost. Following group contribution theories, FFA is decomposed representing the long hydrocarbon tail by CH, CH, CH and acetic acid (CHCOOH) to represent the carboxyl group (COOH):
2.2.3. Formulation of the Sewage Sludge Surrogates
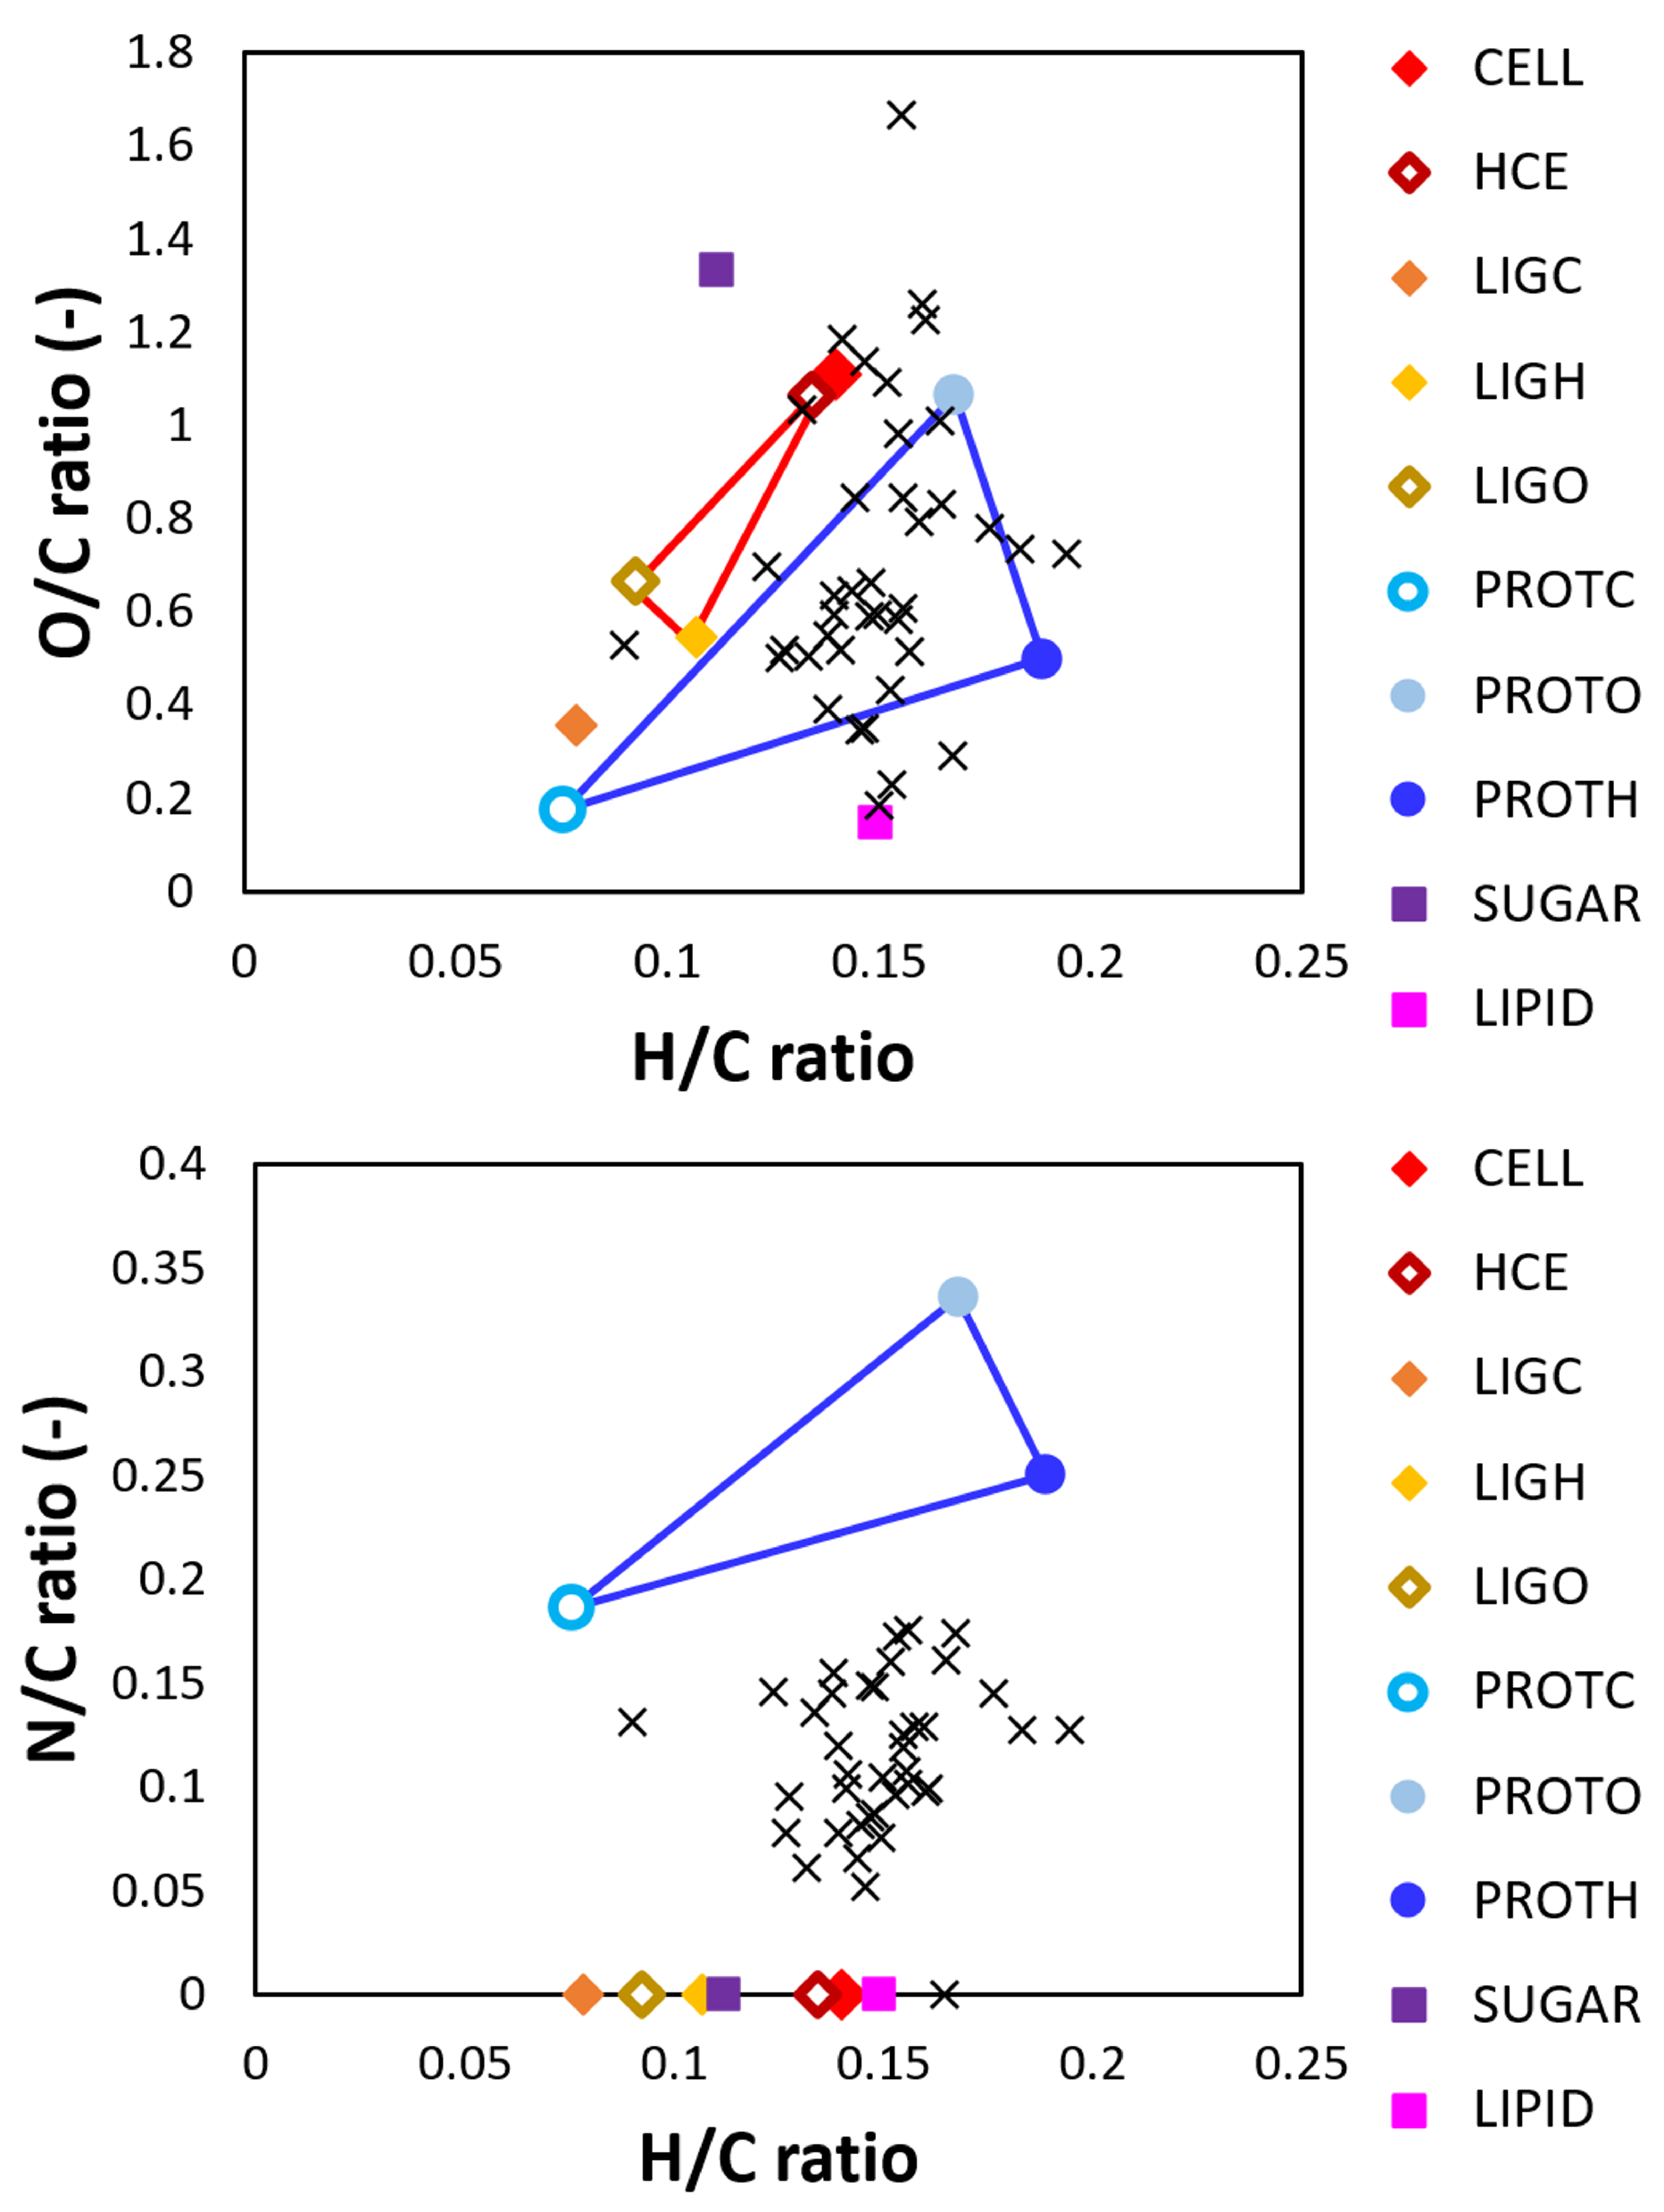
Figure 4 shows the elemental ratios of the chosen surrogate species and sewage sludge samples [10,43,44,45,46,47,48,49,50,51]. Depicted are the H/C ratios, O/C ratios, and N/C ratios. The triangles show the linear combinations of the lignocellulosic compounds and the proteins, respectively. One can see that the great majority of the sewage sludge samples lie within the area enclosed by the surrogate species in the O/C and H/C range. Hence, a linear combination of the surrogate species can represent the sewage sludge on an elemental basis. The species and extend the covered range and are needed to represent outliers. Protein contains nitrogen while non of the lignocellulosic component include nitrogen. Using only protein species would overestimate the N/C ratio in sewage sludge, while using only lignocellulosic species underestimates it. However, linear combinations of both groups allow representation of the solid bonded nitrogen in the right amount.
The surrogate representation aims to replicate the ultimate composition of the analyzed sewage sludge, including its ash and moisture content. This is beneficial since the elemental composition is linked to the heating value of the fuel, and the amount of nitrogen and sulfur in the solid matter is linked to the emission of nitrogen o oxides (NO) and sulfur oxides (SO). A linear least-squares fit is employed to replicate the elemental composition [31]. The main targets for the least-squares fit are the dry mass percentages of carbon (C), hydrogen (H), nitrogen (N), and sulfur (S). Requirements for the species mass fractions (Y), and , and fixed ratios for the lignocellulosic compounds [36,55] are additional constraints. Here, for sewage sludge, the ratios , and are applied. After the dry ash-free surrogate is created, the ash and moisture content of the sludge are linearly added.
3. Results and Discussion
3.1. Representation of Sewage Sludge
The comparison of sewage sludge samples and their surrogate representation is given in Table 3. Listed are sewage sludge samples that are further discussed in the validation part. ID 1 to 16 denotes samples reported by Gómez-Rico et al. [43] that have been analyzed using thermogravimetric analysis. Sample A is converted in a bench-scale rotary kiln by Freda et al. [10] and sample B is analyzed regarding the NO, and SO formation by Shao et al. [44]. All surrogates represent the sewage sludge in close agreement. The maximum relative error is found for the sulfur content of sample 9 with 11.71% and hydrogen in sample B with 22.6%. Both values are outliers and are given their absolute deviation of 0.18 wt% and 1.5 wt%, respectively, which is considered acceptable here. The absolute errors of carbon and hydrogen representation are significantly lower, and hence the energy content of the sewage sludge is captured well.
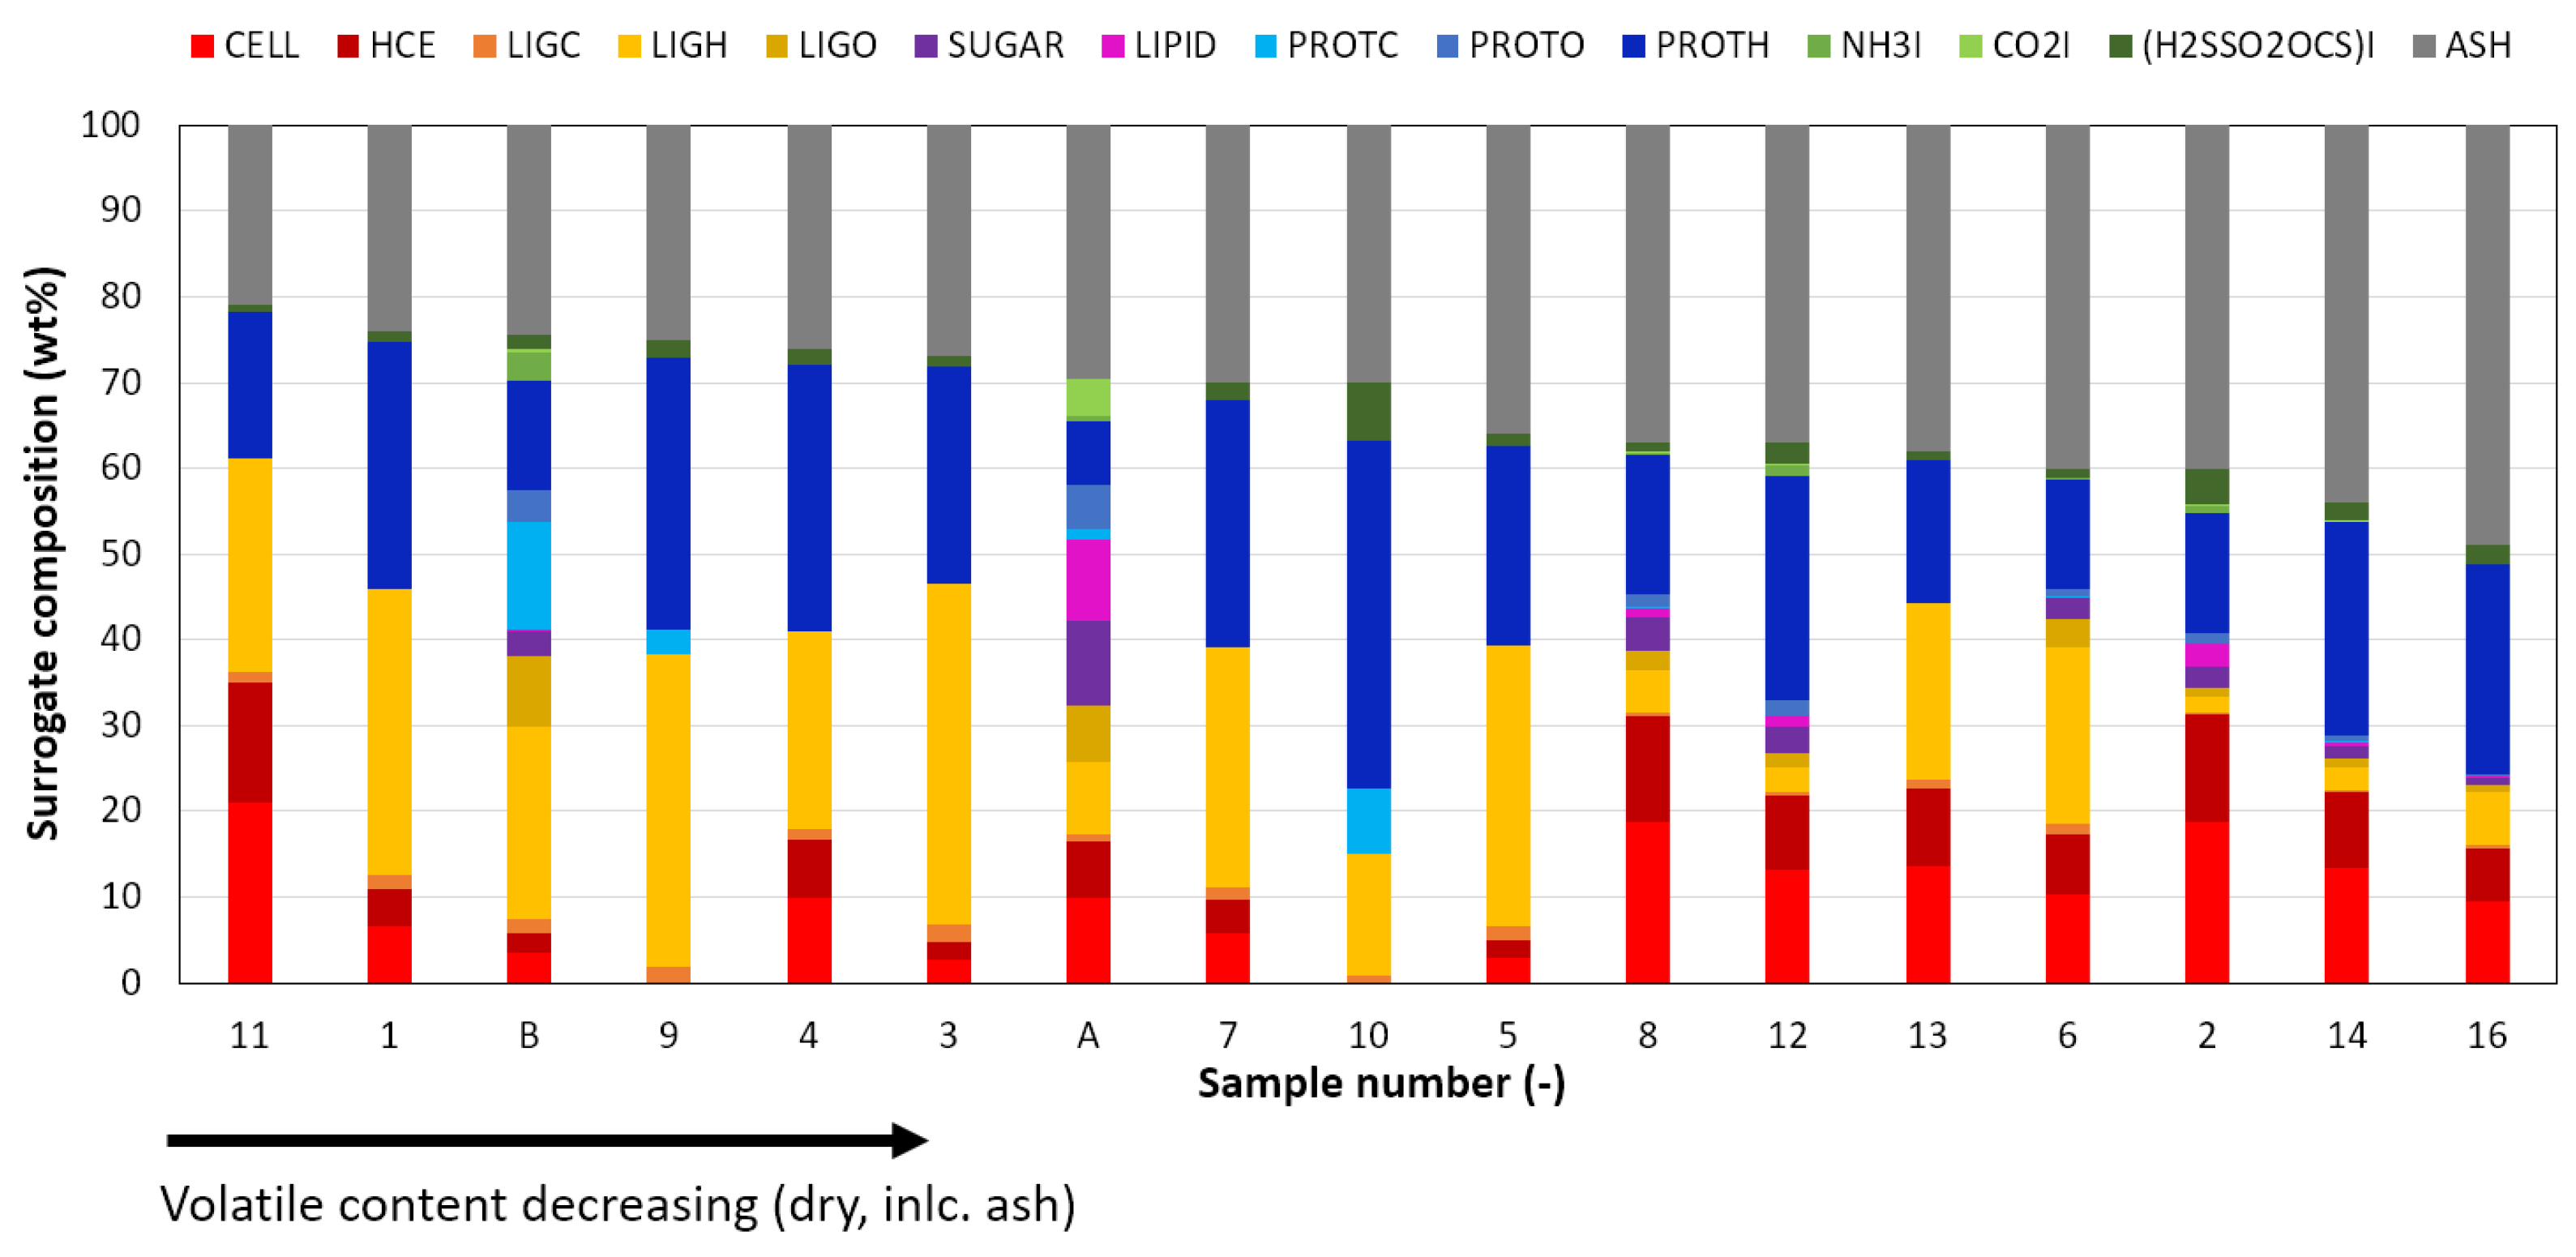
The individual composition of the dry surrogates, including ash, is shown in Figure 5 for sample ID 1 to 16. As in detailed speciation of sewage sludge, proteins and linings are the major groups of organic matter. Covering a range from 13 wt% to 48 wt%, proteins are included in similar ranges as reported in literature (18 wt% to 40 wt% [3]). Lignin species vary largely between 3 wt% and 42 wt%. The average with most appearances of around 25 wt% lies well in between the previously mentioned 23 wt% to 29 wt%. Sugars and lipids are needed to fulfill the ultimate composition requirements. With a small amount up to 9 wt%, this appears plausible considering the measurement by Adar et al. [3]. Species representing inorganic materials contribute to the smallest weight fraction but are essential to balance nitrogen and sulfur.
3.2. Thermogravimetric Analysis
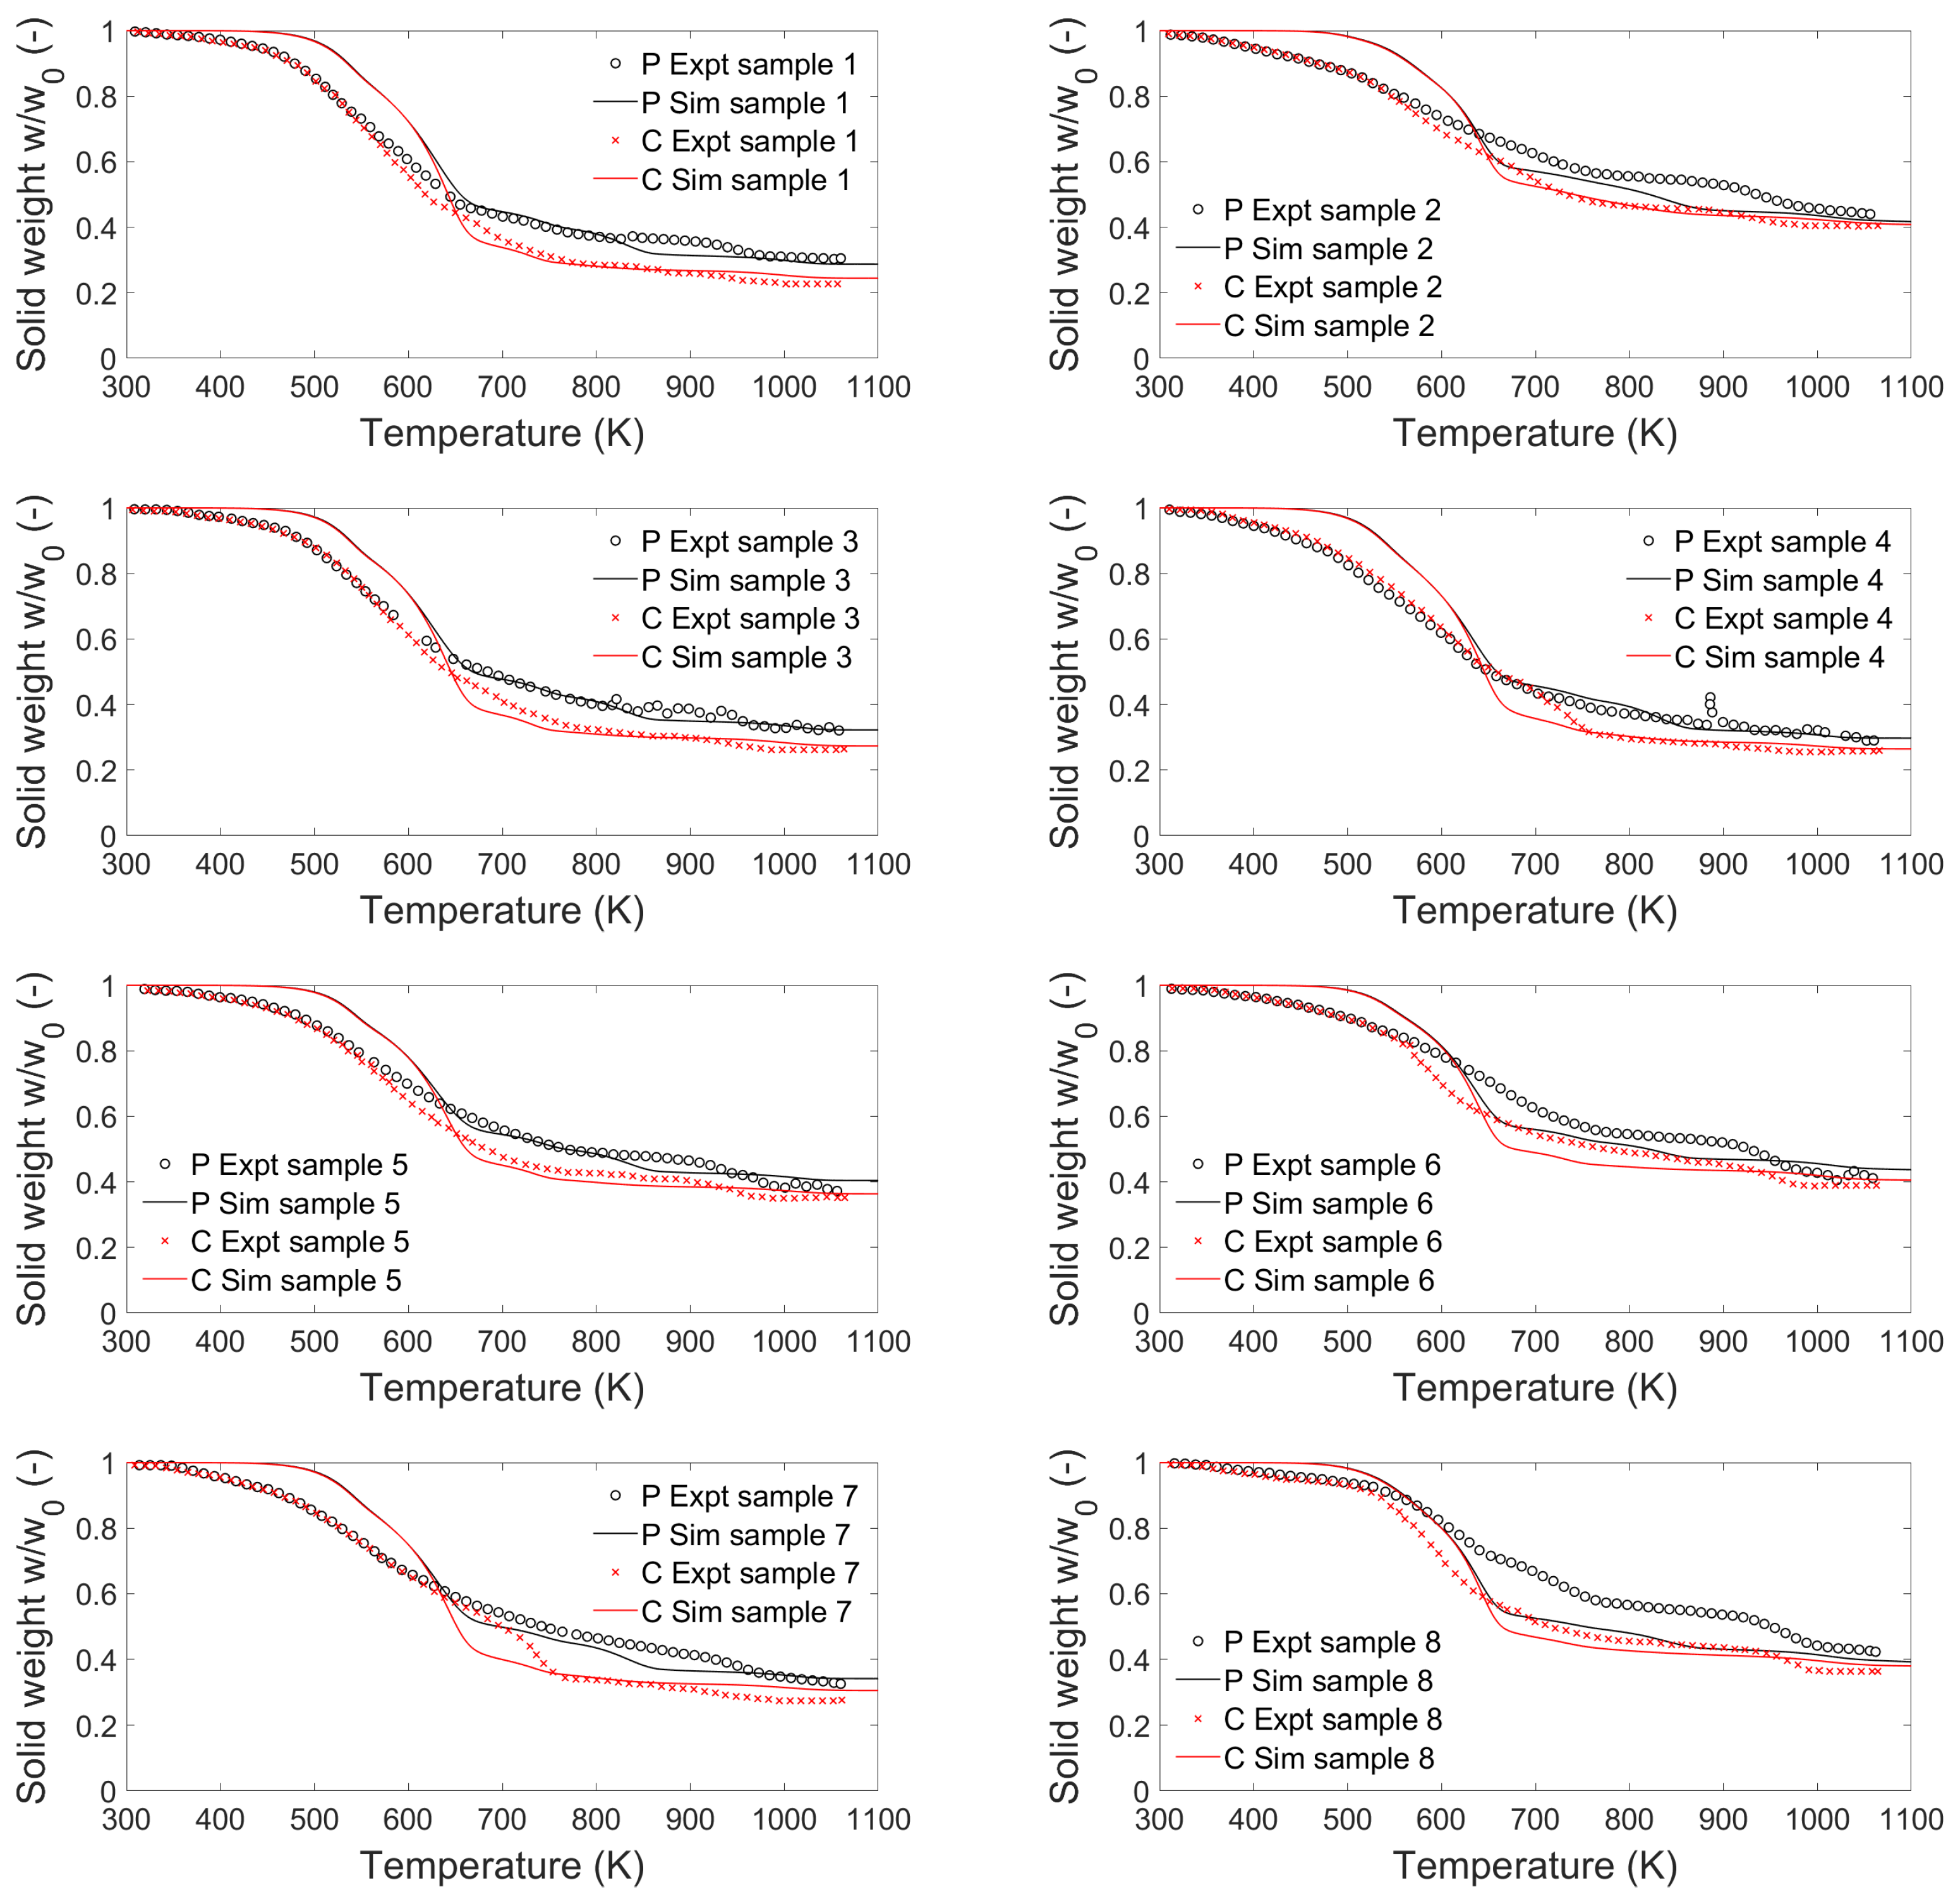
Gómez-Rico et al. [43] studied the pyrolysis and combustion of various sewage sludge samples (ID 1 to 16 in Table 3). For this, the authors performed thermogravimetric measurements under a helium and a helium/oxygen atmosphere with 80 vol% and 20 vol%, respectively. The analysis was performed using 5 mg sewage sludge samples, a gas flow rate of 0.06 L/min, and a heating rate of 10 K/min. The gasification reactor was used in a plug flow configuration with a low mixing rate of 1 s to represent these measurements [31]. Each surrogate is initialized separately, assigning a particle size of 150 m and the two atmospheres. The results are shown in Figure 6.
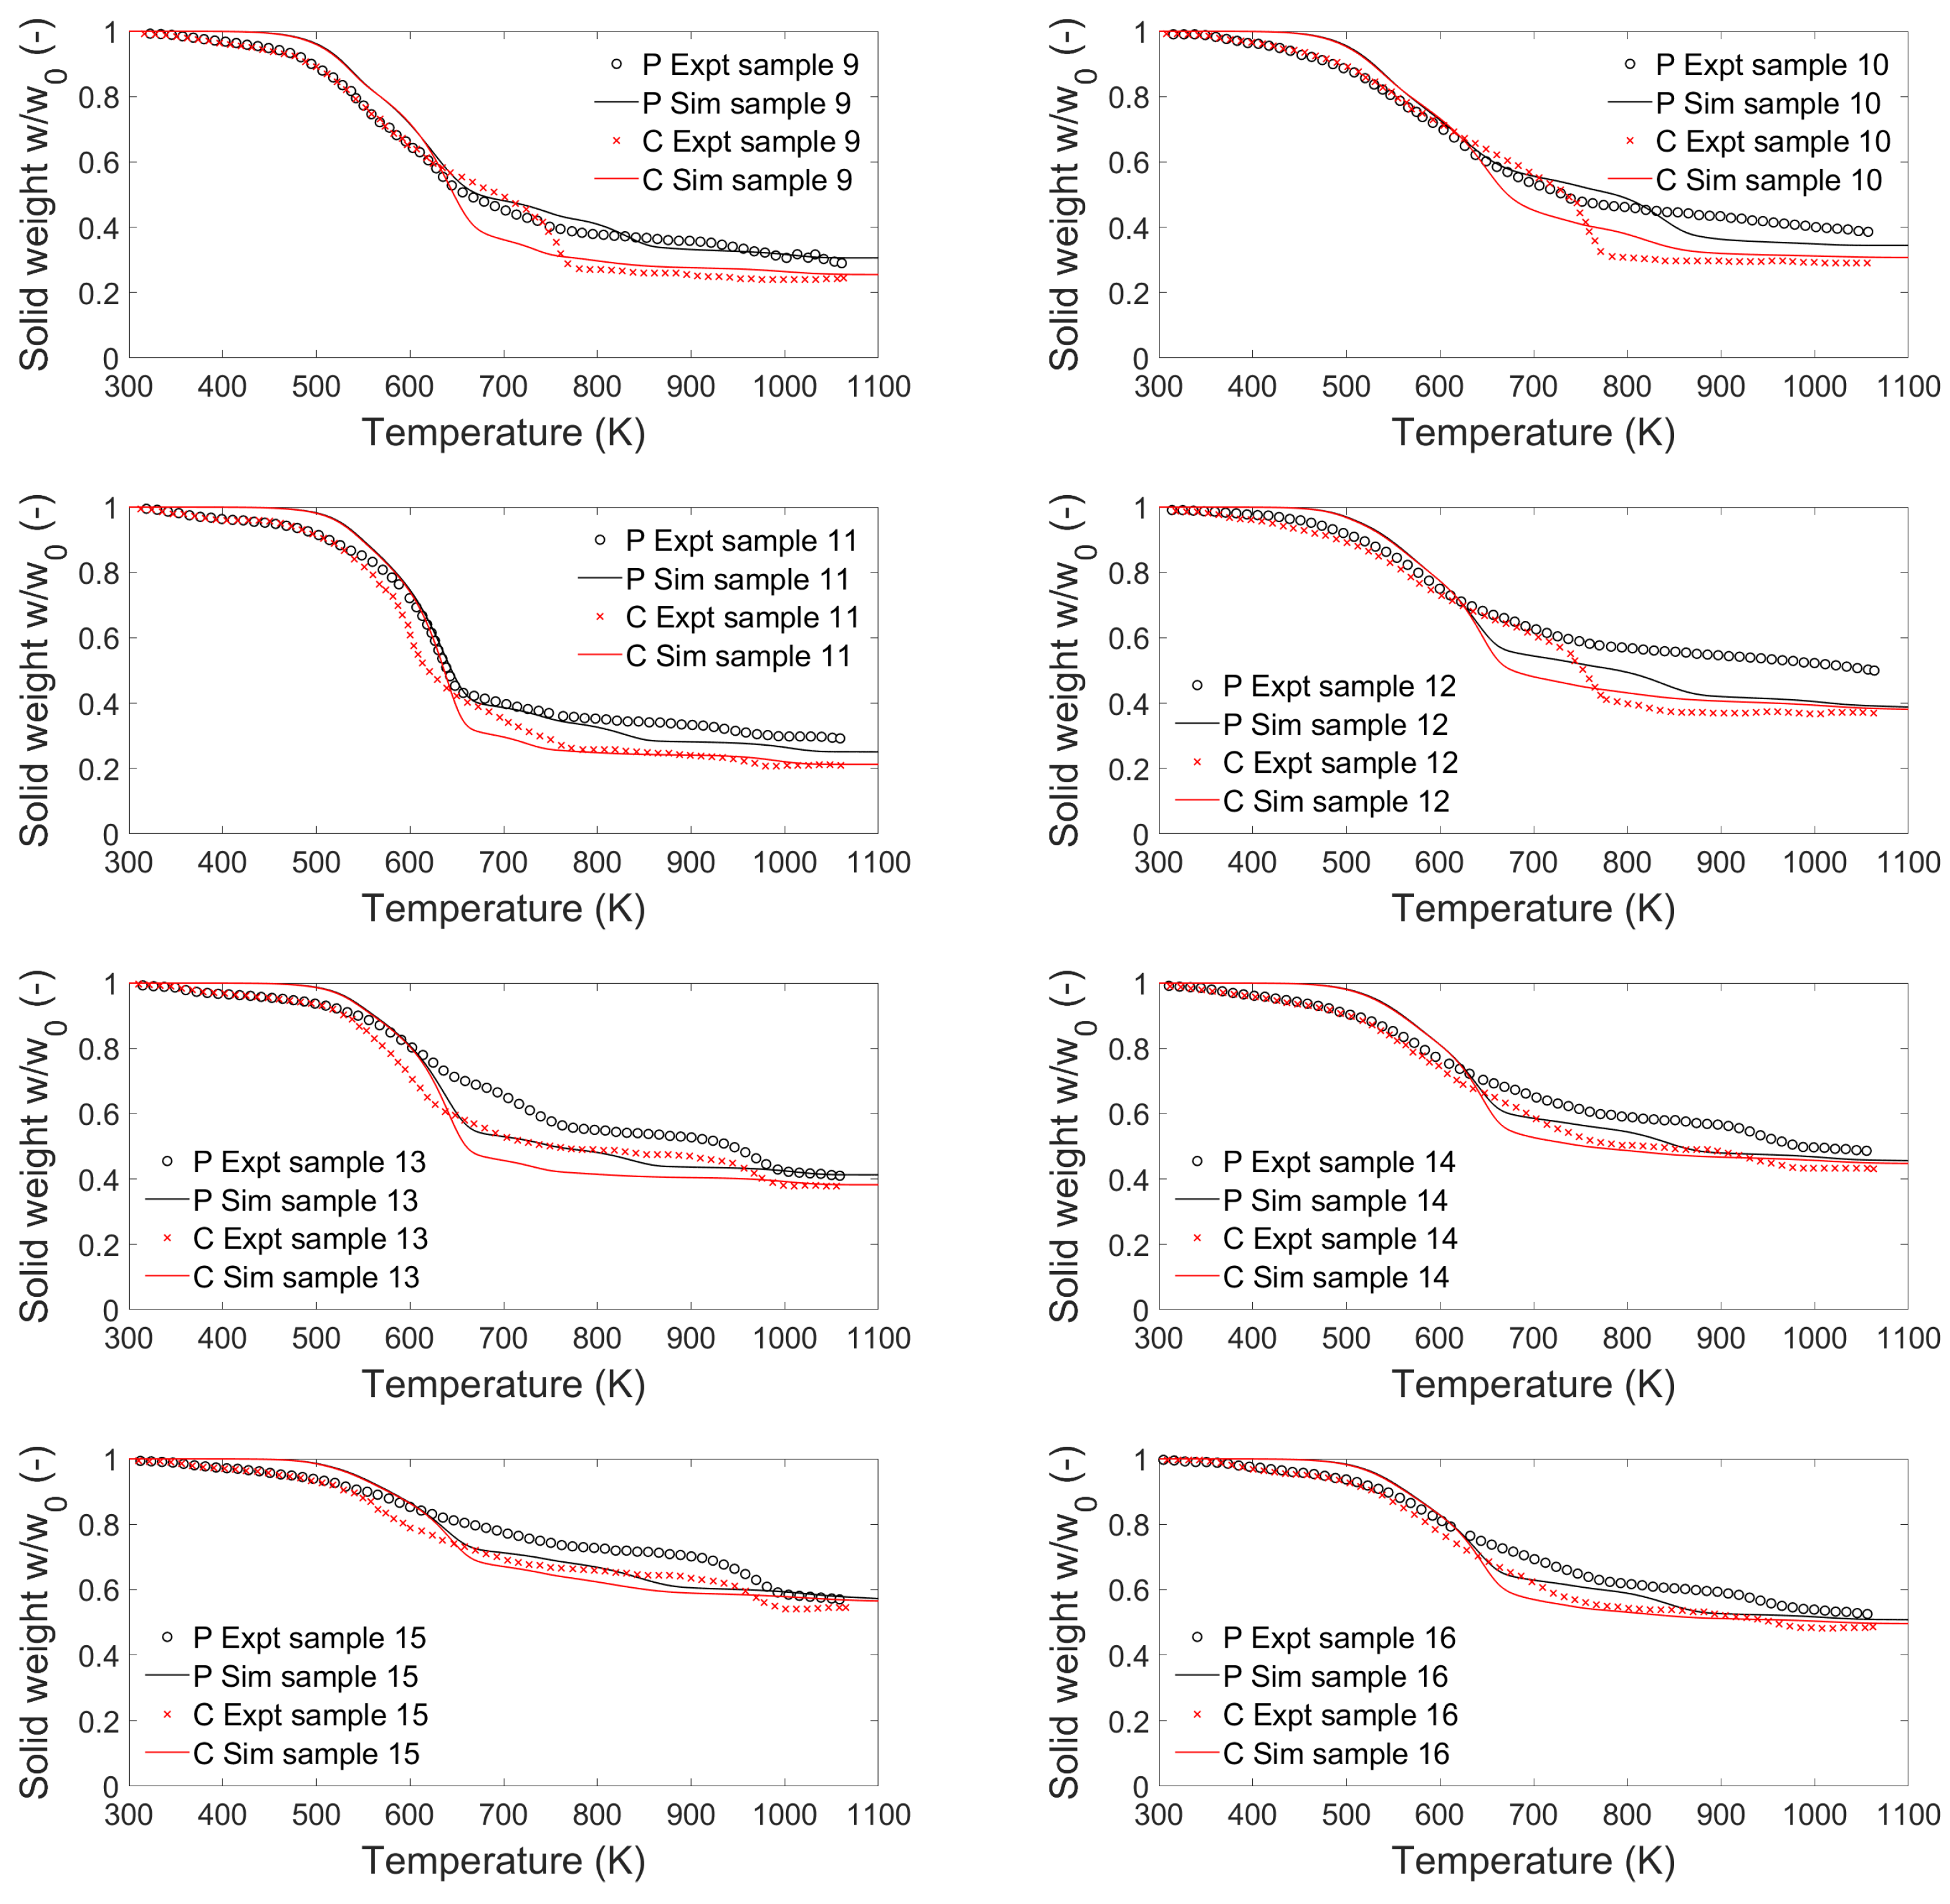
Overall, the model captures the mass-loss rate and the sewage sludge final solid residue. The early devolatilization is delayed for some samples, for example, ID 1, 2 and 4. In the model, this is caused by the lignocellulosic compounds [31]. However, for the majority of the sewage sludge samples, this stage is soundly represented by the model. The characteristic two-stage devolatilization [43] under pyrolysis conditions is represented in the simulation results. The response to different atmospheres (pyrolysis and combustion) is for the majority of the sewage sludge samples reproduced. Examples of a good prediction of both pyrolysis and combustion conditions are samples 1, 3, and 9. For these samples, the relative error of the weight loss prediction at 1050 K is <5% for the pyrolysis conditions and <7% for the combustion atmosphere. The model under-predicts the residue slightly for the sewage sludge samples, with the highest difference in the final solid residue (samples 10, 12, and 13). This under-prediction appears at temperatures >850 K. With an error of 11% and 21% of the weight loss prediction at 1050 K, the most significant deviation is found for samples 10 and 12, respectively, while the initial under-prediction for sample 13 is not apparent in the final weight loss deviation of 1%. The discussed under-prediction is not present for the combustion condition with an error <6%. The devolatilization is close to complete in this temperature range, and the char model dominates the solid conversion. The employed char conversion model consists of only tree reactions, and its revision is targeted in future work. To summarize, with an average deviation of the predicted weight loss at 1050 K of 6.5% and 4.5% for pyrolysis and incineration conditions, the model’s aim to predict the rate of solid mass loss to predict gas and tar release are met for various sewage sludge samples.
3.3. Producer Gas Composition
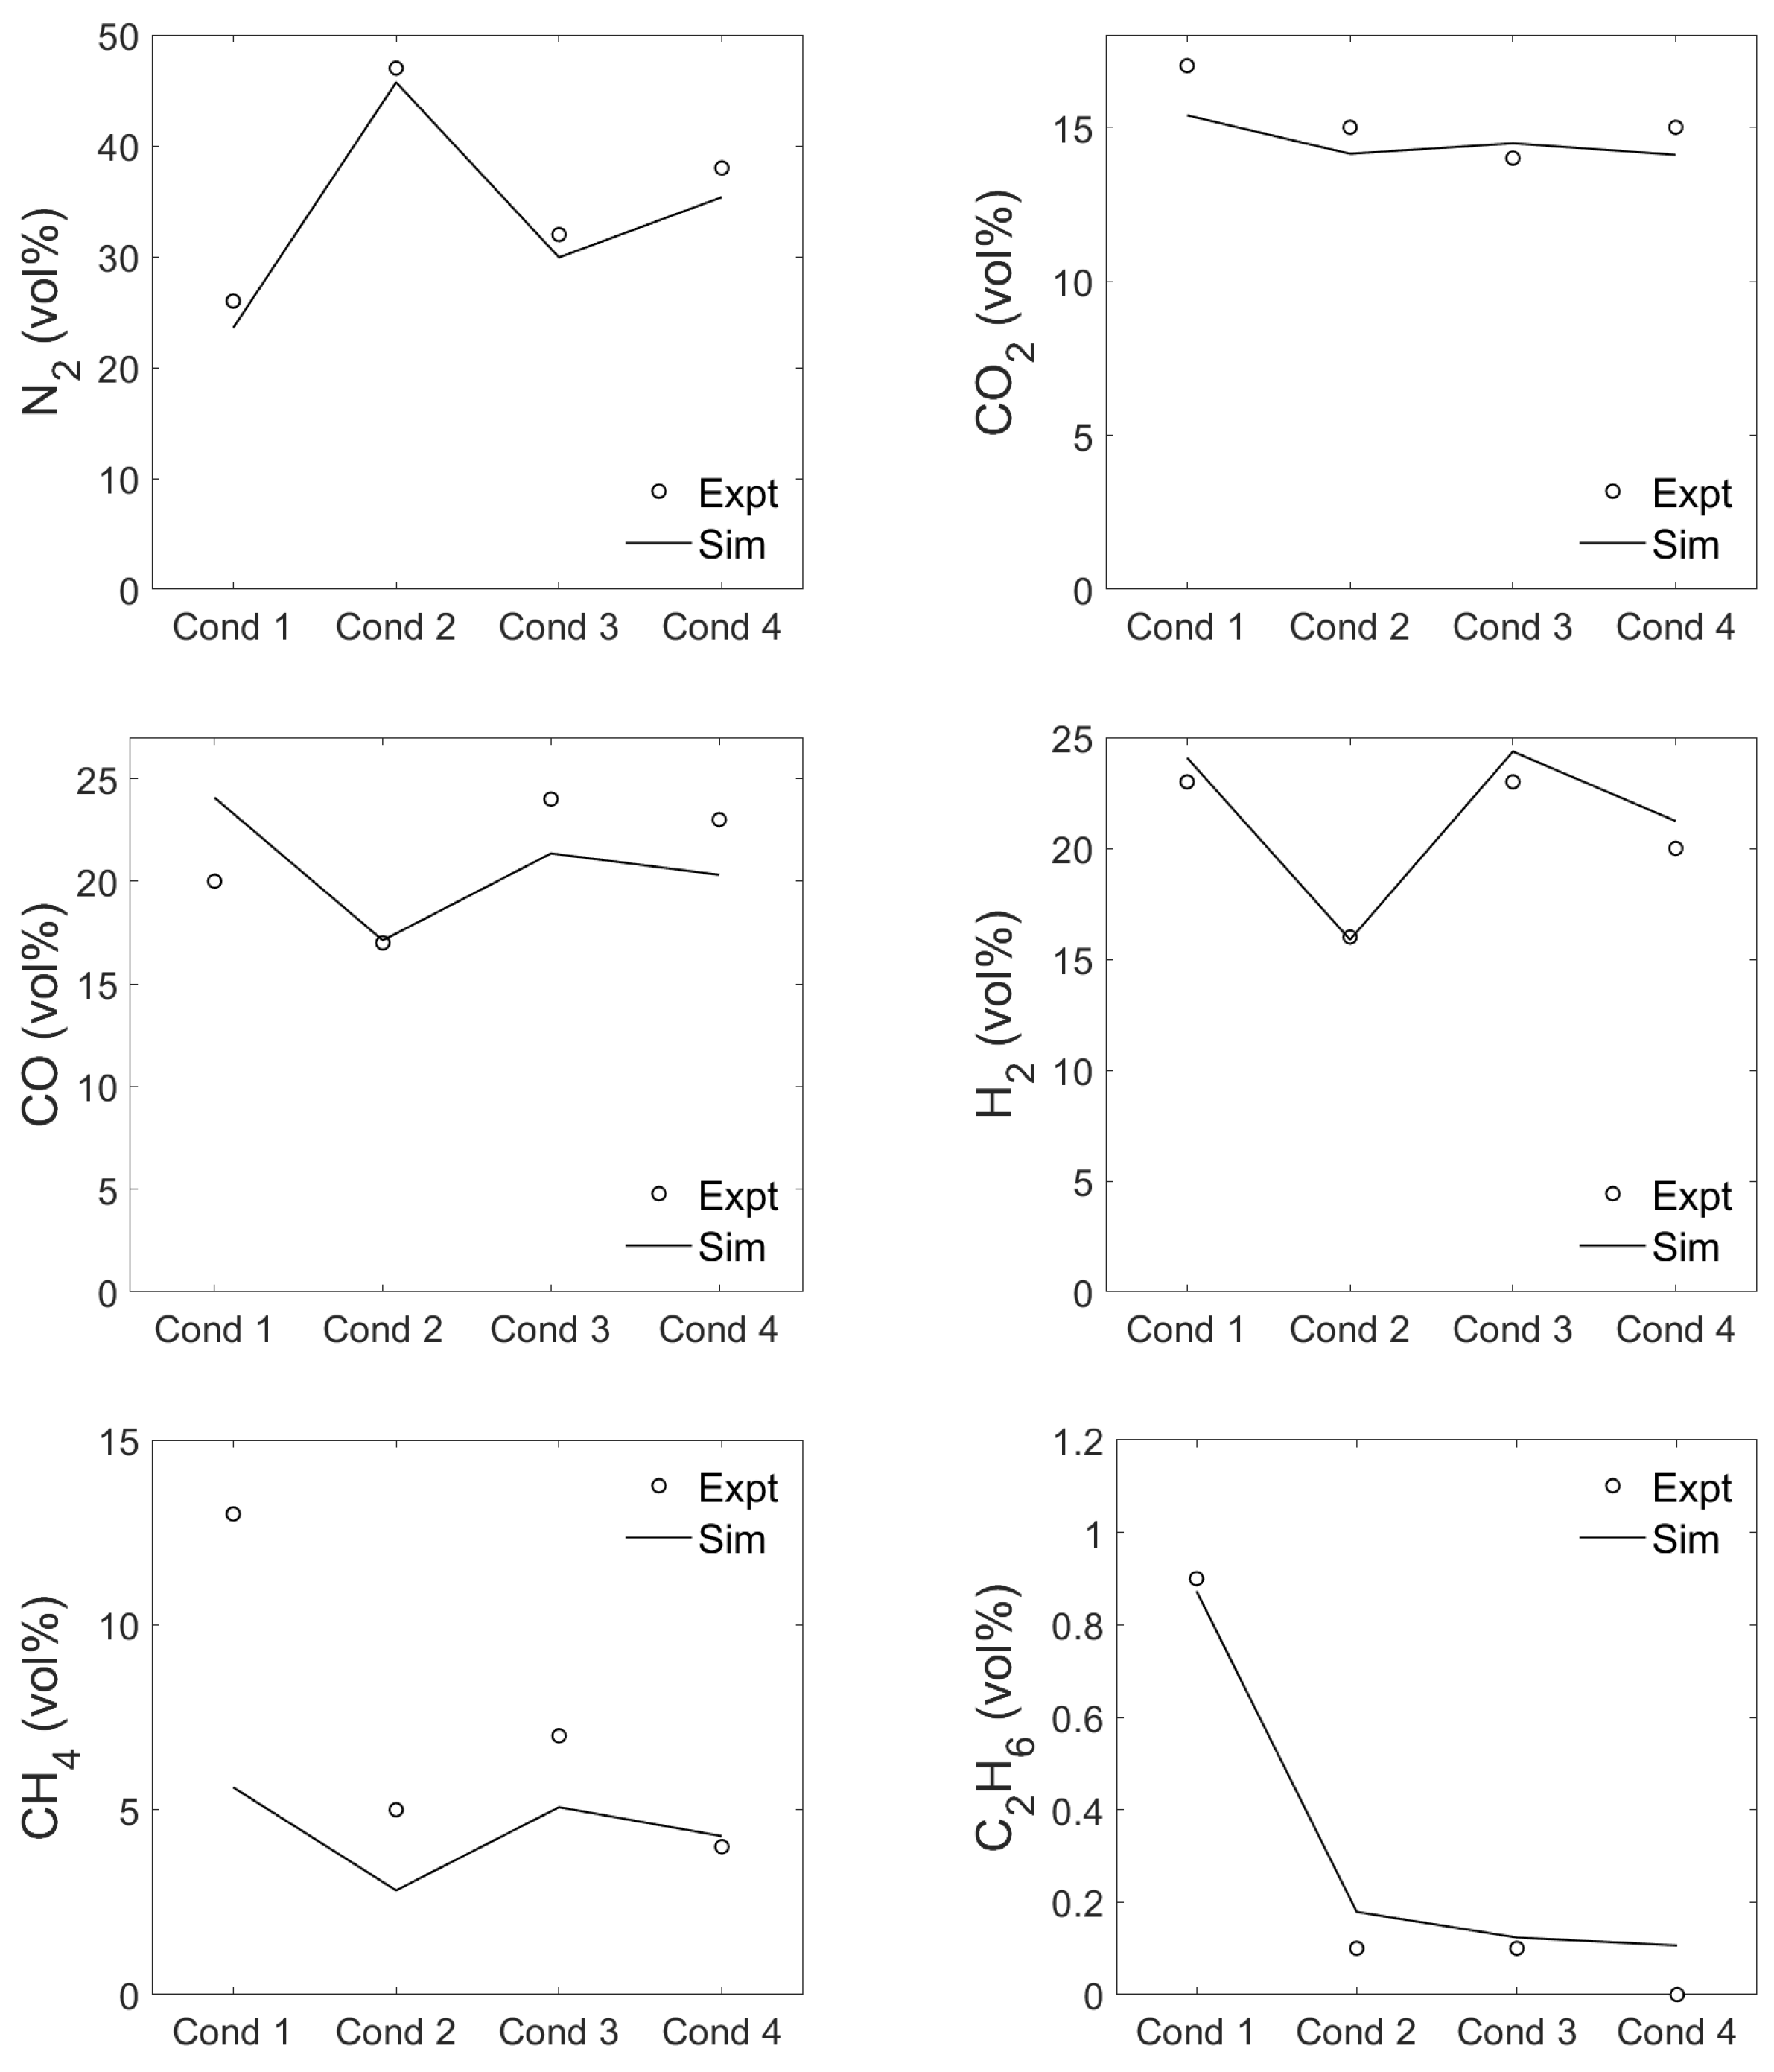
For the validation of the obtained gas composition and share of tar and water, the experimental results reported by Freda et al. [10] are chosen. The authors analyze sewage sludge gasification in a bench-scale rotary kiln. The kiln has a total length of 1550 mm, of which 610 mm are electrically heated, with an inner diameter of 80 mm. Freda et al. [10] studied four operating conditions, given in Table 4, with air as a gasification agent. Condition (Cond) 1 corresponds to pyrolysis conditions that favor a high amount of tar species, and the remaining conditions account for gasification conditions. The distribution of the operating conditions allows validating the model response towards increasing oxidizer ( = [0.05, 0.15, 0.24]) with at the same time increasing gasification temperature (T = [1023 K, 1073 K, 1123 K]). Further, the setup can analyze the impact of temperature at constant air feed rate (Cond 2 vs. Cond 3) and the impact of air feed rate at constant temperature (Cond 3 vs. Cond 4). At 1123 K and = 0.15, Freda et al. [10] achieved a lower heating value of the dry produced gas of 7.9 MJ/Nm and the maximum cold gas efficiency of 67%. Overall, their apparatus yields a rather clean, dry producer gas consisting mainly of CO, H, CH, and CO.
The gasification reactor is run in a plug flow configuration for the simulation of this experimental setup, accounting for constant fuel and air supply at the reactor inlet. The mixing time is set to 0.033 s to represent the kiln rotational speed of 2 rpm. The surrogate A from Table 3 corresponds to the ultimate analysis reported by Freda et al. [10]. The authors further note that the sewage sludge had to be partially dried to prevent the rotary kiln from clogging. In the presented simulation results, a moisture content of 20 wt% is assumed.
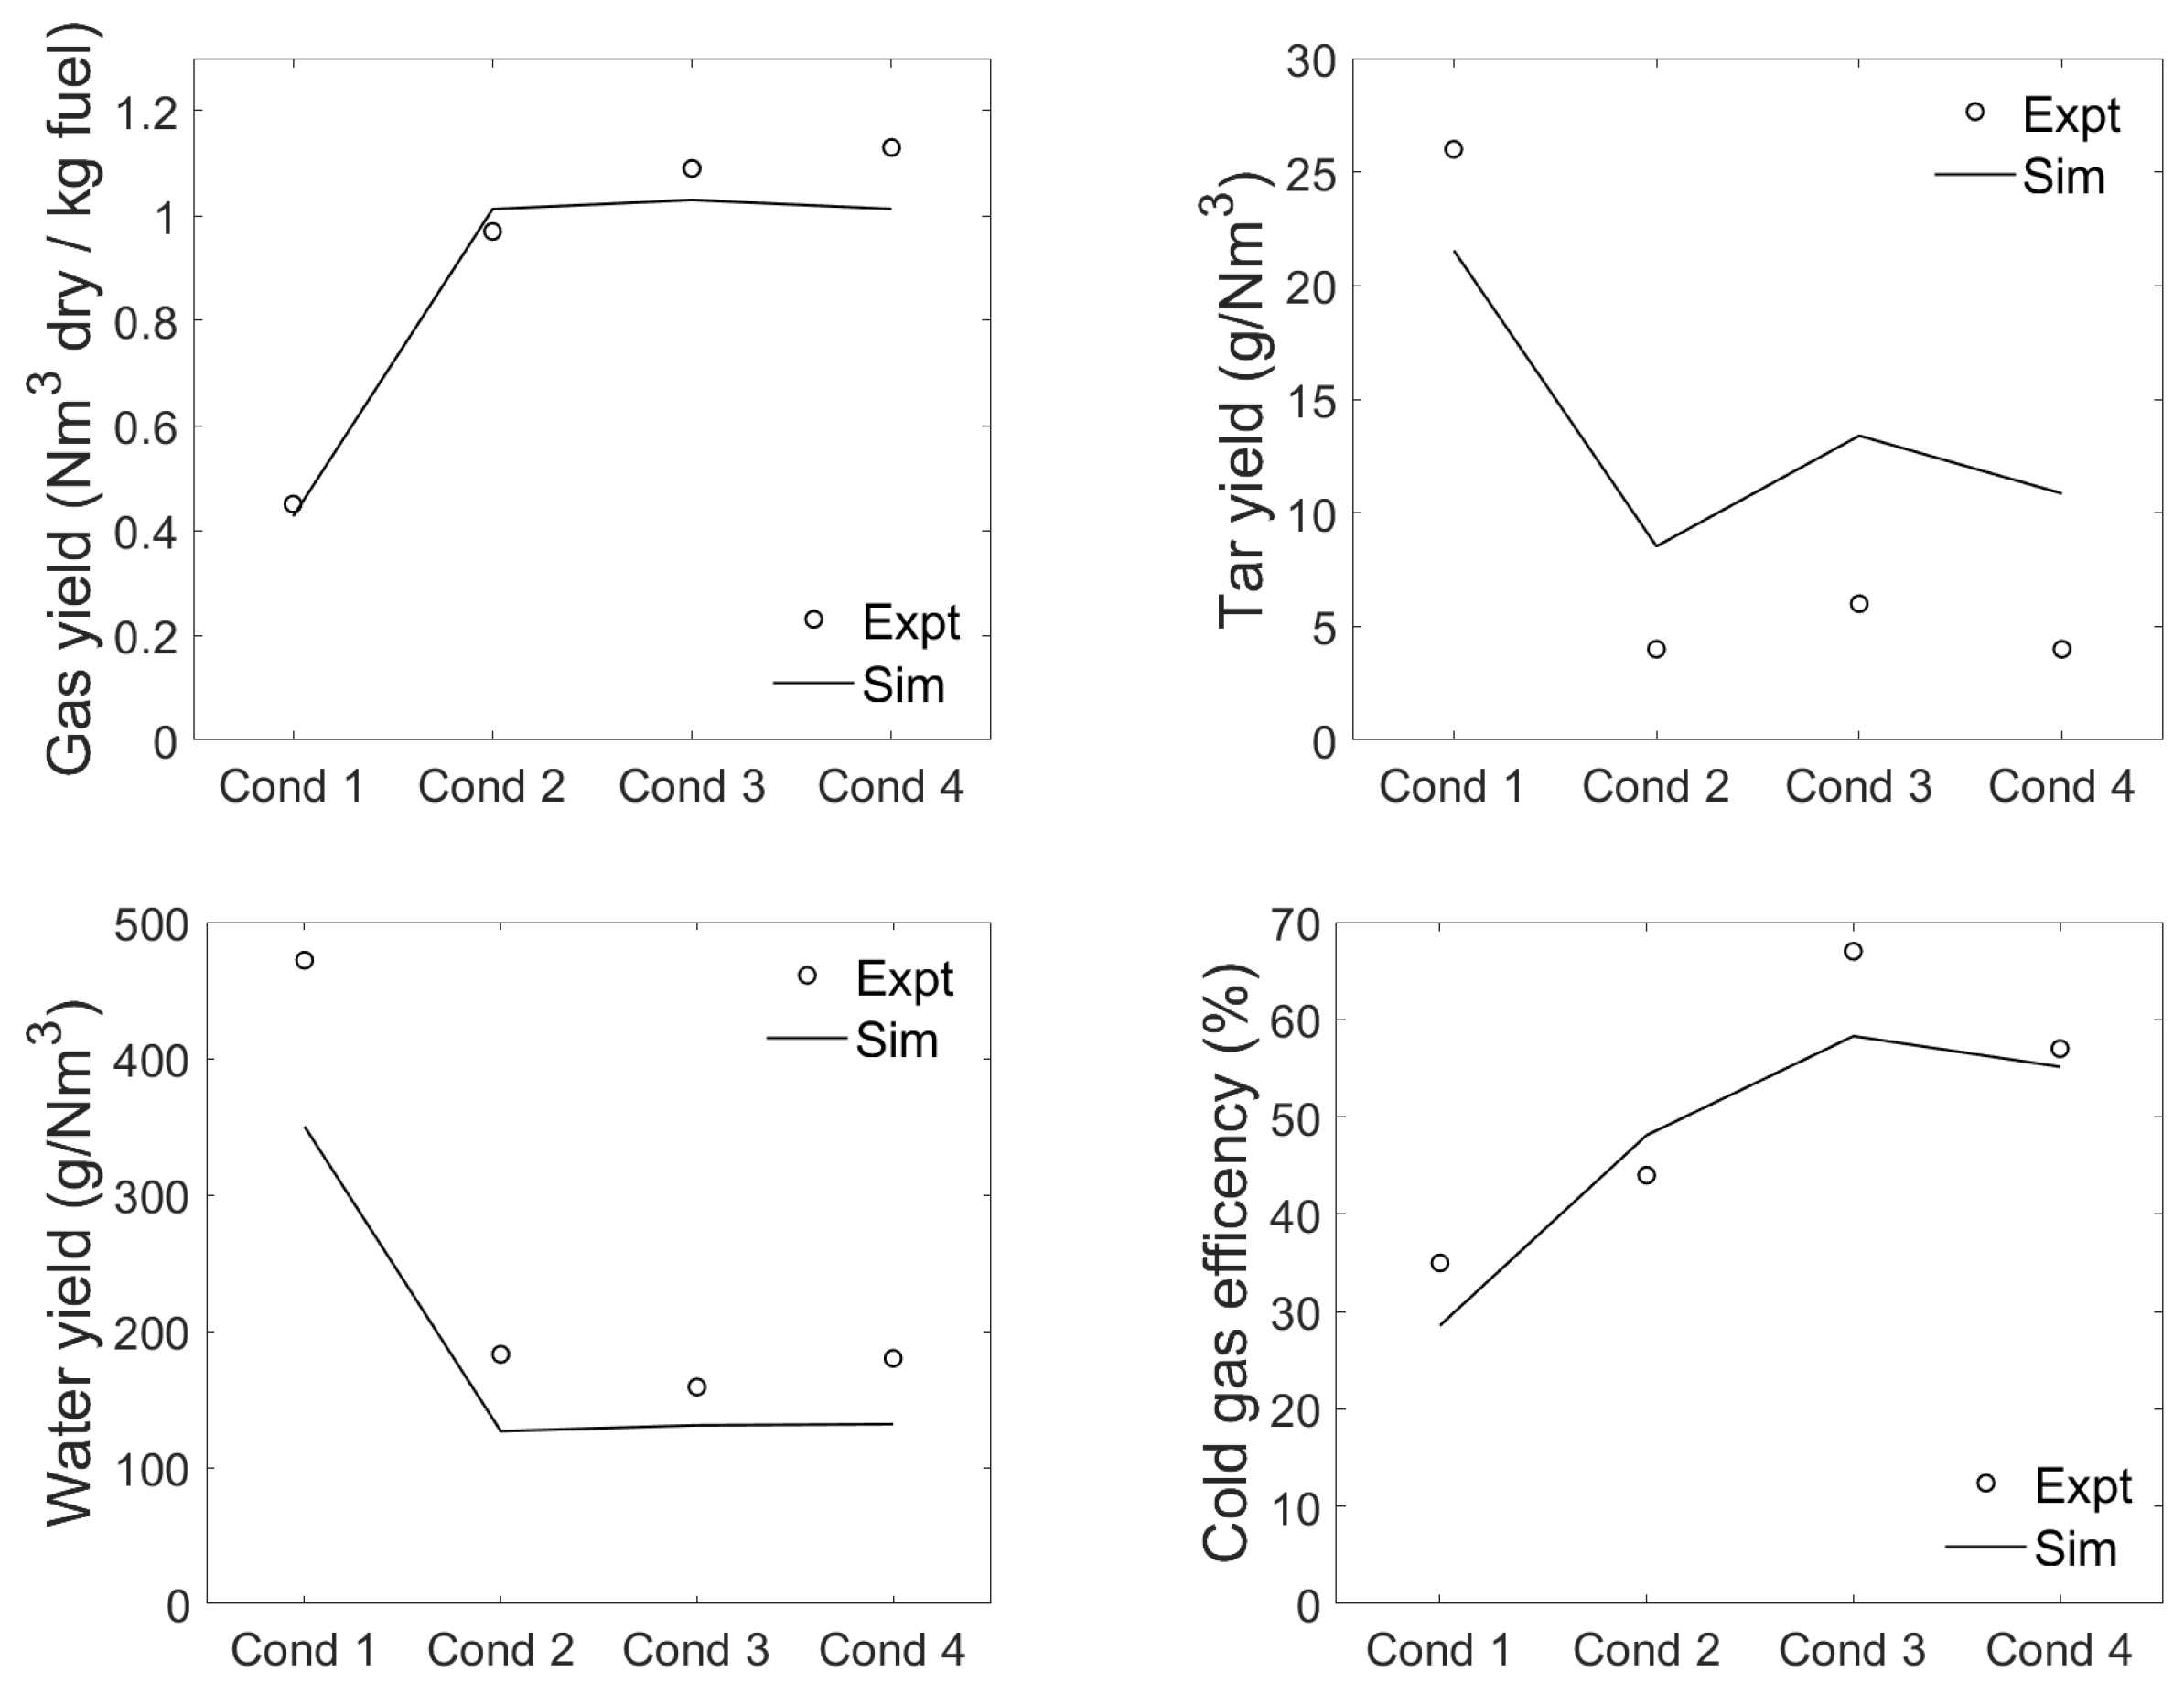
All major product gases are predicted in close agreement with the experiments. The amounts of methane (CH) and the tar yield are however under and over predicted, respectively (Figure 7 and Figure 8). For the tar yield, all species in the gas phase reaction mechanisms with a molar mass equal or larger than benzene (CH, W = 78.11 g/mol) are combined. The resulting under and over prediction shows that the simulation’s tar conversion is slower than in the experiment. The thermal and chemical break down of the tar species, e.g., CHO, CHO and CHNO, would result in an increase of small hydrocarbons and consumption of hydrogen that is slightly over predicted. The model yet replicates the trends over changing gasification temperature and air supply, including CH and tar. Further, besides the major gas species, ethane with only a small concentration is in good agreement with the experiment (Figure 7). The gas composition directly correlates to the lower heating value that is important for the further processing of the gas for energy supply. Given the species’ good prediction, the LHV aligns well with the measurements (not shown). The combination of the product gases LHV, the gas yield and the LHV of the solid fuel, yield the cold gas efficiency (). Also for this measure the model aligns well with the measurement.
The species and tar prediction of the model respond well to increasing airflow rate and temperatures (Cond 1 vs. Cond 2 vs. Cond 4) and the related properties, such as LHV and CGE. The model is further sensitive to individual variations in temperature (Cond 2 vs. Cond 3) and in the airflow (Cond 3 vs. Cond 4). The experimentally observed slight variations of water and the dry gas yield over the gasification conditions (Cond 2, Cond 3, and Cond 4) are not replicated by the model. The reason for this is twofold. First, in the simulations, the fuel feed rate and moisture content are the same, while this is not guaranteed in the experiments [10]. Second, in the presented model, the final char yield is reached around 1000 K (Figure 6) and the sensitivity for the gas-phase species prediction is obtained by the gas-phase model. Based on local oxidizer and elevated temperatures tar and larger gas species are further decomposed to form the main producer gas species. Overall, the amount of gas, tar, and water yield and the product gas composition are well replicated by the surrogate model.
3.4. Emission Release Prediction
Shao et al. [44] performed incineration experiments of a sewage sludge sample from Shanghai. The authors analyzed the NO and sulfur dioxide (SO) formation in a tubular furnace. Dried sewage sludge with a mass of 0.2 g was burned using a synthetic air mixture (80 vol% N/20 vol% O) with a flow rate of 2 L/min. The ultimate analysis and the corresponding surrogate are denoted with B in Table 3. Shao et al. [44] conducted the experiments with a residence time of 600 s. To comply with the experiments, the gasification reactor is run as a partially stirred reactor with a low gas-phase mixing of one mixing event per numerical time step.
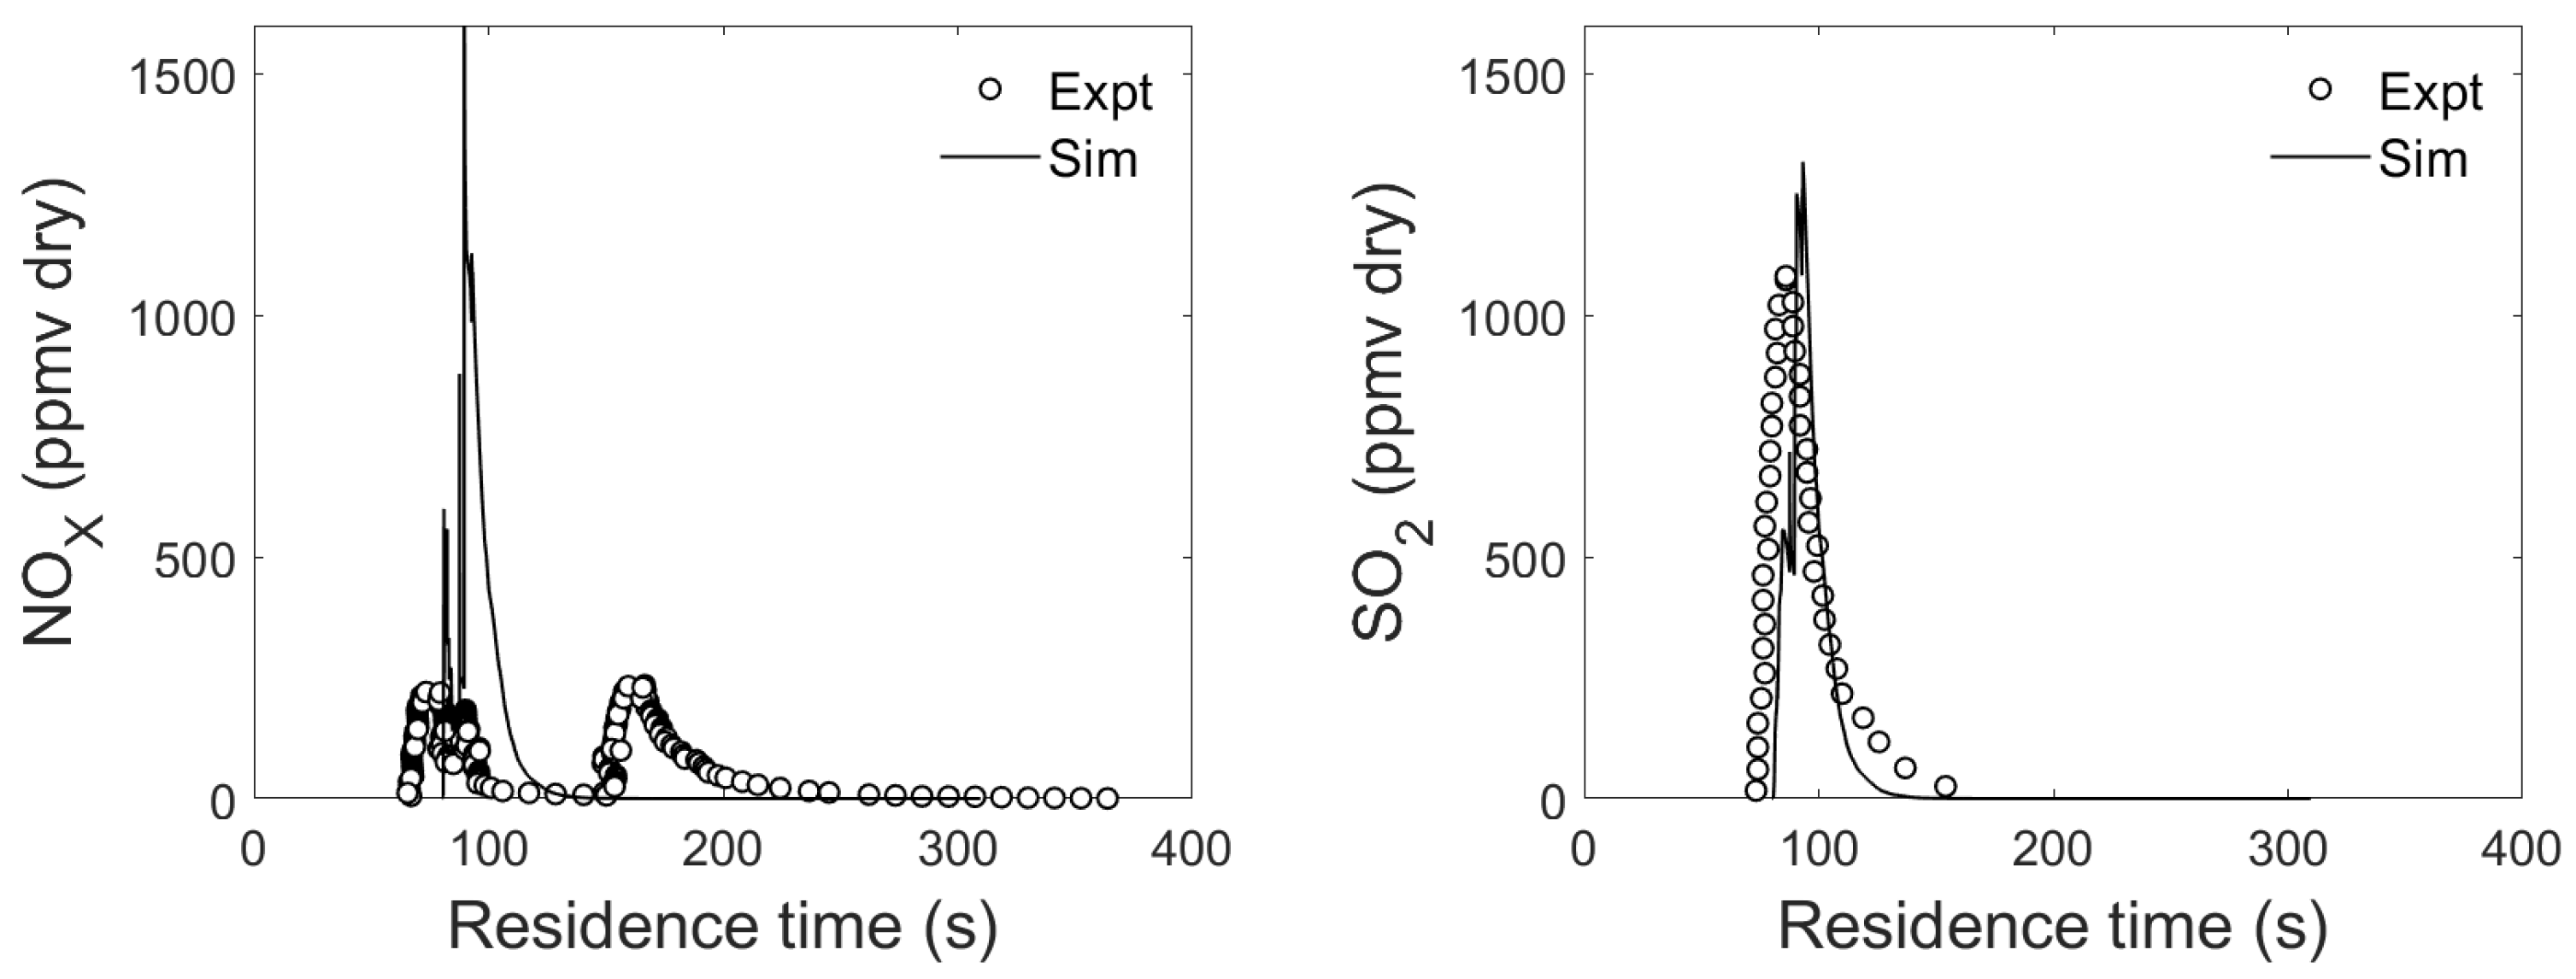
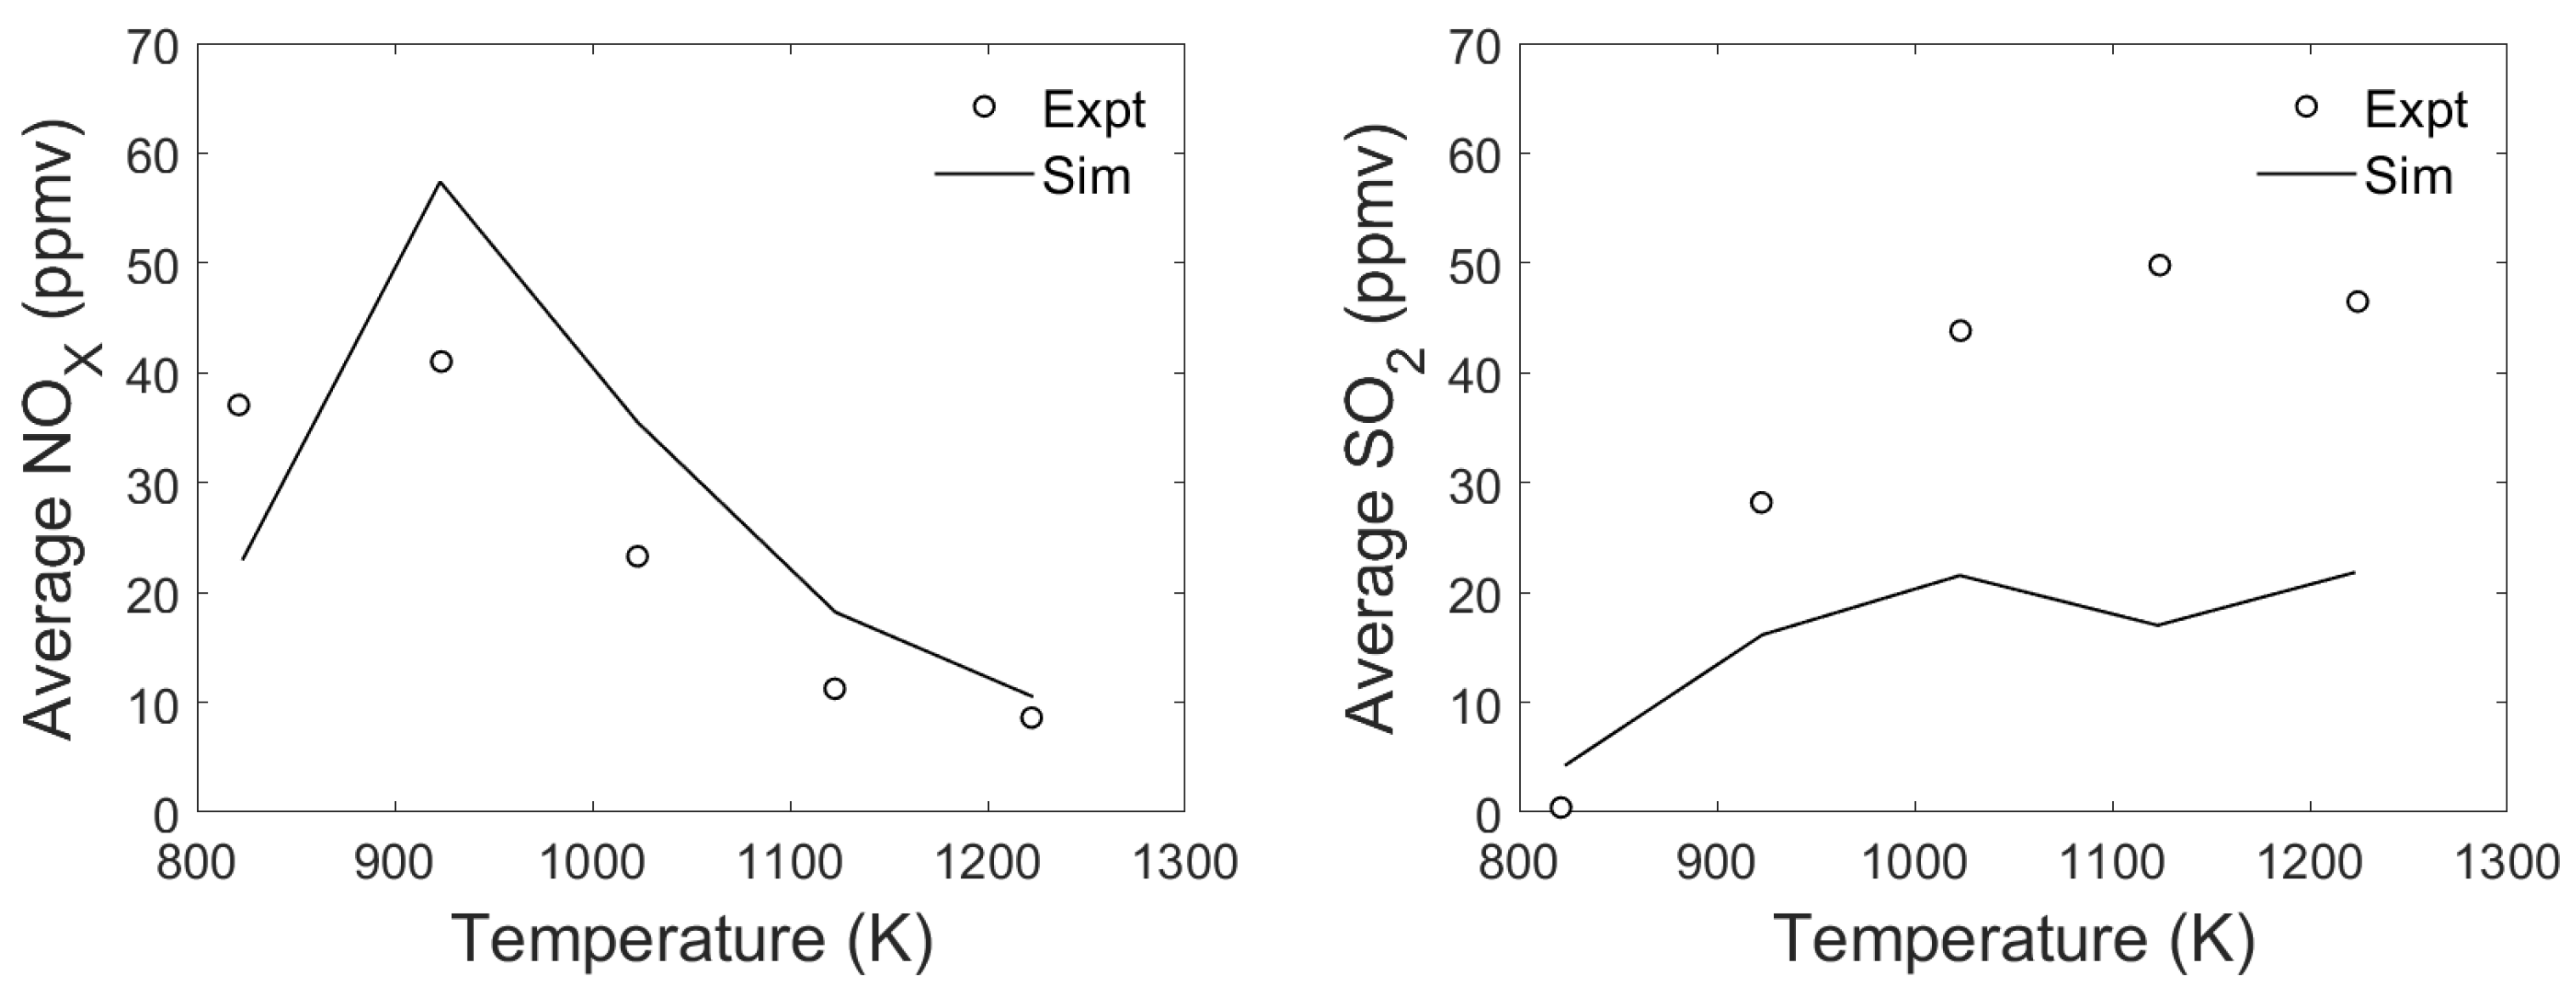
Figure 9 shows the model predictions over the residence time at a constant temperature of 1023 K and Figure 10 the average emission concentrations over the recorded time (600 s) at various temperatures. In the experiment, the recording is started immediately when inserting the sample [44], while the emitted gases travel through the burner tube and to the analyzer. Hence, a signal delay is assumed for the comparison of experiments and simulations. Here, the delay is set to 80 s. Compared to the experiment, NO, the sum of NO and NO, is released over a too short time frame. The model resolves the characteristic two peaks; however, the second peak is advanced in time. In contrast, the model well captures the trend in NO release over different temperatures. The release rate of SO is well-replicated in terms of shape and timing (Figure 9) as is the average trend over temperatures (Figure 10). With higher temperatures, the absolute amount is under-predicted. However, given the small absolute values, the prediction is accounted acceptable, and the reaction rates are not explicitly optimized for sewage sludge because of two aspects. First, due to the little available data in the literature and the small concentrations of the studied species, and hence typical afflicted measurement errors, only trends, not absolute numbers, are targeted by the model. Second, the model development aims to formulate a mathematical description for various biomass and waste streams. The presented model development is hence targeted to extend the capabilities of the municipal solid waste scheme [31] that was validated for the emission release in municipal solid waste and wood incineration [31,56]. Thus, the model’s overall performance is prioritized over individual experiments in this context. However, future work will address the current limitations of the model.
4. Conclusions
The presented work introduces a surrogate formulation for the representation of sewage sludge in modeling. The solid surrogate species combine proteins, lignocellulosic species, sugar, lipid and species to account for the released gases by inorganic species. The devolatilization reactions are modified to comply with a detailed gas-phase mechanism, including tar and gas species reactions, emission pathways for NO and SO. It has been shown that the surrogates represent the ultimate composition of sewage sludge in a close agreement for a variety of different cases. Further, the amount of the individual substance classes, for example, protein and lignin, in the surrogate are plausible. Applied together with a zero-dimensional stochastic gasification reactor approach, the surrogate model enables us to predict the solid mass loss and the yield in the product gas, tar, and water. Further, the model captured the major gas composition and the release of emissions (NO and SO) under pyrolysis, gasification, and incineration conditions. Future work will analyze the impact of fuel properties on the gas yield and efficiency of sewage sludge gasification as well as the emission formation in staged combustion of sewage sludge.
Supplementary Materials
The following are available at https://0-www-mdpi-com.brum.beds.ac.uk/article/10.3390/chemengineering6010016/s1.
Author Contributions
Conceptualization, C.N.; methodology, C.N. and T.L.; software, C.N.; validation, C.N.; formal analysis, C.N.; investigation, C.N.; resources, T.L.; writing—original draft preparation, C.N.; writing—review and editing, T.L.; visualization, C.N.; project administration, C.N.; funding acquisition, T.L. All authors have read and agreed to the published version of the manuscript.
Funding
This research was funded by the Research Council of Norway grant number 267916.
Institutional Review Board Statement
Not applicable.
Informed Consent Statement
Not applicable.
Data Availability Statement
The devolatilization scheme is provided as Supplementary Material, and the data presented in this study are available within the article (tables and figures).
Acknowledgments
This work is financially supported by the Research Council of Norway via the project “Gasification for biofuel production—GASPRO”, No. 267916, and the computations were performed on resources provided by the NTNU IDUN/EPIC computing cluster.
Conflicts of Interest
The authors declare no conflict of interest.
References
- Directive 2008⁄98⁄EC of the European Parliament and of the Council of 19 November 2008 on waste and repealing certain Directives. Off. J. Eur. Union 2008, 51, 1–45. Available online: https://www.legislation.gov.uk/eudr/2008/98/contents# (accessed on 1 January 2022).
- Meng, X.; Huang, Q.; Xu, J.; Gao, H.; Yan, J. A review of phosphorus recovery from different thermal treatment products of sewage sludge. Waste Dispos. Sustain. Energy 2019, 1, 99–115. [Google Scholar] [CrossRef] [Green Version]
- Adar, E.; Ince, M.; Bilgili, M.S. Supercritical water gasification of sewage sludge by continuous flow tubular reactor: A pilot scale study. Chem. Eng. J. 2020, 391, 123499. [Google Scholar] [CrossRef]
- Fytili, D.; Zabaniotou, A. Utilization of sewage sludge in EU application of old and new methods—A review. Renew. Sustain. Energy Rev. 2008, 12, 116–140. [Google Scholar] [CrossRef]
- Stasta, P.; Boran, J.; Bebar, L.; Stehlik, P.; Oral, J. Thermal processing of sewage sludge. Appl. Therm. Eng. 2006, 26, 1420–1426. [Google Scholar] [CrossRef]
- Tsybina, A.; Wuensch, C. Analysis of Sewage Sludge Thermal Treatment Methods in the Context of Circular Economy. Detritus 2018, 2, 3–15. [Google Scholar] [CrossRef]
- Eriksson, E.; Christensen, N.; Ejbye Schmidt, J.; Ledin, A. Potential priority pollutants in sewage sludge. Desalination 2008, 226, 371–388. [Google Scholar] [CrossRef]
- Gupta, A.; Kumar, M.; Srivastava, S. Recent Advances in Wastewater Sludge Valorization. In Bio-valorization of Waste: Trends and Perspectives; Shah, S., Venkatramanan, V., Prasad, R., Eds.; Springer Nature Singapore Pte Ltd.: Singapore, 2021; Chapter 10; pp. 225–247. [Google Scholar]
- Houillon, G.; Jolliet, O. Life cycle assessment of processes for the treatment of wastewater urban sludge: Energy and global warming analysis. J. Clean. Prod. 2005, 13, 287–299. [Google Scholar] [CrossRef]
- Freda, C.; Cornacchia, G.; Romanelli, A.; Valerio, V.; Grieco, M. Sewage sludge gasification in a bench scale rotary kiln. Fuel 2018, 212, 88–94. [Google Scholar] [CrossRef]
- Werle, S. Gasification of a Dried Sewage Sludge in a Laboratory Scale Fixed Bed Reactor. Energies 2015, 8, 8562–8572. [Google Scholar] [CrossRef] [Green Version]
- Uggetti, E.; Llorens, E.; Pedescoll, A.; Ferrer, I.; Castellnou, R.; García, J. Sludge dewatering and stabilization in drying reed beds: Characterization of three full-scale systems in Catalonia, Spain. Bioresour. Technol. 2009, 100, 3882–3890. [Google Scholar] [CrossRef]
- Channiwala, S.; Parikh, P. A unified correlation for estimating HHV of solid, liquid and gaseous fuels. Fuel 2002, 81, 1051–1063. [Google Scholar] [CrossRef]
- Glarborg, P.; Miller, J.A.; Ruscic, B.; Klippenstein, S.J. Modeling nitrogen chemistry in combustion. Prog. Energy Combust. Sci. 2018, 67, 31–68. [Google Scholar] [CrossRef] [Green Version]
- Sørum, L. Characterisation of MSW for Combustion Systems; SINTEF Energy Research: Trondheim, Norway, 2001. [Google Scholar]
- Speth, K.; Murer, M.; Spliethoff, H. Experimental Investigation of Nitrogen Species Distribution in Wood Combustion and Their Influence on NOx Reduction by Combining Air Staging and Ammonia Injection. Energy Fuels 2016, 30, 5816–5824. [Google Scholar] [CrossRef]
- Maffei, T.; Sommariva, S.; Ranzi, E.; Faravelli, T. A predictive kinetic model of sulfur release from coal. Fuel 2012, 91, 213–223. [Google Scholar] [CrossRef]
- Bøjer, M.; Jensen, P.; Dam-Johansen, K.; Madsen, O.; Lundtorp, K. Release of Corrosive Species above the Grate in a Waste Boiler and the Implication for Improved Electrical Efficiency. Energy Fuels 2010, 24, 5696–5707. [Google Scholar] [CrossRef] [Green Version]
- Seggiani, M.; Vitolo, S.; Puccini, M.; Bellini, A. Cogasification of sewage sludge in an updraft gasifier. Fuel 2012, 93, 486–491. [Google Scholar] [CrossRef]
- Kääntee, U.; Zevenhoven, R.; Backman, R.; Hupa, M. Cement manufacturing using alternative fuels and the advantages of process modelling. Fuel Process. Technol. 2004, 85, 293–301. [Google Scholar] [CrossRef]
- Zheng, J.; Jin, Y.Q.; Chi, Y.; Wen, J.M.G.; Jiang, X.G.; Ni, M.J. Pyrolysis characteristics of organic components of municipal solid waste at high heating rates. Waste Manag. 2009, 29, 1089–1094. [Google Scholar] [CrossRef] [PubMed]
- Sørum, L.; Grønli, M.; Hustad, J. Pyrolysis characteristics and kinetics of municipal solid wastes. Fuel 2001, 80, 1217–1227. [Google Scholar] [CrossRef]
- Singh, S.; Wu, C.; Williams, P.T. Pyrolysis of waste materials using TGA-MS and TGA-FTIR as complementary characterisation techniques. J. Anal. Appl. Pyrolysis 2012, 94, 99–107. [Google Scholar] [CrossRef]
- Grammelis, P.; Basinas, P.; Malliopoulou, A.; Sakellaropoulos, G. Pyrolysis kinetics and combustion characteristics of waste recovered fuels. Fuel 2009, 88, 195–205. [Google Scholar] [CrossRef]
- Fan, Y.; Yu, Z.; Fang, S.; Lin, Y.; Lin, Y.; Liao, Y.; Ma, X. Investigation on the co-combustion of oil shale and municipal solid waste by using thermogravimetric analysis. Energy Convers. Manag. 2016, 117, 367–374. [Google Scholar] [CrossRef]
- Fang, S.; Yu, Z.; Lin, Y.; Hu, S.; Liao, Y.; Ma, X. Thermogravimetric analysis of the co-pyrolysis of paper sludge and municipal solid waste. Energy Convers. Manag. 2015, 101, 626–631. [Google Scholar] [CrossRef]
- Font, R.; Marcilla, A.; García, A.; Caballero, J.; Conesa, J. Kinetic models for the thermal degradation of heterogeneous materials. J. Anal. Appl. Pyrolysis 1995, 32, 29–39. [Google Scholar] [CrossRef]
- Seo, M.W.; Kim, S.D.; Lee, S.H.; Lee, J.G. Pyrolysis characteristics of coal and RDF blends in non-isothermal and isothermal conditions. J. Anal. Appl. Pyrolysis 2010, 88, 160–167. [Google Scholar] [CrossRef]
- Yao, Z.; Yu, S.; Su, W.; Wu, W.; Tang, J.; Qi, W. Kinetic studies on the pyrolysis of plastic waste using a combination of model-fitting and model-free methods. Waste Manag. Res. 2020, 38, 77–85. [Google Scholar] [CrossRef]
- Alves, J.L.F.; Da Silva, J.C.G.; Di Domenico, M.; Galdino, W.V.D.A.; Andersen, S.L.F.; Alves, R.F.; De Sena, R.F. Exploring Açaí Seed (Euterpe oleracea) Pyrolysis Using Multi-component Kinetics and Thermodynamics Assessment Towards Its Bioenergy Potential. BioEnergy Res. 2021, 14, 209–225. [Google Scholar] [CrossRef]
- Netzer, C.; Li, T.; Løvås, T. Surrogate Reaction Mechanism for Waste Incineration and Pollutant Formation. Energy Fuels 2021, 35, 7030–7049. [Google Scholar] [CrossRef]
- Ranzi, E.; Pierucci, S.; Aliprandi, P.; Stringa, S. Comprehensive and Detailed Kinetic Model of a Traveling Grate Combustor of Biomass. Energy Fuels 2011, 25, 4195–4205. [Google Scholar] [CrossRef]
- Anca-Couce, A.; Mehrabian-Bardar, R.; Scharler, R.; Obernberger, I. Kinetic scheme of biomass pyrolysis considering secondary charring reactions. Energy Convers. Manag. 2014, 87, 687–696. [Google Scholar] [CrossRef]
- Sommariva, S.; Maffei, T.; Migliavacca, G.; Faravelli, T.; Ranzi, E. A predictive multi-step kinetic model of coal devolatilization. Fuel 2010, 89, 318–328. [Google Scholar] [CrossRef]
- Ranzi, E.; Cuoci, A.; Faravelli, T.; Frassoldati, A.; Migliavacca, G.; Pierucci, S.; Sommariva, S. Chemical Kinetics of Biomass Pyrolysis. Energy Fuels 2008, 22, 4292–4300. [Google Scholar] [CrossRef]
- Debiagi, P.; Pecchi, C.; Gentile, G.; Frassoldati, A.; Cuoci, A.; Faravelli, T.; Ranzi, E. Extractives Extend the Applicability of Multistep Kinetic Scheme of Biomass Pyrolysis. Energy Fuels 2015, 29, 6544–6555. [Google Scholar] [CrossRef]
- Debiagi, P.E.A.; Trinchera, M.; Frassoldati, A.; Faravelli, T.; Vinu, R.; Ranzi, E. Algae characterization and multistep pyrolysis mechanism. J. Anal. Appl. Pyrolysis 2017, 128, 423–436. [Google Scholar] [CrossRef]
- Debiagi, P.; Gentile, G.; Cuoci, A.; Frassoldati, A.; Ranzi, E.; Faravelli, T. A predictive model of biochar formation and characterization. J. Anal. Appl. Pyrolysis 2018, 134, 326–335. [Google Scholar] [CrossRef]
- Žnidarčič, A.; Katrašnik, T.; Zsély, I.; Nagy, T.; Seljak, T. Sewage sludge combustion model with reduced chemical kinetics mechanisms. Energy Convers. Manag. 2021, 236, 114073. [Google Scholar] [CrossRef]
- LOGEresearch v1.10, LOGE AB. 2018. Available online: http://www.logesoft.com (accessed on 1 December 2021).
- Weber, K.; Li, T.; Løvås, T.; Perlman, C.; Seidel, L.; Mauss, F. Stochastic reactor modeling of biomass pyrolysis and gasification. J. Anal. Appl. Pyrolysis 2017, 124, 592–601. [Google Scholar] [CrossRef] [Green Version]
- Netzer, C.; Li, T.; Seidel, L.; Mauß, F.; Løvås, T. Stochastic Reactor-Based Fuel Bed Model for Grate Furnaces. Energy Fuels 2020, 34, 16599–16612. [Google Scholar] [CrossRef]
- Francisca Gómez-Rico, M.; Font, R.; Fullana, A.; Martín-Gullón, I. Thermogravimetric study of different sewage sludges and their relationship with the nitrogen content. J. Anal. Appl. Pyrolysis 2005, 74, 421–428. [Google Scholar] [CrossRef]
- Shao, L.; Fan, S.; Zhang, H.; Yao, Q.; He, P. SO2 and NOx emissions from sludge combustion in a CO2/O2 atmosphere. Fuel 2013, 109, 178–183. [Google Scholar] [CrossRef]
- Van Doorn, J.; Bruyn, P.; Vermeij, P. Combined combustion of biomass, municipal sewage sludge and coal in an atmospheric fluidized bed installation. In Biomass for Energy and the Environment: Proceedings of the 9th European Bioenergy Conference; Chartier, P., Ed.; Elsevier: Oxford, UK, 1996; Volume 2, pp. 1007–1012. [Google Scholar]
- Van Daalen, W.; van Doorn, J. Brandstoffen uit Reststromen voor Circulerend Wervelbedvergassing; NV Afvalzorg Noord-Holland: Haarlem, The Netherlands, 1997; 36p. [Google Scholar]
- Font, R.; Fullana, A.; Conesa, J.; Llavador, F. Analysis of the pyrolysis and combustion of different sewage sludges by TG. J. Anal. Appl. Pyrolysis 2001, 58–59, 927–941. [Google Scholar] [CrossRef]
- Owczarek, C.; Krautz, H.J.; Griebe, S. Cycloid combustion—A new concept for industrial combustion with low-calorific fuels. In Proceedings of the 5th European Conference on Industrial Furnaces and Boilers, Espinho-Porto, Portugal, 11–14 April 2000; Volume 2, pp. 25–34. [Google Scholar]
- Storm, C.; Spliethoff, H.; Hein, K.R. Generation of a gaseous fuel by gasification or pyrolysis of biomass for use as reburn gas in coal-fired boilers. In Proceedings of the 5th European Conference on Industrial Furnaces and Boilers, Espinho-Porto, Portugal, 11–14 April 2000; Volume 1, pp. 689–699. [Google Scholar]
- Hein, K.R.G. Combined Combustion of Biomass/Sewage Sludge and Coals; Clean Coal Technology Programme 1992–1994, Stuttgart, IVD; Institute for Process Engineering and Power Plant Technology: Stuttgart, Germany, 1994; ISBN 3-928123-16-5. [Google Scholar]
- Inguanzo, M.; Menéndez, J.; Fuente, E.; Pis, J. Reactivity of pyrolyzed sewage sludge in air and CO2. J. Anal. Appl. Pyrolysis 2001, 58–59, 943–954. [Google Scholar] [CrossRef]
- Lumley, N.P.; Ramey, D.F.; Prieto, A.L.; Braun, R.J.; Cath, T.Y.; Porter, J.M. Techno-economic analysis of wastewater sludge gasification: A decentralized urban perspective. Bioresour. Technol. 2014, 161, 385–394. [Google Scholar] [CrossRef] [Green Version]
- Alzueta, M.U.; Tena, A.; Bilbao, R. Pyridine conversion in a flow reactor and its interaction with nitric oxide. Combust. Sci. Technol. 2002, 174, 151–169. [Google Scholar] [CrossRef]
- Wu, L.; Tian, Z.; Weng, J.; Yu, D.; Liu, Y.; Tian, D.; Cao, C.; Zou, J.; Zhang, Y.; Yang, J. Experimental and kinetic study on the low-temperature oxidation of pyridine as a representative of fuel-N compounds. Combust. Flame 2019, 202, 394–404. [Google Scholar] [CrossRef]
- Cuoci, A.; Faravelli, T.; Frassoldati, A.; Granata, S.; Migliavacca, G.; Pierucci, S.; Ranzi, E.; Sommariva, S. A General Mathematical Model of Biomass Devolatilization. Note 2. Detailed Kinetics of Volatile Species. In Proceedings of the 30th Meeting of The Italian Section of The Combustion Institute, Naples, Italy, 20–23 June 2007; p. 8. [Google Scholar]
- Netzer, C.; Li, T.; Løvås, T. Nitrogen Oxide Prediction within a Woody Biomass Fuel Bed Using Detailed Chemistry. In Proceedings of the European Combustion Meeting, Naples, Italy, 14–15 April 2021; p. 171. [Google Scholar]
Figure 1.
Variation of the ultimate composition in the analyzed sewage sludge samples. Shown are dry mass percent including ash. Data from the literature [10,43,44,45,46,47,48,49,50,51].

Figure 2.
Overview of the used model components for the devolatilization scheme.

Figure 3.
Devolatilization pathways for the volatile surrogate species. Lignocellulosic species (figures (a–c)) according to Ranzi et al. [32] and remaining species (figures (d–f)) by Debiagi et al. [37]. Boxed species denote intermediate solid species; mp is short for metaplastic species.

Figure 4.
Mass based elemental ratios of the surrogate species and sludge samples (black crosses). Same sewage sludge samples as in Figure 1.
Figure 4.
Mass based elemental ratios of the surrogate species and sludge samples (black crosses). Same sewage sludge samples as in Figure 1.

Figure 5.
Surrogate representation for the sewage sludge samples ID 1 to 16 [43]. Sorted, decreasing, by the carbon content in the dry ash containing sewage sludge.
Figure 5.
Surrogate representation for the sewage sludge samples ID 1 to 16 [43]. Sorted, decreasing, by the carbon content in the dry ash containing sewage sludge.

Figure 6.
Solid mass loss as ratio of mass w over initial mass for selected samples. Model prediction using the surrogate listed in Table 3 versus thermogravimetric measurements by Gómez-Rico et al. [43]. Shown are pyrolysis conditions, denoted with P, using helium and combustion, denoted with C, using a mixture of 20 vol% oxygen and 80 vol% helium.


Figure 7.
Prediction of the main gas-phase species obtained by the rotary kiln gasifier. Experimental results taken from Freda et al. [10]. Shown species: nitrogen (N), carbon dioxide (CO), carbon monoxide (CO), hydrogen (H), methane (CH), and ethane (CH). All values refer to the dry tar-free gas.
Figure 7.
Prediction of the main gas-phase species obtained by the rotary kiln gasifier. Experimental results taken from Freda et al. [10]. Shown species: nitrogen (N), carbon dioxide (CO), carbon monoxide (CO), hydrogen (H), methane (CH), and ethane (CH). All values refer to the dry tar-free gas.

Figure 8.
Predicted gas, tar, and water yield obtained by the rotary kiln gasifier and the cold gas efficiency of the process. All values refer to the dry tar-free gas at normal conditions.
Figure 8.
Predicted gas, tar, and water yield obtained by the rotary kiln gasifier and the cold gas efficiency of the process. All values refer to the dry tar-free gas at normal conditions.

Figure 9.
Nitrogen oxides and sulfur dioxides release at 1023 K over the residence time (600 s) under a combustion atmosphere (80 vol% N, 20 vol% O). Experiments by Shao et al. [44].
Figure 9.
Nitrogen oxides and sulfur dioxides release at 1023 K over the residence time (600 s) under a combustion atmosphere (80 vol% N, 20 vol% O). Experiments by Shao et al. [44].

Figure 10.
Average emission of nitrogen and sulfur oxides over the experimental duration time (600 s) under a combustion atmosphere (80 vol% N, 20 vol% O) reported by Shao et al. [44].
Figure 10.
Average emission of nitrogen and sulfur oxides over the experimental duration time (600 s) under a combustion atmosphere (80 vol% N, 20 vol% O) reported by Shao et al. [44].


Table 1.
Surrogate species for the description of the volatile matter of sewage sludge, ash and moisture content. (*) denotes devolatilization schemes modified in the presented work.
Table 1.
Surrogate species for the description of the volatile matter of sewage sludge, ash and moisture content. (*) denotes devolatilization schemes modified in the presented work.
| Surrogate | Trivial Name | Elementary Composition | Ref. | |||||
|---|---|---|---|---|---|---|---|---|
| Species | C | H | O | N | S | Si | ||
| CELL | cellulose | 6 | 10 | 5 | 0 | 0 | 0 | [32] |
| HCE | hemi-cellulose | 5 | 8 | 4 | 0 | 0 | 0 | [32] |
| LIG | lignin rich in C | 15 | 14 | 4 | 0 | 0 | 0 | [32] |
| LIG | lignin rich in H | 22 | 28 | 9 | 0 | 0 | 0 | [32] |
| LIG | lignin rich in O | 20 | 22 | 10 | 0 | 0 | 0 | [32] |
| SUGAR | sugar | 6 | 8 | 6 | 0 | 0 | 0 | [37], (*) |
| LIPID | lipid | 18 | 32 | 2 | 0 | 0 | 0 | [37], (*) |
| PROT | protein rich in H | 400 | 900 | 150 | 86 | 0 | 0 | [31,37] |
| PROT | protein rich in C | 500 | 450 | 65 | 80 | 0 | 0 | [37], (*) |
| PROT | protein rich in O | 250 | 500 | 200 | 72 | 0 | 0 | [37], (*) |
| NHI | product gas | 0 | 3 | 0 | 1 | 0 | 0 | [31] |
| inorganic nitrogen | ||||||||
| COI | product gas | 1 | 0 | 2 | 0 | 0 | 0 | [37] |
| inorganic carbon | ||||||||
| (HS SO COS)I | product gas | 1 | 2 | 3 | 0 | 3 | 0 | [31] |
| inorganic sulfur | ||||||||
| HO(S) | moisture content | 0 | 2 | 1 | 0 | 0 | 0 | [32] |
| ASH | ash | 0 | 0 | 0 | 0 | 0 | 1 | [32] |
Table 2.
Updated devolatilization subset for the thermal treatment of sewage sludge. G{} denote metaplastic species.
Table 2.
Updated devolatilization subset for the thermal treatment of sewage sludge. G{} denote metaplastic species.
| No. | Reaction | A (1/s) | n (-) | Ea (kcal/kmol) |
|---|---|---|---|---|
| 16 | PROT →2.5PROT + 0.6PROT + 25NH + 10NO + HCN + CHN + CHN + CHO + 12.75CH + 37.3CO + 7.7CO + 71HO | 1.00 × 10 | 0.0 | 15,500.0 |
| 17 | PROT →5PROT+ 27NH + 7.5HCN + 0.5NO + 0.5CHN + 0.5CHN + 0.5CHO + 20.75G{H} + 21.5CH + 70CH + 23.5HO | 1.00 × 10 | 0.0 | 15,500.0 |
| 18 | PROT →4.5PROT + 8HCN + 2NH + 0.5CHN + 0.5CHN + 0.5CHO + 29CO + 1.5NO + 23.5CH + 5CO + 10HO | 1.00 × 10 | 0.0 | 15,500.0 |
| 19 | PROT →27.5char + 2char + 0.5HCN + 0.5NO + 0.5CHN + 0.5CHN + 0.5CHO + 1.083333CH + 3G{NH} + 3G{HCN} + 1.5G{CO} + 22HO | 1.00 × 10 | 0.0 | 15,500.0 |
| 20 | PROT →42.75char + 2char + 0.5HCN + 0.5NO + 0.5CHN + 0.5CHN + 0.5CHO + 3.5CH + NH + 10G{HCN} + 3.375CH + 3CH + 1.5HO | 1.00 × 10 | 0.0 | 15,500.0 |
| 21 | SUGAR →0.47SUGAR + 0.53SUGAR | 8.00 × 10 | 0.0 | 26,000.0 |
| 22 | SUGAR →0.68CHO4 + 0.48HO + 1.2CO + 0.2CHO + 0.4G{CO} + 0.4HO | 1.50 × 10 | 0.0 | 16,000.0 |
| 23 | SUGAR →1.6char + 0.25G{CH} + 0.1G{CH} + 0.73G{COH} + 0.62G{CO} + 1.3G{CO} + 0.88HO + 0.26CHOH + 0.13CHOH + 0.39CHCOOH | 2.00 × 10 | 0.0 | 20,000.0 |
| 24 | LIPID →0.75CHCOOH + 3CH + 2.25CH + 0.75CH + 0.25HLIPID | 8.00 × 10 | 0.0 | 18,000.0 |
| 25 | HLIPID →9char + 2G{COH} + 6G{H} + 3G{CH} + G{CH} | 7.00 × 10 | 0.0 | 49,700.0 |
| 26 | NHI →NH | 2.50 × 10 | 0.0 | 27,800.0 |
| 27 | (HSSOCOS)I →(HSCOS)I + SO | 1.00 × 10 | 0.0 | 41,800 |
| 28 | (HSCOS)I →HS + COS | 1.00 × 10 | 0.0 | 25,100 |
| 29 | COI →CO | 1.00 × 10 | 0.0 | 38,000.0 |
Table 3.
Comparison of the elemental composition of the sewage sludge samples and their surrogates in mass percentage, dry ash-included.
Table 3.
Comparison of the elemental composition of the sewage sludge samples and their surrogates in mass percentage, dry ash-included.
| Sewage Sludge | Surrogate | Error in % | Absolut Deviation | |||||||||||||
|---|---|---|---|---|---|---|---|---|---|---|---|---|---|---|---|---|
| ID | C | H | N | S | C | H | N | S | C | H | N | S | C | H | N | S |
| 1 | 41.2 | 3.6 | 6.1 | 0.83 | 40.8 | 3.7 | 5.7 | 0.80 | 1.1 | 2.8 | 5.8 | 3.35 | 0.4 | 0.1 | 0.4 | 0.03 |
| 2 | 25.1 | 2.7 | 3.9 | 2.50 | 25.1 | 2.7 | 3.9 | 2.50 | 0.2 | 0.0 | 0.0 | 0.08 | 0.0 | 0.0 | 0.0 | 0.00 |
| 3 | 40.8 | 3.1 | 6.1 | 0.71 | 40.3 | 3.3 | 5.5 | 0.66 | 1.3 | 5.6 | 10.2 | 6.72 | 0.5 | 0.2 | 0.6 | 0.05 |
| 4 | 38.5 | 3.9 | 6.0 | 1.20 | 38.2 | 4.0 | 5.6 | 1.17 | 0.8 | 2.5 | 5.9 | 2.26 | 0.3 | 0.1 | 0.4 | 0.03 |
| 5 | 35.3 | 2.9 | 5.1 | 0.90 | 34.9 | 3.0 | 4.8 | 0.88 | 1.2 | 2.9 | 5.8 | 2.20 | 0.4 | 0.1 | 0.3 | 0.02 |
| 6 | 31.1 | 1.9 | 4.1 | 0.71 | 30.8 | 1.9 | 4.1 | 0.71 | 1.0 | 0.1 | 0.2 | 0.28 | 0.3 | 0.0 | 0.0 | 0.00 |
| 7 | 37.3 | 3.6 | 5.7 | 1.30 | 36.9 | 3.7 | 5.3 | 1.27 | 1.0 | 2.8 | 6.6 | 1.95 | 0.4 | 0.1 | 0.4 | 0.03 |
| 8 | 29.3 | 2.5 | 4.3 | 0.56 | 29.2 | 2.5 | 4.3 | 0.56 | 0.3 | 0.0 | 0.1 | 0.12 | 0.1 | 0.0 | 0.0 | 0.00 |
| 9 | 42.0 | 4.4 | 6.3 | 1.50 | 41.4 | 4.4 | 5.7 | 1.32 | 1.5 | 1.1 | 9.0 | 11.71 | 0.6 | 0.0 | 0.6 | 0.18 |
| 10 | 35.9 | 6.2 | 5.5 | 4.20 | 35.7 | 6.2 | 5.4 | 4.17 | 0.6 | 0.2 | 1.7 | 0.73 | 0.2 | 0.0 | 0.1 | 0.03 |
| 11 | 40.5 | 2.1 | 5.9 | 0.52 | 40.2 | 2.2 | 5.5 | 0.49 | 0.8 | 5.1 | 6.4 | 5.10 | 0.3 | 0.1 | 0.4 | 0.03 |
| 12 | 28.5 | 4.6 | 4.7 | 1.50 | 28.4 | 4.6 | 4.7 | 1.50 | 0.2 | 0.0 | 0.0 | 0.04 | 0.1 | 0.0 | 0.0 | 0.00 |
| 13 | 32.0 | 2.1 | 4.6 | 0.69 | 31.7 | 2.2 | 4.4 | 0.68 | 0.8 | 2.4 | 3.7 | 2.13 | 0.3 | 0.1 | 0.2 | 0.01 |
| 14 | 26.3 | 3.4 | 4.2 | 1.20 | 26.2 | 3.4 | 4.2 | 1.20 | 0.2 | 0.0 | 0.0 | 0.13 | 0.1 | 0.0 | 0.0 | 0.00 |
| 15 | 19.8 | 2.1 | 2.8 | 2.80 | 19.7 | 2.1 | 2.8 | 2.80 | 0.7 | 0.1 | 0.1 | 0.04 | 0.1 | 0.0 | 0.0 | 0.00 |
| 16 | 24.8 | 3.2 | 3.9 | 1.30 | 24.7 | 3.2 | 3.9 | 1.30 | 0.4 | 0.1 | 0.1 | 0.04 | 0.1 | 0.0 | 0.0 | 0.00 |
| A | 41.2 | 5.2 | 3.2 | 0.00 | 40.9 | 5.2 | 3.2 | 0.00 | 0.7 | 0.2 | 0.0 | 0.00 | 0.3 | 0.0 | 0.0 | 0.00 |
| B | 40.3 | 6.8 | 7.0 | 0.90 | 39.9 | 5.2 | 6.4 | 0.91 | 1.0 | 22.6 | 8.5 | 1.0 | 0.4 | 1.5 | 0.6 | 0.01 |
Table 4.
Operating conditions rotary kiln [10].
Table 4.
Operating conditions rotary kiln [10].
| ID | Fuel Feed | Airflow Rate | Temperature | |
|---|---|---|---|---|
| (g/h) | Nl/min | (K) | (-) | |
| Cond 1 | 261 | 1 | 1023 | 0.05 |
| Cond 2 | 171 | 2 | 1073 | 0.15 |
| Cond 3 | 237 | 3 | 1123 | 0.16 |
| Cond 4 | 244 | 4.5 | 1123 | 0.24 |
Publisher’s Note: MDPI stays neutral with regard to jurisdictional claims in published maps and institutional affiliations. |
© 2022 by the authors. Licensee MDPI, Basel, Switzerland. This article is an open access article distributed under the terms and conditions of the Creative Commons Attribution (CC BY) license (https://creativecommons.org/licenses/by/4.0/).
Share and Cite
MDPI and ACS Style
Netzer, C.; Løvås, T. Chemical Model for Thermal Treatment of Sewage Sludge. ChemEngineering 2022, 6, 16. https://0-doi-org.brum.beds.ac.uk/10.3390/chemengineering6010016
AMA Style
Netzer C, Løvås T. Chemical Model for Thermal Treatment of Sewage Sludge. ChemEngineering. 2022; 6(1):16. https://0-doi-org.brum.beds.ac.uk/10.3390/chemengineering6010016
Chicago/Turabian StyleNetzer, Corinna, and Terese Løvås. 2022. "Chemical Model for Thermal Treatment of Sewage Sludge" ChemEngineering 6, no. 1: 16. https://0-doi-org.brum.beds.ac.uk/10.3390/chemengineering6010016