Article

Effect of Artificial Freeze/Thaw and Thermal Shock Ageing, Combined or Not with Salt Crystallisation on the Colour of Zamora Building Stones (Spain)

by
Jacinta García-Talegón
1,*,
Adolfo Carlos Iñigo
2,
Rosa Sepúlveda
3 and
Eduardo Azofra
4
1
Departamento de Geología, Universidad de Salamanca, 37008 Salamanca, Spain
2
Instituto de Recursos Naturales y Agrobiología de Salamanca (IRNASA), CSIC, 37008 Salamanca, Spain
3
Departamento de Estadística, Universidad de Salamanca, 37007 Salamanca, Spain
4
Departamento Historia del Arte, Universidad de Salamanca, 37001 Salamanca, Spain
*
Author to whom correspondence should be addressed.
Submission received: 5 June 2022 / Revised: 1 July 2022 / Accepted: 28 July 2022 / Published: 4 August 2022
(This article belongs to the Special Issue A Themed Issue in Honor of Prof. Dr. Vicente Rives)

Abstract

:
After subjecting Zamora building stones to accelerated ageing tests, colour changes were studied, namely: (a) freezing/thawing and thermal shock (gelifraction and thermoclasty), and (b) combination of freezing/thawing plus thermal shock and salt crystallisation (sulphates or phosphates) (gelifraction, thermoclasty and haloclasty). Zamora building stones are silicified conglomerates (silcretes) from the Cretaceous that show marked colour changes due to the remobilisation of iron oxyhydroxides. In this work, four varieties were: white stone; ochreous stone; white and red stone; and purple stone Their micromorphological characterization (skeleton, weathering plasma and porosity/cutan) is formed of grains and fragments of quartz and quartzite as well as by accesory minerals muscovite and feldspar (more or less altered), and some opaque. Quartz, feldspar and illite/mica were part of the skeleton; kaolinite, iron oxyhydroxides, and CT opal were part of the weathering plasma or cutans; their porosity were 11.7–8.7%. Their chromatic data have been statistically analysed (MANOVA-Biplot). They showed higher variations in ΔE*, ΔL*, Δa* and Δb*on combined freezing/thawing plus thermal shock and sulphates crystallisation leading to rapid alteration of the building stones. Chromatic differences between the other two artificial ageing tests were less evident and were not detected in all samples. The global effect of ageing on the Zamora building stones darkened them and reduced their yellowing. The ochreous stone suffered the least variation and the purple stone the most. This study of the colour by statistical analyse may be of interest for the evaluation and monitoring of stone decay, which is an inexpensive, simple, easy and non-destructive technique.

1. Introduction

Zamora is a “Romanesque city” with 24 Romanesque churches, the Castle, the Cathedral and City Walls from the 12th and 13th centuries built in silicified sandstones and conglomerates called Zamora building stones. These stones have been used in monuments of Zamora, in the masonry wall, and in the lower parts of religious and civil monuments of the cities of Salamanca and Avila, which were designated World Heritage Cities by UNESCO in 1988 and 1985 respectively [1]. Building stone monuments represent a significant part of the World Heritage, enclosing a historical, aesthetic and constructive material value. The architectural heritage of a city is strongly influenced by its geological context and by the place where the building stones were quarried in the surroundings of the urban centre. Thus, cities are often characterised by distinctive chromatic features that reflect those of the locally available building stones, as is the case with Villamayor sandstone in the city of Salamanca, whose natural alteration in monuments is accompanied by the development of a golden-reddish patina. Hence, the term ‘golden sandstone’ is one of the signatures of monuments and buildings constructed with this building stone [2,3].
The durability of building stone is its behaviour against decay processes that depend on the mineralogical composition, texture and structure of the stone (intrinsic factors), its location in the monument and environmental conditions (extrinsic factors). Its prediction is complex, given the variety of factors involved, and the great forms of decay that can occur [4]. Foreseeing the expected decay processes of stone materials is of paramount importance to anticipate problems arising from the accelerated ageing test; and currently climatic chambers under controlled conditions are used for this. In this work, different accelerated ageing tests simulating the conditions of the city of Zamora with a Mediterranean climate with a continental tendency and low polluted, with a mean annual temperature of 11–12 °C were carried out. The range of daily temperature fluctuations may be as large as 30 °C. The absolute maximum temperature measured based on a historical data series (15 years) is 37 °C, while the absolute minimum is −19 °C. Average annual rainfall is about 395 mm, mainly in spring and autumn, with July and August typically characterised by severe droughts [5,6,7,8].
On the exposed exteriors of monuments, thermoclasty and gelifraction are responsible for the decay of Zamora building stones (silicified conglomerates) leading to microfissures, plates, flakes, and surface arenisation. Additionally, outwards areas of the lower parts of the monuments, affected by capillary damping of polluted water, are subject to a synergistic effect between these factors and salt crystallization (haloclasty/gelifraction/thermoclasty). Inwards of monuments, the most extensive and commonly decay of silicified conglomerates is due to the presence of salts in microenvironments, which crystallise inside the pore network (sub-efflorescences) or outside it (efflorescences) [5,6,7,8].
The main water-soluble salts studied in the efflorescences and/or subefflorescences of historical stones of the buildings are composed of the following anions Cl, NO3, SO42−, CO32−, PO43− etc. The source of the salts may be multiple, from the mortar of the wall and from the outside e.g., bird droppings which, being very soluble, migrate easily to the surface. In the high parts of the building it is due to infiltration by rain off, which dissolves the soluble species in mortars, while in the lower parts the source of salts come from capillary damping (polluted urban groundwater) [9].
One of the aesthetic parameters of a building stone is its colour, which contributes greatly to its ornamental value. As with other properties, colour monitoring is of great importance to evaluate treatment effectiveness when the stone is subjected to conservation or restoration treatment [10,11,12,13,14,15,16], to assess changes by accelerated ageing tests [16,17,18,19,20,21,22] and to in situ deterioration in the building [3,23,24,25,26,27,28,29]. In most of the works cited, stone building materials, after the application of conservation treatments (waterproofing, consolidation, desalination, etc.), accelerated artificial ageing, or deterioration in situ in monuments, produce a greater darkness and more reddish and/or yellowish tones, depending on the case.
The purpose of this study was to quantify the colour changes in building stones that were submitted to three different accelerated ageing treatments (freezing/thawing and two combined freezing/thawing and salt crystallisation), to allow a rationale use of these building stones and to anticipate their behaviour in advance, in order to succeed in restoration. In the combined tests with salt crystallisation, sulphates were selected on the one hand, because they are soluble in water, which increases more in volume when crystallising, and their deterioration is greater through the so-called wedge effect (physical); and on the other hand, phosphates, because they give a very alcaline medium to the dissolution (pH > 11), and although the decay process is much slower, it would be by chemical dissolution, and the wedge effect (physical) would be lesser.

2. Materials and Methods

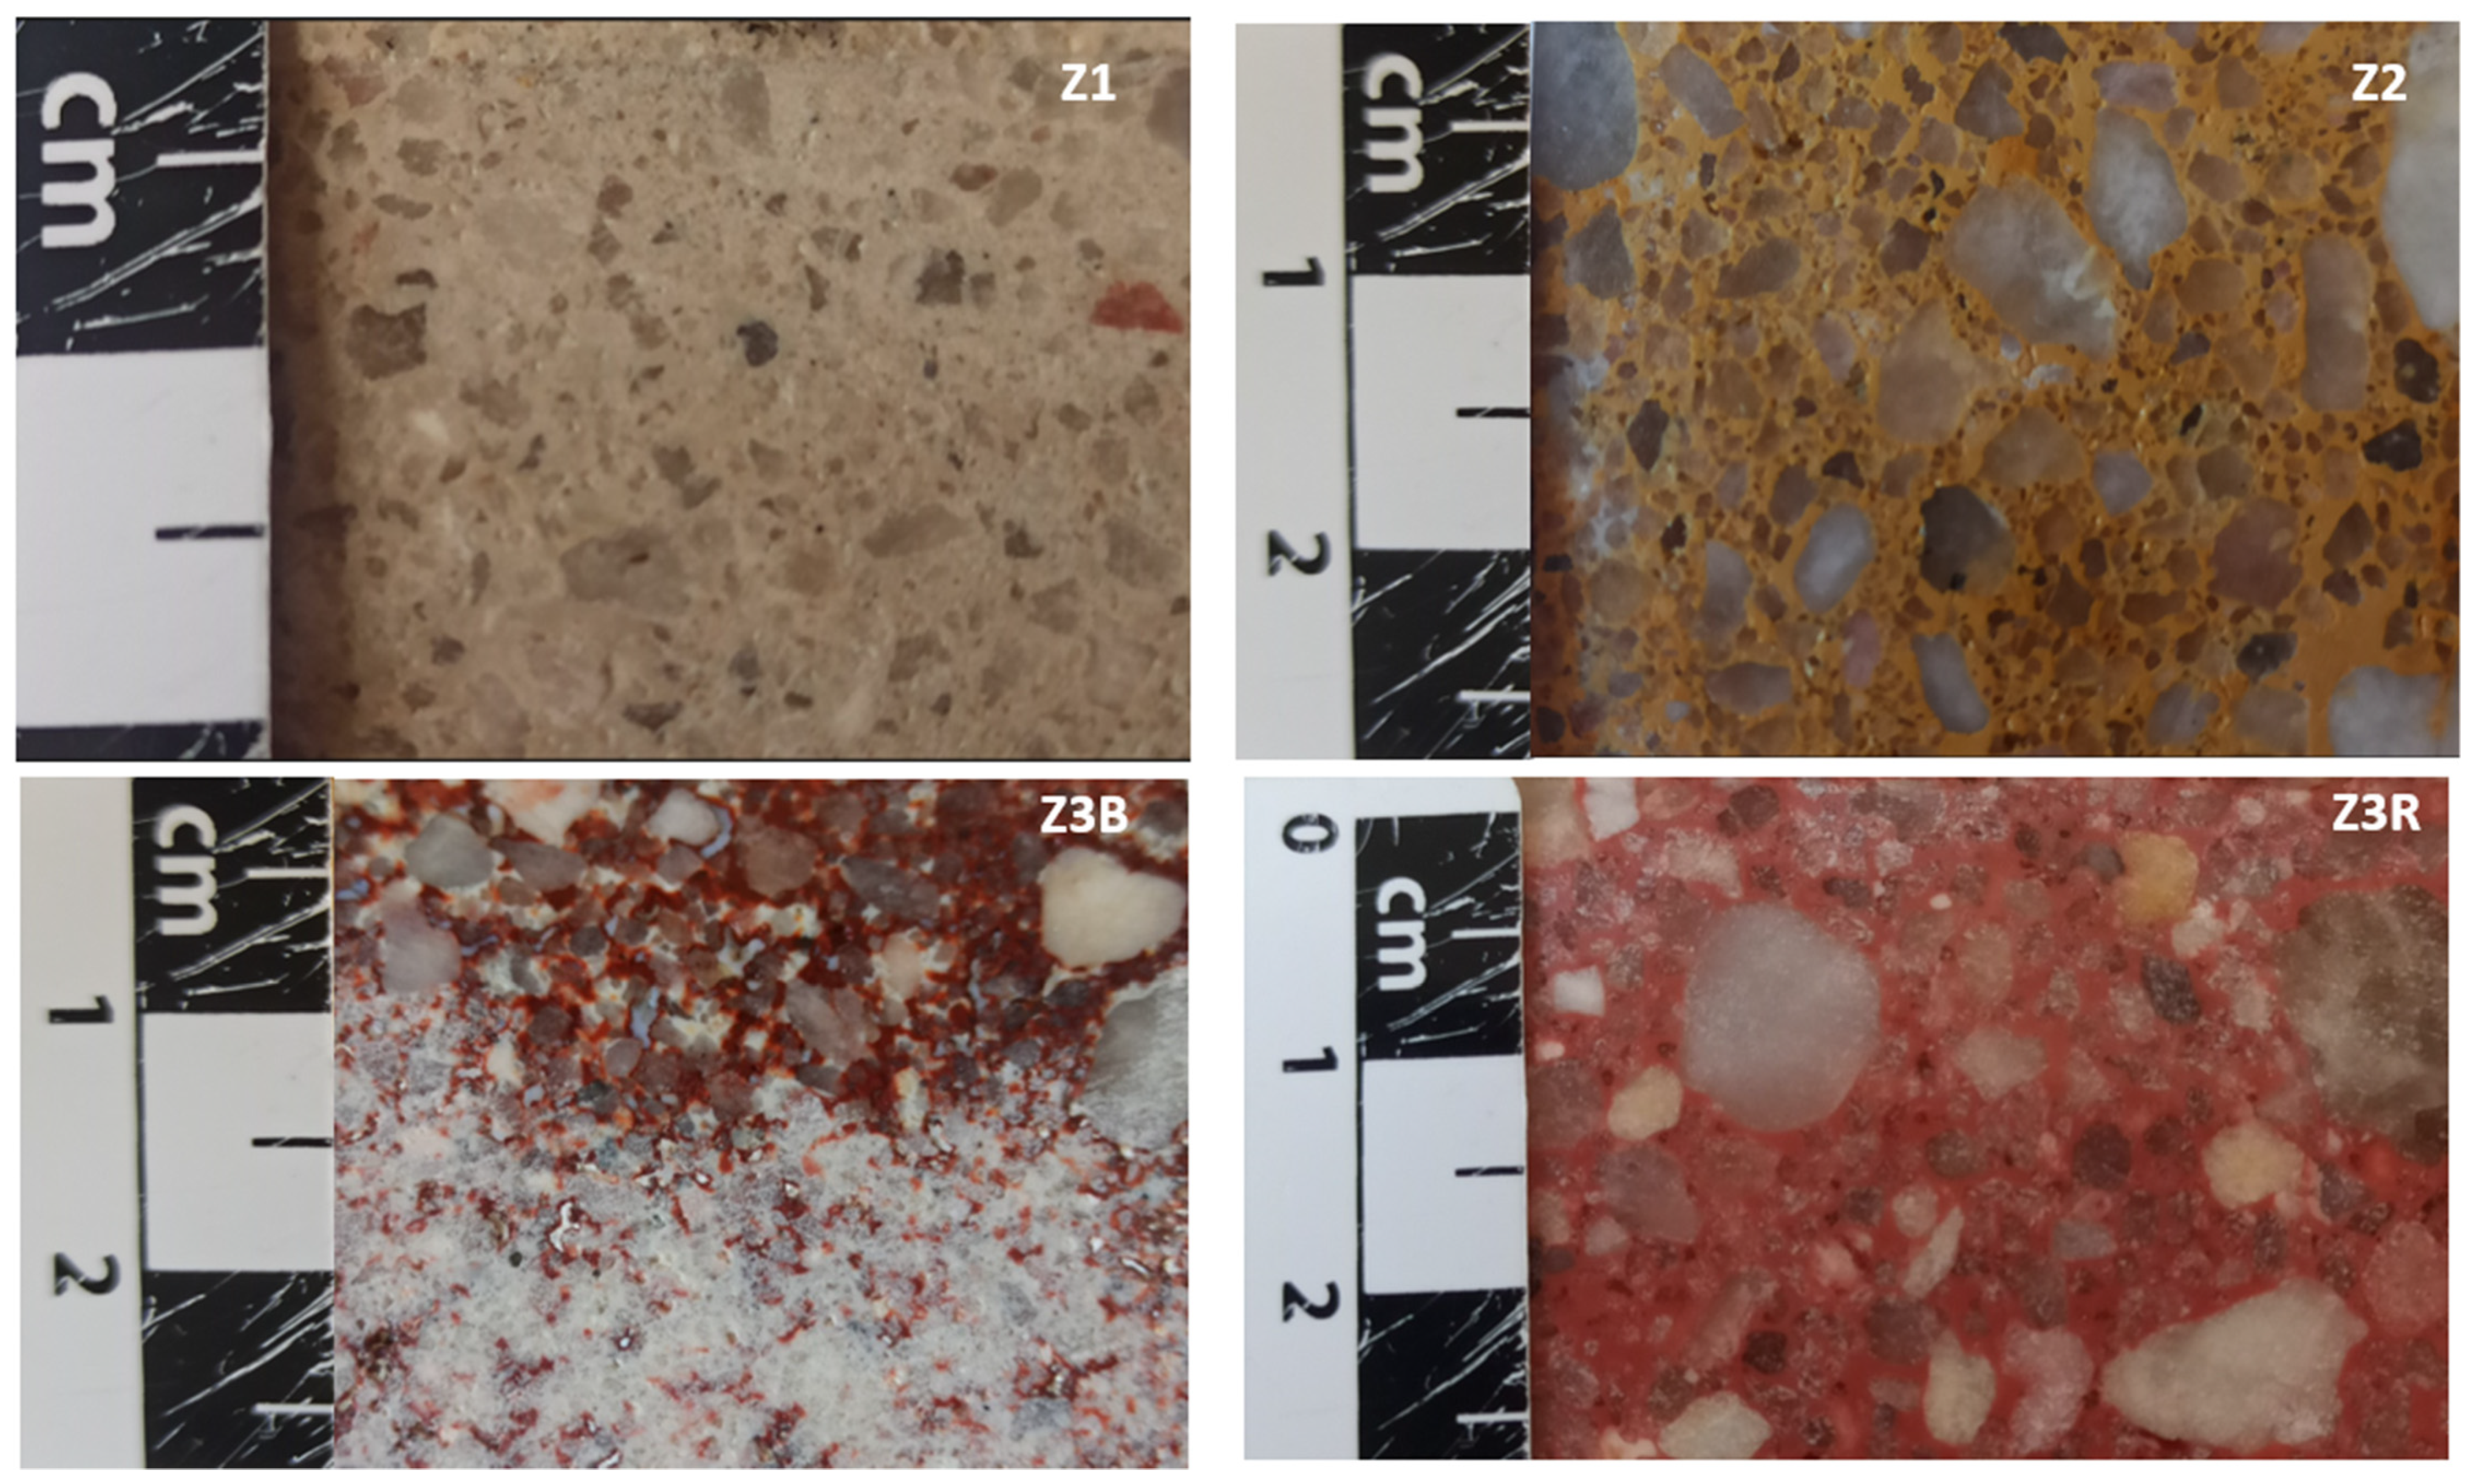
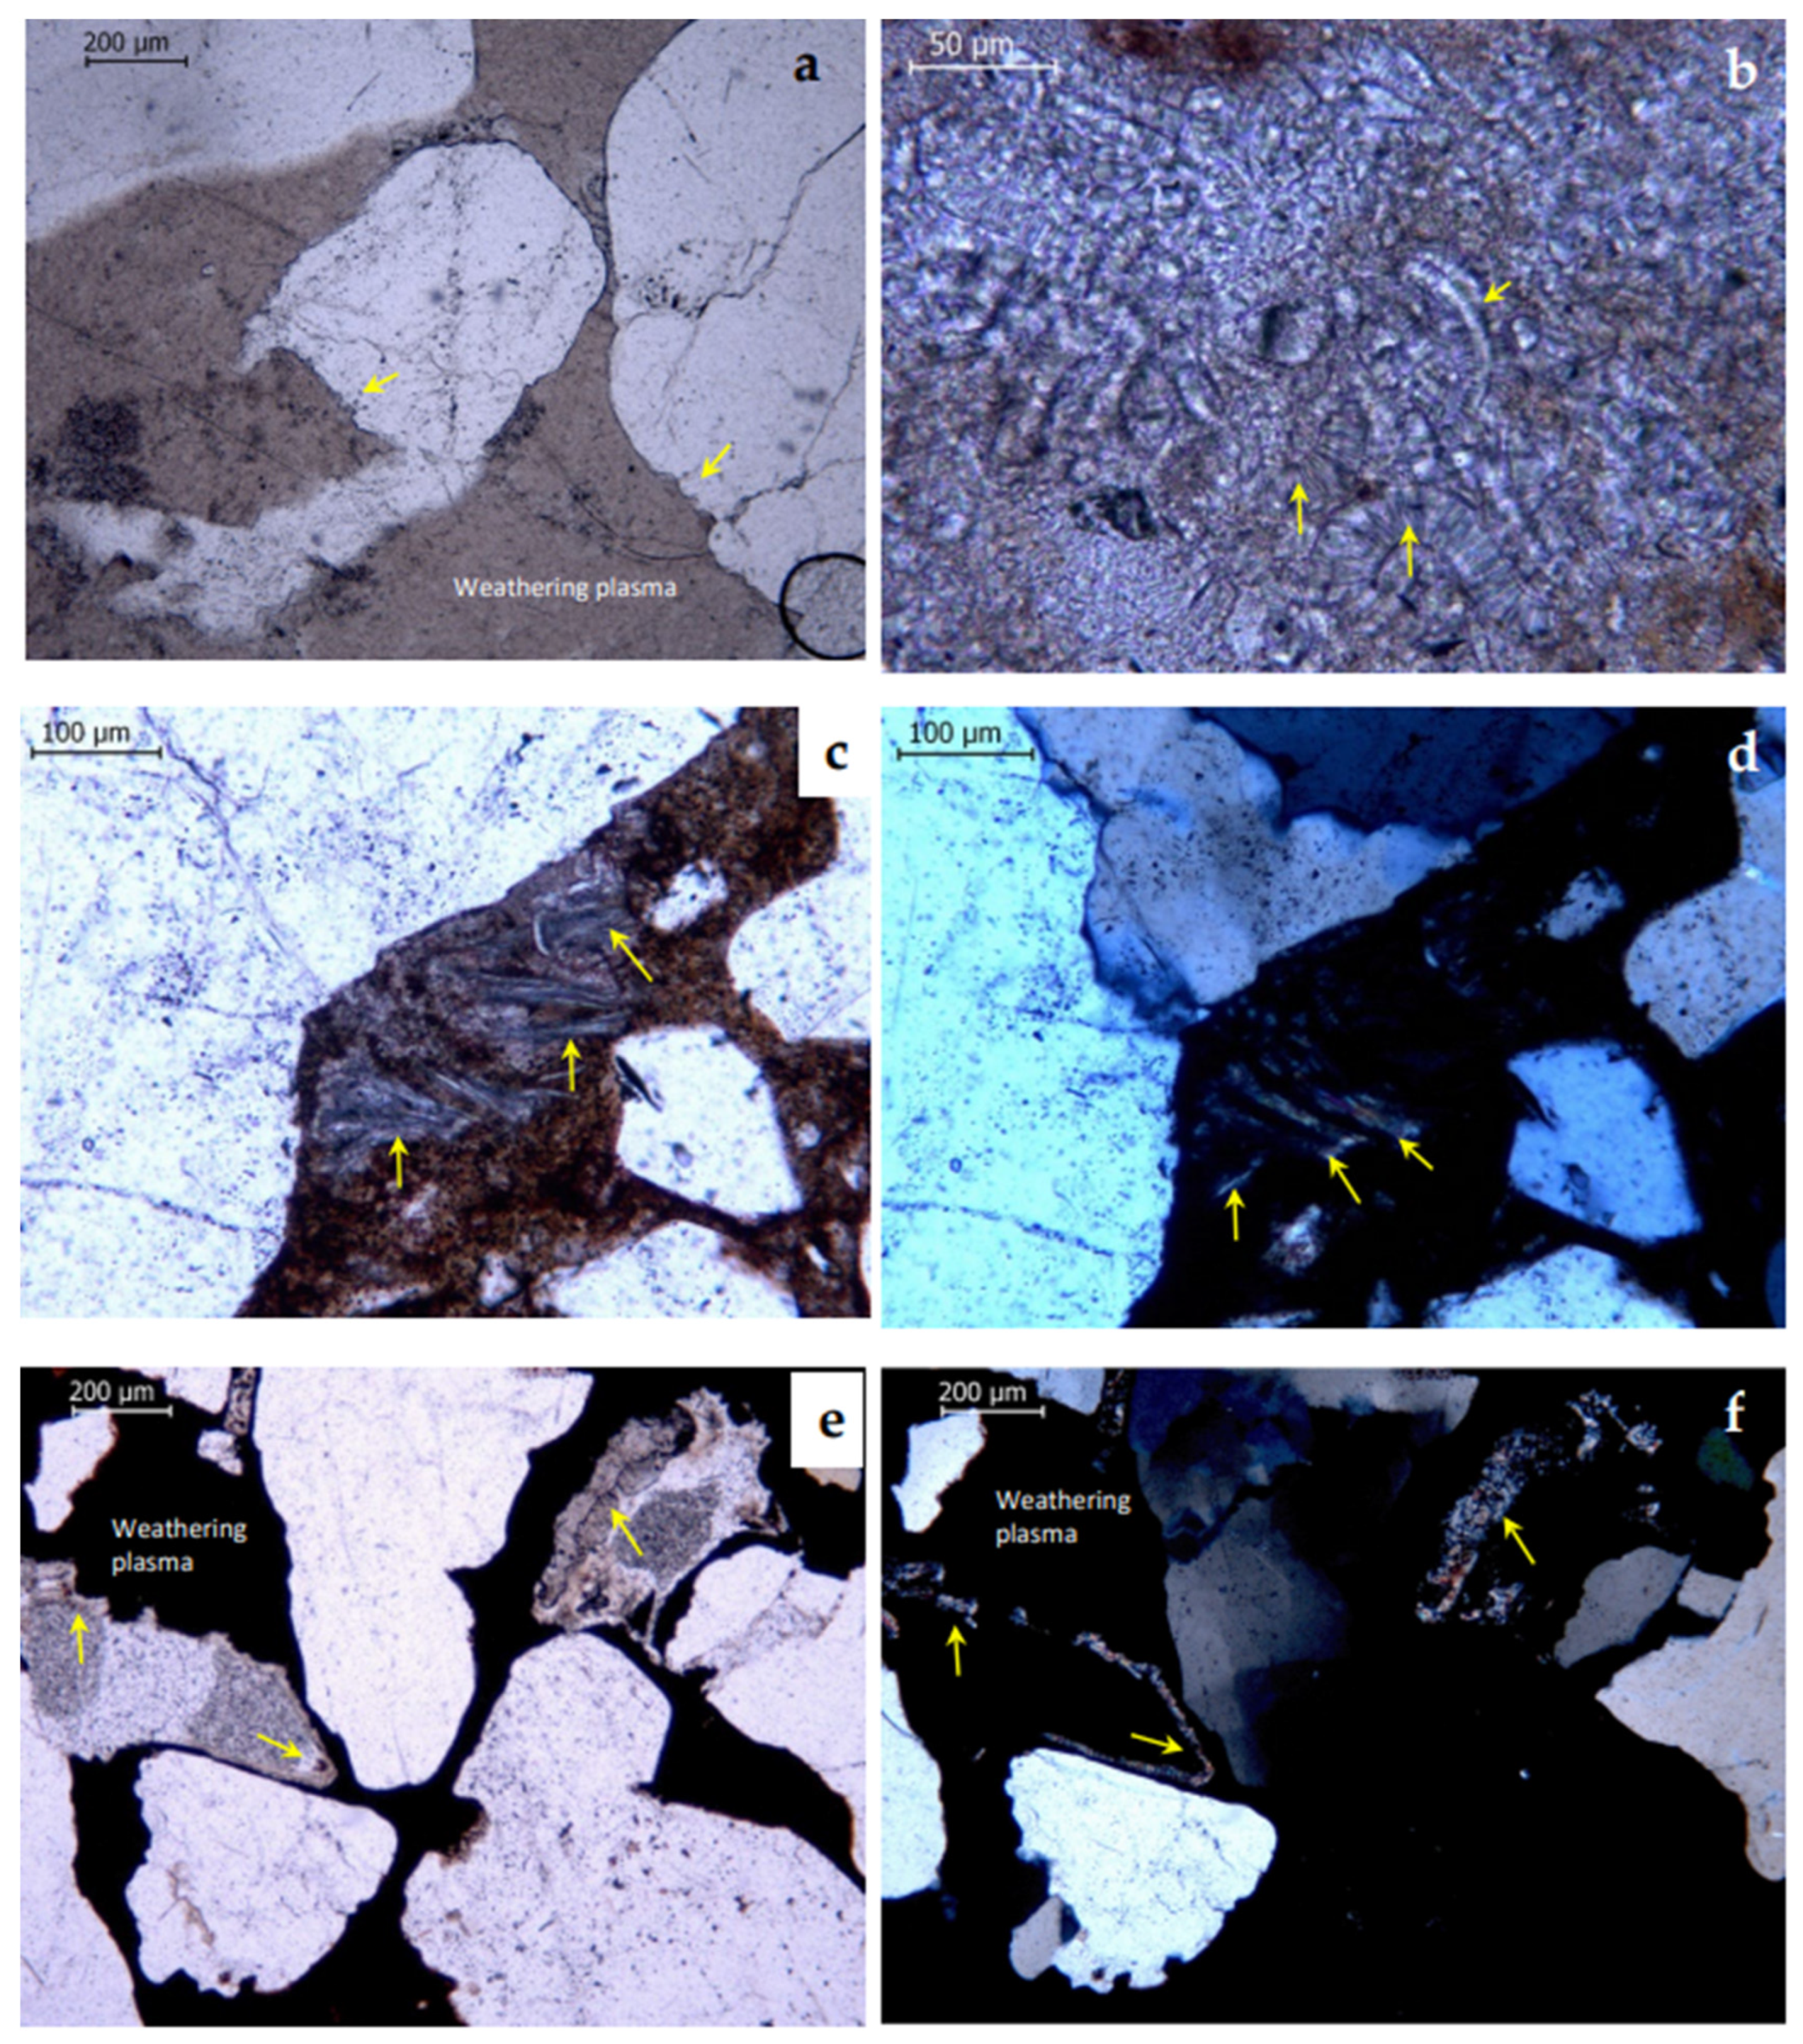
2.1. Zamora Building Stone

The Zamora building stones (silicified conglomerates and sandstones) correspond to the upper part of Salamanca Sandstone Formation (SSF). Remnants of silicifications appear in the SW border of the Tertiary Duero basin, on both the Iberian Hercynian basement deeply weathered and/or a sedimentary cover of siderolithic nature. Silicification represents an alteration of the parent minerals which gave rise to a relative concentration of silica as CT opal, a partial release of aluminum, the almost complete leaching of the other components and local concentrations of minerals of the alunite group This silicification process produces a silcrete, that is a variety of highly indurated duricrust formed as a result of the near-surface accumulation of silica within a soil, sediment, rock or weathered material [30,31,32]. The strength of the sedimentary cover increases towards the E and NE, thus separating vertically from the mantle of weathering and silicification process. According to their lithological characteristics, they are arranged in three lithostratigraphic units, the differentiating elements being the presence of iron and silica, colour and sequential organization. The upper section (Zamora building stones), presents a clearly prograding stratigraphic grain and strato-growth architecture generated by the activity of alluvial fan systems. Sedimentation took place within wide, shallow and highly mobile channels through which streams flowed with very high bottom loads and fine suspended material during a Mesozoic period [30,31,32].
This stone shows marked changes in colour due to the remobilization of iron oxyhydroxides under ancient hydromorphic and acid conditions, with local precipitation of sulphates of the allunite-jarosite group [30,31].
The Zamora building stone shows a chemical composition of the major elements with high contents in SiO2, together with the presence of Al2O3 and H2O.
In this work, four natural silicified conglomerates (Zamora building stones) from Zamora quarries (Figure 1) have been tested: Z1, white stone, microconglomerate; Z2, ochreous stone conglomerate; Z3B, white and red stone conglomerate and Z3R, purple stone conglomerate.
Figure 2 shows the most remarkable micromorphology results of the four selected varieties, following the methodology published by the authors [32,33]. In all the samples studied, quartz is the dominant mineral in the skeleton, presenting many of its grains, corrosion gulfs on their edges (Figure 2a). Likewise, more or less altered potassium feldspars, muscovites flakes with loss of interference colours (Figure 2c,d), opaque (Fe and Ti oxyhydroxides, Figure 2e), tourmalines, epidote group minerals, and few zircons may appear. The appearance of an isotropic mass quite called the weathering plasma (Figure 2a). Iron oxyhydroxides can appear attached to the 1:1 phyllosilicate (Figure 2c,d), called weathering plasma, giving ocher and/or reddish tones and it is common to find minerals such as small accordion-shaped kaolinites (1:1 phyllosilicates) that are considered neoformation (Figure 2b) By visual samples, the concentration of these iron oxyhydroxydes gives zones with shades from intense red to purple.
Study of thin samples of silicified conglomerates has been observed that: (i) the walls of some cavities appear covered by fibrous silica with their optic axes in different positions in relation to the elongation of the fibers called cutan (Figure 2e,f), and, (ii) most of the CT opal are located lining the walls of cavities (Figure 2e,f), these being interpreted as the traces of roots (bioturbation) of old palaeosols (pedogenic silcretes). In strongly silicified samples, quartz grains encompassed within a brown and more or less anisotropic mass compose of clay, iron oxyhidroxides and CT opal [30,31,32,33,34].
Table 1 shows the average results obtained from the physical properties of the four varieties of Zamora building stones, following the methodology published by the authors [35]. It is observed that the real density varies between 2.56 and 2.60 g/cm3 and the apparent density between 2.28 and 2.33 g/cm3. On the other hand, the order of the values obtained for free and total porosity, imbibition coefficient and capillary absorption and permeability in the four varieties studied is as follows: Z1 > Z2 ≈ Z3B ≈ Z3R. However, the order of values in the absorption coefficient is Z1 < Z2 ≈ Z3B ≈ Z3R.

2.2. Experimental and Statistical Methods

The durability of four Zamora building stones (ZBS) was determined by accelerated artificial ageing treatments. Two cubic samples (6 × 6 × 6 × 6 cm) were selected for each of the ZBS varieties, the chromatic coordinates of five of the faces were measured, and they were subjected to the following accelerated ageing treatments in a simulation chamber under controlled conditions. Five cycles were performed:
T1: Freez/thaw and cool/heat cycles (−20 to 110 °C) according to the following procedure: After a drying period at 60 °C to reach a constant weight, the blocks were immersed in distilled water for 16 h (the rocks were saturated), after which they were cooled to −20 °C and kept at that temperature for 3 h. The temperature was then raised to 110 °C (rate = 2 °C/min), and the blocks were kept at that temperature for 3 h. Finally, the blocks were left for 2 h at room temperature and the process was restarted [16].
T2: A combined freez/thaw treatment with sulphates crystallisation, following the method in T1 [16], but using a 14% (weight) solution of Na2SO4 × 10 H2O instead of distilled water.
T3: Same as T1 but using a 1% (weight) solution of Na3PO4 × 10 H2O instead of the distilled water [16].
Colour was measured with a MINOLTA MODEL CR-310 colourimeter for solids using the (L*,a*,b*) colour coordinates. Total colour difference (∆E*ab) defined by the equation [36,37]: ∆Eab* = [(∆L*)2 + (∆a*)2 + (∆b*)2]1/2.
To study changes in the colour, increments ∆E*, ∆L*, ∆a*, and ∆b* have been defined as the difference of the parameter values between that for the untreated sample and those of the sample after each ageing treatment.
The statistical analysis was performed using the MANOVA-Biplot technique (Multivariate Analysis of Variance). The MANOVA-Biplot is a multivariate analysis method, complementary to MANOVA which permits to obtain simultaneous plots of the different groups to be compared, and the different variables being analysed, by also involving the specific Biplot characteristics [38,39]. The results are summarised on several factorial planes, where the variables are represented as vectors that start out from a hypothetical origin and the means of the different groups as star markers in the same reference system. If two variables are represented with a very small angle, then the variables are highly correlated, and are inversely correlated if they are opposite. Additionally, if the angle is close to perpendicular, their correlation is minimal. When projecting all the star markers perpendicularly onto the directions of any of the variables, the order of the projections in the direction of those variables is equivalent to the value that the population means take on for that variable. These interpretations are subject to a series of measurements of the quality of representation for the different planes (inertia absorption of the planes, the goodness of the projections of the measurements on the variables for the dimensions selected, etc.). Depending on these qualities of representation, it is or is not possible to interpret the position of the variables (or the means of the different groups) in the corresponding factorial plane.
The MANOVA-Biplot analysis was applied to a matrix consisting of 16 variables (4 for each chromatic parameter, i.e., ∆E*, ∆L*, ∆a*, and ∆b*) and 120 rows in 12 groupings accounting for the different combinations of silicified conglomerates with the three ageing treatments applied.
The different groupings of samples were named as follows:
* Type of sample: Four types of samples tested (Z1, Z2, Z3B and Z3R).
* Artificial ageing, corresponding to aged (T1, T2 and T3).
The 12 groupings have been labelled by combining the four types of stones and the different ageing treatments: ZWTY, where W = 1, 2, 3B and 3R (type of sample), and Y = 1, 2, and 3 (type of artificial ageing treatment). The average values for ∆E*, ∆L*, ∆a*, and ∆b* for each aging cycle are included in Table 2, Table 3, Table 4 and Table 5.

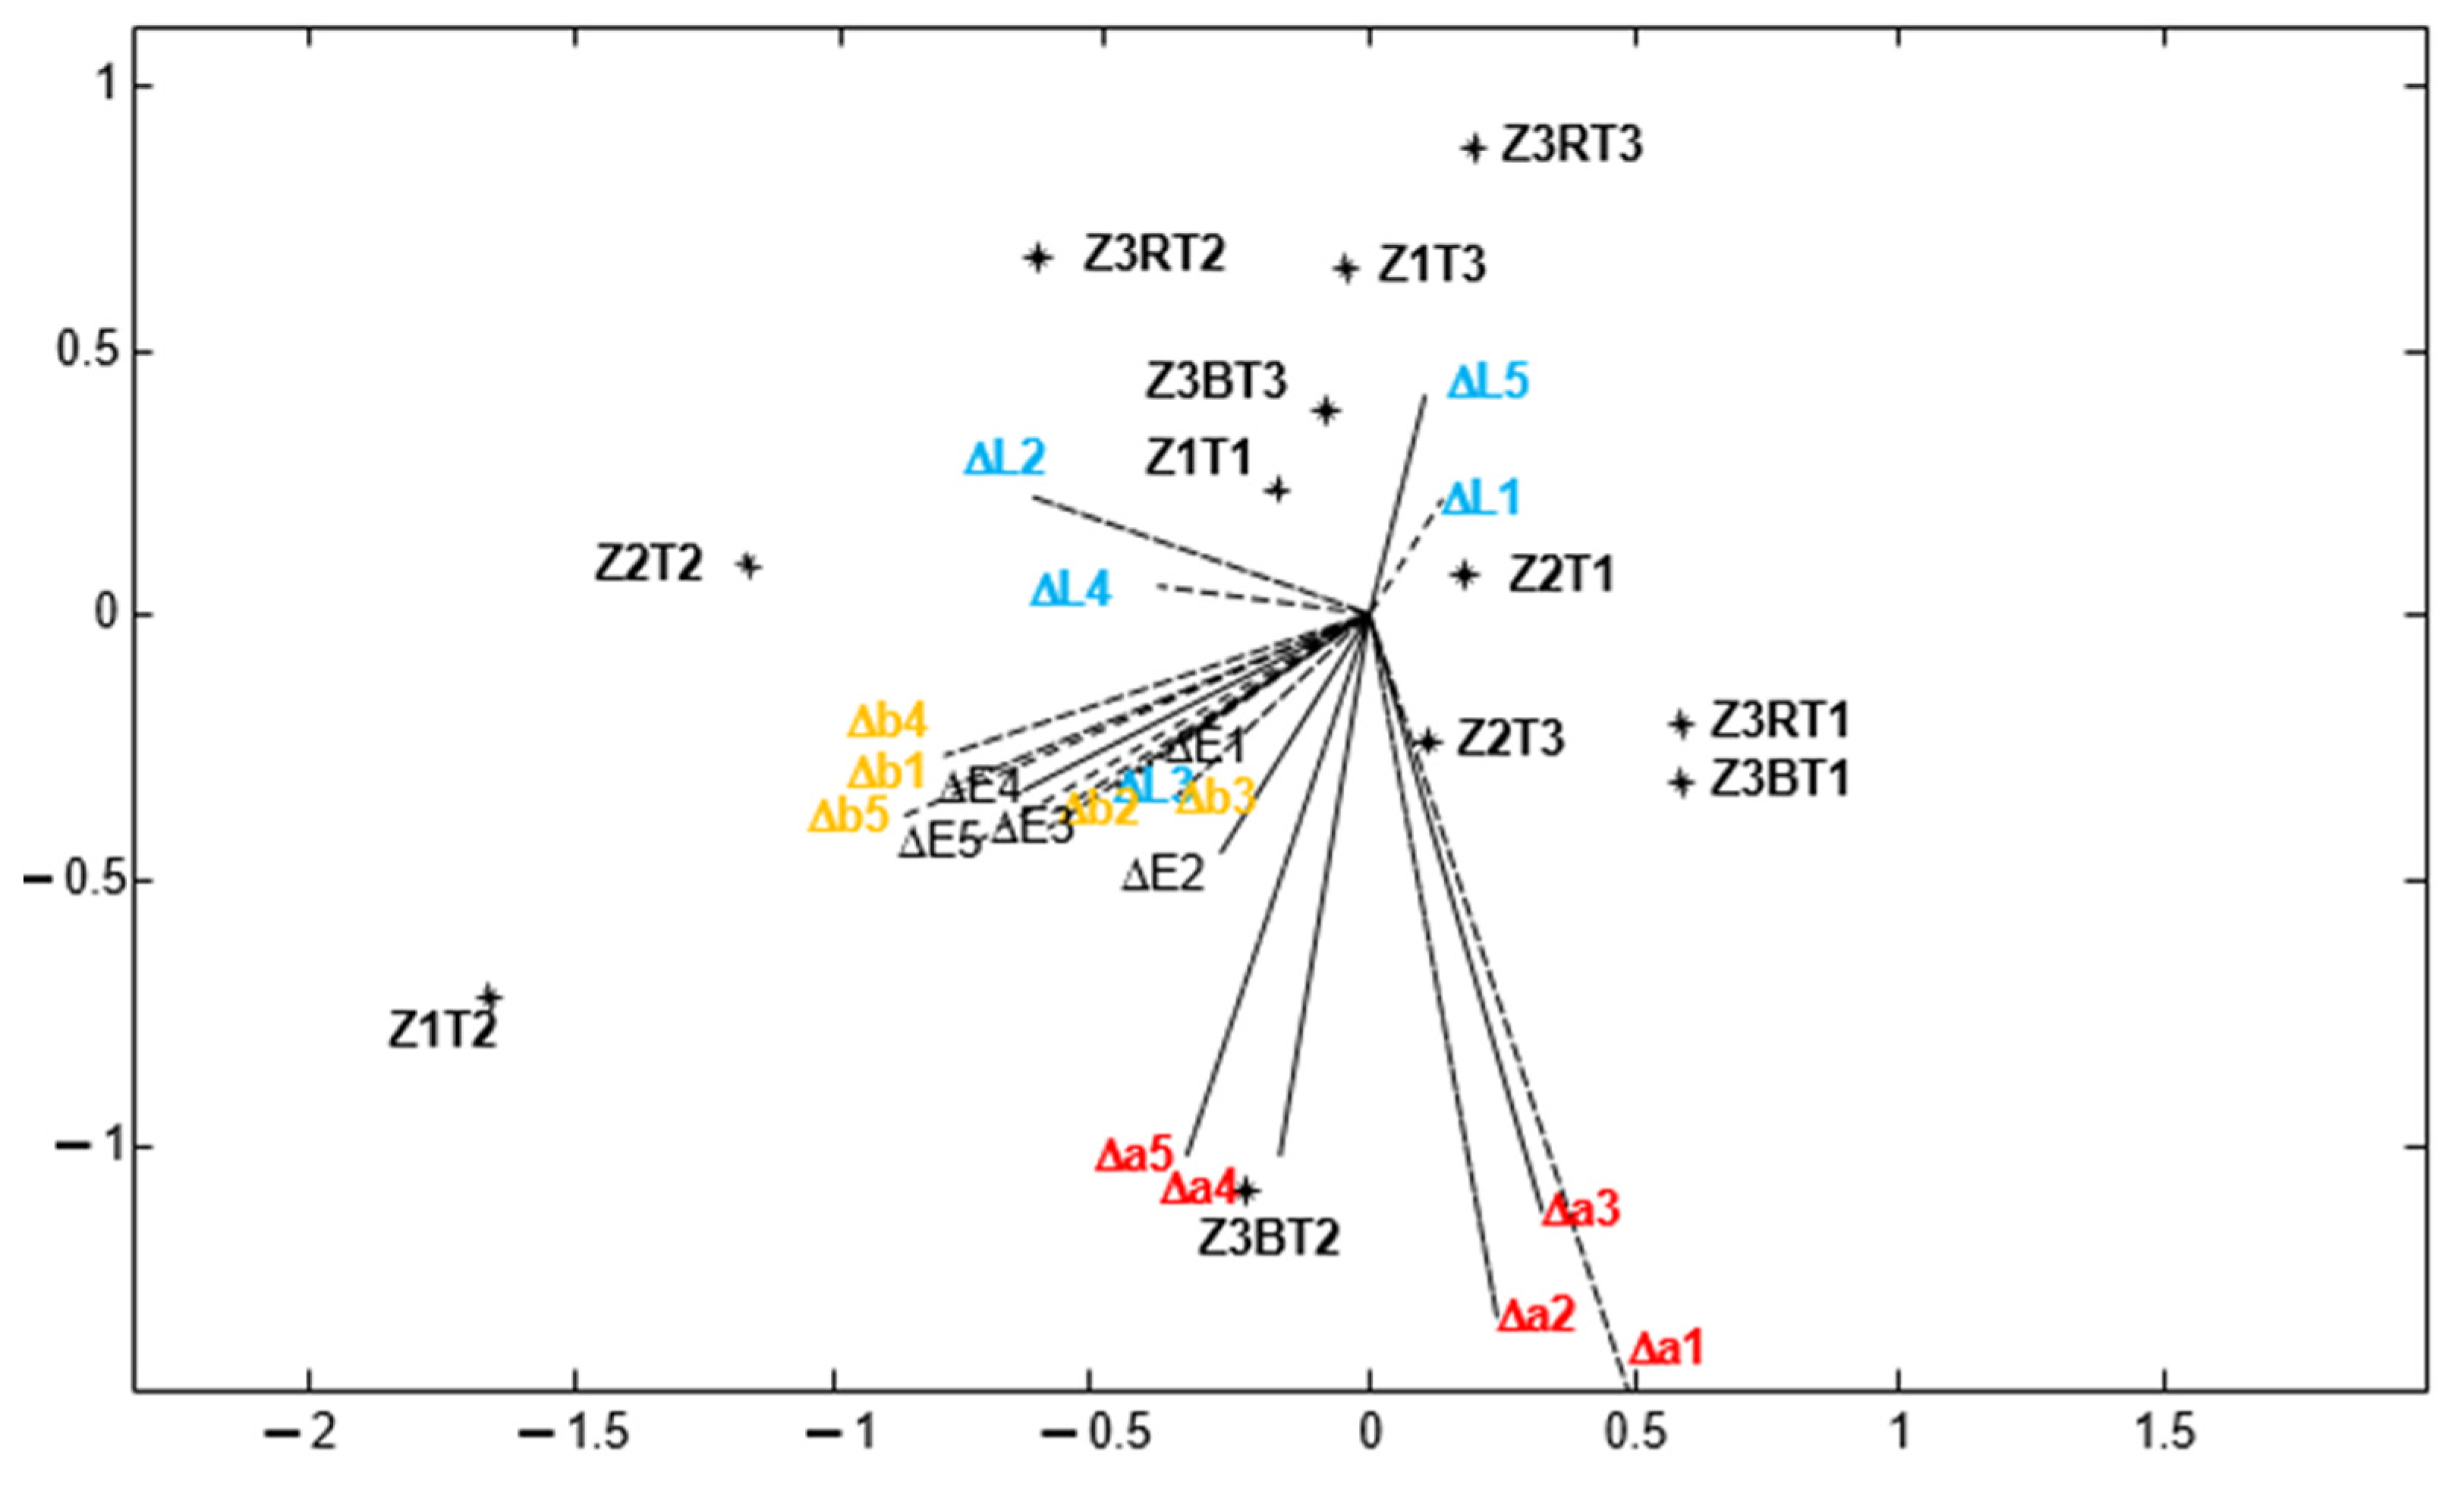
3. Results and Discussion

The global analysis of the MANOVA-Biplot provides a lambda (Wilks) value of 5.6205, with p < 0.01, indicating that significant differences among the different groupings exist. The inertia absorption of the first five factorial axes is 87.47%. The effect of artificial ageing on the global analysis of colour changes is important because great angles between the variables are observed, Figure 3 and Figure 4 (∆E*1–∆E*5, ∆L*1–∆L*5, ∆a*1–∆a*5 and ∆b*1–∆b*5).
Figure 3 shows that in Z1 silicified conglomerate, T2 ageing gives rise to higher values in ∆E* and ∆L*, bringing about to the samples greater darkness. With T3 ageing, darkening also occurs, but of lesser magnitude. Furthermore, in Z2 silicified conglomerate, T2 ageing gives rise to higher values ∆E*, compared to T1 and T3, with no differences in ∆L*. In the Z3B silicified conglomerate, T3 ageing has no variations in ∆L* or in ∆E* and in T1 and T2 ageing the effect on ∆L* is similar, these aging produce higher clarity. In the Z3R silicified conglomerate, T2 ageing produces higher values in ∆E*, with T1 and T3 exhibiting similar outcomes, but in the opposite direction. At T1 and T2 there is no variation in ∆L*, but at T3 ∆L* is higher, resulting in a darkening. In general terms, for ∆L* the order among all the ageing treatments is T2 > T3 > T1. Moreover, it is observed that the ageing test that produces the greatest variations in the different silicified conglomerates studied is T2. The Zamora building stone that suffers less variation is the Z2 silicified conglomerate and the one that suffers more variations is the Z3R silicified conglomerate.
In the plane 1–2 (Figure 3) the variables ∆a* and ∆b* have low qualities of representation, they can be interpreted in the plane 1–4 (Figure 4).
In the plane 1–4 (Figure 4), in all silicified conglomerates studied, T2 ageing gives rise to higher values in ∆b*, than T1 and T3, leading to a decrease of the b* parameter. Between T1 and T3 ageing there are no differences in ∆b* values, but the samples aged with the T3 become more reddish than those treated with T1. On the other hand, in Z1 silicified conglomerate, T2 ageing gives rise to higher ∆b* and ∆a* values, than T1 and T3, thus giving rise to samples with less reddeningness and yellowing. The order among all ageing treatments would be T2 > T3 ≈ T1. In the Z2 silicified conglomerate, T2 ageing gives rise to higher ∆b* values compared to T1 and T3, giving rise to less yellowish samples, with no great differences in ∆a* between the three ageing treatments. In the Z3B silicified conglomerate, the T2 ageing produces higher in ∆a* and ∆b* values compared to T1 and T3. The order of the ∆a* values, among all ageing treatments would be T2 > T1 > T3, while for ∆b* the order would be T2 > T3 ≈ T1. In the Z3R silicified conglomerate, the T2 ageing produces higher values in ∆b* than T1 and T3, giving rise to less yellow samples, while the variable ∆a* has higher values at T3 and T2, but with a more reddish colour. This same figure also shows that the ageing that produces the greatest variations in the different silicified conglomerates studied is T2. The Zamora building stone that suffers the least variations is Z2 and the one that suffers the most variations is Z3R.
All these data indicate that the samples treated by a combined freezing/thawing and cooling/heating treatments with sulphates crystallisation (T2 ageing) undergo larger colour changes than with the other artificial ageings T1 (freezing/thawing and cooling/heating) and T3 (freezing/thawing treatment with phosphates crystallisation), due to the T2 ageing is the most aggressive of the three artificial ageings tested [6]. Furthermore, the increase in volume of sulphates (haloclasty process) when crystallising from solutions that contain them is greater than in the case of water (gelifraction process) and phosphates (haloclasty process), respectively.
Sulphate crystallisation produces the complete arenisation of almost all the cubic samples in the fifth cycle, but this does not happen for the other ageing treatments. The T2 treatment accelerates the changes in colour on the surface of Z1, Z3B and Z3R stones, because it develops a larger diameter size porosity which can be partly filled up by sulphates. All this due to successive crystallisation/dissolution processes of these salts in each of the cycles performed.
The effect of the T1 artificial ageing cycles (freezing/thawing and cooling/heating) on the chromatic parameters is very weak, as already reported by [2,20].

4. Conclusions

Changes in colour can determine the trends of the different groupings according to the positions from the variables in each artificial ageing cycle.
A significant interaction has been found between some of the groupings, due to T2 artificial ageing (a combined freezing/thawing and thermoclasty treatment with sulphate crystallisation), although some sort of interaction has also been observed in T1 and T3 artificial ageing.
The overall effect of T1, T2 and T3 ageings on the four Zamora building stones turned them darker and with less yellowing for most of the samples studied.The changes produced in ∆E*, ∆L*, ∆a* and ∆b* depend on the type of building stone variety, the ochreous stone suffered the least variation and the purple stone the most. There are following variations according to accelerated ageing tests:
(a)
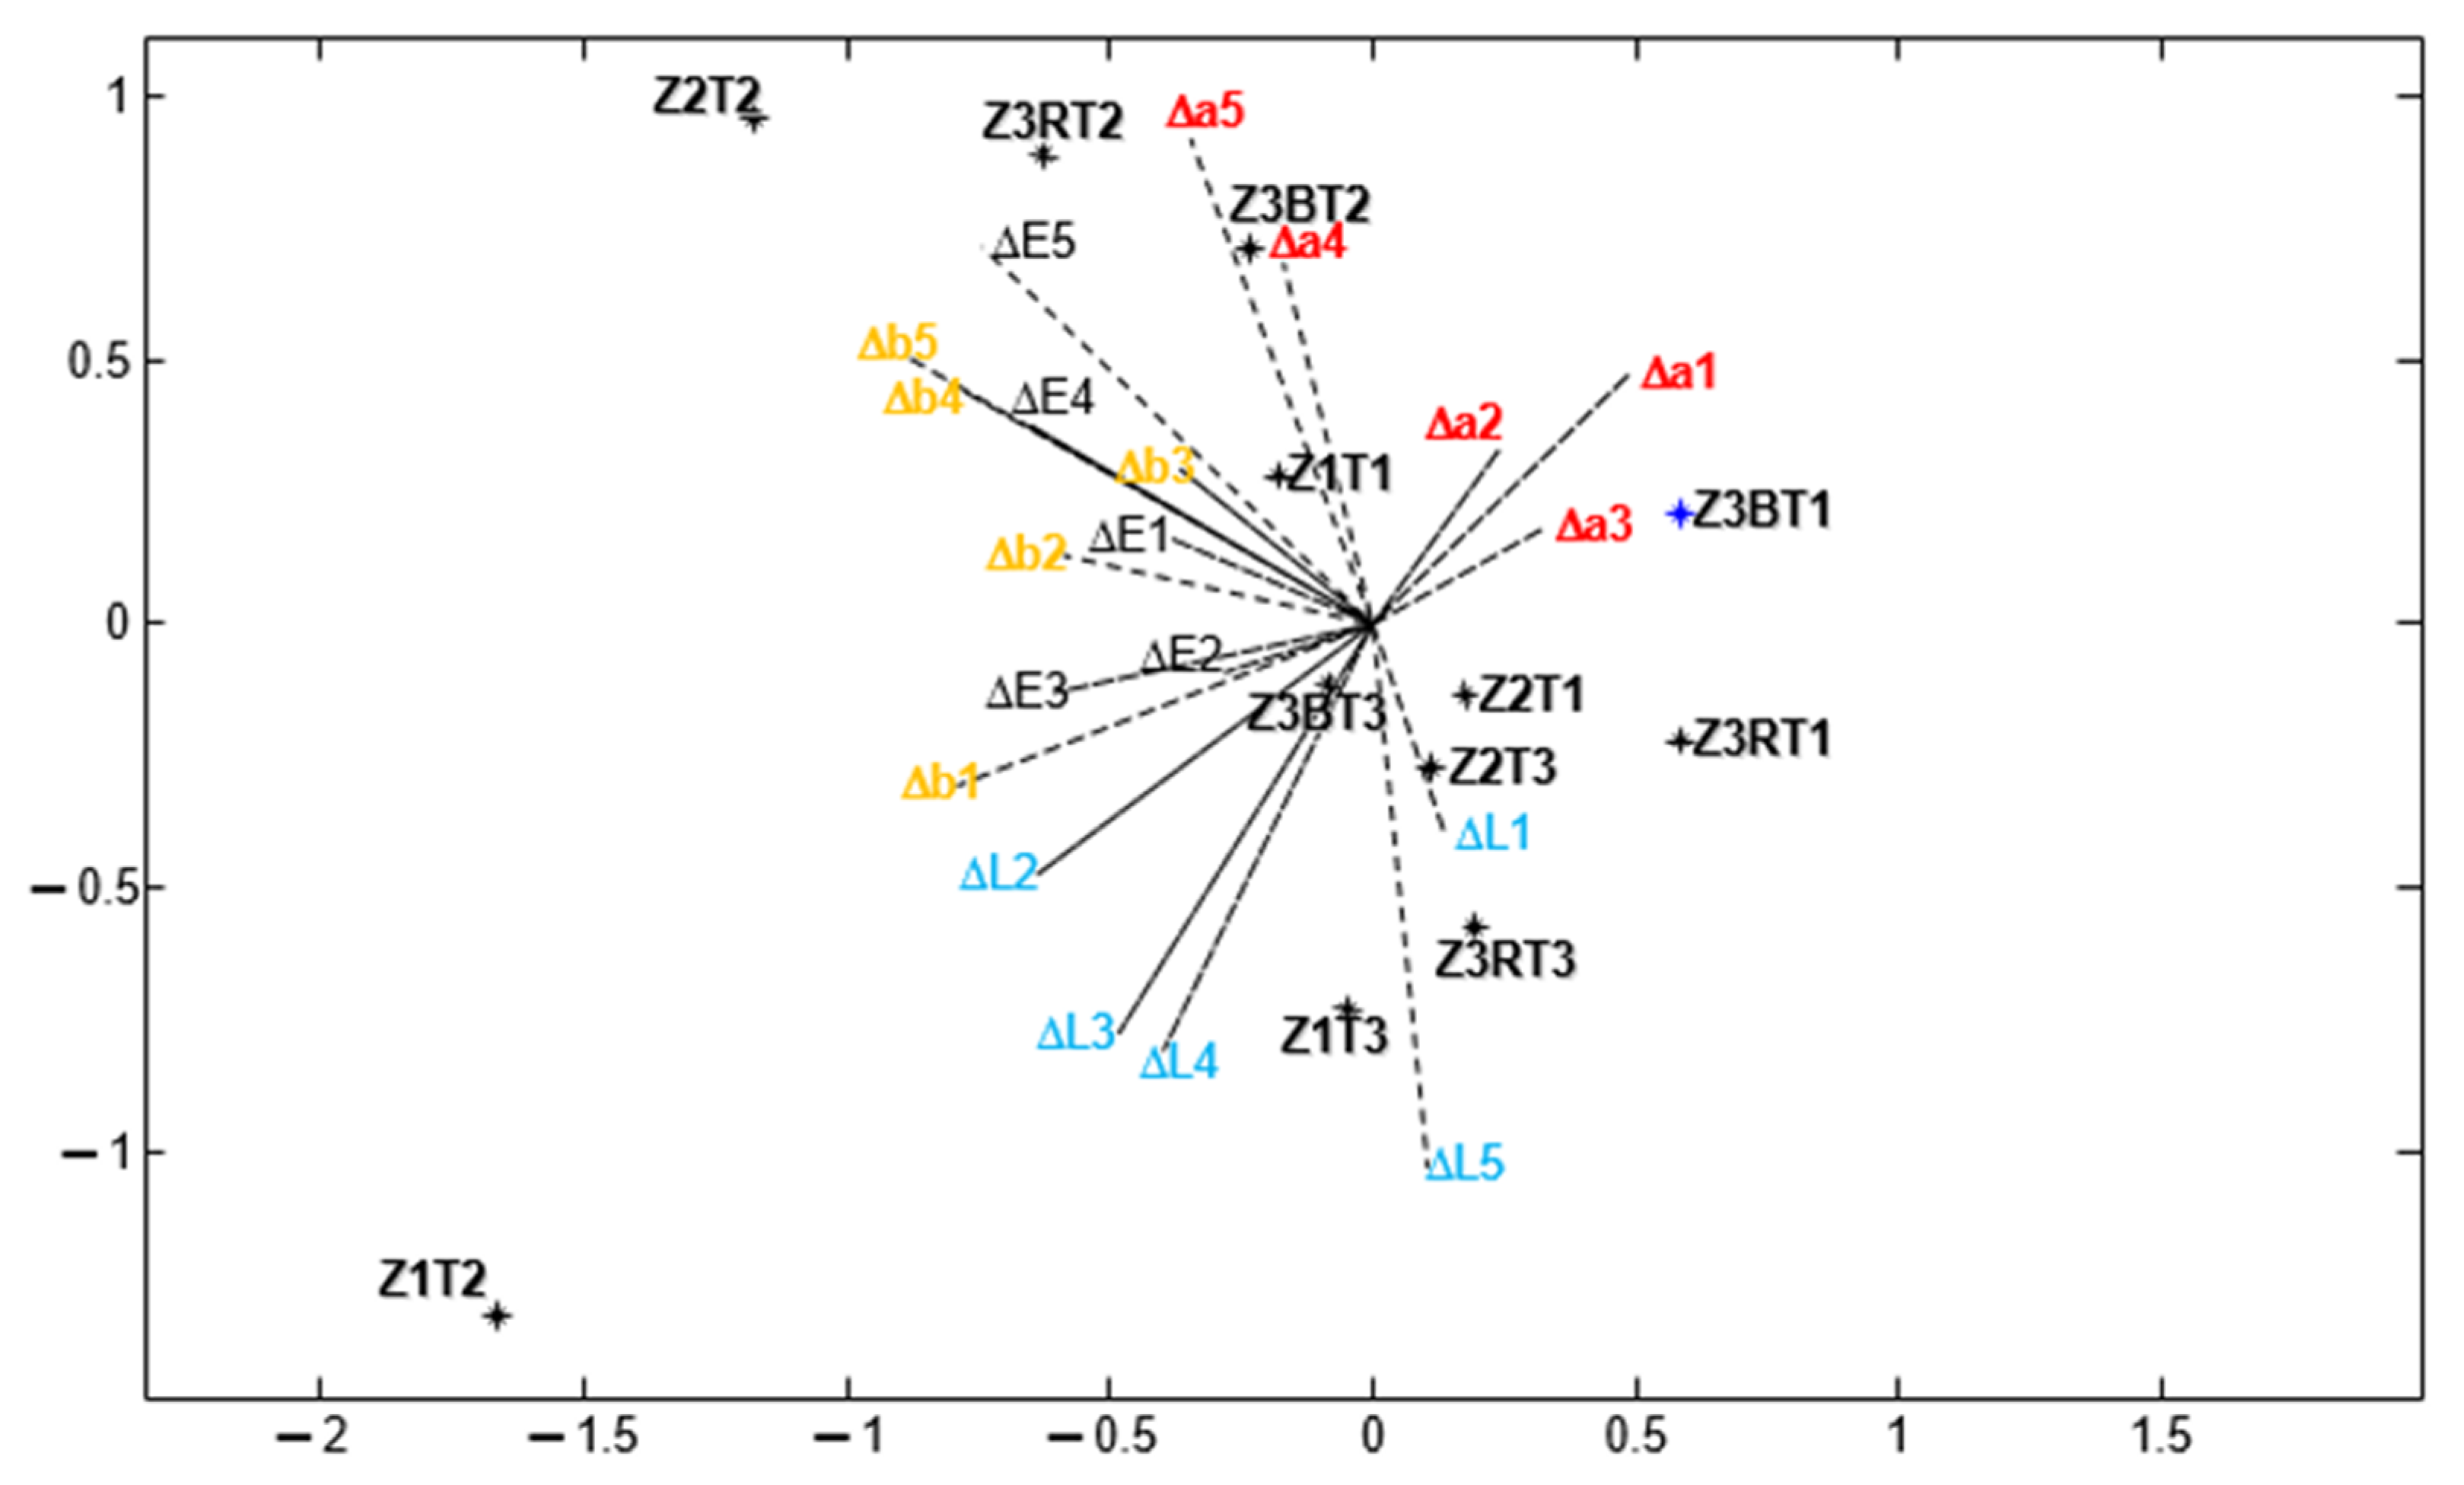
Z1: ∆E* (T2 > T1 ≈ T3), ∆L* (T2 > T3 > T1), ∆a* and ∆b* (T2 > T1 ≈ T3)
(b)
Z2: ∆E* (T2 > T1 ≈ T3) and ∆b* (T2 > T1 ≈ T3)
(c)
Z3B: ∆L* (T2 ≈ T1 > T3), ∆a* (T2 > T1 > T3) and ∆b* (T2 > T1 ≈ T3)
(d)
Z3R: ∆E* (T2 > T1 ≈ T3), ∆L* (there are only differences in T3), ∆a* (T2 ≈ T3 > T1) and ∆b* (T2 > T1 ≈ T3).
This study of the colour by statistical analyse may be of interest for the evaluation and monitoring of stone decay, which is an inexpensive, simple, easy and non-destructive technique.

Author Contributions

Conceptualization, J.G.-T. and A.C.I.; methodology, J.G.-T. and A.C.I.; software, J.G.-T. and A.C.I.; validation, J.G.-T. and A.C.I.; formal analysis, J.G.-T. and A.C.I.; investigation, J.G.-T. and A.C.I.; resources, J.G.-T. and A.C.I.; data curation, J.G.-T., A.C.I. and R.S.; writing—original draft preparation, J.G.-T. and A.C.I.; writing—review and editing, J.G.-T. and A.C.I.; visualization, J.G.-T. and A.C.I.; supervision, J.G.-T. and A.C.I.; project administration, E.A., J.G.-T. and A.C.I.; funding acquisition, E.A. and J.G.-T. All authors have read and agreed to the published version of the manuscript.

Funding

This research was funded by the Ministry of Science, Innovation and Universities (PGC2018-098151-B-I00).

Data Availability Statement

Not Applicable.

Acknowledgments

Authors are grateful for financial support for this work from the Ministry of Science, Innovation and Universities (PGC2018-098151-B-I00) and Project “CLU-2019-05—IRNASA/CSIC Unit of Excellence”. The authors want to express their gratitude in collaborating with this paper, in the Special Issue of the ChemEngineering in honor of Vicente Rives.

Conflicts of Interest

The authors declare no conflict of Interest.

References

  1. García-Talegón, J.; Iñigo, A.C.; Alonso-Gavilán, G.; Vicente-Tavera, S. Villamayor Stone (Golden Stone) as a Global Heritage Stone Resource from Salamanca (NW of Spain). Geol. Soc. Lond. 2015, 407, 109–120. [Google Scholar] [CrossRef] [Green Version]
  2. García-Talegon, J.; Vicente, M.A.; Vicente-Tavera, S.; Molina-Ballesteros, E. Assessment of chromatic changes due to artificial ageing and/or conservation treatments of sandstones. Color Res. Appl. 1998, 23, 46–51. [Google Scholar] [CrossRef]
  3. Occhipinti, R.; Stroscio, A.; Belfiore, C.M.; Barone, G.; Mazzoleni, P. Chemical and colorimetric analysis for the characterization of degradation forms and surface colour modification of building stone materials. Constr. Build. Mater. 2021, 302, 124356. [Google Scholar] [CrossRef]
  4. Rives, V.; Talegon, J.G. Decay and Conservation of Building Stones on Cultural Heritage Monuments. Mater. Sci. Forum 2006, 514–516, 1689–1694. [Google Scholar] [CrossRef]
  5. Iñigo, A.C.; Rives, V.; Vicente, M.A. Reproducción en cámara climática de las formas de alteración más frecuentes detectadas en materiales graníticos, en clima de tendencia continental. Mater. Construcc. 2000, 50, 57–60. [Google Scholar] [CrossRef]
  6. Iñigo, A.C.; Vicente-Tavera, S. Different degrees of stone decay on the inner and outer walls of a Cloister. Build Environ. 2001, 36, 911–917. [Google Scholar] [CrossRef]
  7. Iñigo, A.C.; Vicente-Tavera, S. Surface-inside (10 cm) thermal gradients in granitic rocks: Effect of environmental conditions. Build. Environ. 2002, 37, 101–108. [Google Scholar] [CrossRef]
  8. Iñigo, A.; García-Talegón, J.; Vicente-Palacios, V.; Vicente-Tavera, S. Canonical Biplot as a tool to detect microclimates in the inner and outer parts of El Salvador Church in Seville, Spain. Measurement 2019, 136, 745–760. [Google Scholar] [CrossRef]
  9. García-Talegón, J.; Vicente, M.A.; Molina, E. Decay of granite monuments due to salt crystallization in a non-polluted urban environment. Mater. Construcc. 1999, 49, 17–27. [Google Scholar] [CrossRef] [Green Version]
  10. Fort, R.; López-de Azcona, M.C.; Mingarro, F. Assessment of protective treatments based on their chromatic evolution: Limestone and granite in the Royal Palace of Madrid, Spain. In 5th International Symposium on the Conservation of Monuments in the Mediterranean Basin; Galán, E., Zezza, F., Eds.; Swets & Zeitlinger B.V.: Lisse, The Netherlands, 2002; pp. 437–441. [Google Scholar]
  11. Carmona-Quiroga, P.; Martinez-Ramirez, S.; de Rojas, M.S.; Blanco-Varela, M.T. Surface water repellent-mediated change in lime mortar colour and gloss. Constr. Build. Mater. 2010, 24, 2188–2193. [Google Scholar] [CrossRef]
  12. García, O.; Rz-Maribona, I.; Gardei, A.; Riedl, M.; Vanhellemont, Y.; Santarelli, M.L.; Strupi-Suput, J. Comparative study of the variation of the hydric properties and aspect of natural stone and brick after the application of 4 types of anti-graffiti. Mater. Construcc. 2010, 60, 68–82. [Google Scholar]
  13. Rivas, T.; Iglesias, J.; Taboada, J.; Vilán, J.A. Sulphide oxidation in ornamental slates: Protective treatment with siloxanes. Mater. Construcc. 2011, 61, 115–130. [Google Scholar] [CrossRef] [Green Version]
  14. La Russa, M.F.; Barone, G.; Belfiore, C.M.; Mazzoleni, P.; Pezzino, A. Application of protective products to “Noto” calcarenite (south-eastern Sicily): A case study for the conservation of stone materials. Environ. Earth Sci. 2011, 62, 1263–1272. [Google Scholar] [CrossRef]
  15. Pelin, V.; Sandu, I.; Gurlui, S.; Brânzilă, M.; Vasilache, V.; Borş, E.; Sandu, I.G. Preliminary investigation of various old geomaterials treated with hydrophobic pellicle. Color Res. Appl. 2016, 41, 317–320. [Google Scholar] [CrossRef]
  16. Iñigo, A.C.; García-Talegón, J.; Vicente-Palacios, V.; Vicente-Tavera, S. Measuring the Effectiveness and Durability of Silicified Sandstones and Conglomerates from Zamora, Spain Subject to Silico-organic Treatments and/or Freezing/Thawing Processes. Rock Mech. Rock Eng. 2021, 54, 2697–2705. [Google Scholar] [CrossRef]
  17. Grossi, C.M.; Brimblecombe, P.; Esbert, R.M.; Alonso, F.J. Color changes in architectural limestones from pollution and cleaning. Color Res. Appl. 2007, 32, 320–331. [Google Scholar] [CrossRef]
  18. Alonso, F.J.; Vázquez, P.; Esbert, R.M.; Ordaz, J. Ornamental granite durability: Evaluation of damage caused by salt crystallization test. Mat. Construcc. 2008, 58, 191–201. [Google Scholar]
  19. Rivas, T.; Prieto, B.; Silva, B. Artificial weathering of granite. Mater. Construcc. 2008, 58, 179–189. [Google Scholar]
  20. Vazquez, P.; Luque, A.; Alonso, F.J.; Grossi, C.M. Surface changes on crystalline stones due to salt crystallisation. Environ. Earth Sci. 2013, 69, 1237–1248. [Google Scholar] [CrossRef]
  21. Iñigo, A.C.; García-Talegón, J.; Vicente-Tavera, S. Canonical biplot statistical analysis to detect the magnitude of the effects of phosphates crystallization aging on the color in siliceous conglomerates. Color Res. Appl. 2014, 39, 82–87. [Google Scholar] [CrossRef]
  22. Aly, N.; Gomez-Heras, M.; Hamed, A.; De Buergo, M.; Soliman, F. The influence of temperature in a capillary imbibition salt weathering simulation test on Mokattam limestone. Mater. Construcc. 2015, 65, e044. [Google Scholar] [CrossRef] [Green Version]
  23. Navarro, R.; Catarino, L.; Pereira, D.; de Sá Campos Gil, F.P. Effect of UV radiation on chromatic parameters in serpentinites used as dimension stones. Bull. Eng. Geol. Environ. 2019, 78, 5345–5355. [Google Scholar] [CrossRef]
  24. Martin, J.; Feliu, M.J.; Edreira, M.C.; Villena, A.; Calleja, S.; Pérez, F.; Barros, J.R.; Ortega, P. The original colour of the building facades from “El Pópulo” an old quarter of Cádiz. In 5th International Symposium on the Conservation of Monuments in the Mediterranean Basin; Galan, E., Zezza, F., Eds.; Swets & Zeitlinger B.V.: Lisse, The Netherlands, 2002; pp. 649–653. [Google Scholar]
  25. Zezza, F. Non-destructive technique for the assessment of the deterioration processes of prehistoric rock art in karstic caves: The paleolithic paintings of Altamira (Spain). In 5th International Symposium on the Conservation of Monuments in the Mediterranean Basin; Galan, E., Zezza, F., Eds.; Swets & Zeitlinger B.V.: Lisse, The Netherlands, 2002; pp. 377–388. [Google Scholar]
  26. Zezza, F. Inland dispersion of marine spray and its effects on monument stone. In 5th International Symposium on the Conservation of Monuments in the Mediterranean Basin; Galán, E., Zezza, F., Eds.; Swets & Zeitlinger B.V.: Lisse, The Netherlands, 2002; pp. 23–39. [Google Scholar]
  27. Grossi, C.M.; Brimblecombe, P. Past and future colouring patterns of historic stone buildings. Mater. Construcc. 2008, 58, 143–160. [Google Scholar]
  28. Aparecida-del Lama, E.; Kazumi-Dehira, L.; Grossi, D.; Kuzmickas, L. The colour of the granite that built the city of São Paulo, Brazil. Color Res. Appl. 2015, 41, 241–245. [Google Scholar] [CrossRef]
  29. Pelin, V.; Rusu, O.; Sandu, I.; Vasilache, V.; Gurlui, S.; Sandu, A.V.; Cazacu, M.M.; Sandu, I.G. Approaching on Colorimetric Change of Porous Calcareous Rocks Exposed in Urban Environmental Conditions from Iasi–Romania. IOP Conf. Ser. Mater. Sci. Eng. 2017, 209, 012080. [Google Scholar] [CrossRef]
  30. García-Talegón, J.; Iñigo, A.C.; Vicente-Tavera, S.; Molina-Ballesteros, E. Silicified Granites (Bleeding Stone and Ochre Granite) as Global Heritage Stones Resources from Avila (Central of Spain). Geosci. Can. 2016, 43, 53–62. [Google Scholar] [CrossRef] [Green Version]
  31. García Talegón, J.; Molina, E.; Vicente, M.A. Nature and characteristics of 1:1 phyllosilicates from weathered granite. Central Spain. Clay Miner. 1994, 29, 727–734. [Google Scholar]
  32. Thiry, M.; Milnes, A.R.; Rayot, V.; Simon-Coinçon, R. Interpretation of palaeoweathering features and successive silicifications in the Tertiary regolith of inland Australia. J. Geol. Soc. Lond. 2006, 163, 723–736. [Google Scholar] [CrossRef]
  33. Delvigne, J.E. Atlas of micromorphology of mineral alteration and weathering. Mineral. Mag. 1998, 64, 369–370. [Google Scholar]
  34. Bauluz, B.; Mayayo, M.J.; Yuste, A.; López, J.M.G. Genesis of kaolinite from Albian sedimentary deposits of the Iberian Range (NE Spain): Analysis by XRD, SEM and TEM. Clay Miner. 2008, 43, 459–475. [Google Scholar] [CrossRef]
  35. Iñigo, A.C.; Supit, J.F.; Prieto, O.; Rives, V. Change in Microporosity of Granitic Building Stones upon Consolidation Treatments. J. Mater. Civ. Eng. 2007, 19, 437–440. [Google Scholar] [CrossRef]
  36. Robertson, A.R. The CIE 1976 Color-Difference Formulae. Color Res. Appl. 1977, 2, 7–11. [Google Scholar] [CrossRef]
  37. Sève, R. New formula for the computation of CIE 1976 Hue difference. Color Res. Appl. 1991, 16, 217–218. [Google Scholar] [CrossRef]
  38. Amaro, I.R.; Vicente-Villardón, J.L.; Galindo-Villardón, M.P. MANOVA Biplot para arreglos de tratamientos con dos factores basado en modelos lineales generales multivariantes. Interciencia 2004, 29, 26–32. [Google Scholar]
  39. Vicente-Villardón, J.L. MULTBIPLOT: Multivariate Analysis Using Biplots. 2016. Available online: http://biplot.usal.es (accessed on 31 March 2016).
Figure 1. Macroscopic view of the Zamora Building Stones. (Z1) white stone, silicified microconglomerate. (Z2) ochreous stone, silicified conglomerate. (Z3B) white and red stone, silicified conglomerate. (Z3R) purple stone, silicified conglomerate.
Chemengineering 06 00061 g001
Figure 2. (a) Natural Light (NL) microphotograph. Skeleton of polycrystalline quartz grains (yellow arrows) with corrosion gulfs set in a weathering plasma of CT opal and 1:1 phyllosilicate (birefringent, silcretes); (b) Microphotograph (NL). Small accordion-shaped kaolinites (1:1 phyllosilicates of neoformation(yellow arrows); (c) Microphotograph (NL) and (d) microphotograph (crossed nicols, CN) of muscovites flakes with loss of interference colour (yellow arrows); (e) Microphotograph (NL) and (f) microphotograph (CN) of isotropic mass called weathering plasma formed by CT opal and iron oxyhydroxides (which gives a purple hue to the Zamora building stone), in addition, the partial filling of the porous system (cutan, to designate a modification of the texture, structure or fabric at natual surfaces in soil materials, due to concentration of particular soil constituents or in situ modification of the plasma) by fibrous silica or CT opal (yellow arrows), which have originated by traces of roots (bioturbation) in the tropical palaeosoil (pedogenic silcretes).
Chemengineering 06 00061 g002
Figure 3. MANOVA-Biplot representation of the different Zamora building stones studied on the plane 1–2.
Chemengineering 06 00061 g003
Figure 4. MANOVA-Biplot representation of the different Zamora building stones studied on the plane 1–4.
Chemengineering 06 00061 g004
Table 1. Physical characterisation of Zamora building stones by water.
SamplesFP (%)TP (%)AC (%)RD (g/cm3)AD (g/cm3)IC (%)CAC (g/cm2S½)P (Kg/m2s)
Z111.714.3822.572.285.40.0010750.000221
Z29.610.1952.602.333.80.0008440.000195
Z3B8.79.2952.572.334.20.0009270.000179
Z3R9.19.2992.562.333.70.0008660.000164
FP = Free porosity, TP = Total porosity, AC = Absorption coefficient, RD = Reel density, AD = Apparent density,.IC = Imbibition coefficient, CAC = Capillary adsorption coefficient, P = Permeability.
Table 2. Average values for ∆E* for every ageing treatment cycles.
Sample and Treatment∆E1*∆E2*∆E3*∆E4*∆E5*
Mean(S.E.)Mean(S.E.)Mean(S.E.)Mean(S.E.)Mean(S.E.)
Z1, T10.5050.1330.6570.1750.9180.1721.1990.1941.0110.198
Z1, T21.0320.1971.0540.1931.8360.2481.4750.2721.3160.185
Z1, T30.6430.2360.8350.2960.9620.3290.7210.3490.9140.208
Z2, T10.4100.0650.5950.1010.6280.1070.7430.1480.6910.123
Z2, T20.5390.0610.6230.1130.9480.1021.5330.1552.0790.607
Z2, T30.5490.2280.6210.1790.8310.2670.7940.2990.8180.266
Z3B, T10.6530.0650.6940.0720.8350.0900.9530.0860.8210.083
Z3B, T21.1890.1281.1810.1671.2280.2421.3170.1782.4230.279
Z3B, T30.6950.1690.5480.1660.8910.2780.6400.2300.7600.135
Z3R, T10.6660.0610.5770.0650.8540.1490.6210.0960.6950.077
Z3R, T21.3770.1300.6210.0811.2510.1491.0920.1011.6870.066
Z3R, T30.7350.1540.6450.1930.6180.1770.6550.1520.7250.132
S.E. = Standard Error.
Table 3. Average values for ∆L* for every ageing treatment cycles.
Sample and Treatment∆L1*∆L2*∆L3*∆L4*∆L5*
Mean(S.E.)Mean(S.E.)Mean(S.E.)Mean(S.E.)Mean(S.E.)
Z1, T1−0.2950.098−0.4090.118−0.7030.124−0.8920.123−0.7030.094
Z1, T2−0.5870.2240.3750.3190.9140.6600.3760.444−0.0050.211
Z1, T3−0.3460.219−0.3940.303−0.5880.332−0.4450.309−0.4280.261
Z2, T1−0.3240.061−0.3970.102−0.5280.101−0.5060.124−0.4820.108
Z2, T2−0.3290.093−0.0060.026−0.5490.114−0.5690.097−1.0170.570
Z2, T3−0.0820.253−0.0200.263−0.2650.358−0.1010.355−0.1540.318
Z3B, T1−0.5340.090−0.6140.092−0.6730.125−0.8280.088−0.6980.104
Z3B, T2−1.0280.181−0.9320.183−0.7510.310−0.9720.170−2.1770.280
Z3B, T3−0.6100.195−0.4490.132−0.7630.260−0.5020.168−0.6760.123
Z3R, T1−0.5800.080−0.5160.082−0.6160.116−0.5340.085−0.5730.083
Z3R, T2−1.3100.128−0.3320.166−0.9830.286−0.5730.220−1.3470.191
Z3R, T3−0.4200.236−0.1770.294−0.1890.288−0.1510.279−0.1610.263
S.E. = Standard Error.
Table 4. Average values for ∆a* for every ageing treatment cycles.
Sample and Treatment∆a1*∆a2*∆a3*∆a4*∆a5*
Mean(S.E.)Mean(S.E.)Mean(S.E.)Mean(S.E.)Mean(S.E.)
Z1, T10.0000.0190.0960.0240.2510.0270.3260.0300.1660.026
Z1, T2−0.0800.032−0.0130.0490.0670.0680.0550.047−0.0080.037
Z1, T3−0.1900.050−0.0670.0610.0560.038−0.0640.031−0.1240.030
Z2, T10.0170.0250.0790.0290.0800.0290.0950.0320.0330.039
Z2, T20.0090.0250.0400.0490.1350.0300.2910.0390.4510.079
Z2, T30.0990.0430.1470.0310.2080.0420.1700.0520.1080.068
Z3B, T10.1760.0280.1210.0280.1820.0340.1400.0300.0770.035
Z3B, T20.3500.1100.4730.1080.4990.1350.5150.1190.6600.097
Z3B, T3−0.1070.0420.0090.0360.1640.0480.0440.0350.0700.050
Z3R, T10.0930.0340.0400.0250.2620.0300.0390.0300.0000.040
Z3R, T2−0.2400.106−0.3200.075−0.3050.154−0.2320.125−0.1080.165
Z3R, T3−0.3050.068−0.2140.083−0.1350.041−0.2870.050−0.3220.075
S.E. = Standard Error.
Table 5. Average values for ∆b* for every ageing treatment cycles.
Sample and Treatment∆b1*∆b2*∆b3*∆b4*∆b5*
Mean(S.E.)Mean(S.E.)Mean(S.E.)Mean(S.E.)Mean(S.E.)
Z1, T10.1430.1350.2600.1720.3450.1590.6190.1800.5040.218
Z1, T20.7590.1480.6840.2430.6070.4021.0920.2901.2220.218
Z1, T30.0000.264−0.1080.351−0.2330.3570.0980.320−0.3030.332
Z2, T10.1140.0590.2510.0890.1460.0820.3620.1290.1460.133
Z2, T20.3670.0810.6130.1110.7330.0831.3850.1391.5350.469
Z2, T3−0.1420.229−0.0580.229−0.1770.278−0.1310.323−0.1860.339
Z3B, T1−0.1700.0340.1050.0400.2340.0510.3970.0450.2040.069
Z3B, T2−0.0410.1730.2180.2160.1420.3360.5410.2160.6530.242
Z3B, T3−0.0140.1160.1070.1750.0730.2280.3660.171−0.0070.172
Z3R, T1−0.1060.0500.0150.0380.2880.1490.2050.0710.0060.092
Z3R, T2−0.2510.0680.0940.1210.3190.1320.7250.1320.7970.193
Z3R, T3−0.3010.092−0.2190.129−0.2920.086−0.1330.138−0.2990.138
S.E. = Standard Error.
Publisher’s Note: MDPI stays neutral with regard to jurisdictional claims in published maps and institutional affiliations.

