Article

Investigating the Effect of Thermal Annealing and Changing the Concentration of GO in GO/PVA Nanocomposites on Their Structural, Electrical, and Optical Properties

1
Nano Research Laboratory, Baku State University, 23 Academik Zahid Khalilov Street, Baku AZ 1148, Azerbaijan
2
INFN—Laboratori Nazionali di Frascati, Via E. Fermi 54, 00044 Frascati, Italy
3
Institute of Physics, Azerbaijan National Academy of Science, H. Javid av. 131, Baku AZ 1143, Azerbaijan
4
Institute of Catalysis and Inorganic Chemistry, Azerbaijan National Academy of Science, H. Javid av.131, Baku AZ 1143, Azerbaijan
*
Authors to whom correspondence should be addressed.
Submission received: 8 August 2023 / Revised: 9 September 2023 / Accepted: 22 September 2023 / Published: 4 October 2023

Abstract

:
The present research involves producing graphene oxide (GO) using the Hummers method, generating a composite using GO and PVA, and analyzing these composites’ structural and optical characteristics. PVA and GO were used in varied percentages to deal with the issue of how the features of GO/PVA alter depending on concentration. The impact of thermal annealing on the structure and optical characteristics of GO/PVA materials at various concentrations were also investigated. UV-VIS was used to investigate the band gap value of GO/PVA composites. The band gap value changed due to an increase in the concentration of GO in the composites in the PVA and the impact of thermal annealing. The band gap value, specific resistance, and dielectric constant were all found to be well controlled by varying the thermal annealing temperature and the concentration of GO in this case. Differential Scanning Calorimetry (DSC) and thermogravimetric analysis (TGA) were performed on pure PVA and GO/PVA samples in various percentages of GO in order to examine the effect of temperature on the physical properties of (n = 1, 2, 3, 5, 20%) nGO%/PVA nanocomposites. Thermal stability increased as the fraction of GO in the PVA polymer matrix increased.

1. Introduction

Graphene has been attracting significant interest due to its remarkable physical and chemical properties [1]. Graphene is a two-dimensional monolayer atomic structure with a honeycomb layout of sp2 hybridized carbon atoms that has outstanding electrical, thermal, and mechanical properties. Due to its exceptional properties (electrical, thermal, mechanical, optical, etc.), graphene has several application properties [2]. Graphene can replace indium oxide, which acts as a traditional electrode material in electrical and optical devices, transistors, light-emitting diodes, solar cells, etc., and has the potential to be applied as an electrode in several fields [3].
In preparing graphene-based composites, graphene oxide (GO) is mainly used, rather than graphene [4]. The mechanical characteristics of a graphene-based polymer nanocomposite are determined by the dispersion of the graphene layers in the polymer matrix, as well as the interaction of the graphene interlayers with the polymer matrix. However, because of the poor match of pure graphene with the majority of polymers and the intense Van der Waals forces that occur between graphene layers, the arrangement of pure graphene layers in the polymer matrix is not uniform. However, GO layers with oxygenated graphene layers may have lower Van der Waals interactions than graphene layers and may be appropriate with certain polymers. Furthermore, because of the carbonyl and carboxyl groups on the edges, GO sheets are hydrophilic, allowing them to be disseminated in water [2,5,6].
As a result, graphene, GO, and reduced graphene oxide (rGO) are employed as alternatives to pure graphene. The oxygen functional groups in GO are extremely successful at promoting the chemical bonds between GO and other compounds [7]. This suggests that GO is suitable for usage as a filler in polymer matrix structures in the preparation of graphene-based nanocomposites [1,6].
Polymers have a wide range of uses because of their physical, chemical, and mechanical properties and are thus extensively studied. When various fillers, such as metal nanoparticles, graphene, an allotropic form of carbon, and GO nanomaterials, are added to the polymer matrix, variations in the physical and mechanical properties occur. Of course, these variations depend on the polymer matrix and filler’s type, properties, concentration, and impact on the environment [2,7]. Depending on the purpose of the study, the successful choice of polymer is extremely important.
In this study, PVA served as the polymer matrix. PVA has high dielectric properties regarding optical characteristics and it is semi-transparent [8]. Its PVA biocompatibility, harmlessness, water-soluble hydrophilic structure, wide application as a hardener in natural materials, etc., make it a universal polymer for producing composites. The optical, electrical, dielectric, and mechanical properties of PVA can be enhanced by incorporating specific quantities of additives. Due to its outstanding electrical characteristics, the combination of PVA and GO can function as an alternate electrode in supercapacitors and lithium-ion batteries [2].
Because of their numerous uses in modern power electronics and electrical systems, conductive polymer nanocomposites with extremely high and very low dielectric losses have become a material of significant interest [9]. Electrical properties can be controlled by injecting different fillers into polymer matrices, among which graphene-based fillers attract attention. As a result of graphene’s tunable dielectric characteristics, graphene-based polymer composites are particularly relevant in terms of application [10].
In a previous study, 0.1%, 0.2%, and 0.5% of GO and PVA nanocomposites were studied for their thermal, mechanical, and physicochemical properties by Swati, G. et al. [11]. Three low concentrations were chosen for investigation of the properties of these materials. S. Kashyap et al. investigated the elastic modulus and tensile strength properties of PVA composite materials incorporating GO and rGO [12]. In this case, they compared the two composite materials using certain quantities (0.35%) of GO. In another study [13], the authors filled the PVA matrix with low concentrations of GO (up to 1%) and then investigated the structural and physical characteristics. Our study differs from the mentioned research in that they did not investigate the thermal stability of composite materials at high concentrations (20%) or how the concentration affects the change in physical properties in the different concentrated nanocomposites. It is essential to thoroughly research composite materials at various concentrations in order to have a precise understanding of their physical characteristics. Additionally, the DSC and TGA analysis, as well as the Eg value of composite materials, have not been investigated in the wide range dependent on concentration in the scientific literature. The given analysis differs from previous studies in the literature in that it contains an extensive variety of concentrated GO. The physical characterization of the PVA composite dependent on concentration has been investigated as well as the reasons for the changes in physical properties as a result of thermal exposure to different concentrations.
It is important to investigate the temperature and concentration dependence of the characterization of devices and elements based on GO/PVA. The results of this research will allow for optimizing the parameters of devices and elements to be created based on these composites. At the same time, determining temperature-resistant materials by testing sample thermal stability and their use in relevant fields are critical challenges.
As a result of our research, it was determined that when we change the mass concentration of GO nanostructures distributed within PVA, the optical properties show a fundamental change. By adding GO nanostructures to PVA, changes in the band gap value were observed, which depended largely on the concentration of GO. Additionally, samples that had experienced thermal treatment revealed variations in the band gap value according to temperature. The thermal stability of the samples at various percentages of GO was tested, and it was discovered that the stability rises as the percentage of GO in the PVA polymer matrix increases.

2. Materials and Methods

The GO used in this study was produced using a modified Hummer’s technique. The synthesis of GO was carried out as follows: graphite powder (3 g) and NaNO3 (1.5 g) were mixed in a 500 mL beaker. Then, 70 mL of concentrated H2SO4 was added at a low speed to the mixture. The resulting solution was cooled in an ice bath and stirred for 1 h. During the following stage, KMnO4 was gradually injected into the solution in phases. At this time, the temperature of the reaction begins to rise rapidly. The reaction temperature must remain under 20 °C. The reaction continued for 3 h. The solution was then removed from the ice bath and agitated for 1 h at 35 °C [14,15,16]. After that, 150 mL of water is added to the solution drop by drop, causing the solution to thicken and the reaction temperature to increase to 98 °C. The solution was kept at this temperature for 30 min. The solution was subsequently slowly incorporated into 300 mL of water and agitated for 1 h. In the next step, 15 mL of H2O2 (30%) was added to the solution and stirred for 30 min. The solution was filtered using filter paper, rinsed with 1:10 HCl: distilled water (DW) (250 mL) to remove metal ions, and air-dried at temperature [14,15,16,17].
The obtained product was added to DW and exposed to ultrasound. Then, it was precipitated in a centrifuge and filtered. The obtained product is dried at room temperature in air conditions. It is considered appropriate to use DW as a solvent for PVA [18]. GO nanostructures can be easily dispersed in water, which makes it possible to use water as a medium [19]. In the initial step, the certain amount of PVA was dissolved in DW to prepare a 5% concentrated solution. It was mixed with a magnetic stirrer so that the polymer completely dissolved [20]. Then, GO was added to this solution. The solution, mixed with different mass concentrations, was subjected to ultrasonic exposure for 2 min. The obtained solution was filtered into containers and dried at room temperature under air conditions. It should be noted that the preparation of the obtained composites was carried out in concentrations of 1, 2, 3, 5, and 20% of GO.
The value of the concentration can be controlled depending on the value of the mass ratio of added GO and PVA. The concentration percentage was calculated according to Formula (1).
% = m GO m PVA + m GO × 100 %
Here, mPVA indicates the mass amount of PVA in the mixture and mGO indicates the mass amount of GO in the mixture. Increasing the mass amount of GO makes it possible to obtain composites with different concentrations [2].
The Rigaku Miniflex equipment was used to investigate the samples’ X-ray structural analyses. At wavelengths ranging from 190 to 1100 nm, the optical characteristics of the material being studied were investigated using the “Specord 250 Plus” equipment. The absorption spectrum was obtained, and the band gap value of the materials was determined based on this spectrum. The microstructure was examined using transmission electron microscopy (TEM) on a JEOL JEM-1400 (Japan) device with a voltage range of 80–120 kV. The DSC and TGA analyses were performed with the Netzsch STA 449 F3 (platinum-platinum rhodium thermocouple) differential scanning calorimeter between room temperature and 725 K; the heating rate was 15 K·min−1.

3. Result of Analysis

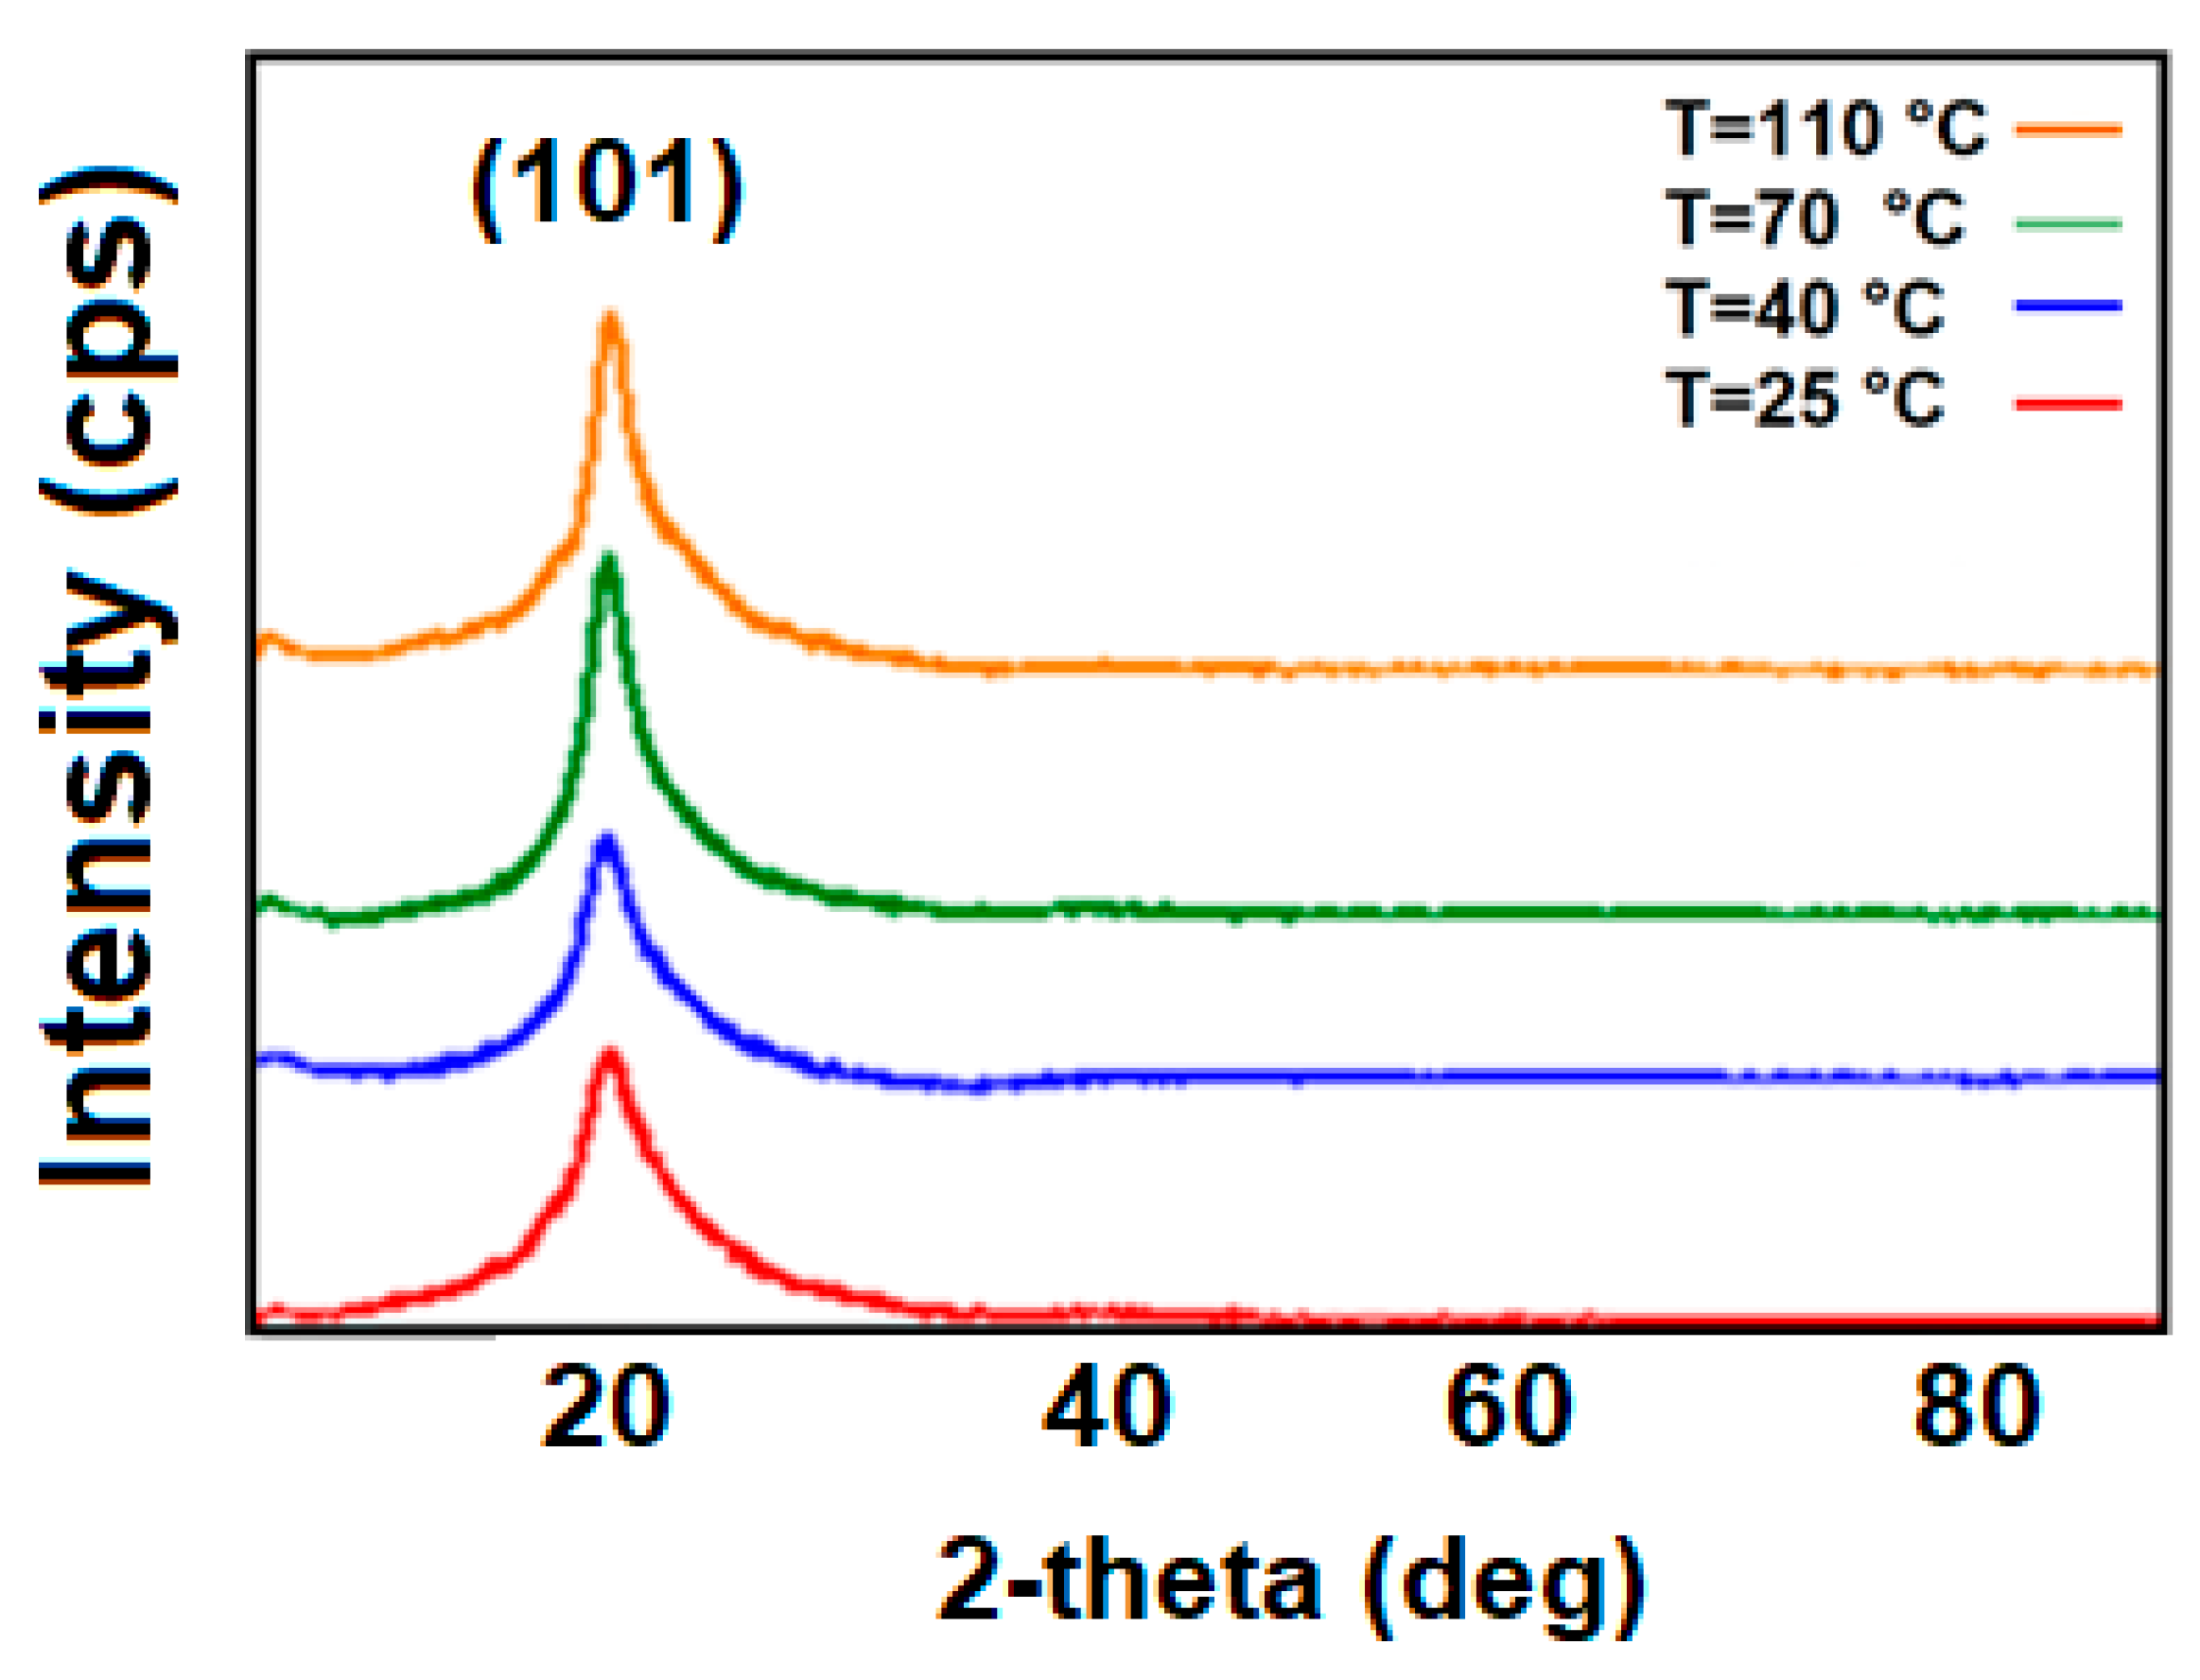
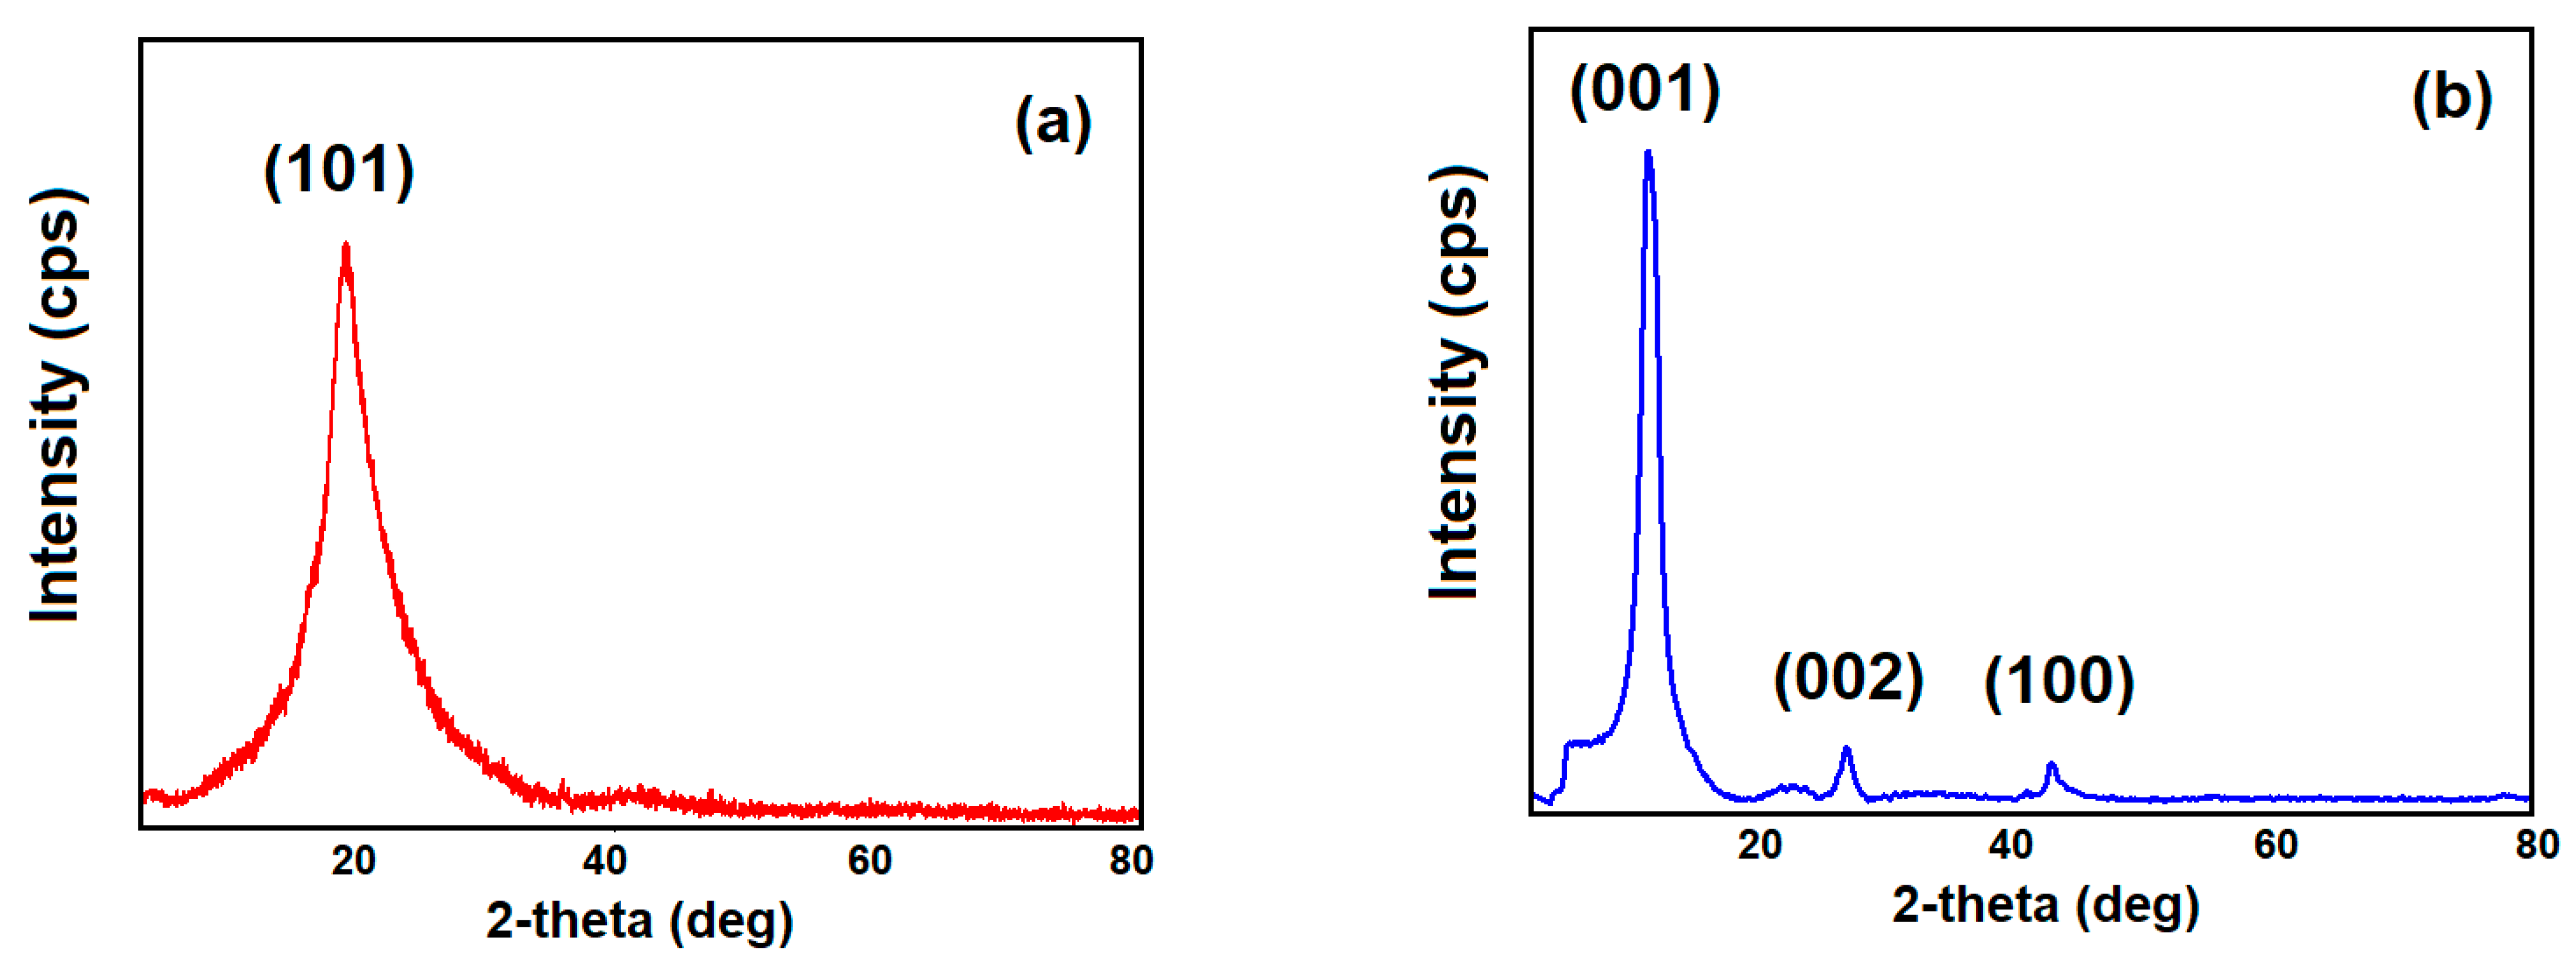
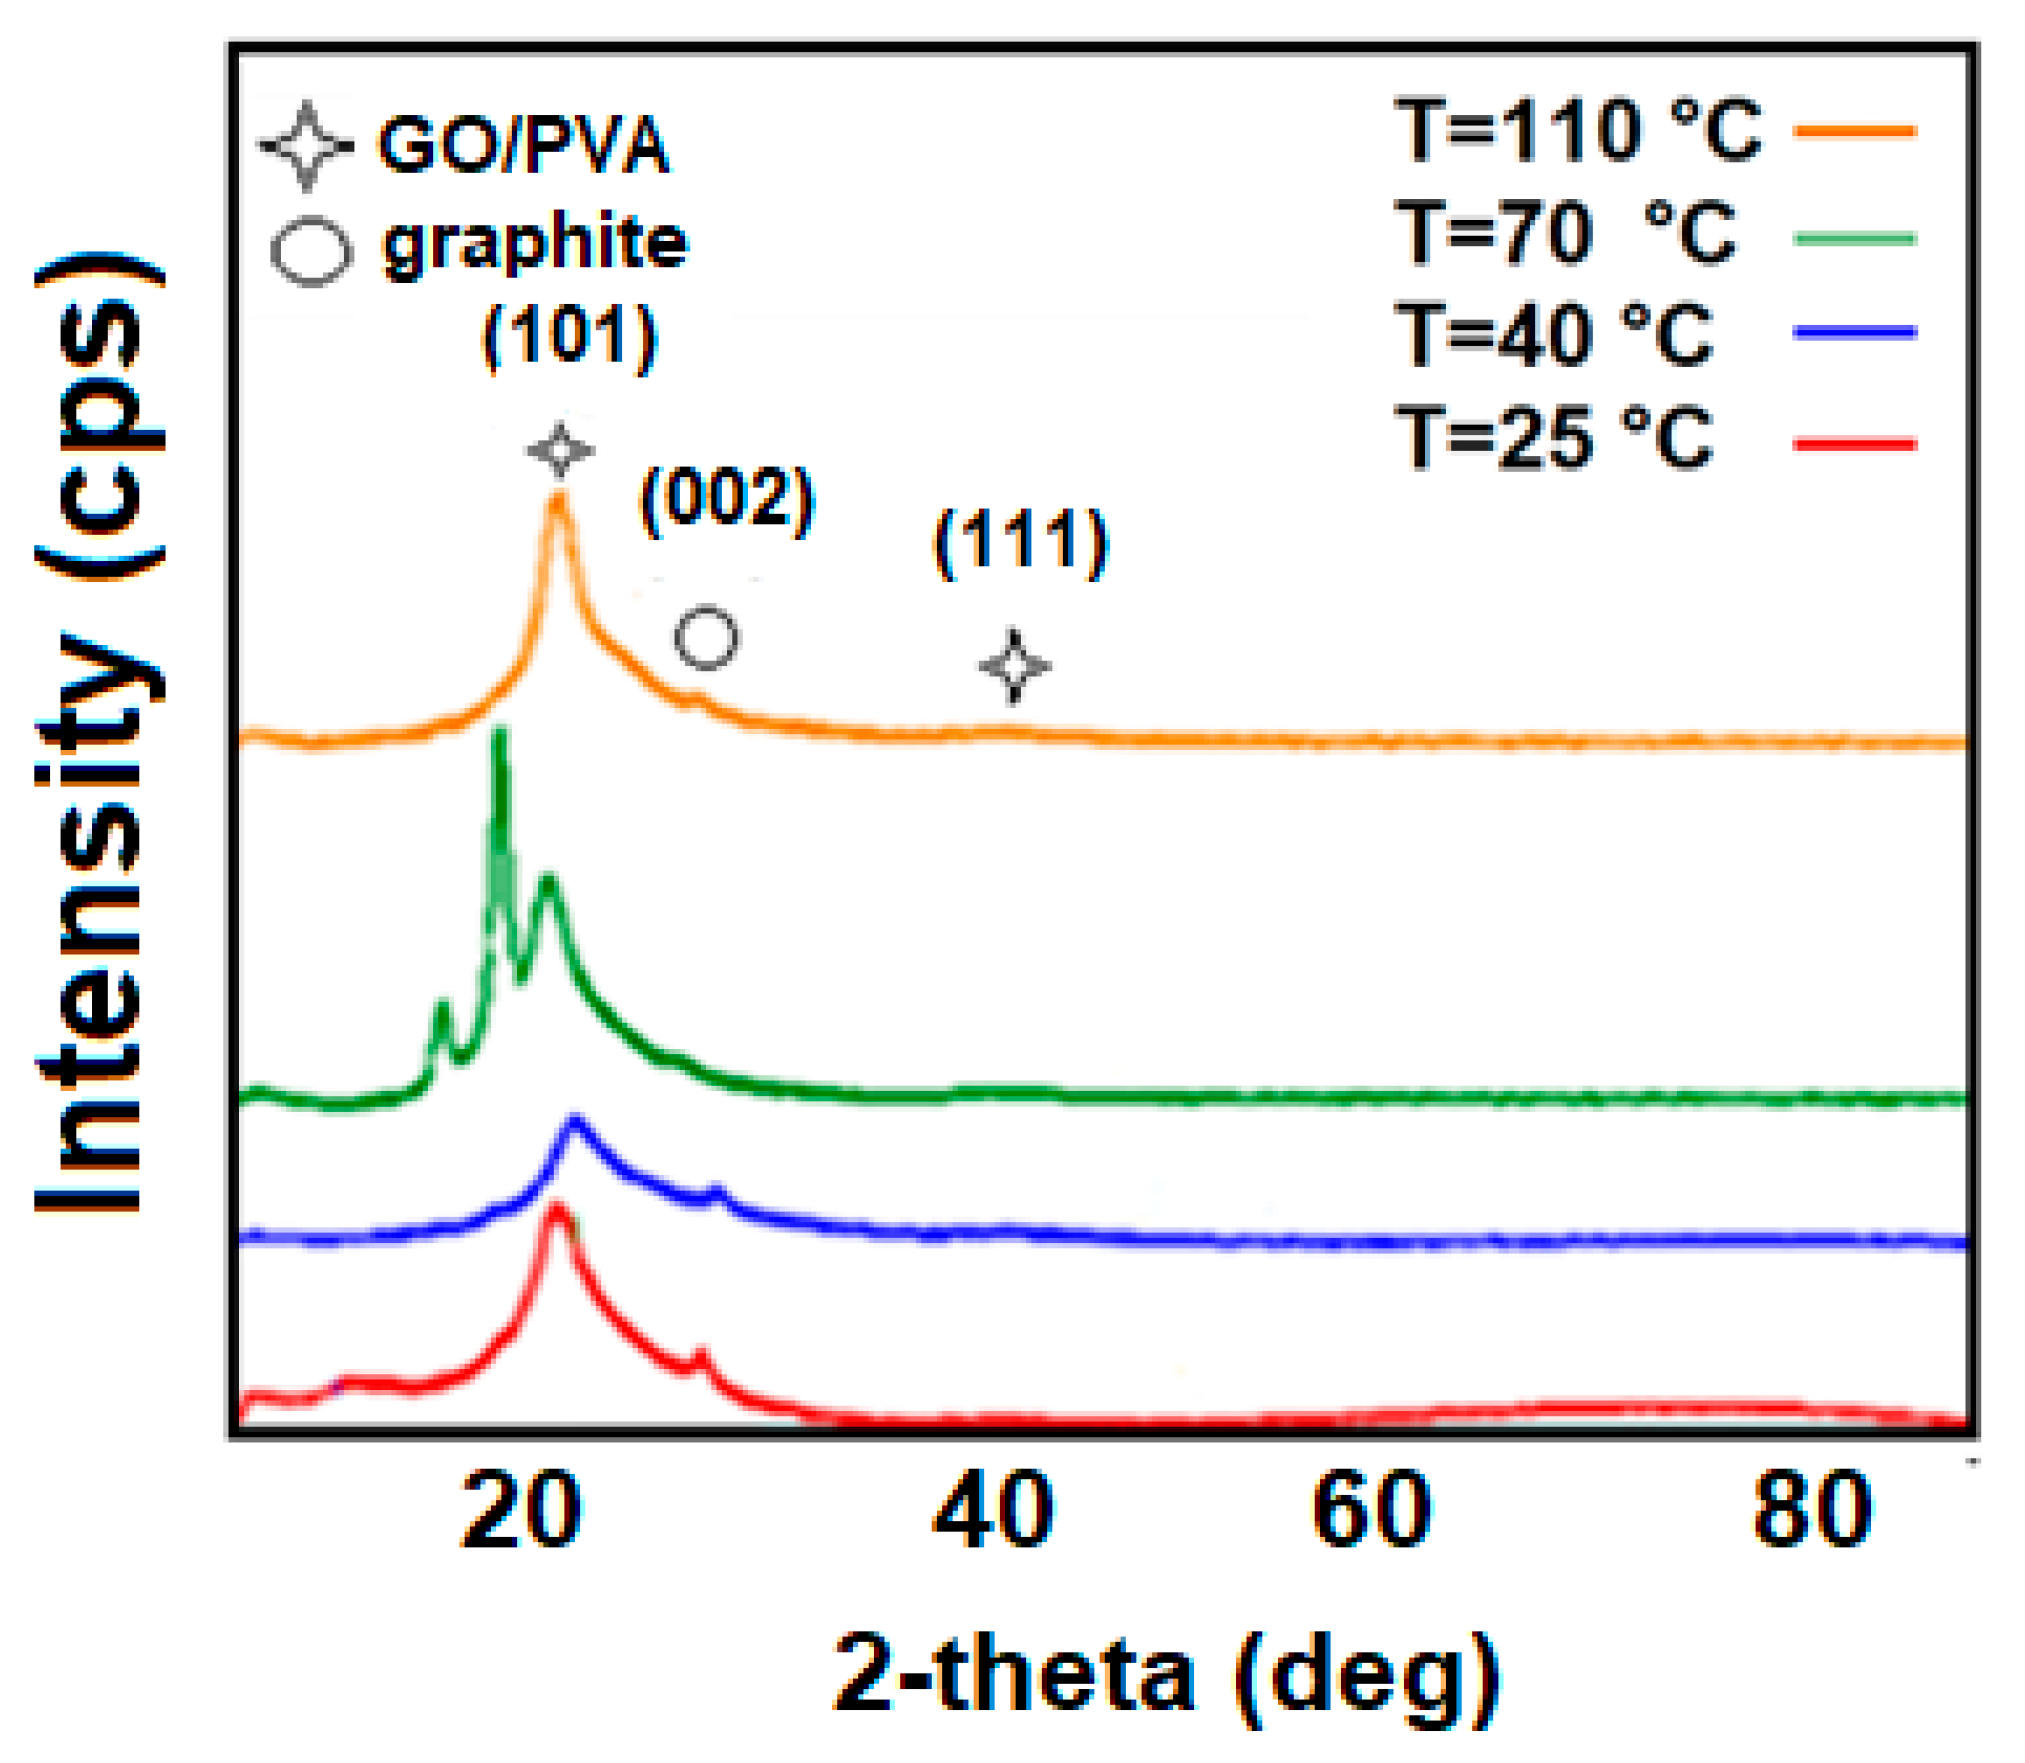
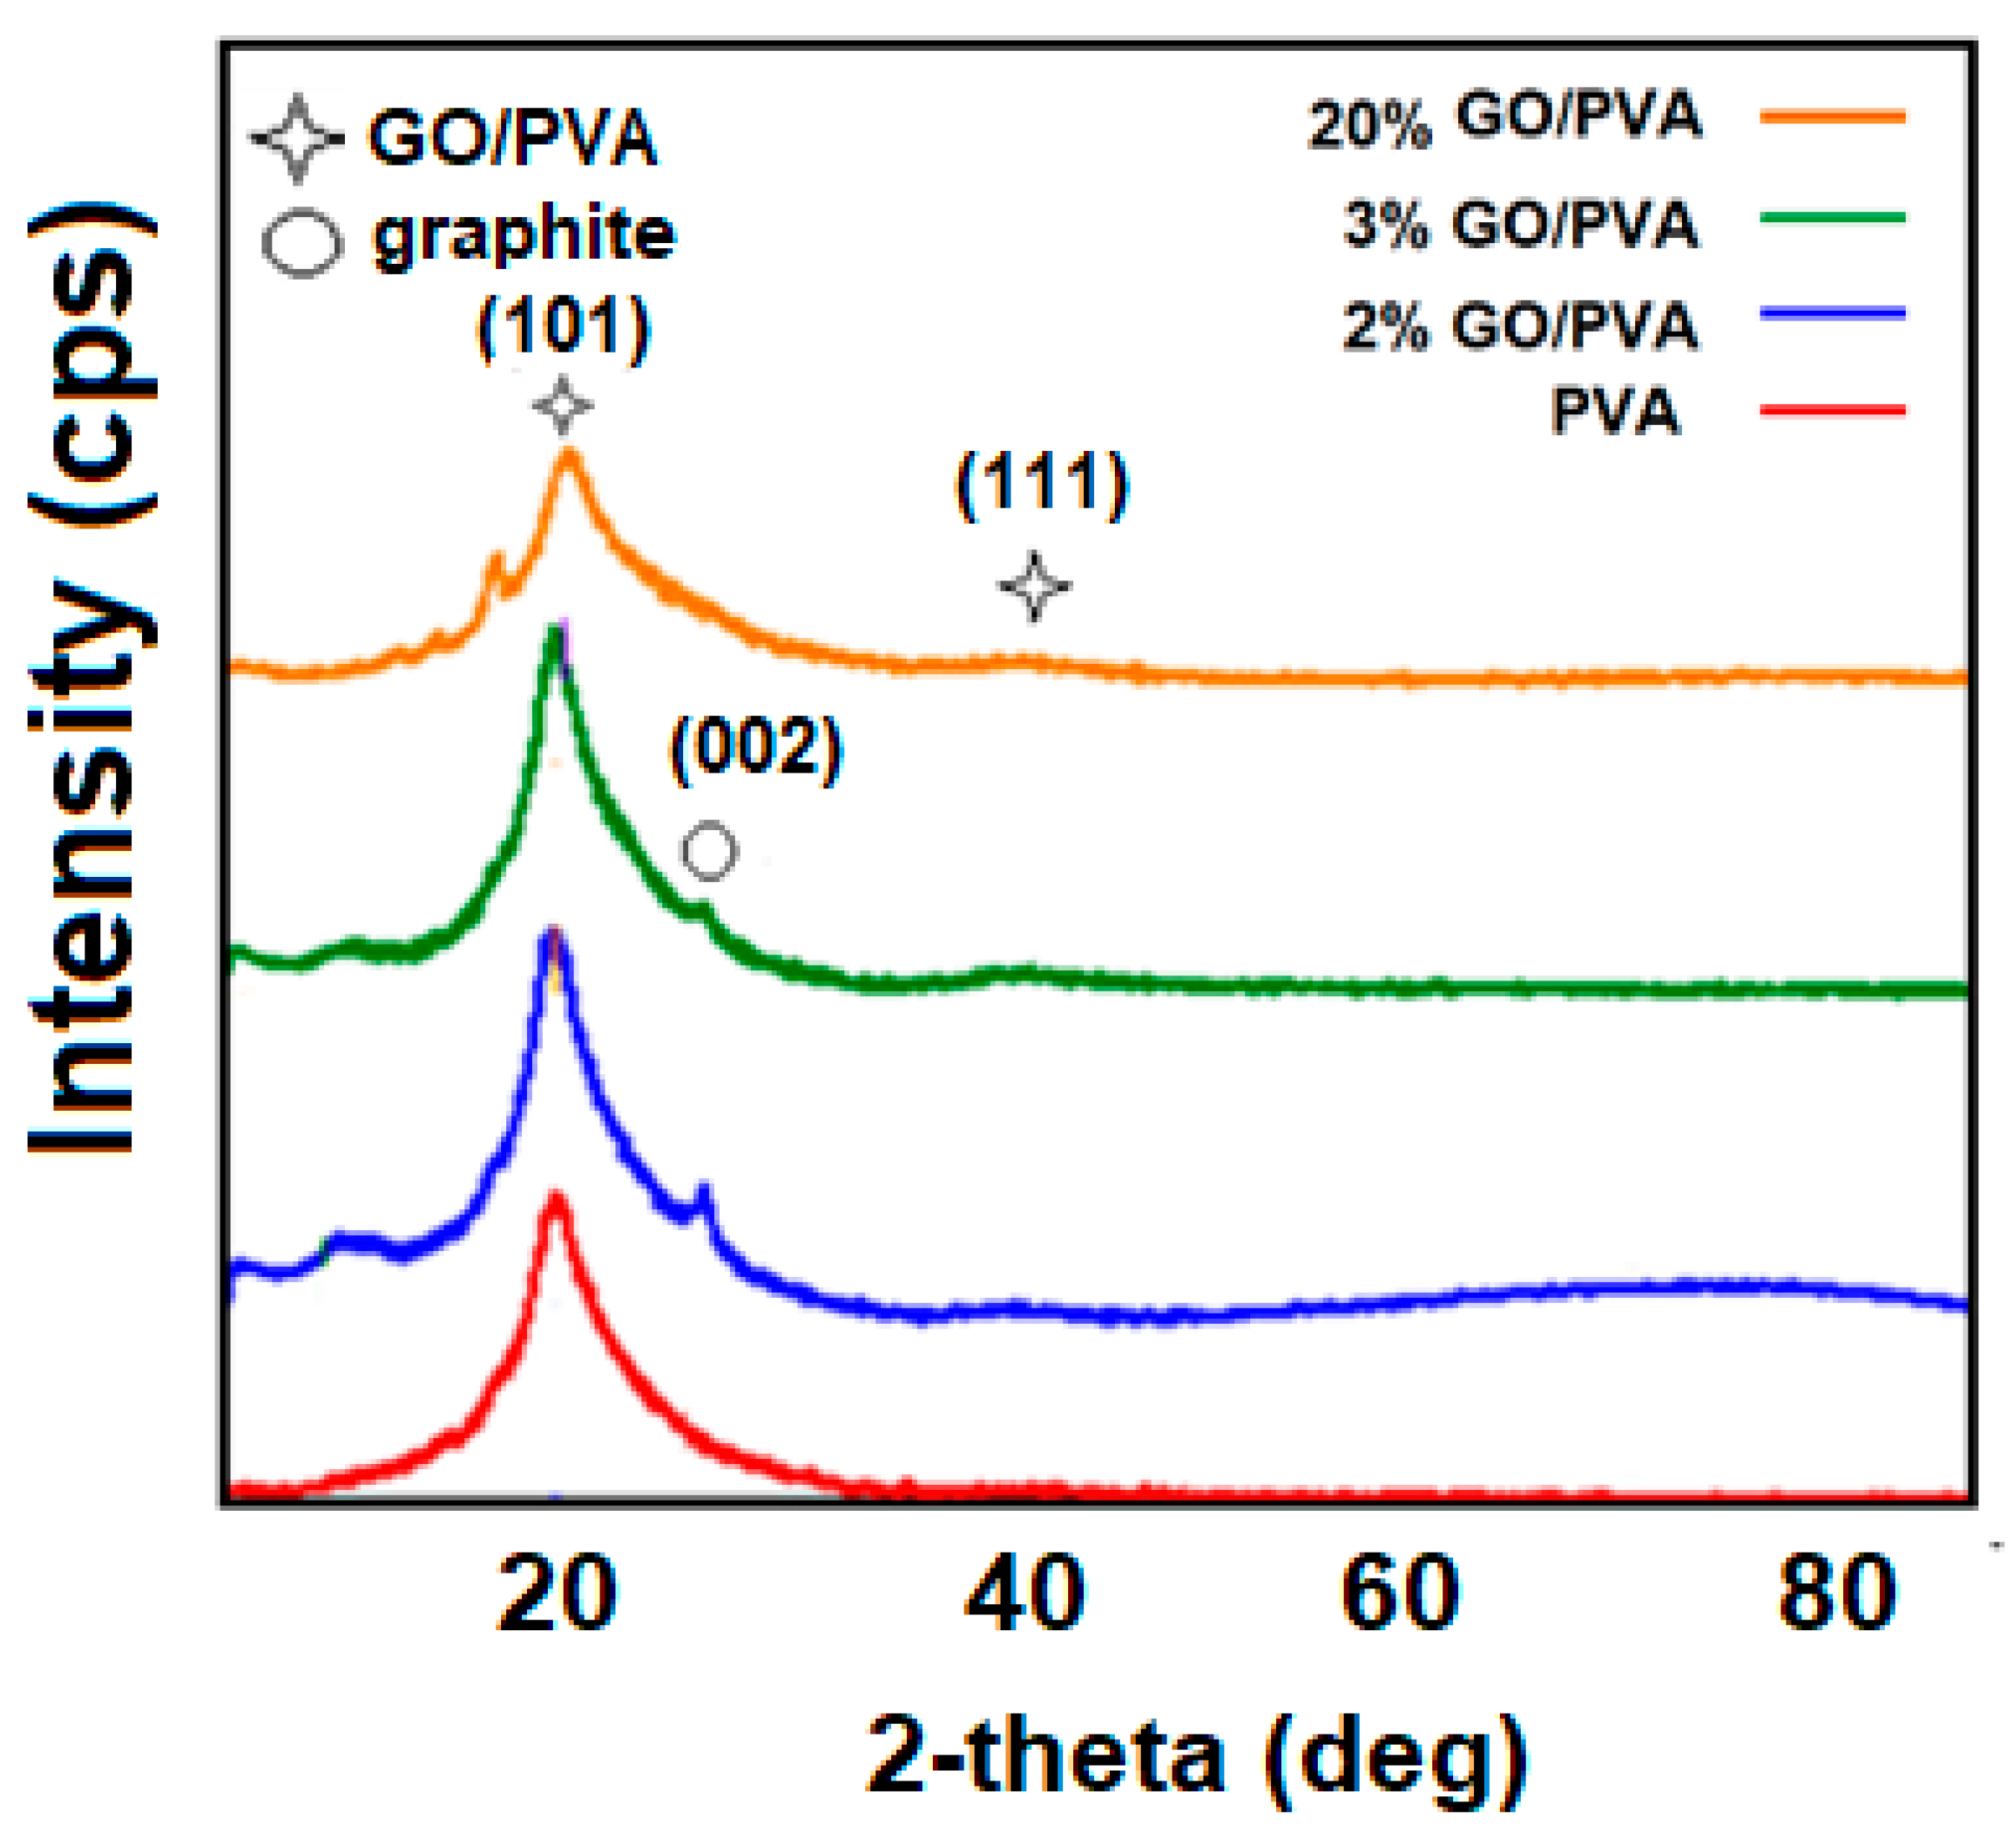
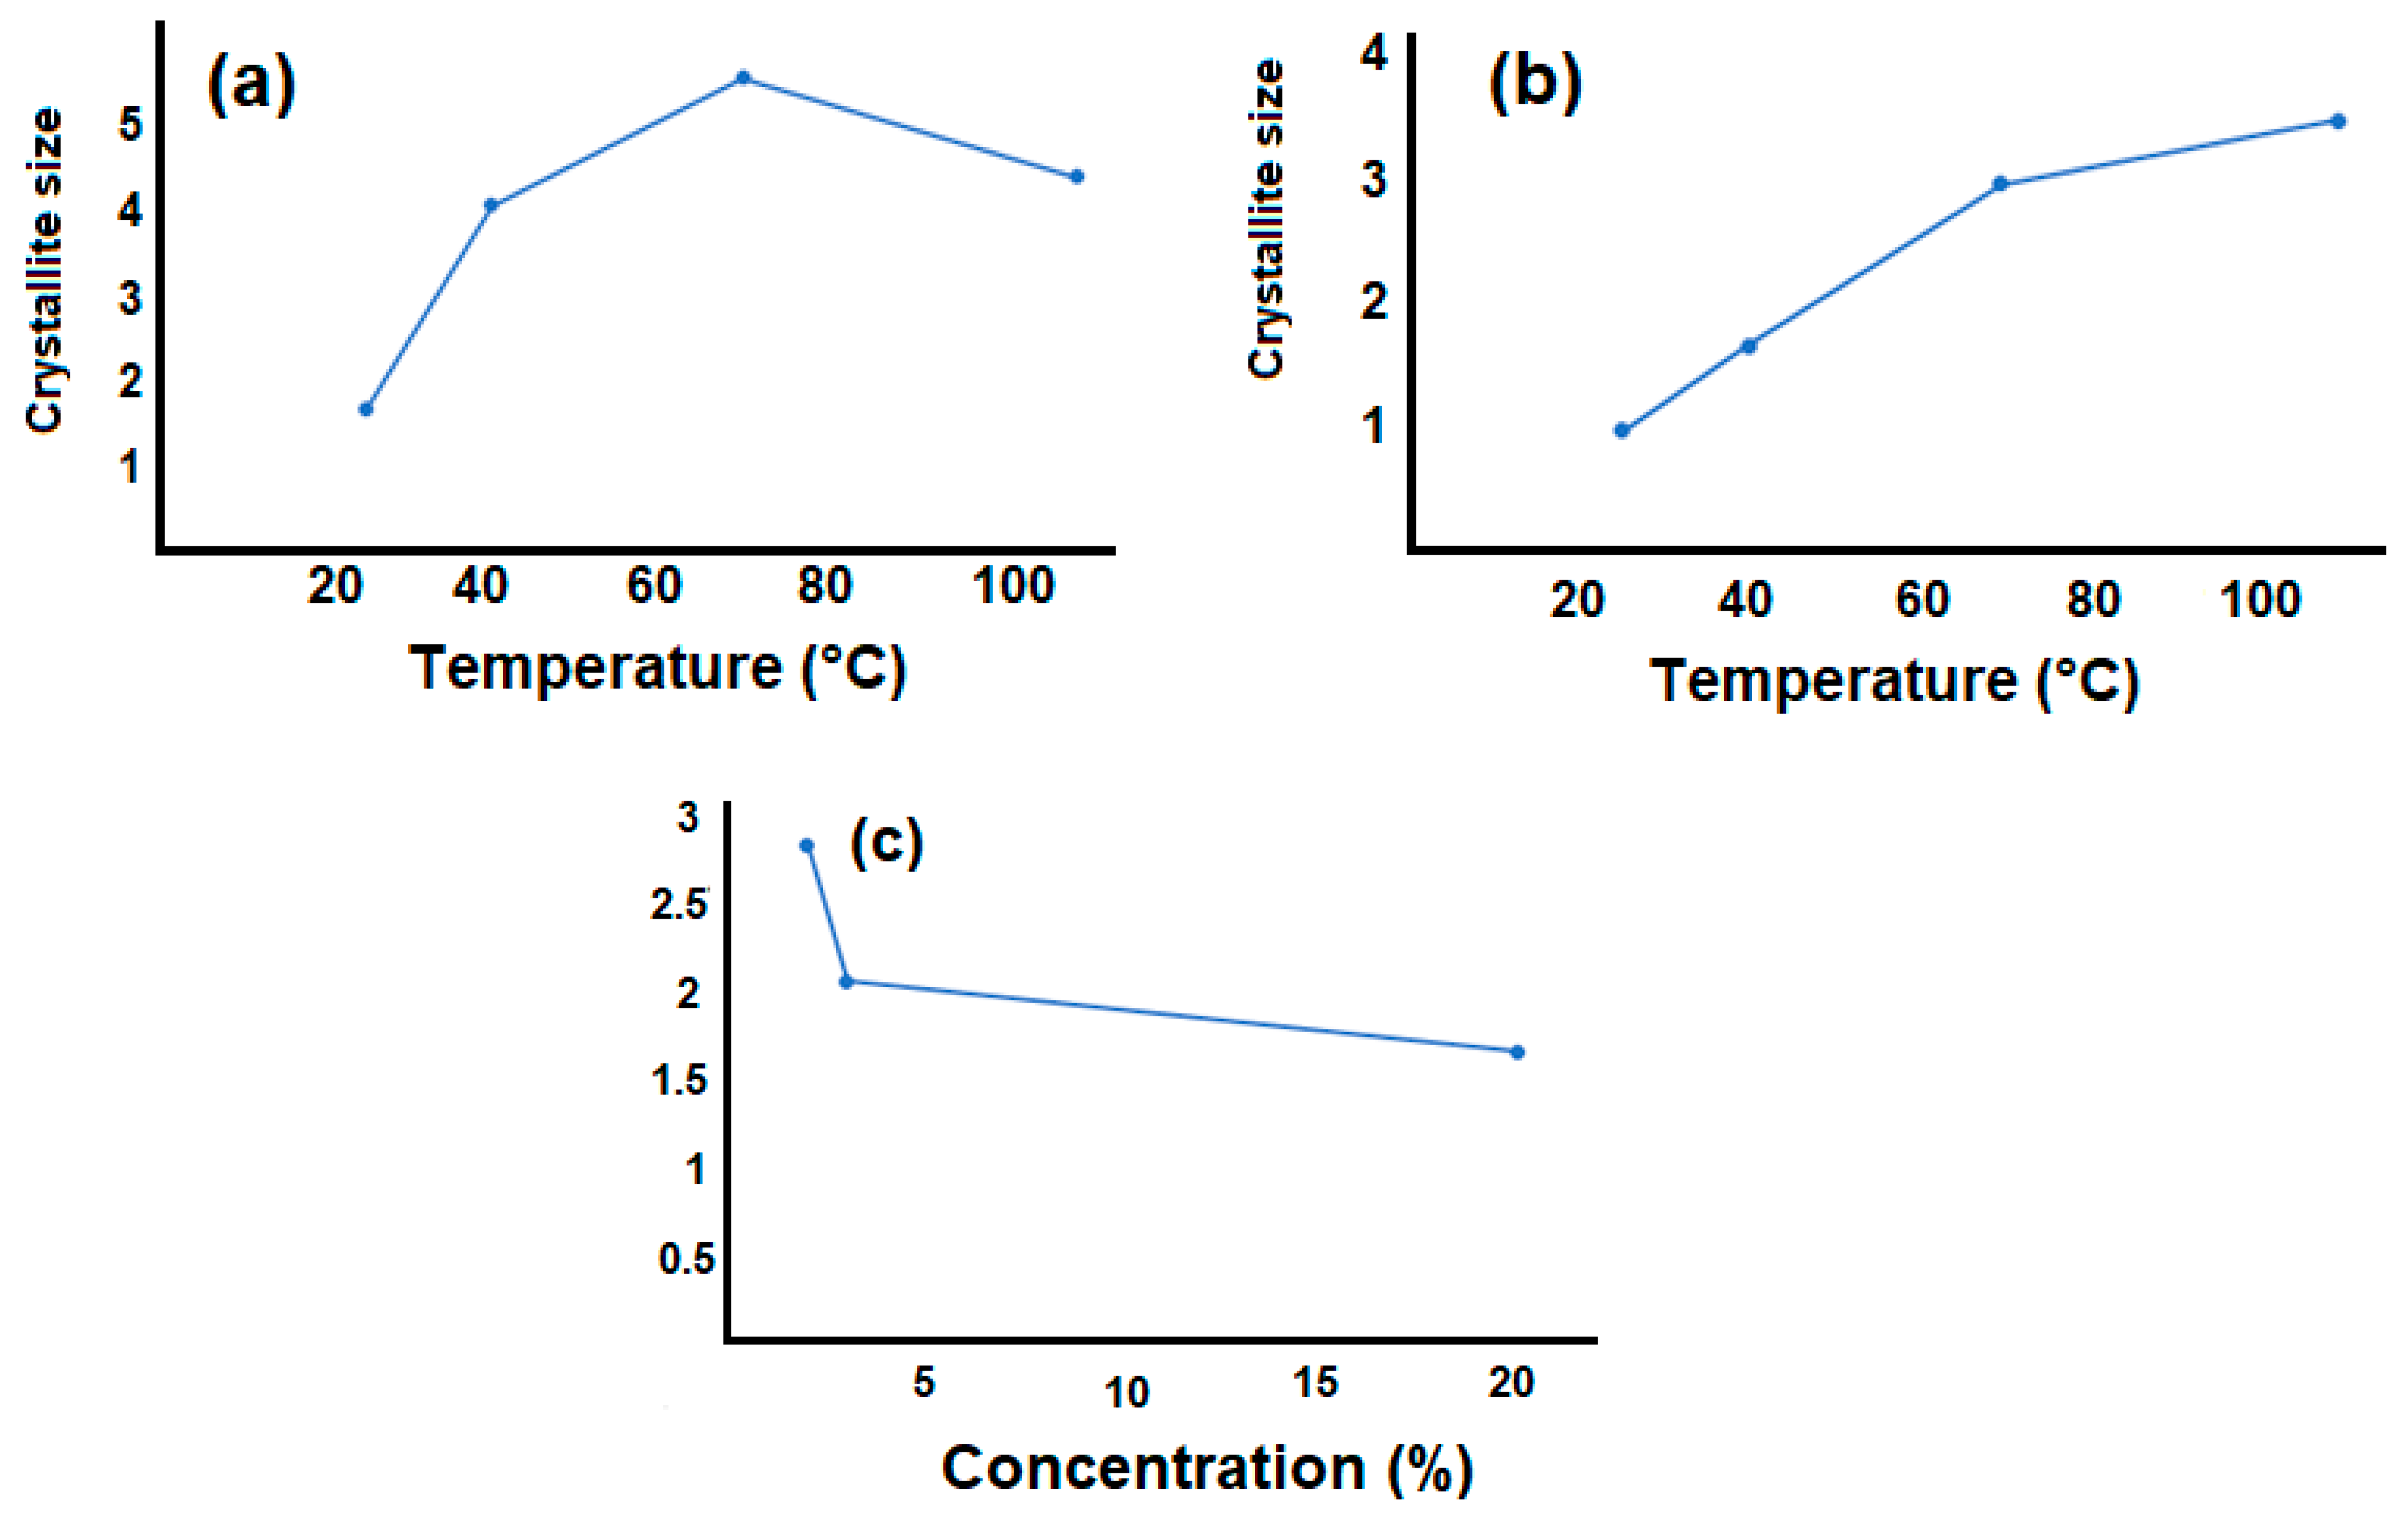
3.1. X-ray Diffraction (XRD) Analysis
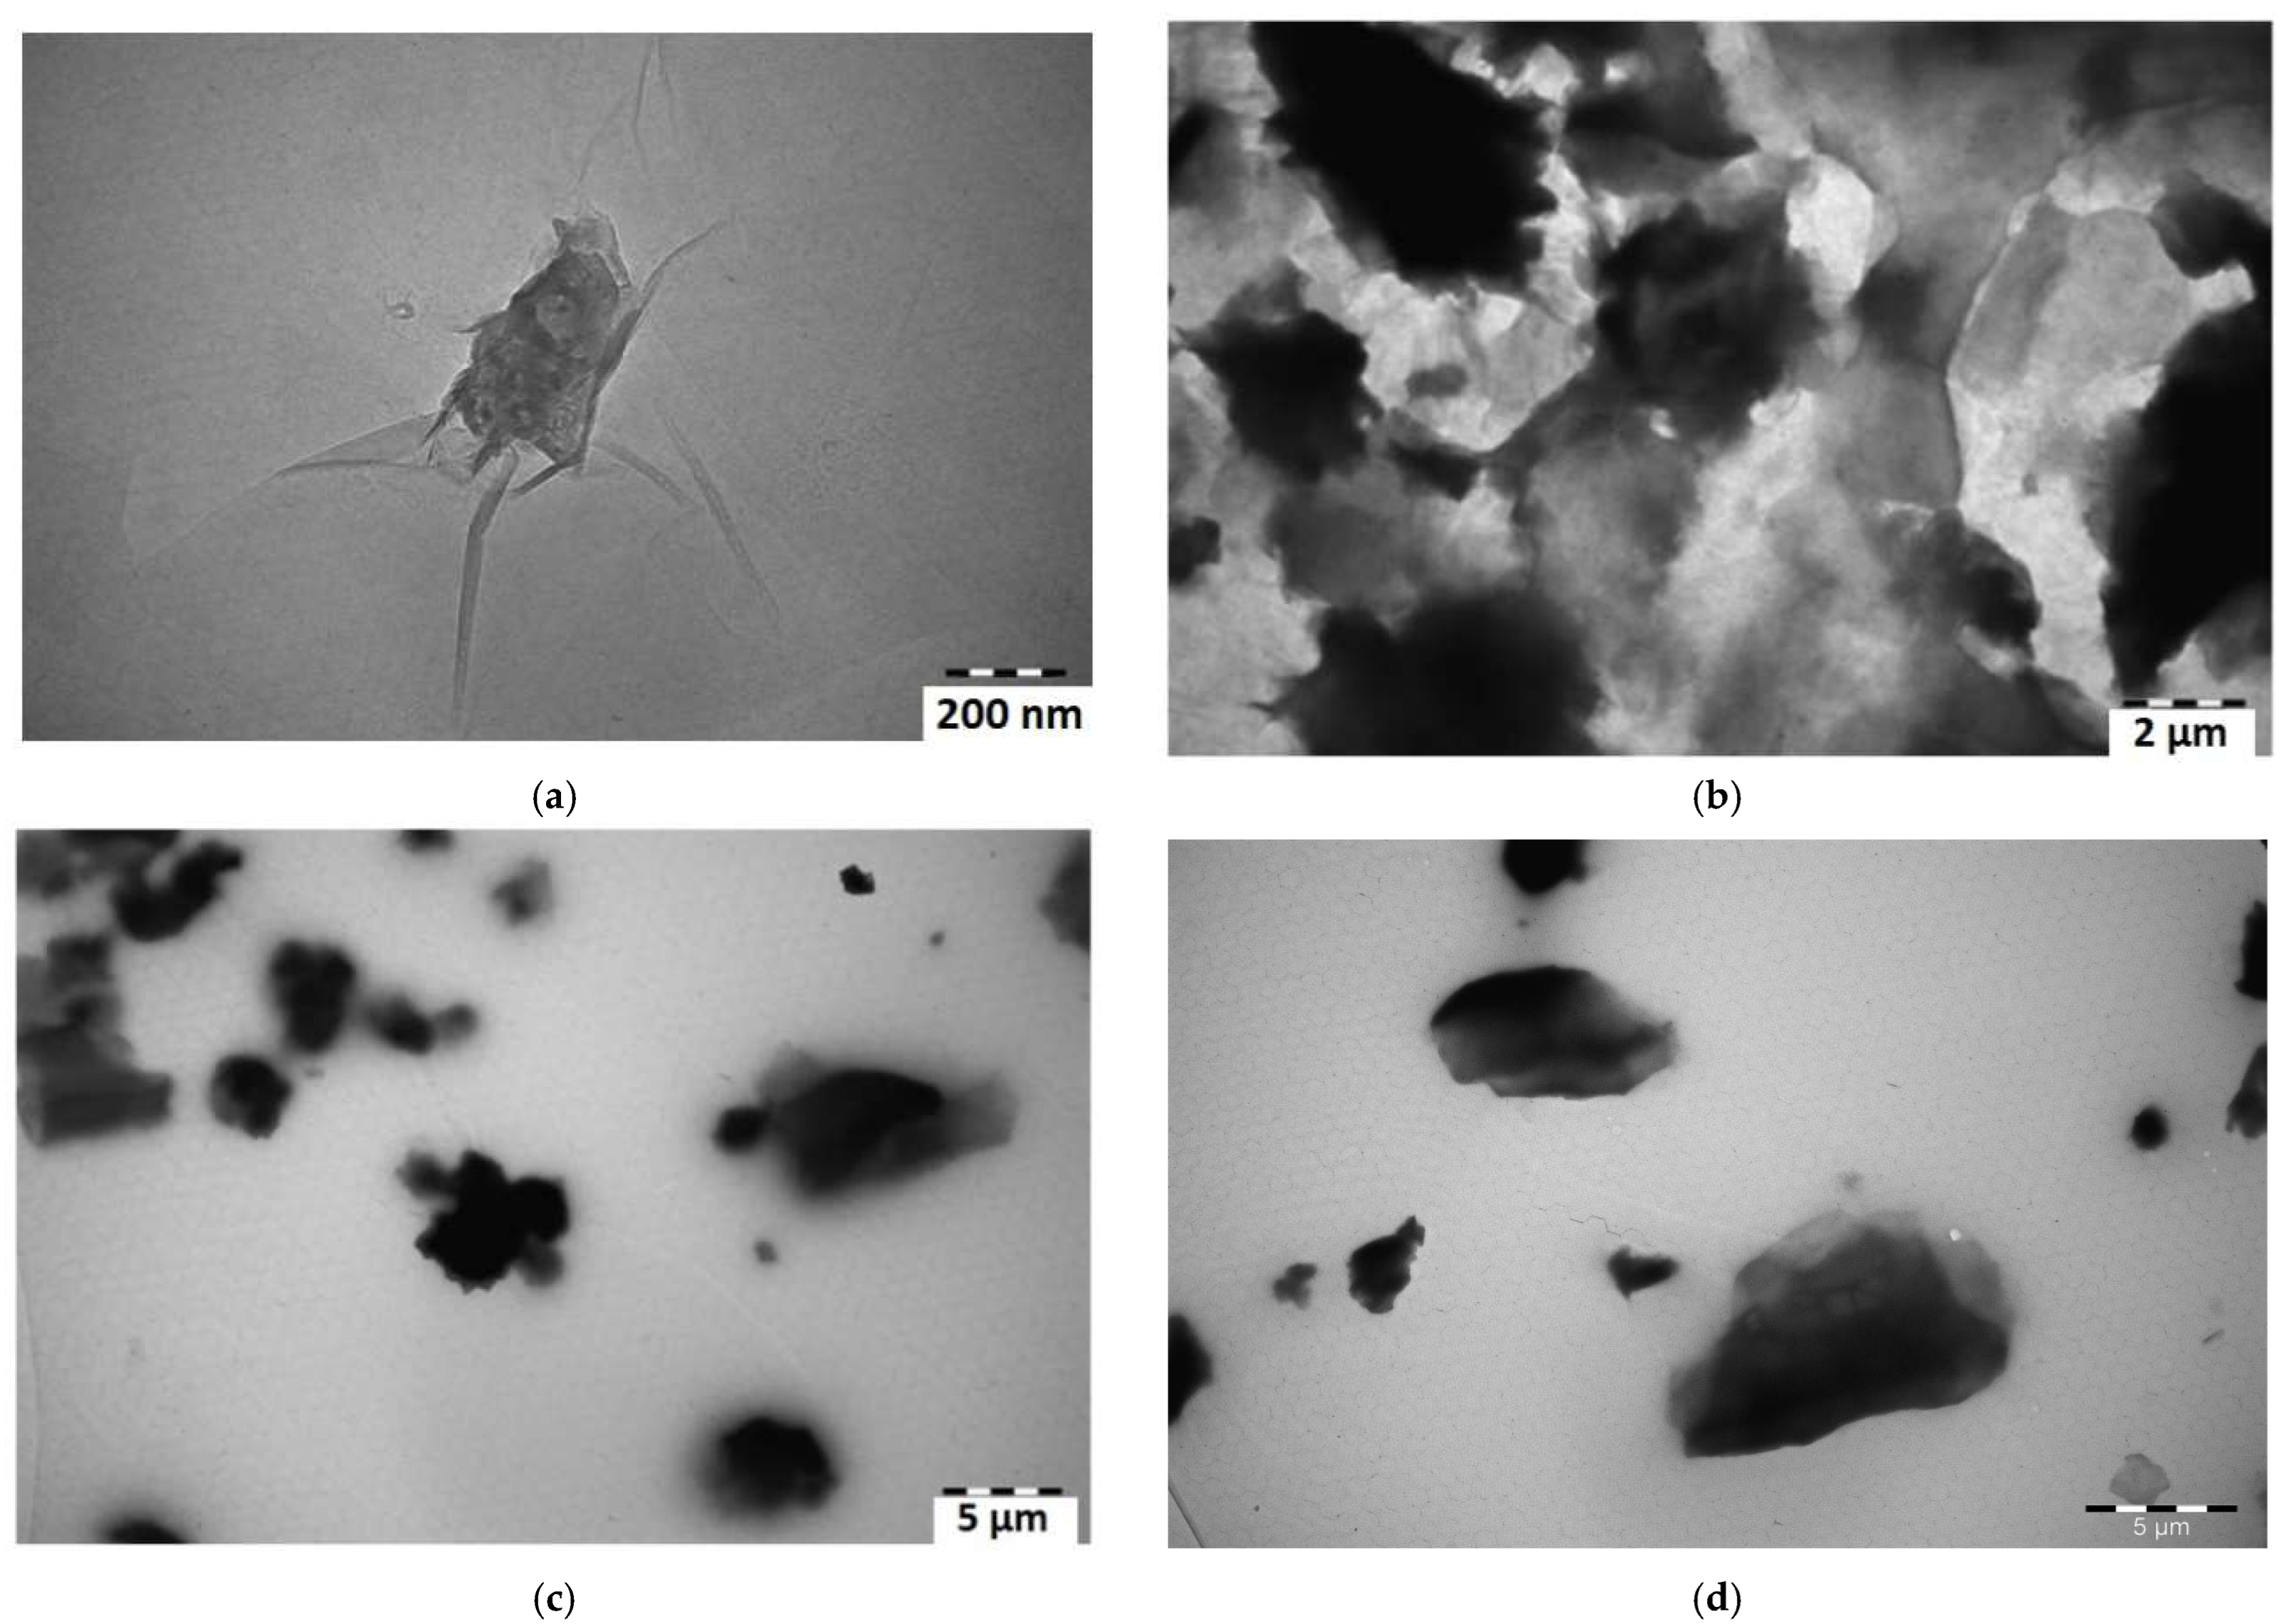
In this study, the XRD data of the pure polymer and its curing at various temperatures, as well as composites with various GO filler concentrations, were considered. Figure 1 depicts the XRD spectra of pristine PVA annealed at various temperatures (25 °C, 40 °C, 70 °C, and 110 °C). The observed broad peaks about 2θ =19.9° belong to characteristics for PVA [21]. The detected peak in the diffraction pattern corresponds to the (101) Miller index, and the inter-lattice distance d is 0.45 nm and corresponds to a monoclinic unit cell.
The PVA thin film experienced three separate thermal annealing processes at 40°, 70°, and 110 °C, respectively. As a rule, the degree of crystallinity of the PVA thin film increased with the increasing temperature. This is due to an increase in sample density with increasing temperature in the polymer matrix. In other words, polymer chain aggregation is seen as the temperature rises. In the literature, there are works related to the increase of the degree of crystallinity with the increase of the thermal annealing temperature. Here, it was observed that an increase in heating temperature will also result in a rise in crystal domains [22]. Y. Song et al. reported that with the increasing of the thermal annealing temperature, the crystallinity of the PVA polymer matrix increases as the doublet gradually shifts to a higher Bragg angle (as shown in Figure 1), indicating the perfection of the PVA crystal structure.
In Figure 2, the XRD pattern of pristine PVA (Figure 2a) and GO (Figure 2b) are shown. The intense peak observed here at about 20° is that of pure PVA. This corresponds to the Miller (101) index.
In the XRD pattern of pristine GO (Figure 2b), three diffraction peaks were observed at 2θ = 11.98°, 26.30°, and 42.04° corresponding to (001), (002), and (100) planes, respectively. In this pattern, the high-intensity peak occurred at 2θ = 11.98° and the low-intensity peak occurred at 2θ = 42.04°, both belonging to GO, while the peak at 2θ = 26.30° is attributed to the residual graphite. The interplanar spacing of GO is 0.74 nm. The nanocomposites with 1%, 2%, 3%, 5%, and 20% GO loading in the PVA matrix had characteristic peaks at 19.90°, 19.68°, 19.54°, 19.06°, and 20.15° with d-spacing 0.45 nm, 0.45 nm, 0.45 nm, 0.47 nm, and 0.44 nm, respectively.
Figure 3 depicts the XRD results of samples of 2% GO/PVA-based nanocomposite thermal annealed for 1 h at different temperatures. Diffraction peaks of 2% GO/PVA nanocomposite obtained at room temperature and thermally annealed samples at T = 40 °C, T = 70 °C, and T = 110 °C are observed 2θ = 19.67°, 19.43°, 20.30°, 19.67°, respectively. In the diffraction pattern, approximately 2θ ≈ 40° is observed for all samples. The observed peaks are considered to be characteristic peaks for GO/PVA composites [23]. Around 2θ = 19° observable peaks are indexed by (100) and 2θ = 40° observed peaks by (111) Miller indices. The characteristic peak of GO (2θ = 10.6°) is unobserved here [24]. The absence of the typical GO signal in the diffraction pattern of GO/PVA nanocomposite implies that GO is distributed evenly due to dispersion within the PVA matrix. The low concentration of GO is another factor contributing to the failure to see the characteristic peak associated with GO [25]. The GO/PVA structure consists of a visually consistent arrangement of the polymer matrix and GO layers in a 2D dimensional system.
However, with the addition of GO to the PVA matrix, crystallization is observed in the GO/PVA composite with a concentration of 2% at 25 °C, as can be seen in Figure 3. These peaks exhibit PVA’s signature characteristics [26]. No additional peaks were observed in the composite annealed at 40 °C, and the intensity of the main peak was reduced. This is caused by the interaction of the GO and polymer with the annealing temperature. The GO/PVA composites diffraction pattern shows new peaks after thermal annealing at 70 °C. As a result of increasing the mobility of PVA molecules with increasing temperature, chaotic movement occurs and diffusion between layers occurs. Because of the softening of the polymer, the spaces between these layers are filled, the polymer covers the GO nanoparticles better, and oriented structures are formed. This is observed as the formation of additional peaks in the diffraction pattern. These peaks belong to the different orientations of the crystallized PVA structure. The observed peaks in the low angles are related to the PVA matrix. This chaos increases with further temperature increases. The PVA polymer matrix melts at 110 °C, the water in the sample evaporates from within the composite, and the interactions between the PVA hydroxyl (-OH) groups and the hydrogen bonds of the functional groups that contain oxygen of GO weaken and break. This is to say that the disintegration of the formed oriented structures takes place [27]. Furthermore, the distinctive peaks seen for graphite (002) reflection planes are at approximately 2θ = 26°. These peaks are observed for all samples in Figure 3. This fact is related to the weakly observed characteristic peak of the graphite, which was selected as the initial sample.
Figure 4 reflects the XRD results of pristine PVA and GO/PVA nanocomposites with various concentrations (2%, 3%, and 20%) obtained at 25 °C. The results show that the intensity of the peaks reduced as the amount of GO in the composite increased. Raising the amount of GO in the composite may produce disorder in the polymer matrix and weaken polymer chain packing, resulting in a decrease in the crystallinity of the nanocomposite; in other words, GO may be related to the restacking tendency of GO nanofillers [13]. The peaks detected at low angles in Figure 3 and Figure 4 are attributed to the PVA matrix.
The characteristic peaks of the graphite are observed in the 2% concentrated GO/PVA and 3% concentrated GO/PVA. It is assumed that at low concentrations of GO, the chemical interactions between the particles are smaller because the distance between them is greater. In this regard, the XRD pattern of the composite indicated slight peaks related to the initially selected material (3% and 20% GO/PVA).
Williamson–Hall plots and the Debye–Sherer equation were utilized in the scientific literature to determine the crystallinity dimensions of GO/PVA composite materials [28,29,30,31,32]. The crystal sizes of the 2%, 3%, and 20% GO/PVA obtained at room temperature were compared in the present work, both from the obtained results at different temperatures for pure PVA and from thermally annealed samples at different temperatures and by determining their crystal sizes using the Debye–Sherer equation. Temperature and concentration-dependent graphs have been drawn (Figure 5). Figure 5a depicts the variation of PVA crystal sizes at different temperatures, Figure 5b shows the temperature dependence graph of the crystal size of the thermally annealed samples for the 2% GO/PVA sample, and Figure 5c illustrates the crystal size as concentration changes.
Figure 5a shows that the crystallite size of pure PVA rose with increasing temperature (70 °C) and reached its maximum value before decreasing (110 °C). This is because the raising of the temperature enhances the mobility of PVA chains and promotes the formation and growth of larger crystals. As the temperature rises within this range, the increased thermal energy allows the polymer chains to move more freely, facilitating the alignment and packing of PVA molecules into larger and more ordered crystalline structures. However, around 110 °C, the crystal size of PVA starts to decrease. At higher temperatures, the increased thermal energy can disrupt the stability of the PVA crystal lattice. The increased mobility of the polymer chains may lead to more disorder and defects within the crystal structure, causing a reduction in crystal size. Additionally, prolonged exposure to higher temperatures can result in thermal degradation of PVA, which can further contribute to the decrease in crystal size. In Figure 5b, we observe that the size of the crystallites increases with the increase in the percentage of GO in the PVA content of the 2% GO/PVA composite material. This effect can be attributed to the principles of thermodynamics and kinetic processes occurring within the crystal structure. When a GO/PVA nanocomposite material is heated, the kinetic energy of its atoms or molecules increases. This higher energy state enables greater atomic mobility within the material. In the case of a crystalline material, this increased atomic mobility allows atoms to move more freely within the crystalline lattice. The atomic mobility within the lattice facilitates the process of crystal growth. As atoms move, they can attach to the existing crystal lattice, causing the crystal to grow in size. At higher temperatures, the increased mobility of atoms accelerates the rate at which new units are incorporated into the crystal structure, resulting in larger crystal sizes. Therefore, the crystallite sizes also increased with the increase in the amount of GO in PVA. Figure 5c reflects the variation of crystallite sizes depending on the concentration (2%, 3%, and 20%) of GO inside PVA for GO/PVA nanocomposite materials. The decrease in crystal size of GO/PVA as concentration increases can be related to the interactions between PVA and graphene, as well as the influence of GO on the crystallization process of PVA. PVA is a polymer that can form crystalline structures when it solidifies from a solution or melts. These crystalline structures are typically observed as regions of ordered and aligned polymer chains. When GO is added to PVA, it can disrupt the formation of large PVA crystals. GO sheets have a two-dimensional structure with a large surface area. The presence of GO sheets can interfere with the mobility and arrangement of PVA chains during the crystallization process. The GO sheets may act as barriers that hinder the formation and growth of large PVA crystals. Furthermore, GO and PVA can form intermolecular interactions, such as van der Waals forces, hydrogen bonding, or π-π stacking interactions. Interfaces between functional groups on PVA chains and GO sheets occur. The presence of GO and the associated interactions can alter the crystallization kinetics and thermodynamics of PVA, leading to smaller crystal sizes.

3.2. TEM Analysis

TEM was used to identify the morphology of materials. For measurements, 1 mg of the sample synthesized by modified Hummer methods was dispersed in 10 mL ethanol for 10 min by ultrasonic vibration and then dropped onto the surface of carbon-coated copper grids. Figure 6 shows the TEM images of GO, 1% GO/PVA, and 5% GO/PVA. Figure 6a,b shows the TEM image of pure GO. The translucent part has wrinkled GO layers. Some of the foldable graphene oxide layers are represented by the comparatively dark color area. The images show that graphene oxide is made up of thin and randomly added layers. Figure 6b also belongs to pure GO and shows the smaller number of large particles of GO. The figure demonstrates that GO has a characteristic translucent and flexible layer structure with folds and creases on the outer parts. These thin layers between the large and thick GO seem to connect them. Particles with a size of 200 nm and larger were observed during TEM analysis.
TEM images of 1% GO/PVA and 5% GO/PVA composite are shown in Figure 6c,d, respectively. The polymer present in these samples generated turbidity in the TEM study. The analysis of these two samples reveals that the polymer stopped the sample from delaminating. A TEM picture of the Figure 6d sample indicates that the graphene oxide is distributed as flake-like shapes over the grid. This is because PVA is used. Figure 6d shows the GO under the polymer layer. If you look closely, you can see the thin layers. The tear of the polymer on the left side of the sample shows more clearly that the underlying GO is in the form of a thin layer. However, at higher concentrations, the Van Der Waals forces between the particles bind the GO layers more tightly and lead to the formation of GO agglomerates. This fact is confirmed both in the XRD pattern and in the TEM (Figure 6a,b) images.

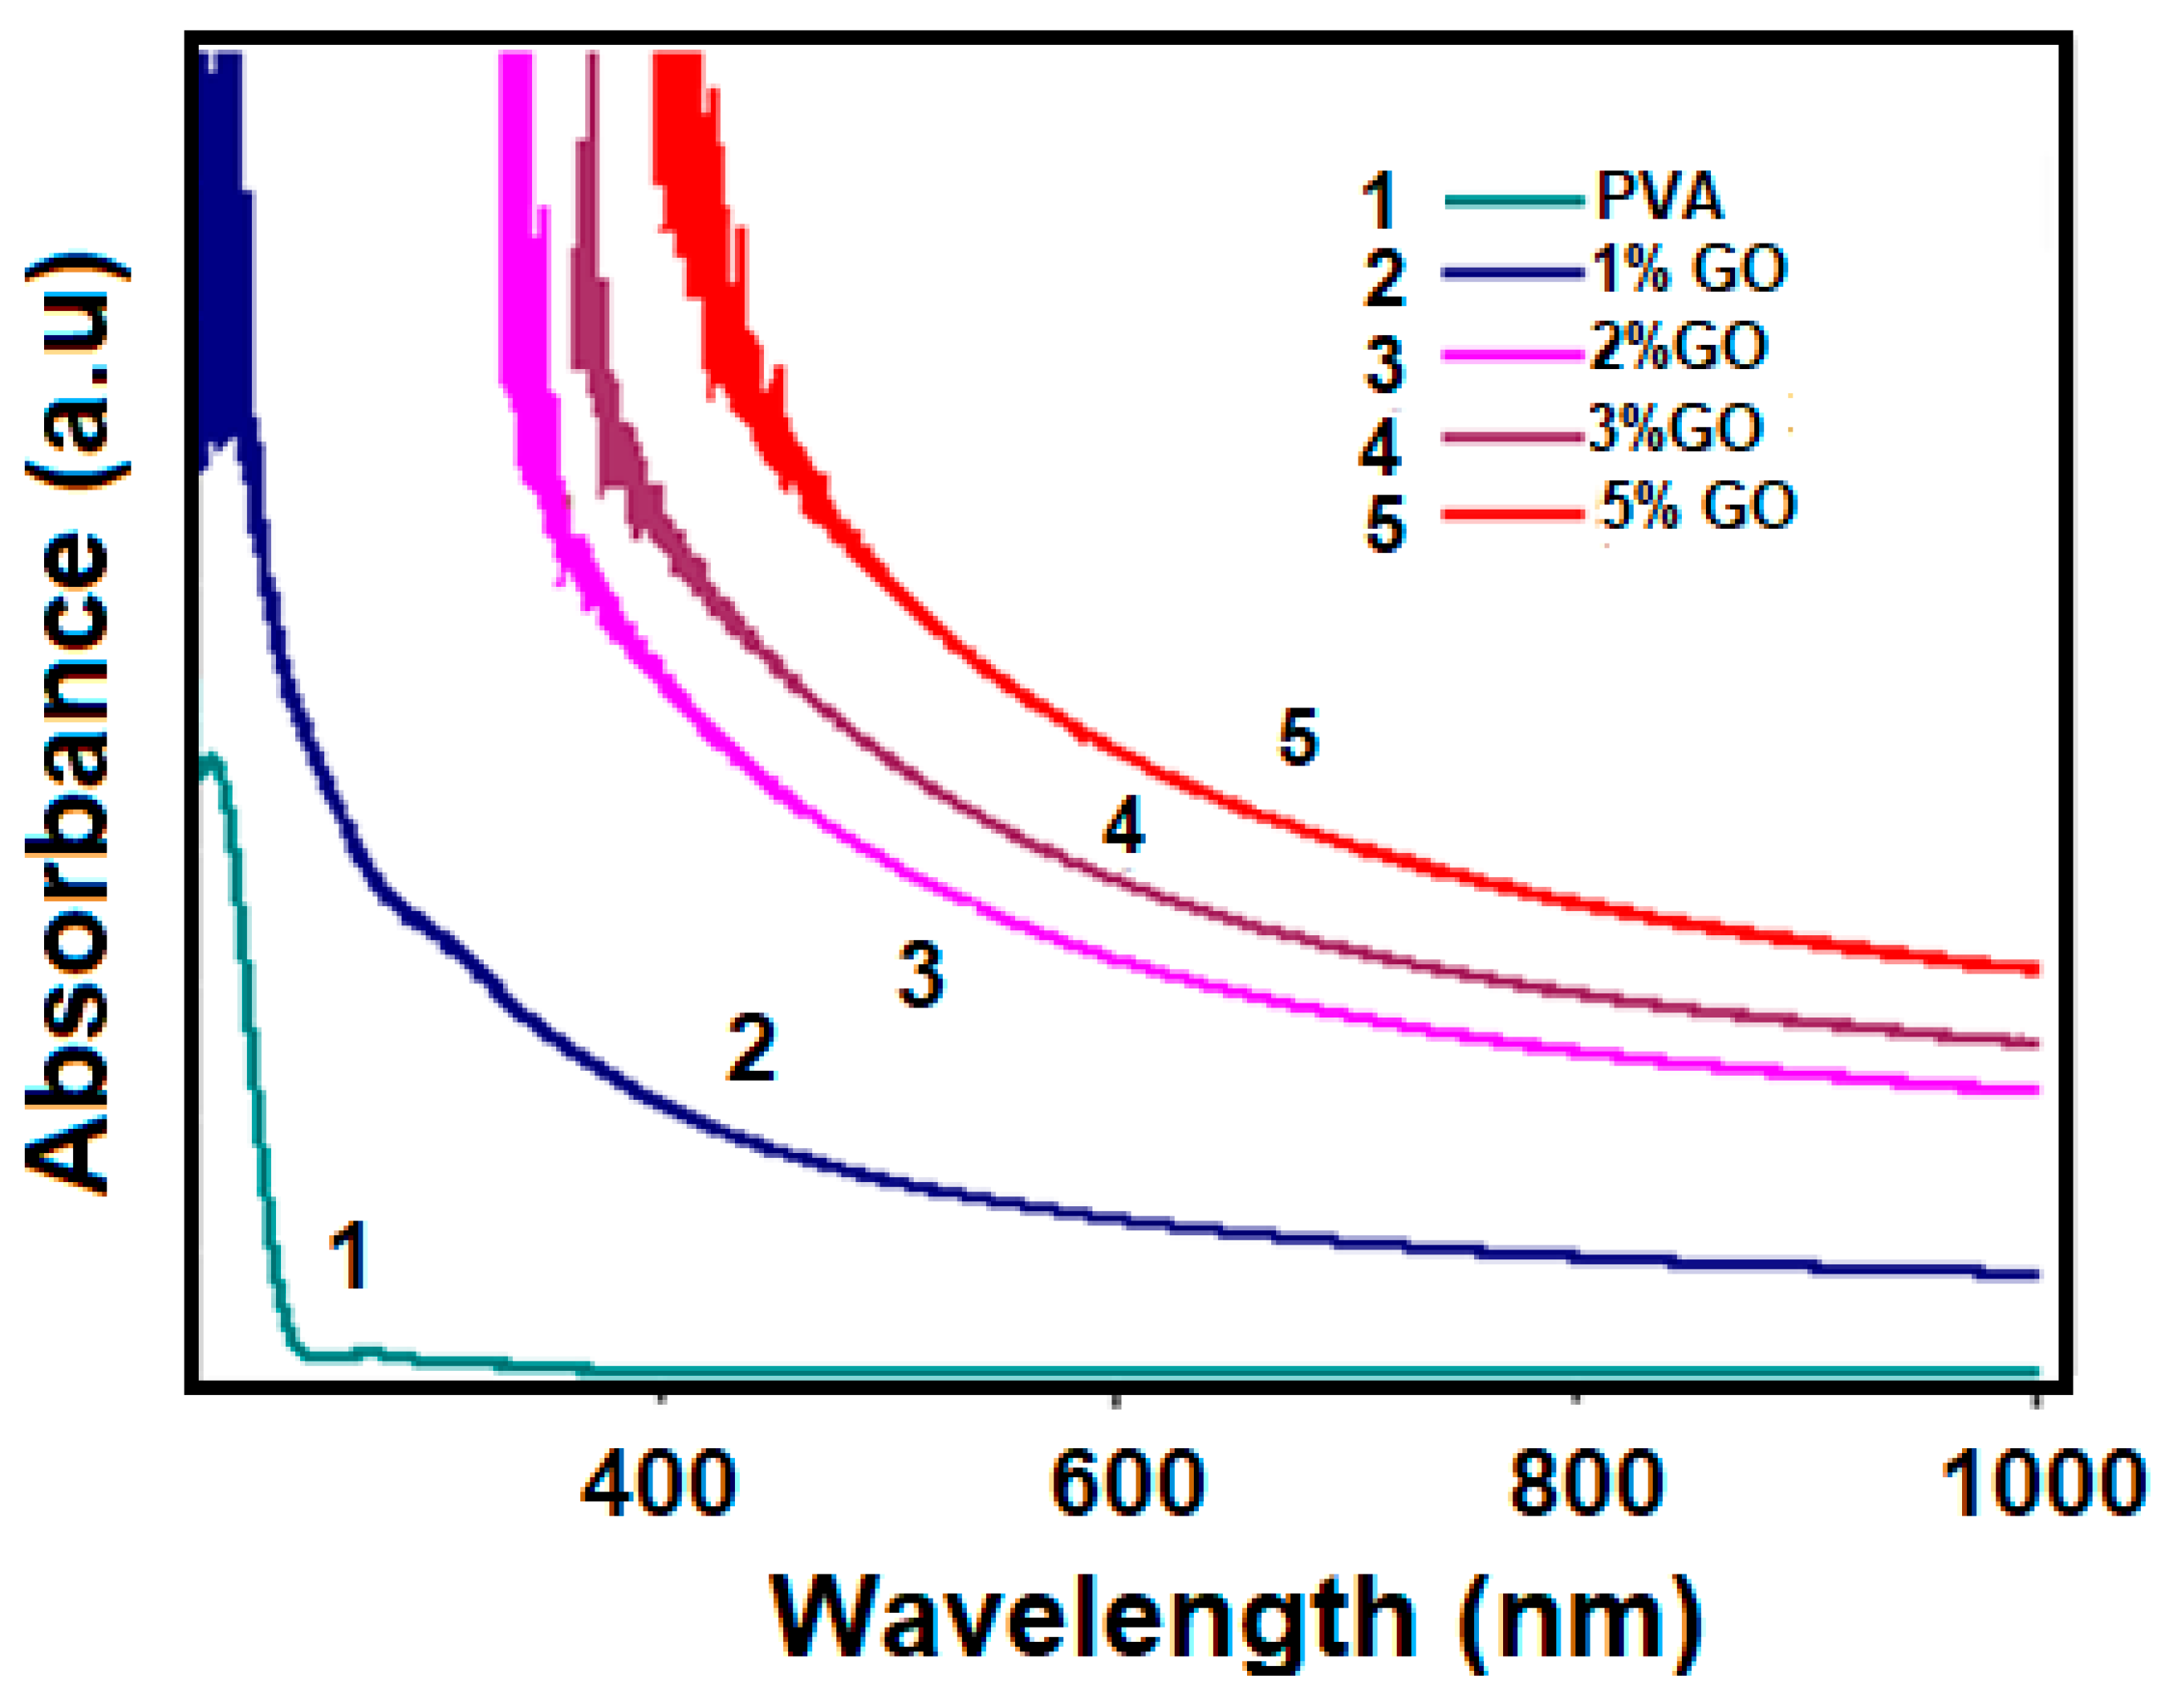
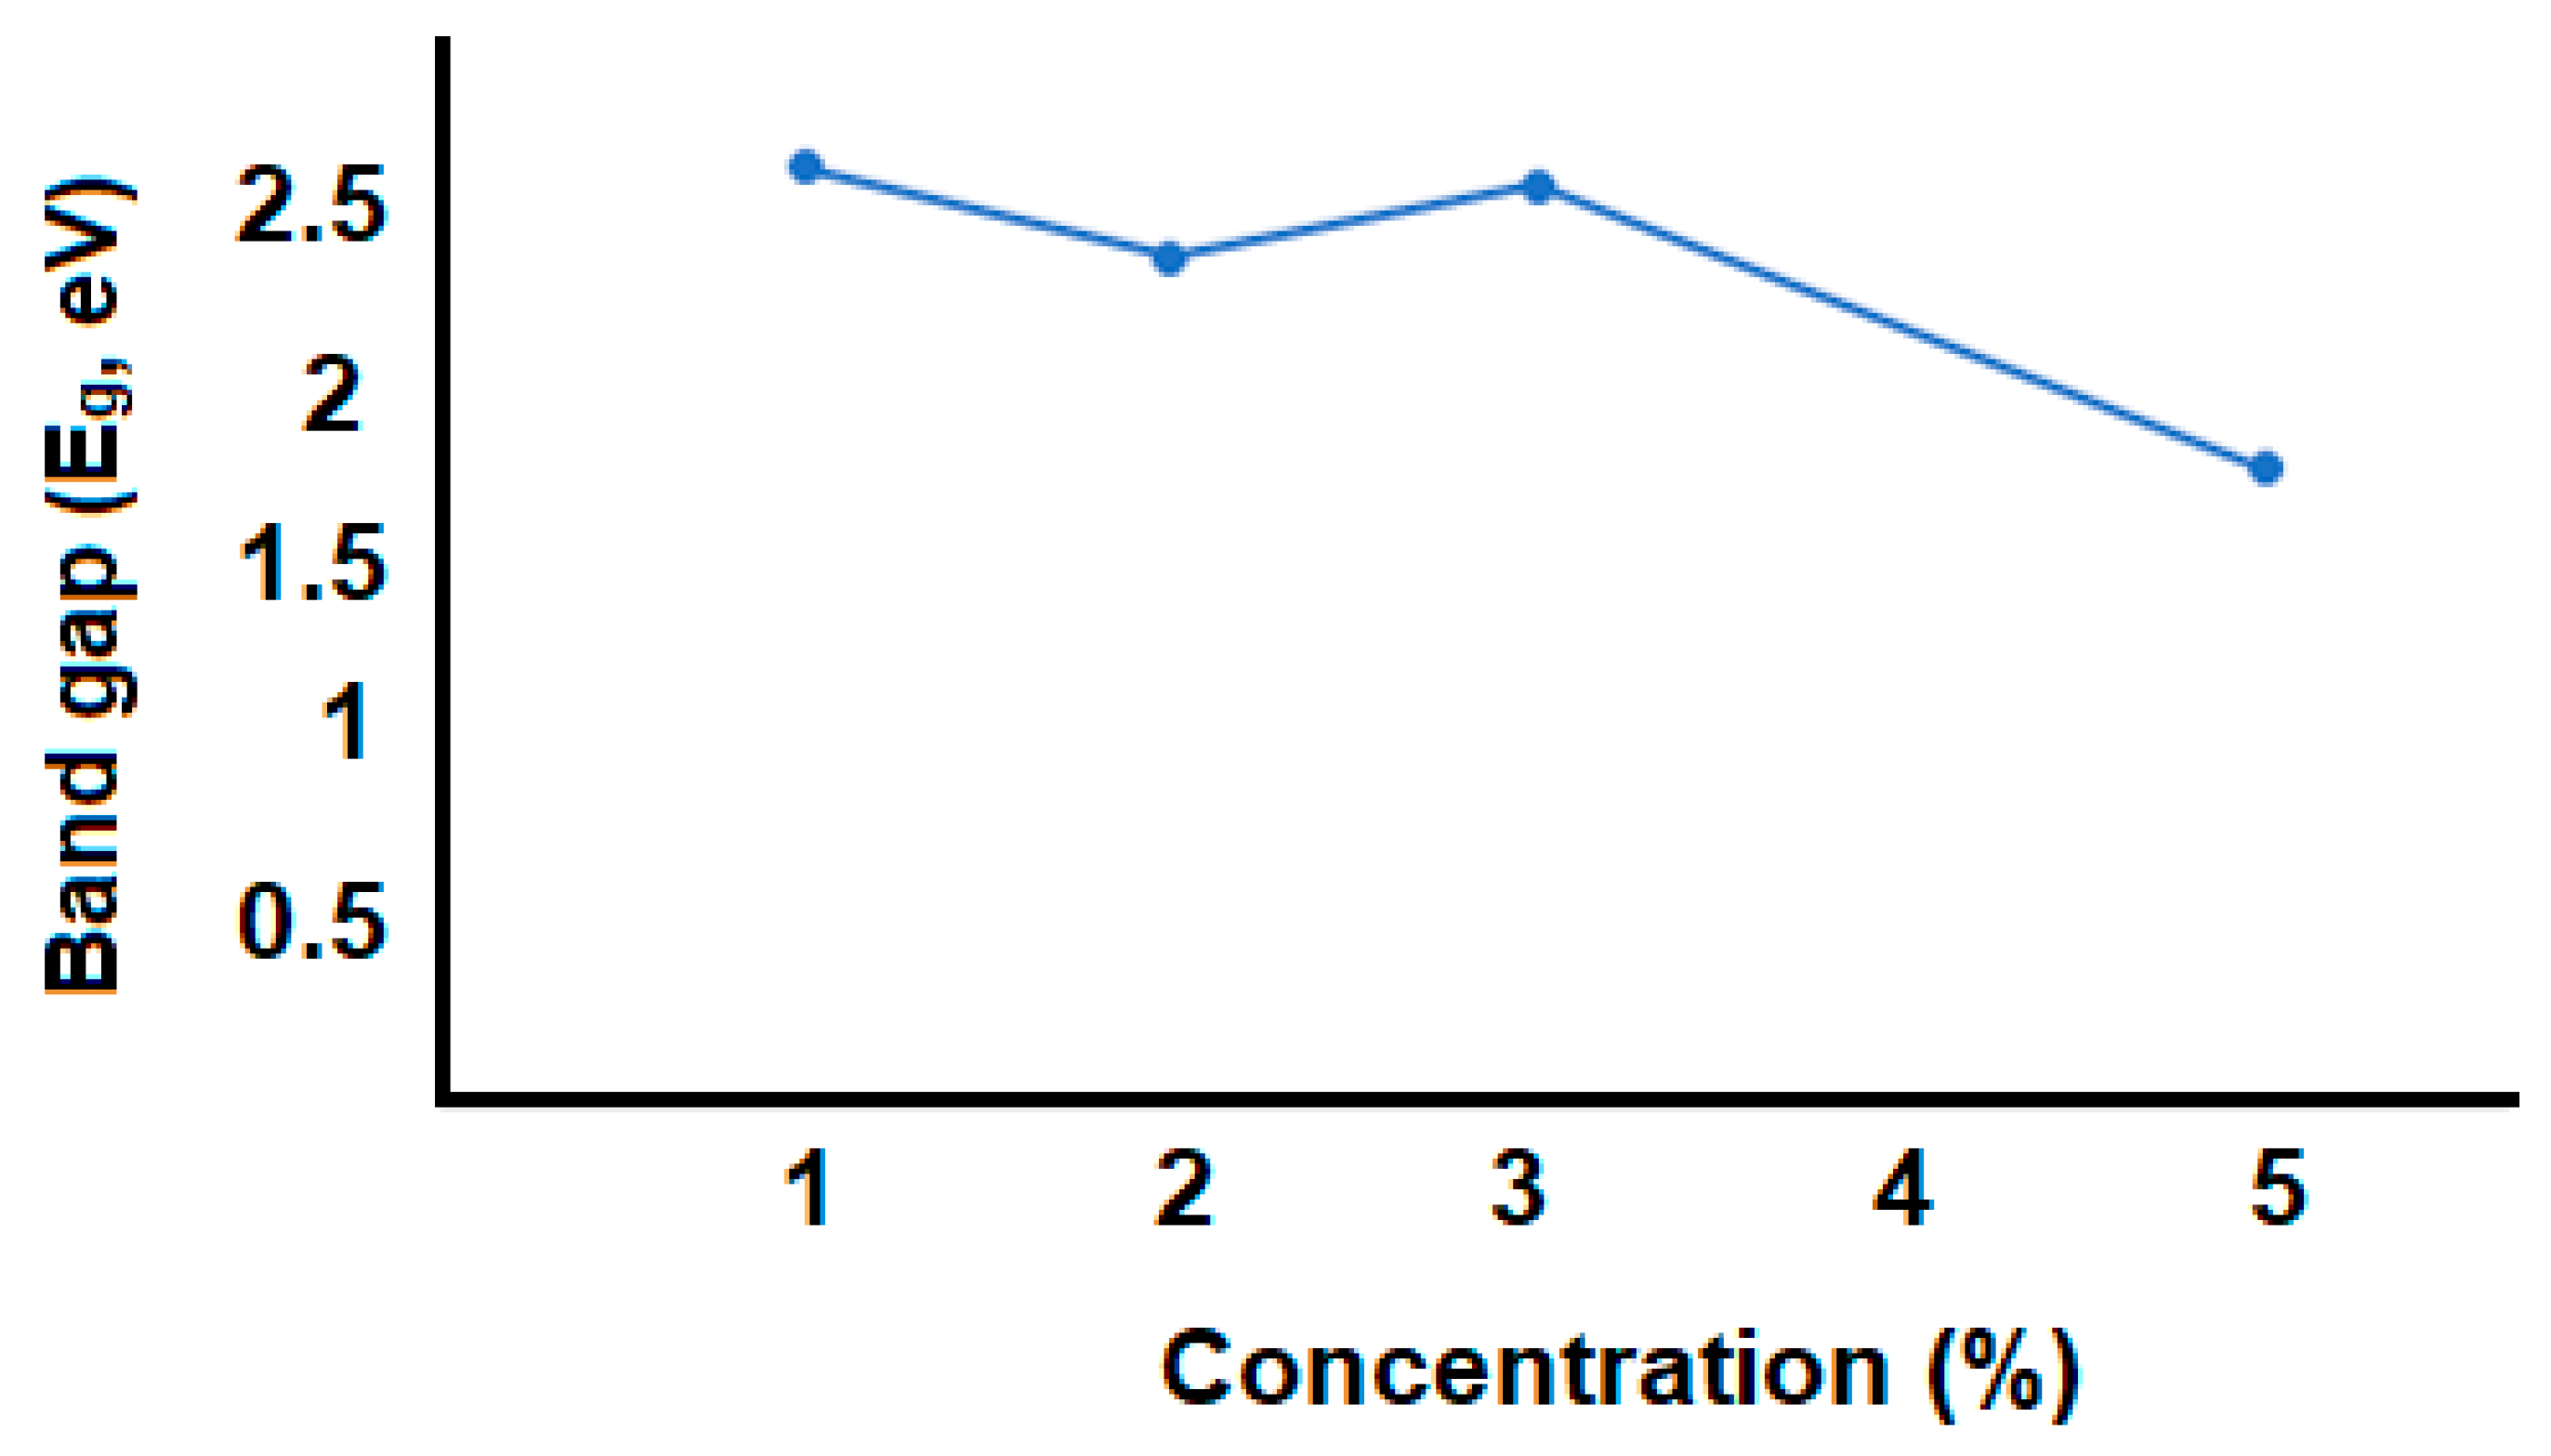
3.3. Optical Properties

The optical characterization of GO/PVA composites with different concentrations was studied by absorption spectrum using a UV-VIS spectrometer. The effect of changing the mass amount (concentration) of GO in GO/PVA composites on the absorption spectrum of these composites was investigated and these spectra are compared in Figure 7.
Absorbance for samples decreases with increasing wavelength, which suggests an indirect band gap. In an indirect band gap material, the absorption of light occurs through a process involving phonon interactions, which require the transfer of both energy and momentum. As the wavelength increases, the likelihood of phonon interactions decreases, resulting in a decrease in absorbance. As is commonly known, PVA is up to 90% translucent. The opacity of GO/PVA nanocomposites is controlled by varying the GO content. This is caused by the formation of intermolecular hydrogen bonds between OH and additional ions. Depending on the amount of GO in the GO/PVA composite, there are changes in the structure of the composite, as well as a difference in the optical properties [33]. Optical absorption increases with increasing GO concentration in nanocomposites, which can be explained by two factors [13]:
  • The homogeneous dispersion of GO nanoparticles allows for efficient UV radiation absorption, turning them to heat [13].
  • UV rays can be dispersed from the interface created by hydrogen bonding between GO/PVA layers [13].
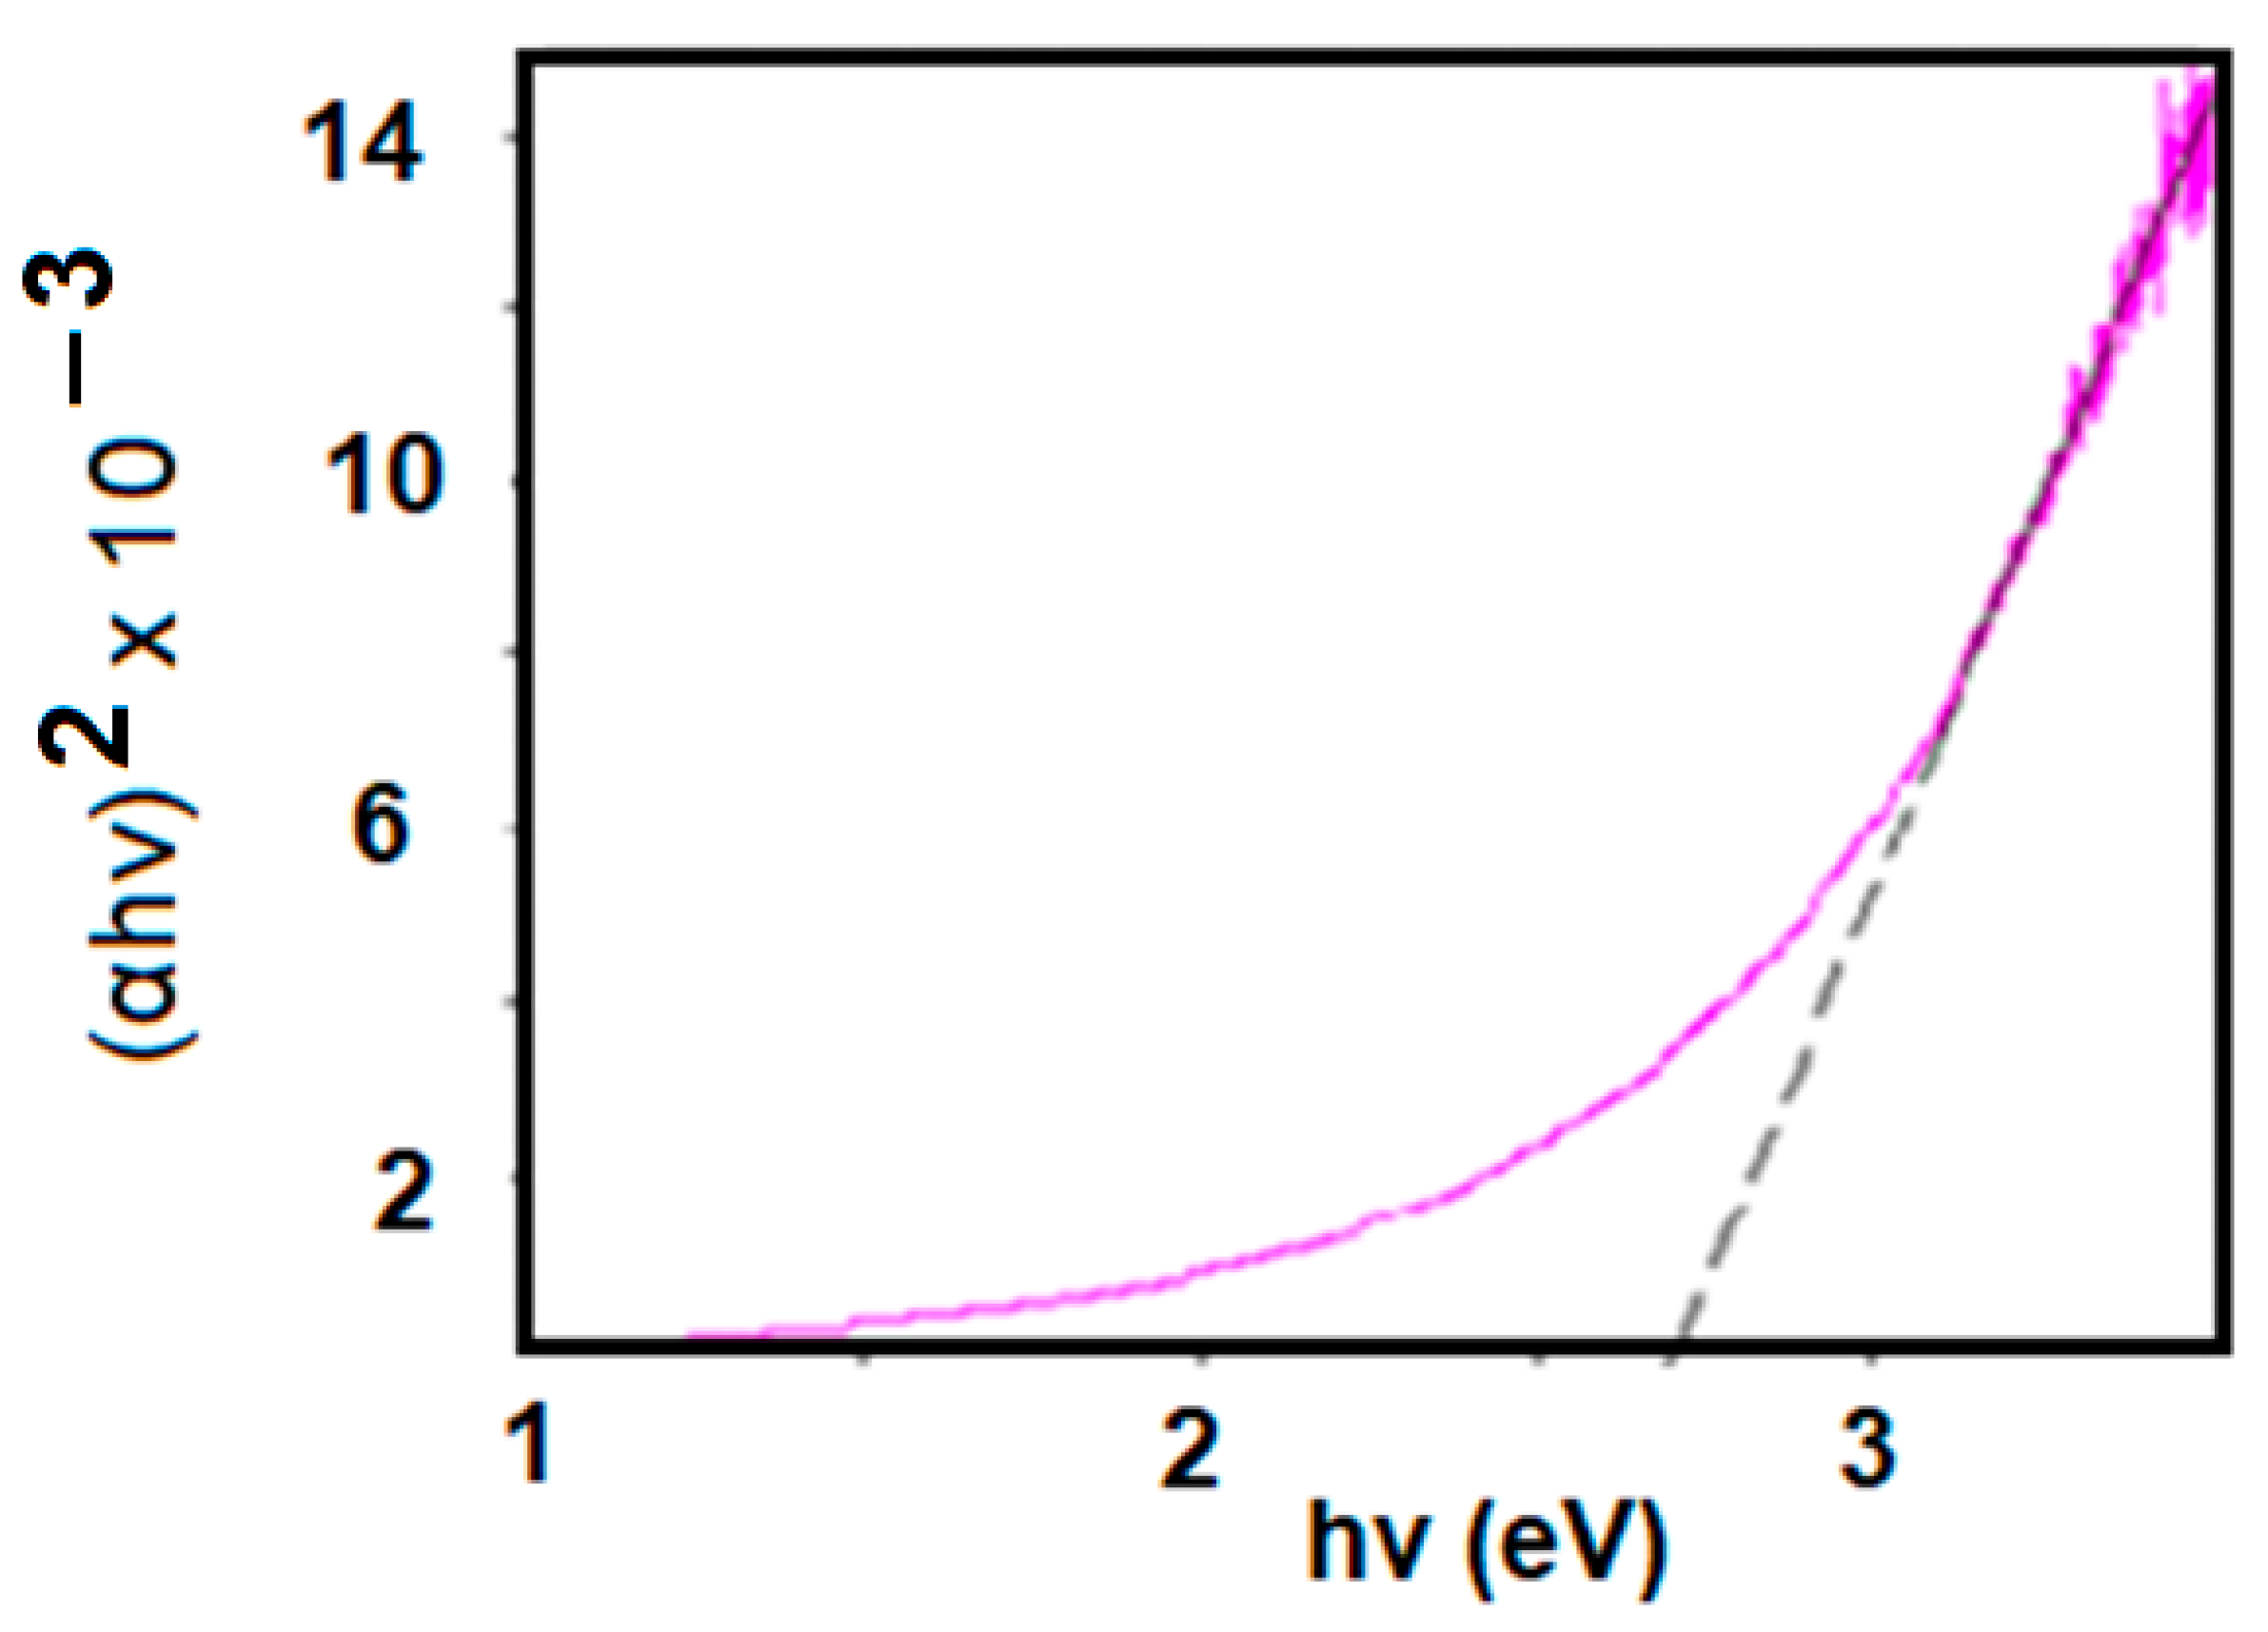
  • UV-VIS analysis for GO/PVA composites with different concentrations, as well as optical methods to determine how the band gap value changes during temperature changes in these composites. The Tauc technique was used to calculate the band gap value.
αhν = β (hν − Eg)ϒ
Here, h is Planck’s constant, β is a sample-structure-dependent constant, Eg is the band gap value, ϒ is an empirical indicator, which contains the corresponding values in straight and oblique transitions, and α is the absorption coefficient, and its value is obtained from the Beer–Lambert formula [13,34].
Figure 8 shows the Eg value obtained from an absorption spectrum of 3% GO/PVA [1].
The Eg value of PVA and GO is 6.27 eV [35] and 2.2 eV [36], respectively. The conducted measurements show that the Eg value of GO/PVA nanocomposites varies depending on the concentration of GO. This dependence is presented in Table 1.
It is also known from the scientific literature that during the formation of composites based on GO/PVA, polymer molecules enter between GO layers [27]. During this process, both the structure of the composite and the size of the GO particles are affected. Thus, with the increase in temperature, nanostructures with a large size grow by combining smaller size particles with themselves.
GO/PVA nanocomposites with different concentrations were subjected to thermal treatment, and UV-Vis spectra were studied. Table 2 shows the variation of the Eg value for GO/PVA materials with 2% concentration depending on thermal annealing.
As shown in Table 2, the band gap value diminishes when increasing thermal annealing temperature. The cause for this is that the polymer’s mobility increases as the temperature of thermal annealing rises, making aggregation processes easier. As a result, the size of the particles increases. As a result, the band gap value decreases.
The influence of concentration on optical characteristics was investigated in scientific research by plotting the percentage of GO in the chitosan-GO composite material as a function of the Eg value [37]. Figure 9 depicts the concentration and band gap value dependence of GO/PVA nanocomposite material.
As seen in Figure 9, Eg decreased, then increased, and then decreased with increasing concentration. This change depends on several factors. These factors depend on the composition of the GO/PVA nanocomposite material, the interaction and bonding of the GO and PVA polymer matrix, the changes in the structure depending on the amount of concentration, and the defects present in the structure. First of all, depending on the percentage of GO in the PVA polymer matrix, changes can occur in the electronic properties of the composite material. At the same time, bonding and electronic configurations alter the band structure and subsequently affect the Eg value. The arrangement and orientation of GO sheets or layers within the PVA matrix can influence the electronic properties, including the band gap. Different levels of defects at varying concentrations of GO could contribute to the observed variations in the band gap values.

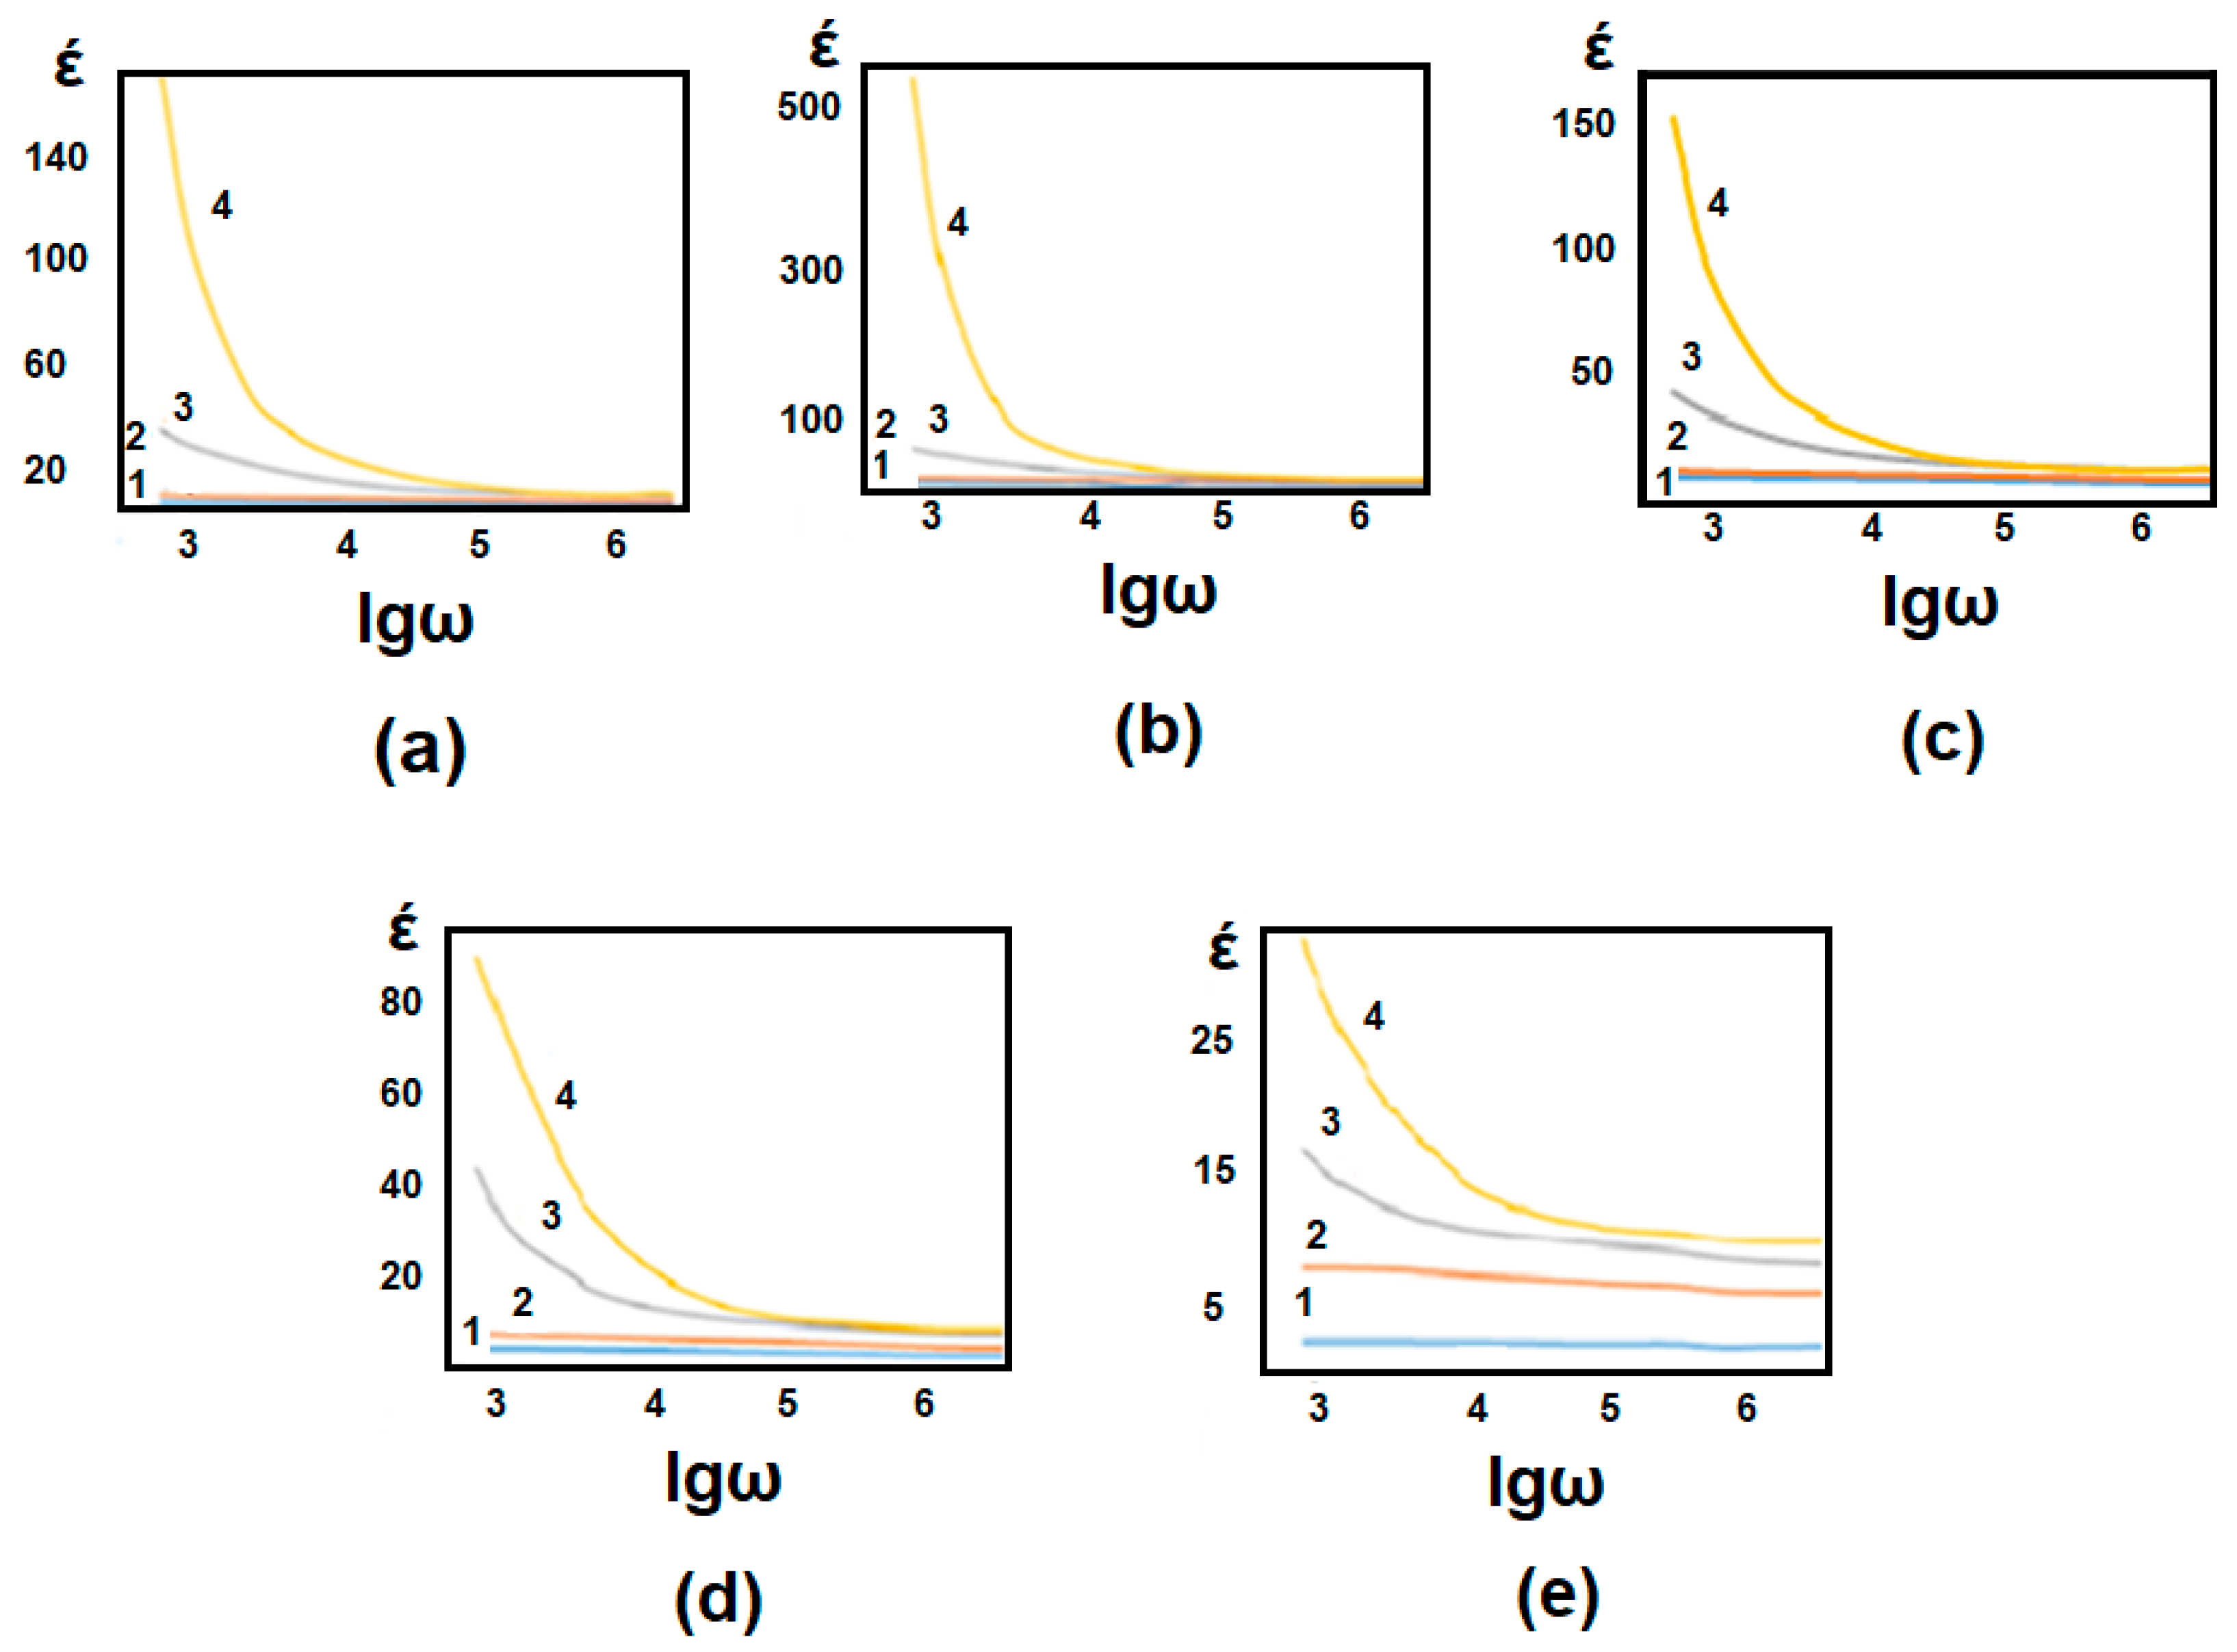
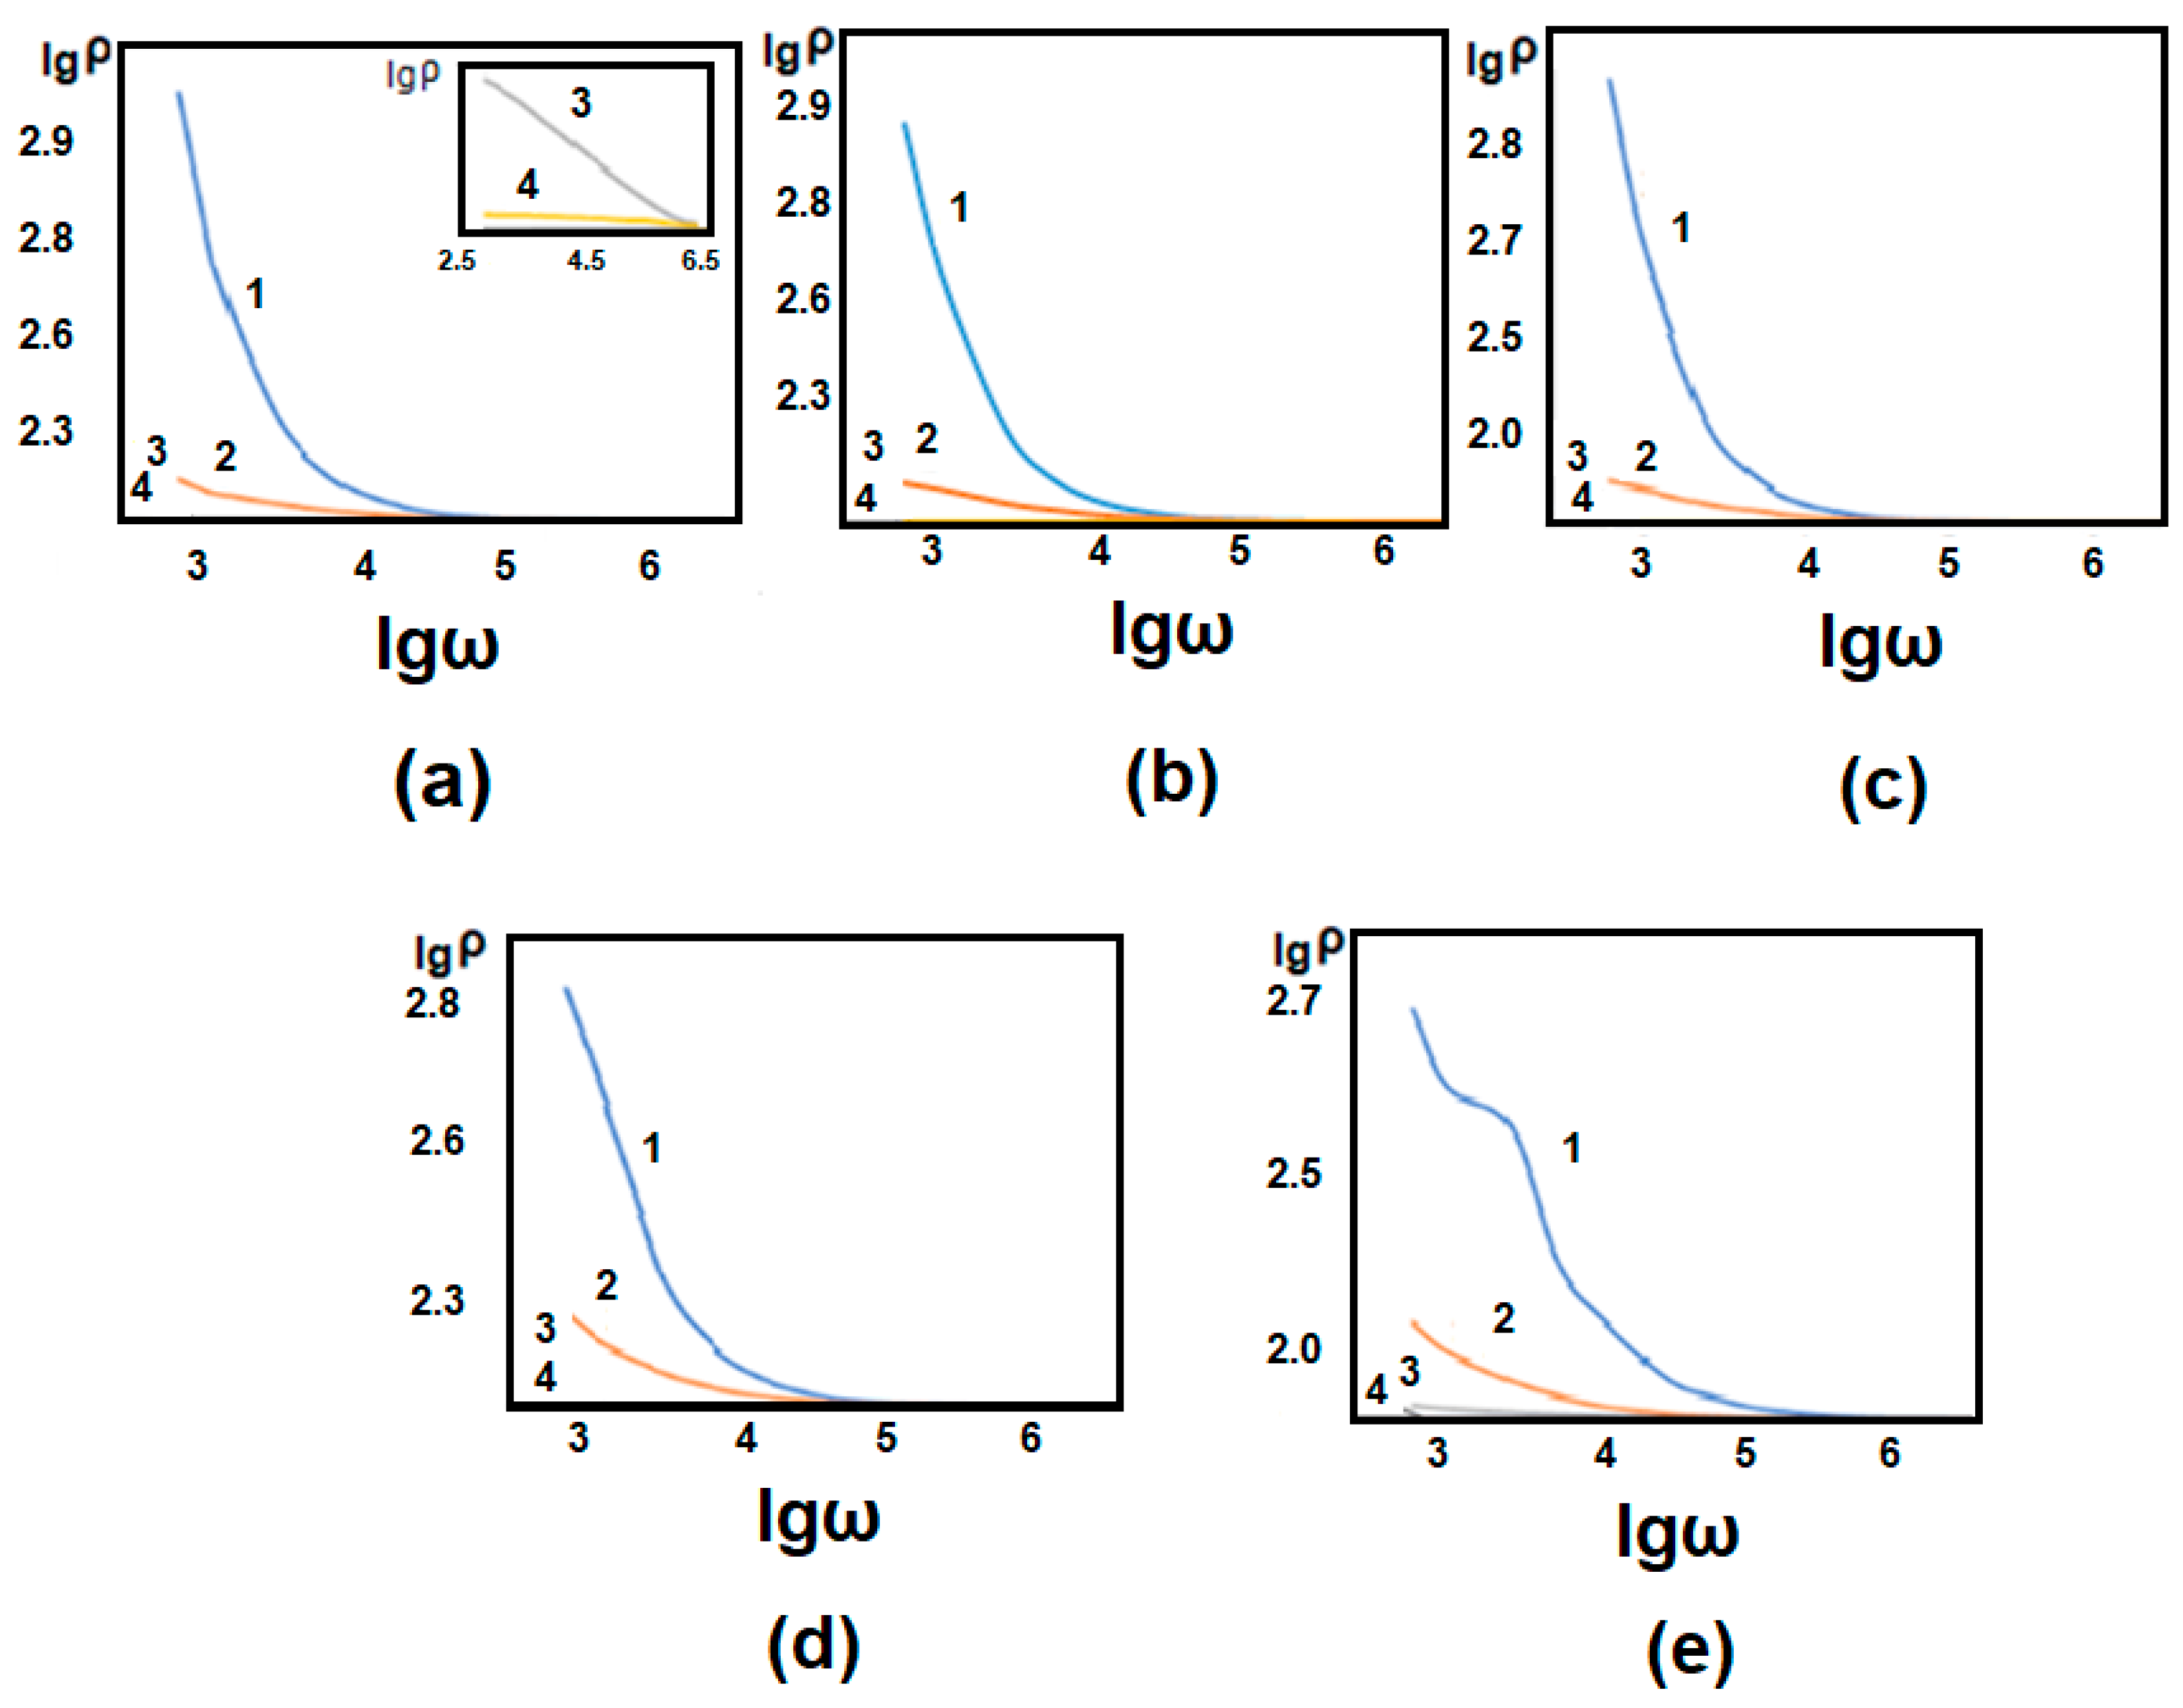
3.4. Electrical Properties
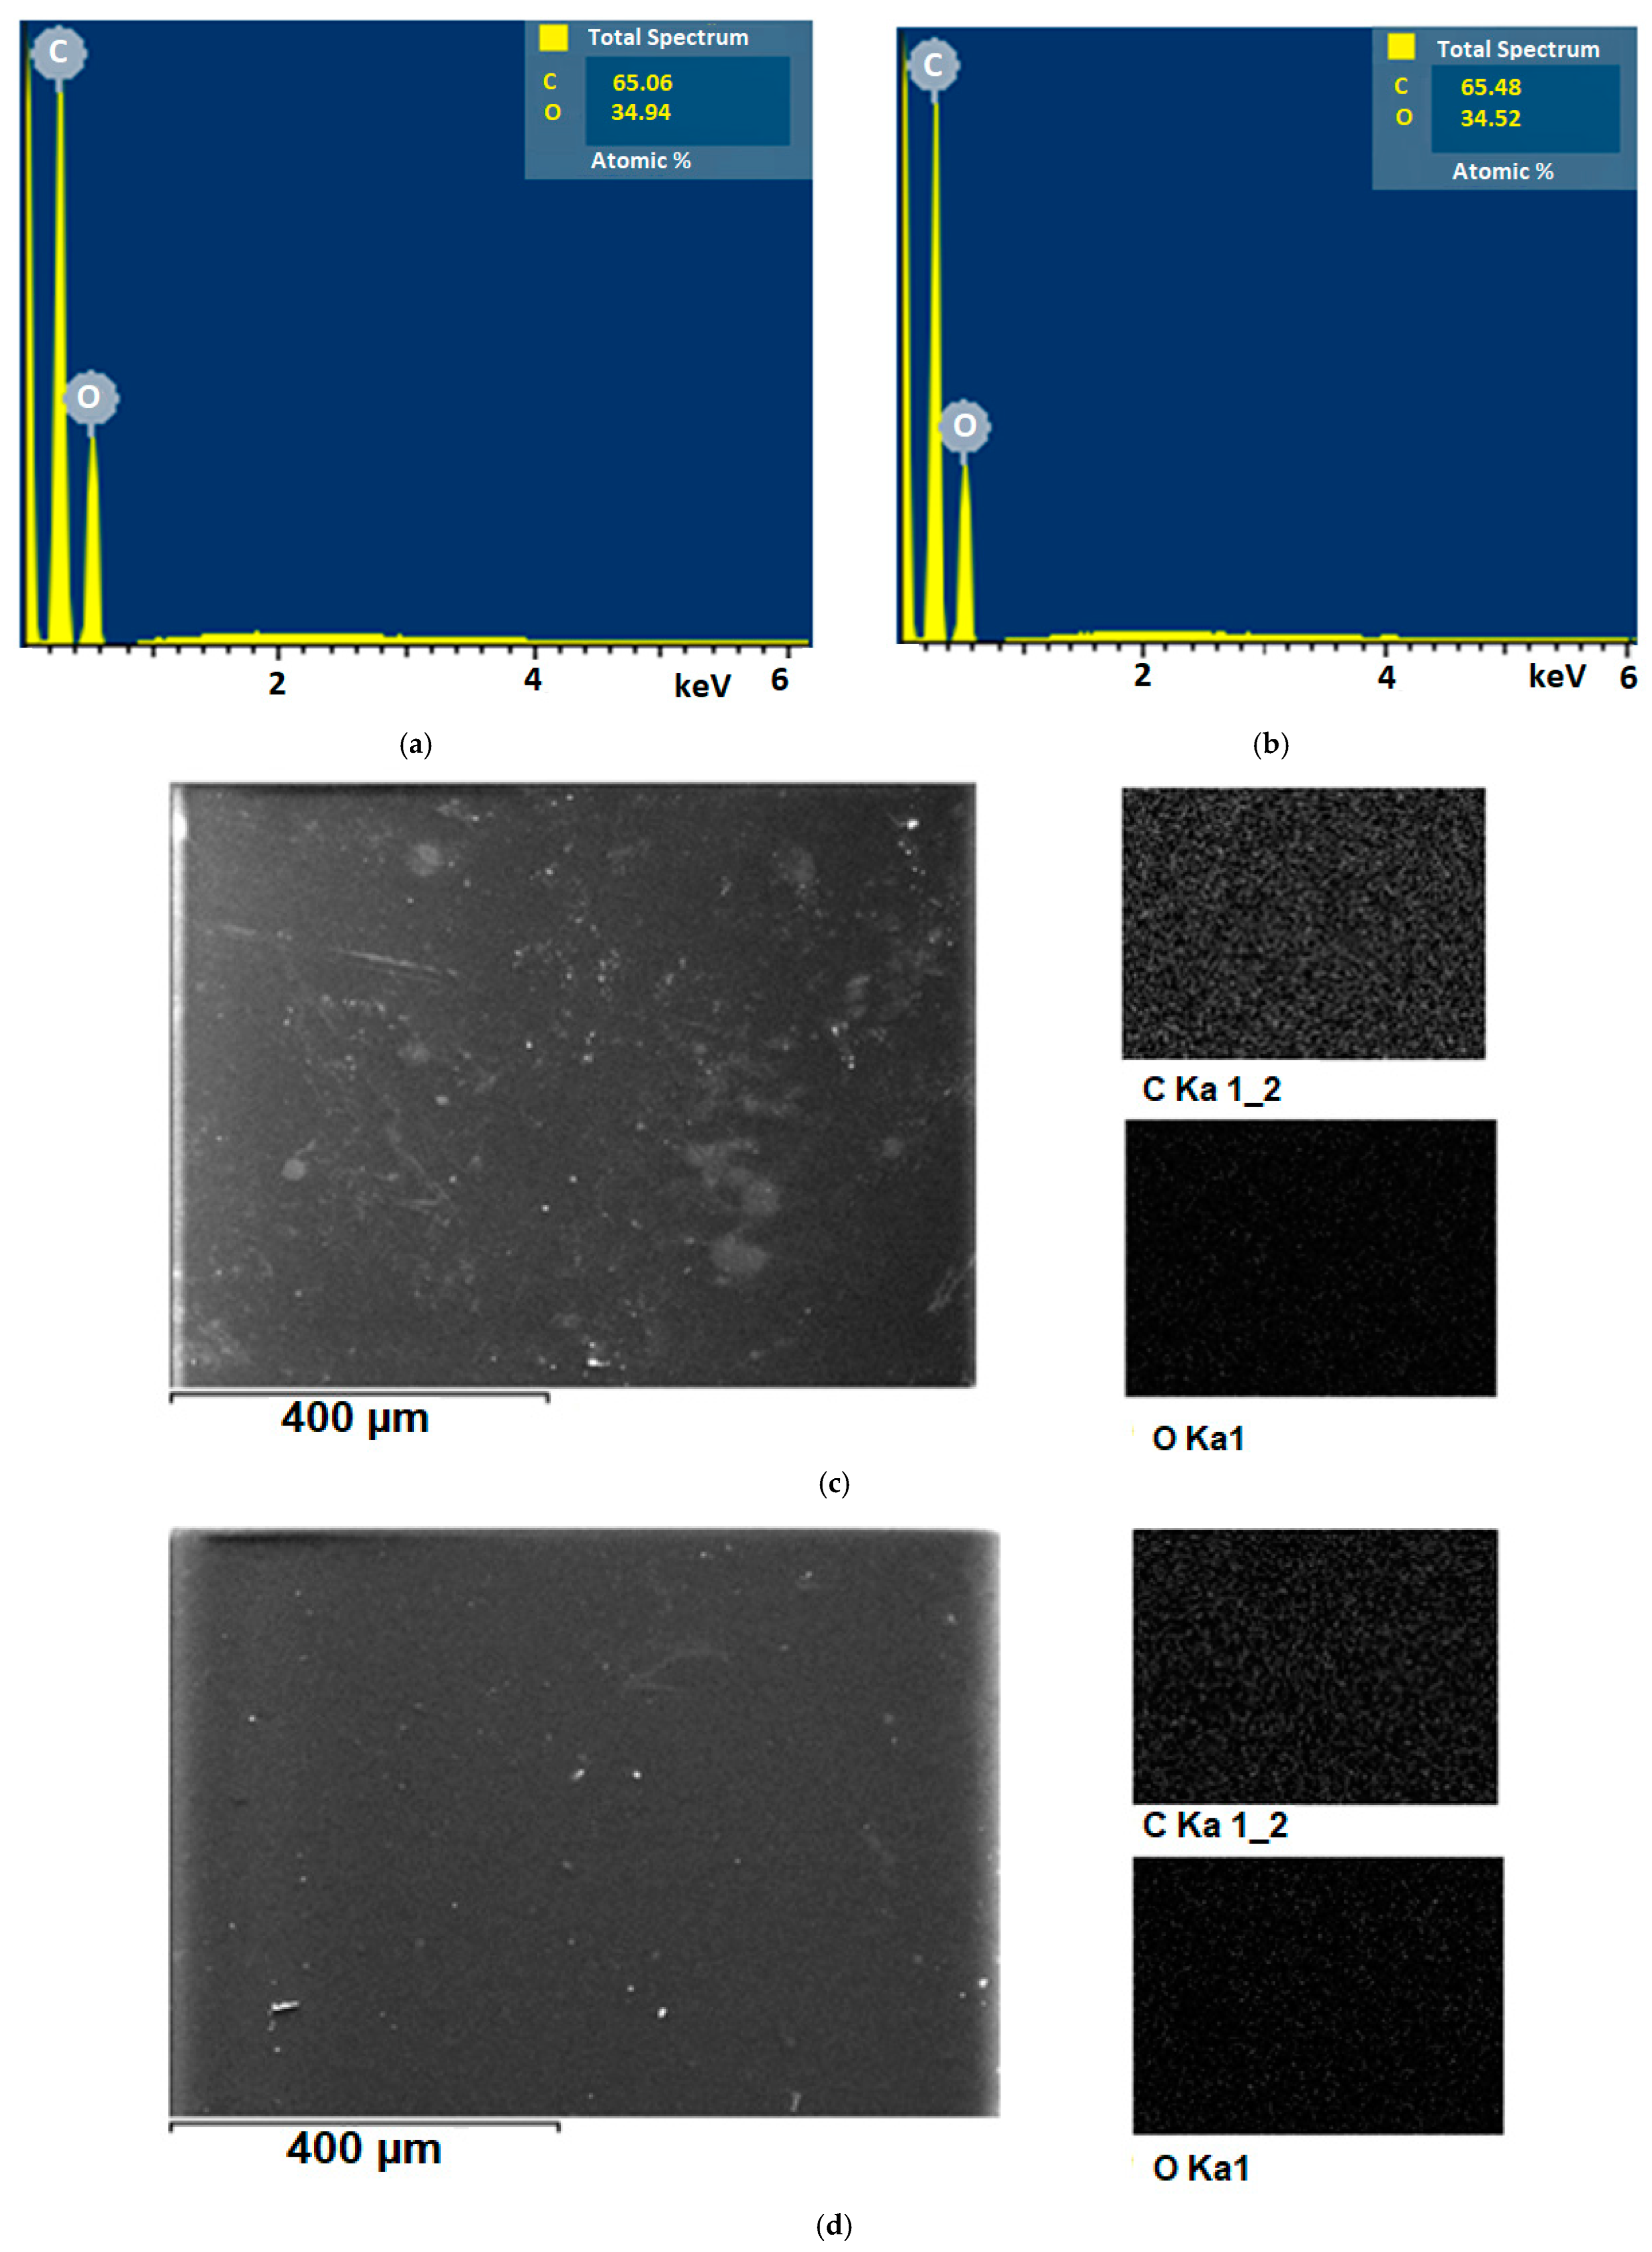
Dependence of the dielectric constant of 1% (a), 2% (b), 3% (c), 5%(d), and 20% (e) concentrated GO/PVA composite on the logarithmic value of electric field frequency and the frequency dependence of the specific resistance of the GO/PVA nanocomposite with different concentrations of GO. Figure 10 and Figure 11 illustrate temperature measurements at various temperatures.
1 − T = 25 °C; 2 − T = 40 °C; 3 − T = 70 °C; 4 − T = 110 °C.
Figure 10a–e shows the dependence of the dielectric constant of the GO/PVA composite with a concentration of 1, 2, 3, 5%, and 20% on the logarithmic value of the frequency of the electric field at different measurement temperatures. During the dielectric measurements, different concentrated composites were heated to certain temperatures (T = 25 °C; T = 40 °C; T = 70 °C; T = 110 °C) and measured. The mentioned temperatures indicated the measurement temperature during the analysis, not the temperature of thermal annealing.
The value of the log of electric field frequency of dielectric constant of GO/PVA composite with 1% concentration at various measurement temperatures (24 °C, 40 °C, 70 °C, and 110 °C) dependence is demonstrated in Figure 10a. The dielectric constant is the greatest at high temperatures, as can be observed from the results. With decreasing temperature, the value of the dielectric constant decreases as a rule. The decreases are also paid for by other concentrations (2%, 3%, 5%, and 20%). This is because during the increase in temperature during sample heating, the elasticity of the polymer chain increases, the intermolecular bond weakens, and the orientation of dipoles in the matrix in the electric field becomes easier due to low temperatures [38,39]. It may be related to the influence of thermal vibrations and the reduction of charge carrier mobility. At higher temperatures, thermal energy increases the amplitude of molecular vibrations in the GO/PVA. These vibrations can disrupt the alignment of dipoles within the composite, leading to a higher dielectric constant. As the temperature decreases, the thermal energy decreases, resulting in reduced vibrational motion and a corresponding decrease in the dielectric constant. At higher temperatures, thermal energy can increase the mobility of charge carriers, leading to enhanced polarization effects and a higher dielectric constant. As the temperature decreases, the mobility of charge carriers decreases, reducing the overall dielectric constant.
As can be seen from the graphs, the largest values of the dielectric constant correspond to the low frequencies of the electric field. It also has enough time for the dipoles to rotate in the direction of the electric field at small values of the frequency of the electric field, but with the increase of the frequency, the dipoles cannot follow the polarization [39,40]. As a result, the value of the dielectric constant is naturally lower.
At room temperature, the dielectric constant had the least value; however, when the temperature increased, the dielectric constant value grew as a rule. PVA is a polar polymer. The mobility of polar molecules increased under the impact of temperature, which enhanced polarization and raised the dielectric constant’s value. Because of the temperature, Brownian motion cannot produce chaos due to the strength of the electric field.
The specific resistance of composites diminishes with rising temperatures, as shown in Figure 11. As the GO content in the samples rises, the specific resistance decreases. This is due to GO being more conductive than PVA. As in dielectric measurements, also, here, the mentioned temperature is the measurement temperature, not the thermal annealing temperature.
As a result, it can be summarized that annealing at elevated temperatures can facilitate the reduction of functional groups of GO, resulting in increased electrical conductivity and a decrease in specific resistance. At the same time, the temperature influence caused by structural reorganization within the GO/PVA composite can result in greater alignment and connection of the GO sheets, which optimizes charge pathways and reduces resistance. As a result of the reduction of defects enhances charge carrier mobility and conductivity, resulting in a decrease in specific resistance.

3.5. EDS Analysis

EDS investigations of 1% GO/PVA and 5% GO/PVA nanocomposites were performed to study the dispersion of GO in the PVA matrix at varying mass percentages. Figure 12 depicts the samples’ EDS spectra and element mapping.
The elemental analysis of 1% GO/PVA nanocomposites is shown in Figure 12a. Carbon has an atomic percentage of 65.06% and oxygen has an atomic percentage of 34.94%. The elemental analysis of 5% GO/PVA nanocomposites is shown in Figure 12b. Carbon has an atomic percentage of 65.48% and oxygen has an atomic percentage of 34.52%. Based on the results, no further elements were found. As can be seen, both samples are chemically clean. Because of the high percentage amount of GO added to the PVA matrix, the atomic percentage amount of carbon elements in 5% GO/PVA nanocomposite is relatively higher than the atomic percentage amount of carbon elements in 1% GO/PVA nanocomposite.
Elemental mapping of 1% GO/PVA nanocomposite (Figure 12c) and 5% GO/PVA nanocomposite (Figure 12d) reveals that C and O elements are uniformly distributed on the PVA polymer matrix’s surface.

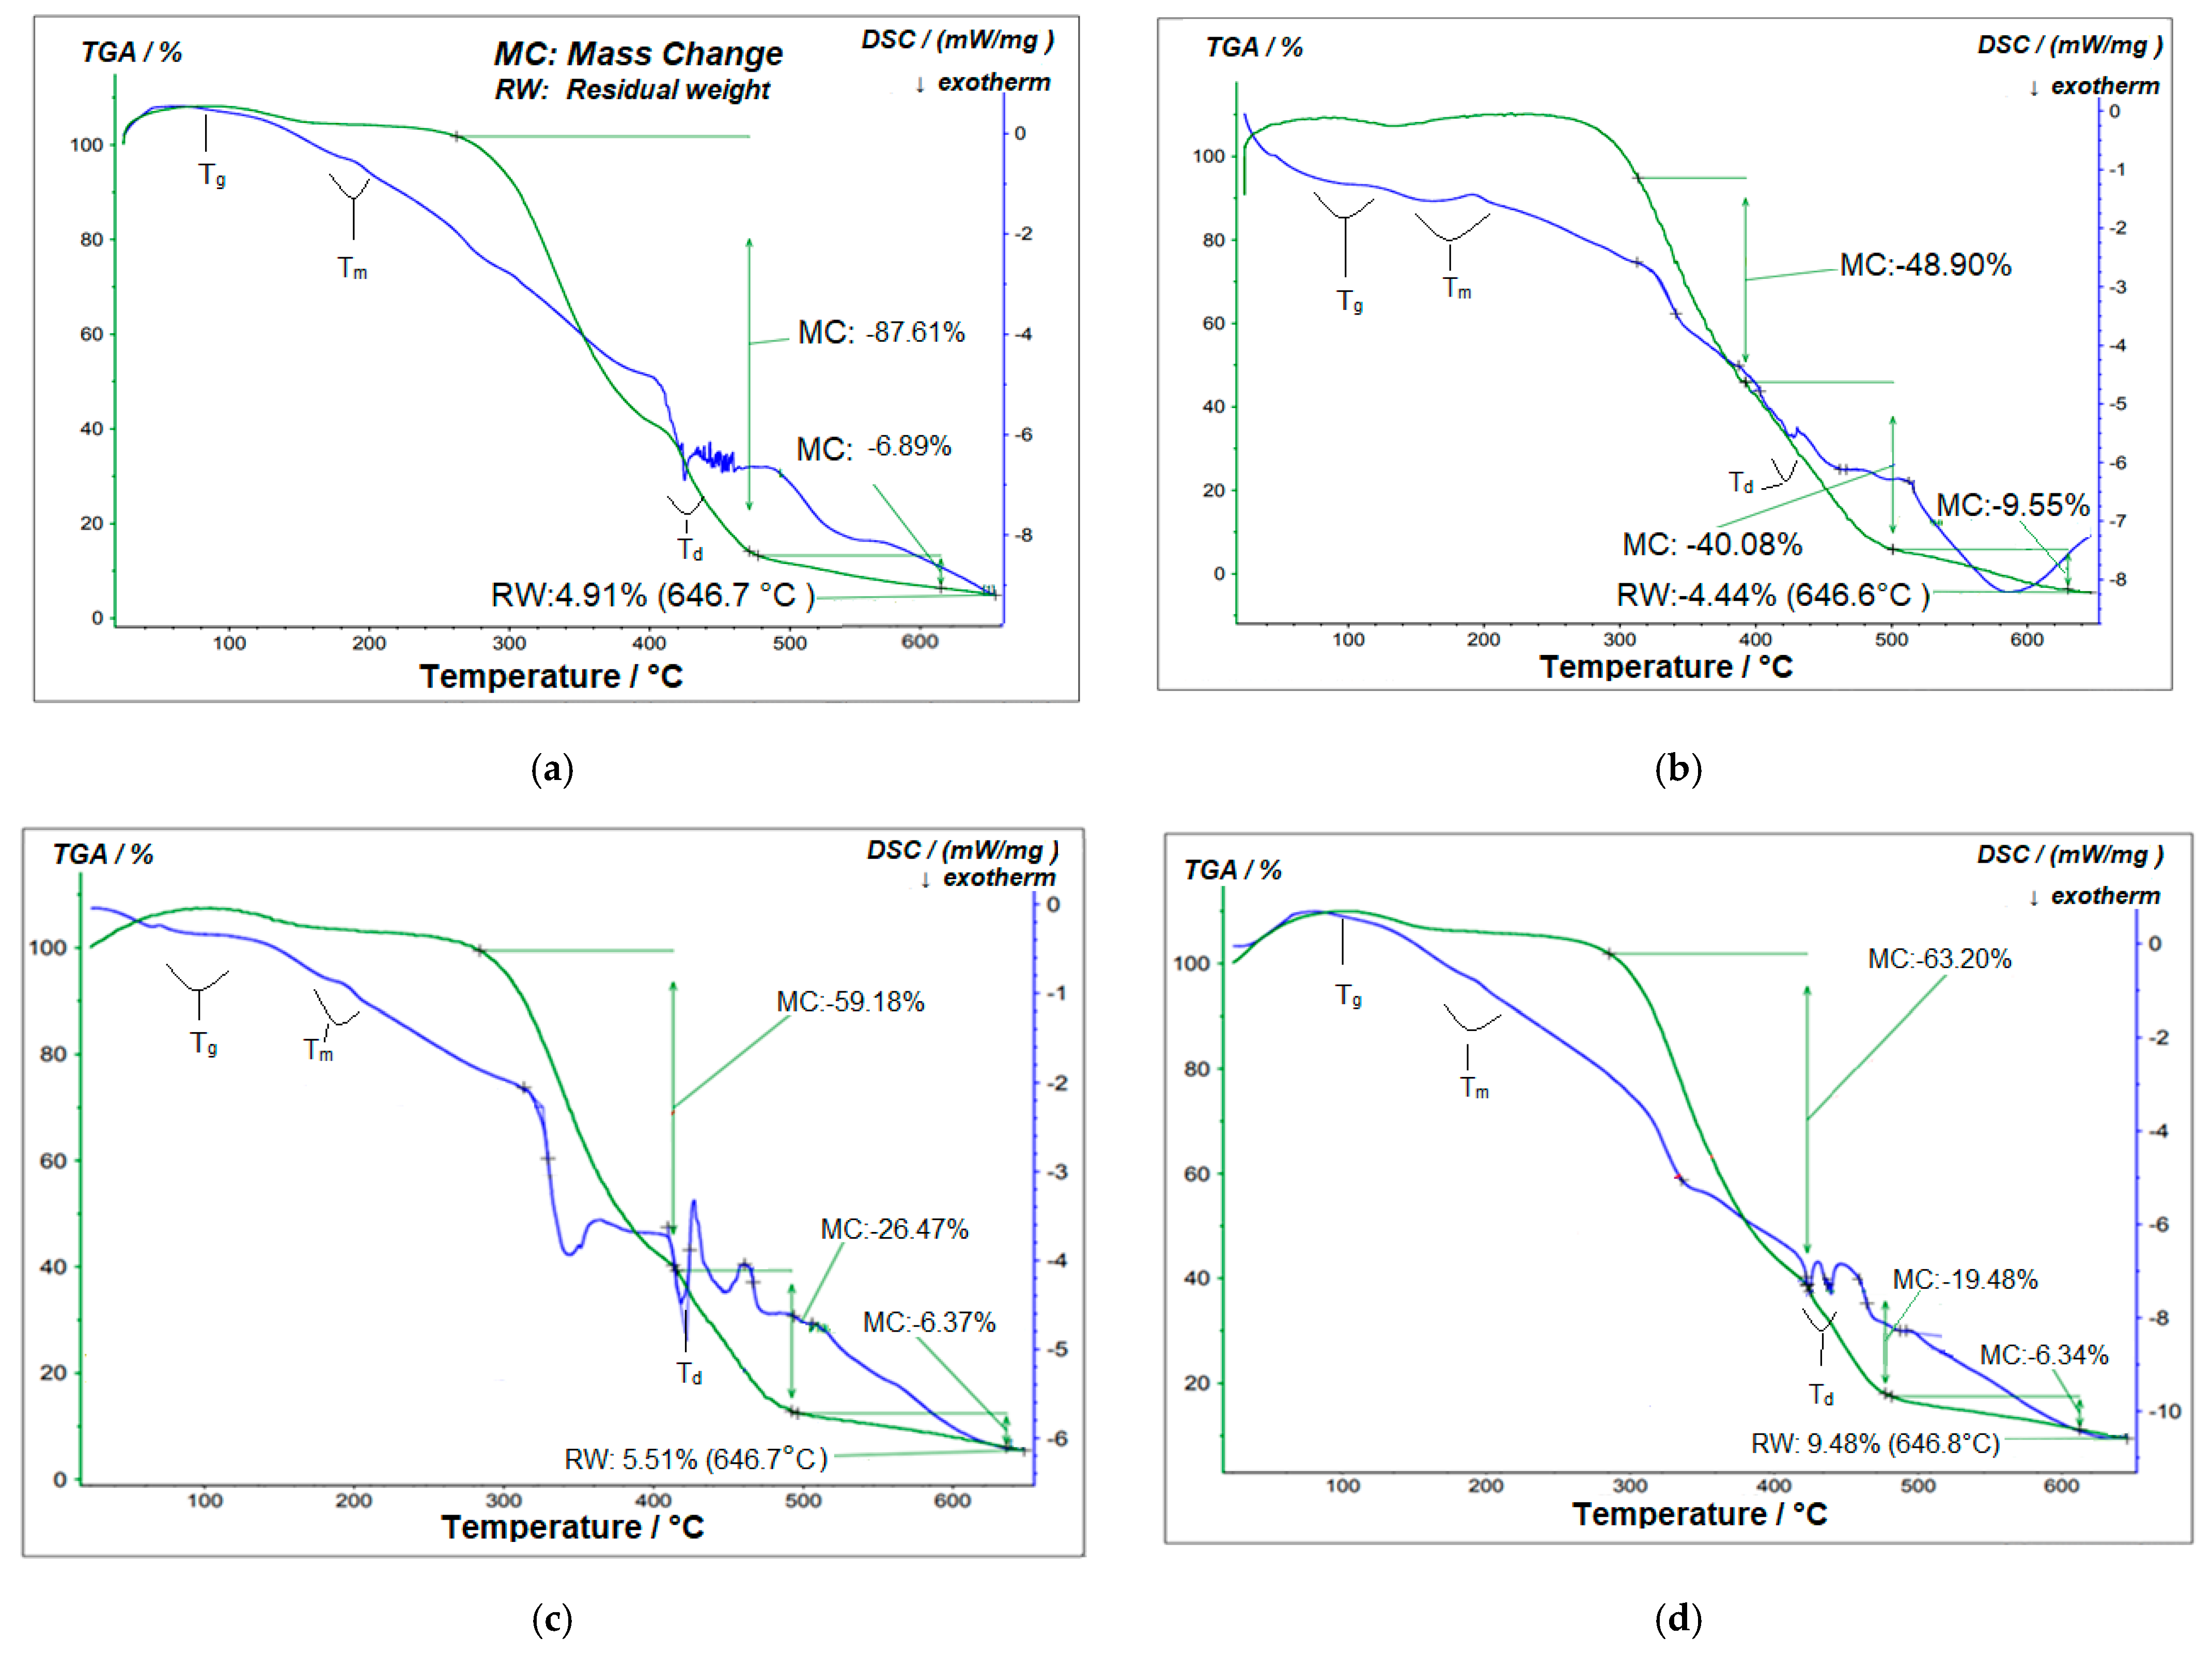
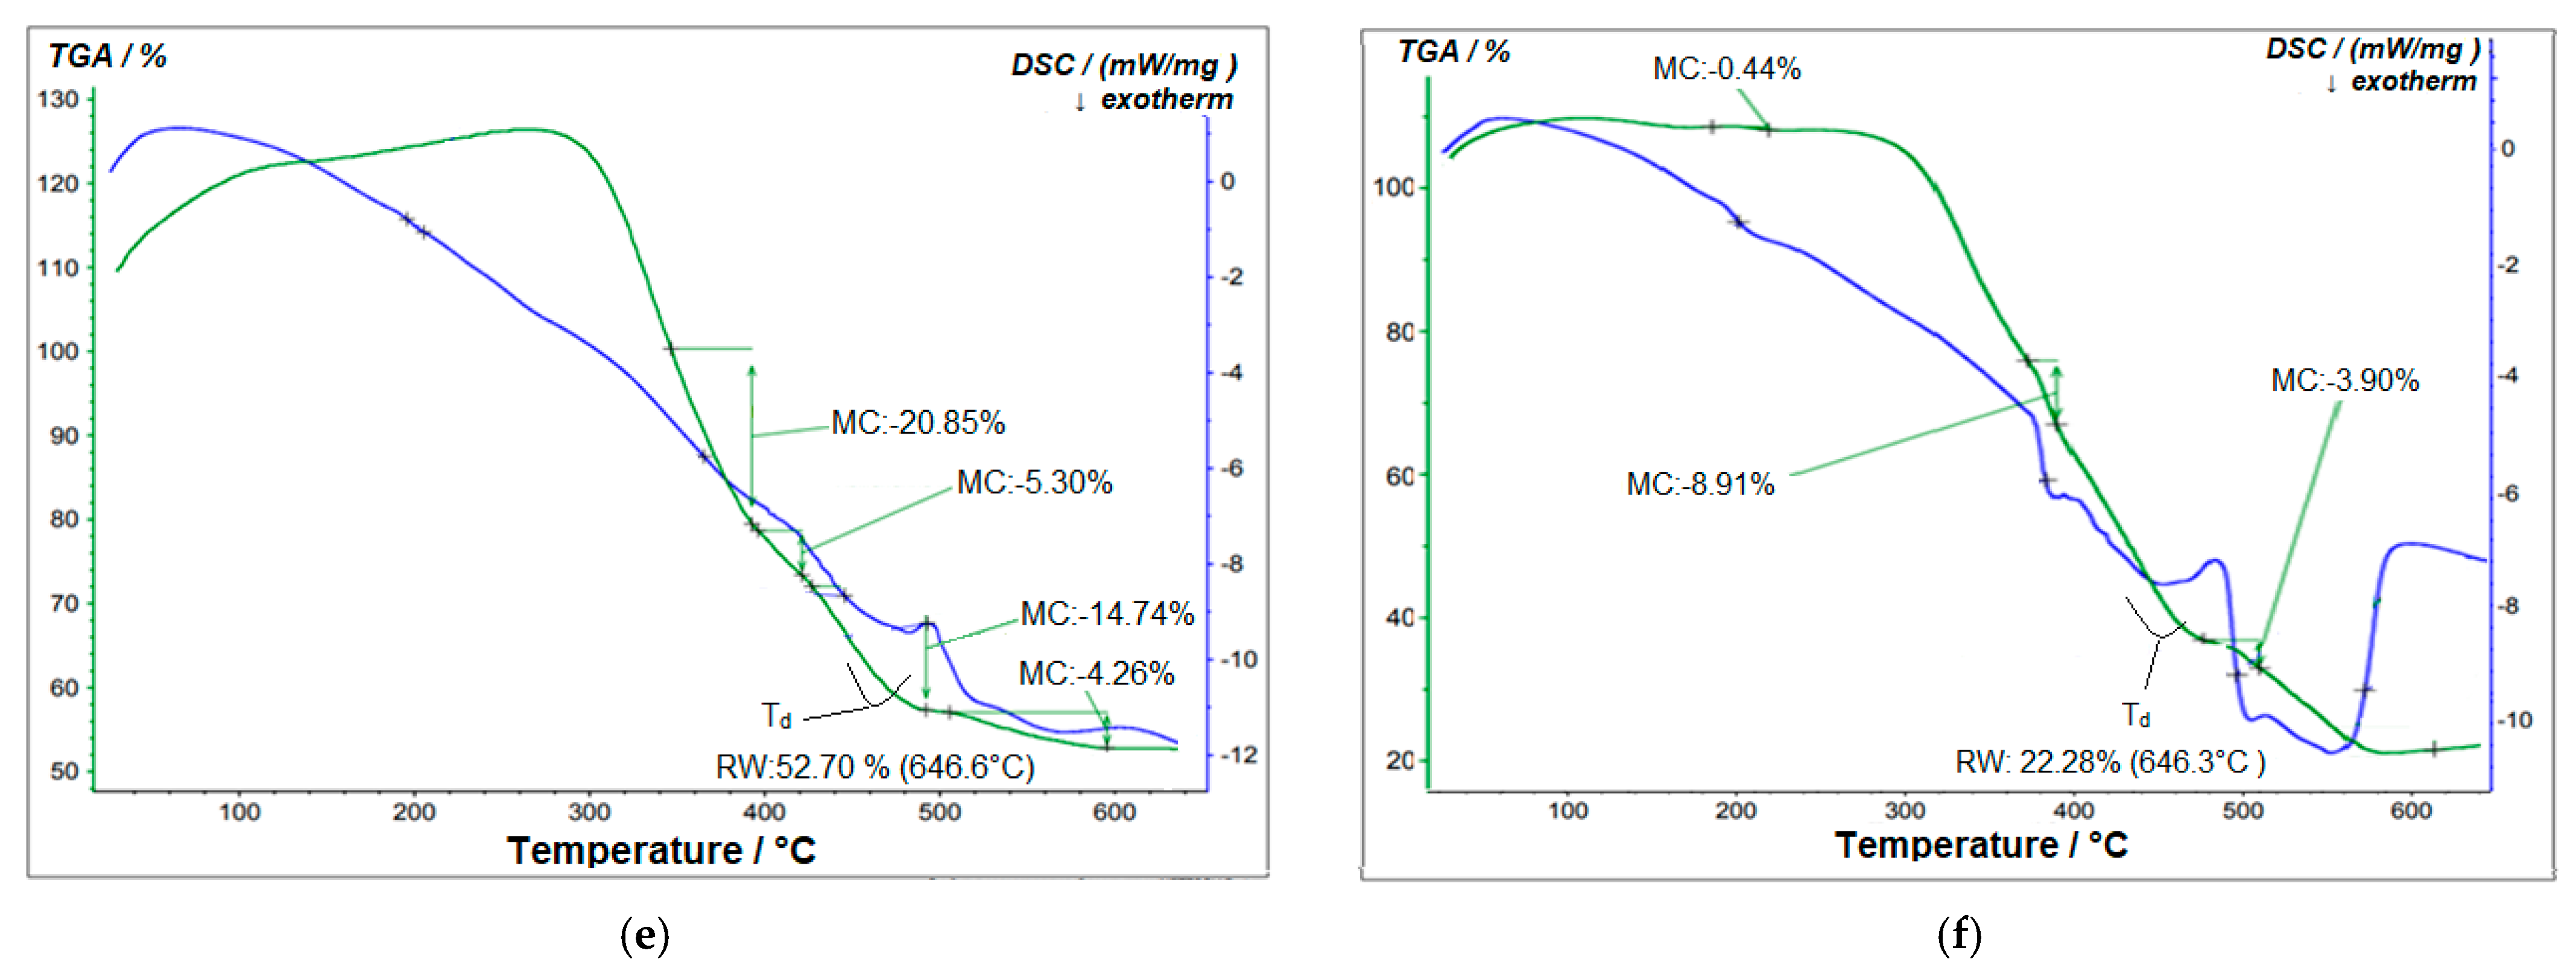
3.6. DSC and TGA Analysis

The thermal resistance of the produced polymer composite films was examined utilizing DSC and TGA. Representative DSC thermograms and TGA curves are demonstrated in Figure 13.
Figure 13a shows the DSC thermograms of the pristine PVA polymer matrix. A very weak signal in the given spectrum detected at low temperatures (−30 °C) and not regarded as significant represents the dehydration process and is related to the amorphous section of the structure [41]. The glass transition temperature Tg, melting temperature Tm, and degradation temperature Td were marked on the DSC curve of pure PVA and compared to scientific literature.
The DSC graph demonstrates that the Tg temperature for pure PVA is around 90 °C [42]. This temperature seems sharper and extends the temperature range of 80–100 °C for 1% GO/PVA nanocomposite (Figure 13b). The intensity of the curve recorded in this temperature interval was weakened in the case of a 2% GO/PVA nanocomposite (Figure 13c). It is substantially smaller in the region of 100 °C for 3% GO/PVA nanocomposite (Figure 13d) as temperature increases. The images show that the strength of this peak is further diminished and disappears in the background of the intensity of the other peaks for the 5% and 20% GO/PVA samples (Figure 13e,f).
The melting temperature Tm is observed around the area of 180–200 °C for pristine PVA, which corresponds to the temperature indicated in the literature [43]. This temperature range widened to cover the intervals 180–210 °C in the 1% GO/PVA sample. The temperature remained constant in the 2% GO/PVA nanocomposite, but the intensity was reduced. This temperature shifted to a considerably greater temperature range (190–220 °C) in the case of 3% GO/PVA nanocomposite, and its intensity became weaker. This peak is expected to be at 200 °C in 5% GO/PVA. This temperature changed to greater angles in 20% GO/PVA and was detected in the 200–230 °C range. Based on the results, a rise in Tm temperature was determined when the percentage of GO in PVA increased. This is because of the intense interaction of the polymer matrix with the GO molecules [44,45,46,47]. PVA crystallization and chain mobility can be enhanced by GO’s high surface-to-volume ratio and surface energy [48].
A strong peak is found in the pure PVA polymer matrix in the range of 420–430 °C, which matches to the Td temperature. According to the literature, the Td temperature of pure PVA is 300–450 °C [49]. The Td temperature in the 1% GO/PVA sample was determined to be between 420 °C and 430 °C. However, at this point, the strongly noted peak’s strength reduced and took the shape of scissors. This peak is observed at the same temperature in 2% GO/PVA nanocomposite and has a reasonably challenging peak. This temperature is also seen in a 3% GO/PVA nanocomposite at 420–440 °C. The aforementioned scissor peak is reasonably crossed. The Td temperature in a 5% GO/PVA nanocomposite is discovered to be in the range of 450–480 °C, with non-sharp absorption. Td temperature was measured in the same interval in the 20% GO/PVA sample. These peaks, however, do not appear sharply at large concentrations. The increase in all relevant temperatures with the increase in filler implies that they have better thermal stability. This is due to increased intermolecular interaction between GO and the PVA polymer matrix.
The TGA curve of the pure PVA is shown in another part of Figure 13a. The pure PVA polymer matrix degrades in two distinct steps. Step I (275–470 °C) demonstrated water evaporation from the film (weight loss of 87.61%). Step II (470–609 °C) resulted in a weight loss of 6.89% because of PVA dehydration followed by the growth of polyene structures. The residual weight of 4.91% at 646.7 °C demonstrates that polyene structures were then transformed into low-molecular-weight molecules [50,51,52].
Table 3 demonstrates the beginning and end temperatures of the PVA polymer matrix breakdown processes and different fractions of the GO/PVA nanocomposite.
A nanocomposite material was produced using varying ratios of GO and PVA. The TGA curve of 1% GO/PVA composite is shown in Figure 13b. The degradation in this case included three steps. Step I mass loss was 48.9% at 318–382 °C. Mass loss was 40.08% at Step II 402–500 °C. At 502–625 °C, mass loss is 9.55% in step III. The residual mass was 4.44%.
The TGA curve of a 2% GO/PVA composite is illustrated in Figure 13c. Degradation was also divided into three steps. In step I, mass loss was 59.18% at temperatures ranging from 280 to 418 °C. Step II mass loss was 26.47% at 425–495 °C. Step III mass loss was 6.37% at temperatures ranging from 499 to 640 °C. The residual mass was 5.51%.
The TGA curve of a 3% GO/PVA composite is shown in Figure 13d. This sample was degraded in three steps. The mass loss in Step I (295–420 °C) was 63.26%, and the mass loss in Step II (425–480 °C) was 19.48%. At 480–620 °C, 6.34% of the mass was lost in Step III. The residual mass was 9.48%.
The TGA analysis of 5% GO/PVA nanocomposite materials is shown in Figure 13e. The sample has degraded in four steps here as well. 20.85% mass loss occurred at 342–396 °C in Step I, 5.30% at 400–420 °C interval in Step II, 14.74% at 422–496 °C, and 4.26% at 505–597 °C interval in Step IV. The residual mass was 52.70%.
The TGA analysis of a 20% GO/PVA composite is presented in Figure 13f. The degradation process is also divided into four steps. Step I 184–219 °C mass loss was 0.44%, while Step II 380–388 °C mass loss was 8.91%. Step III resulted in a 3.90% mass loss at 480–511 °C, and Step IV resulted in a 3.56% mass loss at 542–608 °C. The residual mass was 22.28%.
The results showed that the samples lost mass after passing through multiple deterioration phases at a temperature of 600 °C.

4. Discussion

After thermal annealing, the crystal structure of the GO/PVA composite changes. This is related to the changing of the temperature and, due to this reason, the modification of the interaction. With the raising of the thermal annealing temperature, the crystallinity of the PVA polymer matrix becomes the doublet gradually shifts to a higher Bragg angle and indicating the perfection of the PVA crystal structure. In the XRD pattern, the angles shifted toward greater Bragg angles as the amount of GO in PVA increased. With the increase of the GO percentage in the PVA matrix, the intensity of the XRD peaks has decreased. Eg value varies with changes in the annealing temperature and particle concentration. This is related to the process of nanoparticle coalescence in the matrix, as well as the interaction between GO and PVA. Thus, due to the influence of the temperature, the mobility of particles in the matrix increases, and the probability of their collision and coalescence increases. As a result, the size of the particles grows, and as a result of the quantum size effect, a diminish in the Eg value is determined. Increased particle concentration in the matrix reduces the distance between particles and enhances the probability of interaction between them. Therefore, with the increase in concentration, coalescence processes are accelerated, and larger particles are formed, which results in a decrease in the Eg value. The possibility of controlling the dielectric constant and specific resistance of the GO particles in the composite by changing the concentration and heating temperature was determined. Based on DSC thermograms, all relevant temperatures have been increased with the increase of filler concentration (GO) implying that they have better thermal stability. This associated increase of intermolecular interaction between GO and the PVA polymer matrix.

Author Contributions

Conceptualization, L.G. and M.B.B.; methodology, M.M.; software, G.E. and E.H.; validation, L.G., G.A. and S.M.; formal analysis, M.B.B. and F.M.; investigation, M.B.B., G.A. and L.G.; resources, S.B. and M.B.B.; data curation, M.B.B. and S.M.; writing—original draft preparation, M.B.B.; writing—review and editing, S.B. and L.G.; visualization, G.E.; supervision, S.B. and L.G.; project administration, S.B. and M.B.B. All authors have read and agreed to the published version of the manuscript.

Funding

This research received no external funding.

Data Availability Statement

The data used to support the findings of this study are included in the article. Further data or information is available from the corresponding author upon request.

Conflicts of Interest

The authors declare no conflict of interest. The funders had no role in the design of the study; in the collection, analyses, or interpretation of data; in the writing of the manuscript; or in the decision to publish the results.

References

  1. Hieu, N.H.; Long, N.H.B.S.; Kieu, D.T.M.; Nhiem, L.T. Fabrication and characterization of graphene/graphene oxide-based poly(vinyl alcohol) nanocomposite membranes. J. Electron. Mater. 2015, 45, 2341–2346. [Google Scholar] [CrossRef]
  2. Morimune, S.; Nishino, T.; Goto, T. Poly(vinyl alcohol)/graphene oxide nanocomposites prepared by a simple eco-process. Polym. J. 2012, 44, 1056–1063. [Google Scholar] [CrossRef]
  3. Ghosh, T.N.; Pradhan, S.S.; Sarkar, S.K.; Bhunia, A.K. On the incorporation of the various reduced graphene oxide into poly(vinyl alcohol) nano-compositions: A comparative study of the optical, structural properties and magnetodielectric effect. J. Mater. Sci. Mater. Electron. 2021, 32, 19157–19178. [Google Scholar] [CrossRef]
  4. Jo, G.; Choe, M.; Lee, S.; Park, W.; Kahng, Y.H.; Lee, T. The application of graphene as electrodes in electrical and optical devices. Nanotechnology 2012, 23, 112001. [Google Scholar] [CrossRef]
  5. Cheng, H.K.F.; Sahoo, N.G.; Tan, Y.P.; Pan, Y.; Bao, H.; Li, L.; Zhao, J. Poly(vinyl alcohol) nanocomposites filled with poly(vinyl alcohol)-grafted graphene oxide. ACS Appl. Mater. Interfaces 2012, 4, 2387–2394. [Google Scholar] [CrossRef]
  6. Zhao, Y.; Terai, W.; Hoshijima, Y.; Gotoh, K.; Matsuura, K.; Matsumura, K. Development and characterization of a poly(Vinyl Alcohol)/Graphene oxide composite hydrogel as an artificial cartilage material. Appl. Sci. 2018, 8, 2272. [Google Scholar] [CrossRef]
  7. Wadhwa, H.; Kandhol, G.; Deshpande, U.P.; Mahendra, S.; Kumar, S. Thermal stability and dielectric relaxation behavior of in situ prepared poly(vinyl alcohol)(PVA) reduced graphene oxide (RGO) composites. Colloid Polym. Sci. 2020, 298, 1319–1333. [Google Scholar] [CrossRef]
  8. Pyun, J.; Matyjaszewski, K. Synthesis of nanocomposite organic/inorganic hybrid materials using controlled/“living” radical polymerization. Chem. Mater. 2001, 13, 3436–3448. [Google Scholar] [CrossRef]
  9. Chen, Q.; Shen, Y.; Zhang, S.; Zhang, Q.M. Polymer-Based Dielectrics with High Energy Storage Density. Annu. Rev. Mater. Res. 2015, 45, 433. [Google Scholar] [CrossRef]
  10. Das, T.K.; Prusty, S. Graphene-Based Polymer Composites and Their Applications. Polym. Plast. Technol. Eng. 2013, 52, 319–331. [Google Scholar] [CrossRef]
  11. Gahlot, S.; Kulshrestha, V.; Agarwal, G.; Jha, P.K. Synthesis and Characterization of PVA/GO Nanocomposite Films. Macromol. Symp. 2015, 357, 173–177. [Google Scholar] [CrossRef]
  12. Kashyap, S.; Pratihar, S.K.; Behera, S.K. Strong and ductile graphene oxide reinforced PVA nanocomposites. J. Alloys Compd. 2016, 684, 254–260. [Google Scholar] [CrossRef]
  13. Abu Hurayra-Lizu, K.M.; Bari, M.W.; Gulshan, F.; Islam, M.R. GO based PVA nanocomposites: Tailoring of optical and structural properties of PVA with low percentage of GO nanofillers. Heliyon 2021, 7, e06983. [Google Scholar] [CrossRef]
  14. Sujiono, E.; Zurnansyah; Zabrian, D.; Dahlan, M.; Amin, B.; Samnur; Agus, J. Graphene oxide based coconut shell waste: Synthesis by modified Hummers method and characterization. Heliyon 2020, 6, e04568. [Google Scholar] [CrossRef]
  15. Yoo, M.J.; Park, H.B. Effect of hydrogen peroxide on properties of graphene oxide in Hummers method. Carbon 2019, 141, 515–522. [Google Scholar] [CrossRef]
  16. Bhatnagar, D.; Singh, S.; Yadav, S.; Kumar, A.; Kaur, I. Experimental and theoretical investigation of relative optical band gaps in graphene generations. Mater. Res. Express 2017, 4, 015101. [Google Scholar] [CrossRef]
  17. Guerrero-Contreras, J.; Caballero-Briones, F. Graphene oxide powders with different oxidation degrees, prepared by synthesis variations of the Hummers method. Mater. Chem. Phys. 2015, 153, 209–220. [Google Scholar] [CrossRef]
  18. Wu, X.; Xie, Y.; Xue, C.; Chen, K.; Yang, X.; Xu, L.; Zhang, D. Preparation of PVA-GO composite hydrogel and effect of ionic coordination on its properties. Mater. Res. Express 2019, 6, 075306. [Google Scholar] [CrossRef]
  19. Eisa, W.H.; Shabaka, A.A. Ag seeds mediated growth of Au nanoparticles within PVA matrix: An eco-friendly catalyst for degradation of 4-nitrophenol. React. Funct. Polym. 2013, 73, 1510–1516. [Google Scholar] [CrossRef]
  20. Abdallah, M.; Osama, H.; Emad, Y. Study the optical properties of poly(vinyl alcohol) doped copper chloride. Al-Nahrain J. Sci. 2013, 16, 17–20. [Google Scholar] [CrossRef]
  21. Tang, C.M.; Tian, Y.H.; Hsu, S.H. Poly(vinyl alcohol) nanocomposites reinforced with bamboo charcoal nanoparticles: Mineralization behavior and characterization. Materials 2015, 8, 4895–4911. [Google Scholar] [CrossRef] [PubMed]
  22. Stasko, J.; Kalniņs, M.; Dzene, A.; Tupureina, V. Poly(vinyl alcohol) Hydrogels. Proc. Estonian Acad. Sci. 2009, 58, 63–66. [Google Scholar] [CrossRef]
  23. Panova, T.V.; Efimova, A.A.; Berkovich, A.K.; Efimov, A.V. Plasticity control of poly(vinyl alcohol)–graphene oxide nanocomposites. RSC Adv. 2020, 10, 24027–24036. [Google Scholar] [CrossRef] [PubMed]
  24. Narayana, M.; Jammalamadaka, S. Tuning Optical Properties of Graphene Oxide under Compressive Strain Using Wet Ball Milling Method. Graphene 2016, 5, 73–80. [Google Scholar] [CrossRef]
  25. Bao, C.; Guo, Y.; Song, L.; Hu, Y.J.L. Poly(vinyl alcohol) nanocomposites based on graphene and graphite oxide: A comparative investigation of property and mechanism. Mater. Chem. 2011, 21, 13942. [Google Scholar] [CrossRef]
  26. Ricciardi, R.; Auriemma, F.; De Rosa, C.; Lauprêtre, F. X-ray diffraction analysis of poly(vinyl alcohol) hydrogels, obtained by freezing and thawing techniques. Macromolecules 2004, 37, 1921–1927. [Google Scholar] [CrossRef]
  27. Ma, J.; Li, Y.; Yin, X.; Xu, Y.; Yue, J.; Bao, J.; Zhou, T. Poly(vinyl alcohol)/graphene oxide nanocomposites prepared by in situ polymerization with enhanced mechanical properties and water vapor barrier properties. RSC Adv. 2016, 6, 49448–49458. [Google Scholar] [CrossRef]
  28. Khichar, K.K.; Dangi, S.B.; Dhayal, V.; Kumar, U.; Hashmi, S.Z.; Sadhu, V. Structural, optical, and surface morphological studies of ethyl cellulose/graphene oxide nanocomposites. Polym. Compos. 2020, 41, 2792–2802. [Google Scholar] [CrossRef]
  29. Dhayal, V.; Hashmi, S.Z.; Kumar, U.; Choudhary, B.L.; Kuznetsov, A.E.; Dalela, S. Spectroscopic studies, molecular structure optimization and investigation of structural and electrical properties of novel and biodegradable Chitosan-GO polymer nanocomposites. J. Mater. Sci. 2020, 55, 14829–14847. [Google Scholar] [CrossRef]
  30. Punia, K.; Lal, G.; Dalela, S.; Dolia, S.N.; Alvi, P.A.; Barbar, S.K.; Kumar, S. A comprehensive study on the impact of Gd substitution on structural, optical and magnetic properties of ZnO nanocrystals. J. Alloys Compd. 2021, 868, 159142. [Google Scholar] [CrossRef]
  31. Kumar, U.; Upadhyay, S.; Alvi, P.A. Study of reaction mechanism, structural, optical and oxygen vacancy-controlled luminescence properties of Eu-modified Sr2SnO4 Ruddlesden popper oxide. Phys. B Condens. Matter. 2020, 604, 412708. [Google Scholar] [CrossRef]
  32. Dangi, S.B.; Hashmi, S.Z.; Upendra, K.B.L.; Choudhary, A.E.; Kuznetsov, S.D.; Shalendra, K.; Dolia, S.N.; Sudhish, K.; Balsam, F.I.; Sofi, R.D.; et al. Exploration of spectroscopic, surface morphological, structural, electrical, optical and mechanical properties of biocompatible PVA-GO PNCs. Diam. Relat. Mater. 2022, 127, 109158. [Google Scholar] [CrossRef]
  33. Yahia, I.S.; Mohammed, M.I. Facile synthesis of graphene oxide/PVA nanocomposites for laser optical limiting: Band gap analysis and dielectric constants. J. Mater. Sci. Mater. Electron. 2018, 29, 8555–8563. [Google Scholar] [CrossRef]
  34. Abdullah, O.G.; Aziz, S.B.; Omer, K.M.; Salih, Y.M. Reducing the optical band gap of polyvinyl alcohol (PVA) based nanocomposite. J. Mater. Sci. Mater. Electron. 2015, 26, 5303–5309. [Google Scholar] [CrossRef]
  35. Abdullah, O.G.; Aziz, S.B.; Rasheed, M.A. Structural and optical characterization of PVA: KMnO4 based solid polymer electrolyte. Results Phys. 2016, 6, 1103–1108. [Google Scholar] [CrossRef]
  36. Sehrawat, P.; Islam, S.S.; Mishra, P.; Ahmad, S. Reduced graphene oxide (rGO) based wideband optical sensor and the role of Temperature. Defect States Quantum Effic. Sci. Rep. 2018, 8, 3537. [Google Scholar] [CrossRef]
  37. Dhayal, V.; Hashmi, S.Z.; Kumar, U.; Choudhary, B.L.; Dalela, S.; Dolia, S.N.; Alvi, P.A. Optical and electrical properties of biocompatible and novel (CS–GO) polymer nanocomposites. Opt. Quantum Electron. 2021, 53, 53. [Google Scholar] [CrossRef]
  38. Nangia, R.; Shukla, N.K.; Sharma, A. Frequency and temperature-dependent impedance spectroscopy of PVA/PEG polymer blend film. High-Perform. Polym. 2018, 30, 918–926. [Google Scholar] [CrossRef]
  39. Muradov, M.B.; Yusifova, K.A.; Eyvazova, G.M.; Mammadov, R.K.; Salahova, A.Z. Study of dielectric properties of CdS/PVA nanocomposites obtained by using successive ionic layer adsorption and reaction. World J. Condens. Matter. Phys. 2013, 3, 83–86. [Google Scholar] [CrossRef]
  40. Deshmukh, K.; Ahamed, M.B.; Sadasivuni, K.K.; Ponnamma, D.; Deshmukh, R.R.; Trimukhe, A.M.; Chidambaram, K. Solution-processed white graphene-reinforced ferroelectric polymer nanocomposites with improved thermal conductivity and dielectric properties for electronic encapsulation. J. Polym. Res. 2017, 24, 27. [Google Scholar] [CrossRef]
  41. Najihah, J.; Hazlina, H.; Ahmad, A.; Zachary, A. and Zulkafli, H. Characterization and Preparation of Polyvinyl Alcohol (PVA) as Inhibitor in Formation of Hydrates. Inter. J. Curr. Sci. Eng. Technol. 2018, 1, 578–584. [Google Scholar]
  42. Mallikarjun, H.; Bhajantri, R.; Sunil, G.; Kanakaraj, T.; Chetan, C.; Shivaprasad, C. Mechanical and thermal studies of brilliant green dye-doped poly(vinyl alcohol) polymer composite. AIP Conf. Proc. 2019, 2115, 030222. [Google Scholar] [CrossRef]
  43. Chiellini, E.; Cinelli, P.; Fernandes, E.G.; Kenawy, E.R.S.; Lazzeri, A. Gelatin-based blends and composites, morphological and thermal-mechanical characterization. Biomacromolecules 2001, 2, 806–811. [Google Scholar] [CrossRef] [PubMed]
  44. Kim, S.W.; Choi, H.M. Enhancement of thermal, mechanical, and barrier properties of ethylene vinyl alcohol copolymer by incorporation of graphene nanosheets. High Perform. Polym. 2014, 27, 694–704. [Google Scholar] [CrossRef]
  45. Zhu, Y.; Wang, H.; Zhu, J.; Chang, L.; Ye, L. Nanoindentation and thermal study of polyvinylalcohol/graphene oxide nanocomposite film through organic/inorganic assembly. Appl. Surf. Sci. 2015, 349, 27–34. [Google Scholar] [CrossRef]
  46. Albert, E.L.; Abdullah, C.A.C.; Shiroshaki, Y. Synthesis and characterization of graphene oxide functionalized with magnetic nanoparticle via simple emulsion method. Results Phys. 2018, 11, 944–950. [Google Scholar] [CrossRef]
  47. Huang, G.; Gao, J.; Wang, X.; Liang, H.; Ge, C. How can graphene reduce the flammability of polymer nanocomposites? Mater. Lett. 2012, 66, 187–189. [Google Scholar] [CrossRef]
  48. Aslam, M.; Kalyar, M.A.; Raza, Z.A. Polyvinyl alcohol: A review of research status and use of polyvinyl alcohol-based nanocomposites. Polym. Eng. Sci. 2018, 58, 2119–2132. [Google Scholar] [CrossRef]
  49. Peng, Z.; Kong, L.X. A thermal degradation mechanism of polyvinyl alcohol/silica nanocomposites. Polym. Degrad. Stab. 2007, 92, 1061–1071. [Google Scholar] [CrossRef]
  50. Tsuchiya, Y.; Sumi, K. Thermal decomposition products of poly(vinyl alcohol). J. Polym. Sci. Part A 1969, 7, 3151–3158. [Google Scholar] [CrossRef]
  51. Ballistreri, A.; Foti, S.; Montaudo, G.; Scamporrino, E. Evolution of aromatic compounds in the thermal decomposition of vinyl polymers. J. Polym. Sci. Part A 1980, 18, 1147–1153. [Google Scholar] [CrossRef]
  52. Holland, B.-J.; Hay, J.-N. The thermal degradation of poly(vinyl alcohol). Polymer 2001, 42, 6775–6783. [Google Scholar] [CrossRef]
Figure 1. XRD results for PVA annealed for 1 h at temperatures of 25 °C, 40 °C, 70 °C, and 110 °C.
Chemengineering 07 00092 g001
Figure 2. XRD pattern of pristine (a) PVA and (b) GO.
Chemengineering 07 00092 g002
Figure 3. XRD results for 2% GO/PVA composite subjected to annealing at various temperatures. (T = 25 °C; T = 40 °C; T = 70 °C; T = 110 °C).
Chemengineering 07 00092 g003
Figure 4. XRD results at room temperature for different concentrations (2%, 3%, and 20%) of GO/PVA.
Chemengineering 07 00092 g004
Figure 5. Crystallite size of the samples. (a) pure PVA depending on the temperature; (b) 2% GO/PVA depending on the temperature and (c) crystallite size of different percentages GO/PVA.
Chemengineering 07 00092 g005
Figure 6. TEM images of (a,b) pure GO; (c) 1% GO/PVA; (d) 5% GO/PVA composites.
Chemengineering 07 00092 g006
Figure 7. The absorption spectrum of GO/PVA composites with different concentrations. (1), (2), (3), (4), and (5) show the absorption spectrum of PVA, 1%, 2%, 3%, and 5% GO/PVA-based nanocomposites, respectively.
Chemengineering 07 00092 g007
Figure 8. Determination of the Eg value of a 3% GO/PVA composite.
Chemengineering 07 00092 g008
Figure 9. The dependence of concentration and band gap value of GO/PVA.
Chemengineering 07 00092 g009
Figure 10. Dependence of the dielectric constant of 1% (a), 2% (b), 3% (c), 5% (d), and 20% (e) concentrated GO/PVA composite on the logarithmic value of electric field frequency at various temperatures.
Chemengineering 07 00092 g010
Figure 11. Dependence of the specific resistance of 1% (a), 2% (b), 3% (c), 5% (d), and 20% (e) concentrated GO/PVA composite on the logarithmic value of electric field frequency at different temperatures.
Chemengineering 07 00092 g011
Figure 12. EDS spectra of (a) 1% GO/PVA; (b) 5% GO/PVA and element mapping of the (c) 1% GO/PVA; (d) 5% GO/PVA nanocomposites.
Chemengineering 07 00092 g012
Figure 13. TGA and DSC analysis of (a) pure PVA polymer matrix; (b) 1% GO/PVA; (c) 2% GO/PVA; (d) 3% GO/PVA; (e) 5% GO/PVA; (f) 20% GO/PVA.
Chemengineering 07 00092 g013aChemengineering 07 00092 g013b
Table 1. Concentration dependence of the Eg of the GO/PVA composite with a concentration of 1, 2, 3, 5%.
Concentration (c, %)1% GO/PVA2% GO/PVA3% GO/PVA5% GO/PVA
Band gap value (Eg, eV)2.65 eV2.4 eV2.6 eV1.8 eV
Table 2. Dependence of the band gap on thermal annealing for GO/PVA composite with 2% concentration.
Composite25 °C40 °C70 °C110 °C
2% GO/PVA2.40 eV2.35 eV2.30 eV2.20 eV
Table 3. Initial and final temperatures of the degradation step of PVA and different percentages of GO/PVA composite material.
SamplesTemperatures ( °C)
Tı (Initial)–Tı (Final)Tıı (Initial)–Tıı (Final)Tııı (Initial)–Tııı (Final)Tıv (Initial)–Tıv (Final)
PVA275–470470–609--
1% GO/PVA318–382402–500502–625-
2% GO/PVA280–418425–495499–640-
3% GO/PVA295–420425–480480–620
5% GO/PVA342–396400–420422–496505–597
20% GO/PVA184–219380–388480–511542–608
Disclaimer/Publisher’s Note: The statements, opinions and data contained in all publications are solely those of the individual author(s) and contributor(s) and not of MDPI and/or the editor(s). MDPI and/or the editor(s) disclaim responsibility for any injury to people or property resulting from any ideas, methods, instructions or products referred to in the content.

