
Flow Analysis and Structural Optimization of Double-Chamber Parallel Flexible Valve Micropumps


1
School of Mechanical and Electrical Engineering, Guangzhou University, Guangzhou 510006, China
2
ThAMeS Multiphase, Department of Chemical Engineering, University College London, London WC1E 7JE, UK
*
Author to whom correspondence should be addressed.
ChemEngineering 2023, 7(6), 111; https://0-doi-org.brum.beds.ac.uk/10.3390/chemengineering7060111
Submission received: 20 September 2023
/
Revised: 3 November 2023
/
Accepted: 9 November 2023
/
Published: 16 November 2023
Abstract
:In the current study, a two-dimensional numerical study is carried out to investigate the performance of a novel Double-Chamber Parallel Flexible Valve micropump, which utilized the electrowetting-on-dielectrics (EWOD) effect to drive the microfluid flow. By observing the flow fields, the internal circulations are seen on both the left and right sides of the pump. The generation of the backflow is discussed as well by tracking the movement of the vortices. Only slight flow fluctuations are seen in the micropump. Based on the simulation results, the structural parameters including the width of the inlet and the outlet, the width of the pumping channel and the diverging angle in the micropump are analyzed, and the influence of these parameters on the pumping volume and the maximum pressure are discussed. Eventually, a group of optimal parameter combinations is given according to the simulation results to extend the operating potential of the micropump.
1. Introduction
Micropumps play a significant role as actuating components within microfluidic systems across diverse applications, such as chemical analysis, biological defense, analytical biology, MEMS (micro-electro-mechanical systems), and numerous other fields [1,2,3,4]. With the rapid advancement in microfluidic system technology, there is a growing demand for micropumps that are not only smaller in size but also possess simpler structures [5]. Consequently, various types of micropumps have been devised to meet these evolving requirements. In recent years, the electrowetting-on-dielectrics (EWOD) effect has gained prominence as an approach to propel liquids in the micropumps due to its inherent simplicity and energy efficiency. Through the controlled vibrations of a droplet in the pump chamber, the liquid in the microchannel is driven to flow. By combining this effect with the design of a unidirectional flow channel, the continuous propulsion of microfluids is achieved.
Matsumoto et al. [6] were pioneering in their work to apply the EWOD phenomenon for micropump design, although the EWOD effect was used initially to drive mercury droplets. Subsequently, this innovative concept was extended to drive the motion of microfluids through the manipulation of the moving mercury droplets. Following this, researchers Yang et al. [7] introduced an electrolysis-bubble-actuated micropump that leveraged the EWOD principle, resulting in significant advancements such as achieving net pumping and improved switching capabilities. Lee et al. [8] used low-frequency EWOD to manipulate droplets on a two-dimensional plane, then analyzed the influences of droplet radius, position, and contact angle on the droplet-transporting behavior. Yamamoto et al. [9] discussed the influences of the droplet volume, the oil viscosity, the lubrication, and the thickness of liquid and solid dielectric layers on droplet velocity. The EWOD does not only find its application in micropumps; it has also been applied in other fields like the diagnosis of the early mortality syndrome in shrimp [10].
In recent years, micropumps utilizing the EWOD phenomenon have experienced significant and rapid advancements. Shabani et al. [11] introduced a linear-motion micropump harnessing electrowetting-on-dielectrics (EWOD) and which yielded a microfluidic movement speed of 0.48 mm/s when the initial droplet volume was 0.3 μL. In a different approach, Jang et al. [12] presented a paper-based EWOD micropump that imprints electrodes on paper and employs a Y-shaped circuit structure to successfully drive five distinct droplets to coalesce. Bohm et al. [13] conducted a fluid-dynamics simulation of a novel EWOD micropump using COMSOL Multiphysics 5.5 software and derived design guidelines for achieving nearly optimal pump performance. Wen et al. [14] introduced an EWOD valveless micropump, while Wei et al. [15] focused on optimizing EWOD devices to enhance their driving efficiency. However, it is worth noting that when employing the EWOD phenomenon to drive continuous microfluids, micropumps may exhibit significant fluctuations in pumping capacity and may not be suitable for certain high-precision applications due to the occurrence of backflow phenomena. Consequently, addressing the challenge of flow fluctuation in micropumps has emerged as a pressing issue in this field.
In response to the increasing performance demands of micropumps and the need to enhance their integrability while maximizing the potential of EWOD-based micropumps, our research group has introduced a parallel flexible valve micropump with a double-chamber design. This innovative micropump utilizes the EWOD phenomenon to induce droplet vibrations within the pump chamber while integrating the functionality of a microchannel flexible valve [16]. This paper focuses on a numerical investigation into the dynamics of EWOD-driven flow within this micropump. The simulation employs the finite element method (FEM) to explore the influences of various structural parameters on the micropump’s performance. The objective is to identify optimal parameter combinations that can enhance the micropump’s pumping capacity. The paper is structured as follows. In Section 2, we provide an overview of the micropump principle, introduce the simulation methodology, and derive the mathematical model based on mass and momentum conservation equations and phase field equations. Section 3 outlines the conditions for the numerical simulation and includes the verification of calculation results and grid sensitivity analysis. The internal flow dynamics within the micropump are discussed as well. Section 4 examines seven structural parameters and selects the optimized parameters. Finally, in Section 5, we present the conclusions drawn from this study. This research endeavors to contribute valuable insights into the design and optimization of EWOD-driven micropumps for various applications.
2. Simulation Methodology
2.1. Principle of EWOD and Flow Domain
The 2D structure, representing the flow domain of the double-chamber parallel flexible valve micropump, is depicted in Figure 1. In this design, the pump’s inlet and outlet are connected by a pair of parallel horizontal pipes and inclined channels, with a vertical channel linking the upper and lower branches. As shown in Figure 2, the length of the two parallel channels is 4000 μm and the length of the linking channel is 5000 μm. Within this vertical channel, a droplet of KCL solution at 0.1 mol/L is placed in the middle. The working fluid within the micropump is silicone oil. The physical properties of two liquids employed are shown in Table 1 (Pollack et al., 2002 [17]; Wen, et al., 2020 [14]). A pair of electrodes at 48 V voltage is applied at both the front and the tail of the droplet, respectively. When the voltage is switched on, the contact angle of the KCL solution droplet will vary from to the [17], as shown in Figure 3.
Upon applying voltage to one side (either upper or lower), the contact angle of the droplet at the corresponding positions changes. This change in contact angle results in an unbalanced force, propelling the droplet to move in one direction. When the voltage is switched off, the contact angle of the droplet changes in the opposite direction, causing the droplet to move in the opposite direction. This oscillating movement of the droplet, both upward and downward, drives the surrounding silicone oil, leading to a net flow of the liquid. The micropump’s design incorporates an approximately ‘one-way’ flexible valve, which further facilitates the transportation of silicone oil from the inlet to the outlet, creating a unidirectional flow.
2.2. Simulation Methodology
In the present study, we conducted a two-dimensional simulation on incompressible laminar flow using COMSOL 5.5. Since the primary driving force is attributed to changes in surface tension in the horizontal direction, we have disregarded the impact of gravity in the vertical direction [14,18,19].
The global governing equation is the mass conservation equation:
and the momentum equation:
where is microfluid density; is the velocity vector; is the dynamic viscosity of the microfluid; is the time; is microfluid pressure; is gravitational acceleration; is surface tension, which is defined as non-zero only at the interface; is the identity matrix.
The solution equation in the phase field is as follows:
where and are shape functions used to represent the contact surfaces of the two-phase flow. The parameters and are used to guarantee the equation remains stable. and are the control parameters for the thickness of the contact surface and the moving diffusion velocity of the two-phase flow, which are user-defined. After validation of the validity of subsequent values, this paper finally determines that it is more appropriate for to take 0.01876 and to take 1.
The part of the flexible valve in this model is assumed to be isotropic material. So, it can be expressed by the Hooke equation when the flexible valve deforms. The expression is as follows:
where represents the stress, is Young’s modulus, is Poisson’s ratio.
The simulation was carried out in the software of COMSOL Multiphysics 5.4, which is a suitable tool for solving coupled multiphysics problems [19,20,21]. The computation time is 1 s. The frequency at which two positive electrodes are switched on or off is 5 Hz, and a square wave function with a phase difference of half a cycle and a frequency of 5 Hz is established in COMSOL. The maximum value is 104 and the minimum value is 80. Then, using these two square wave functions to sequentially control the changes in the contact angle between the two ends of the KCL droplet, electro-hydraulic coupling can be achieved. The inlet and outlet are set as pressure boundary with 0 Pa, and the flow in the computational domain is driven by droplet motion. One end of the flexible valve is fixed on the channel wall, and its physical properties are: Poisson’s ratio is 0.499, Young’s modulus is 2.5 × 10⁵ Pa, density is 850 kg/m3, length is 450 μm, width is 20 μm, inclined angle is 45°. The meshed geometry is shown in Figure 4.
2.3. Validation and Grid Resolution
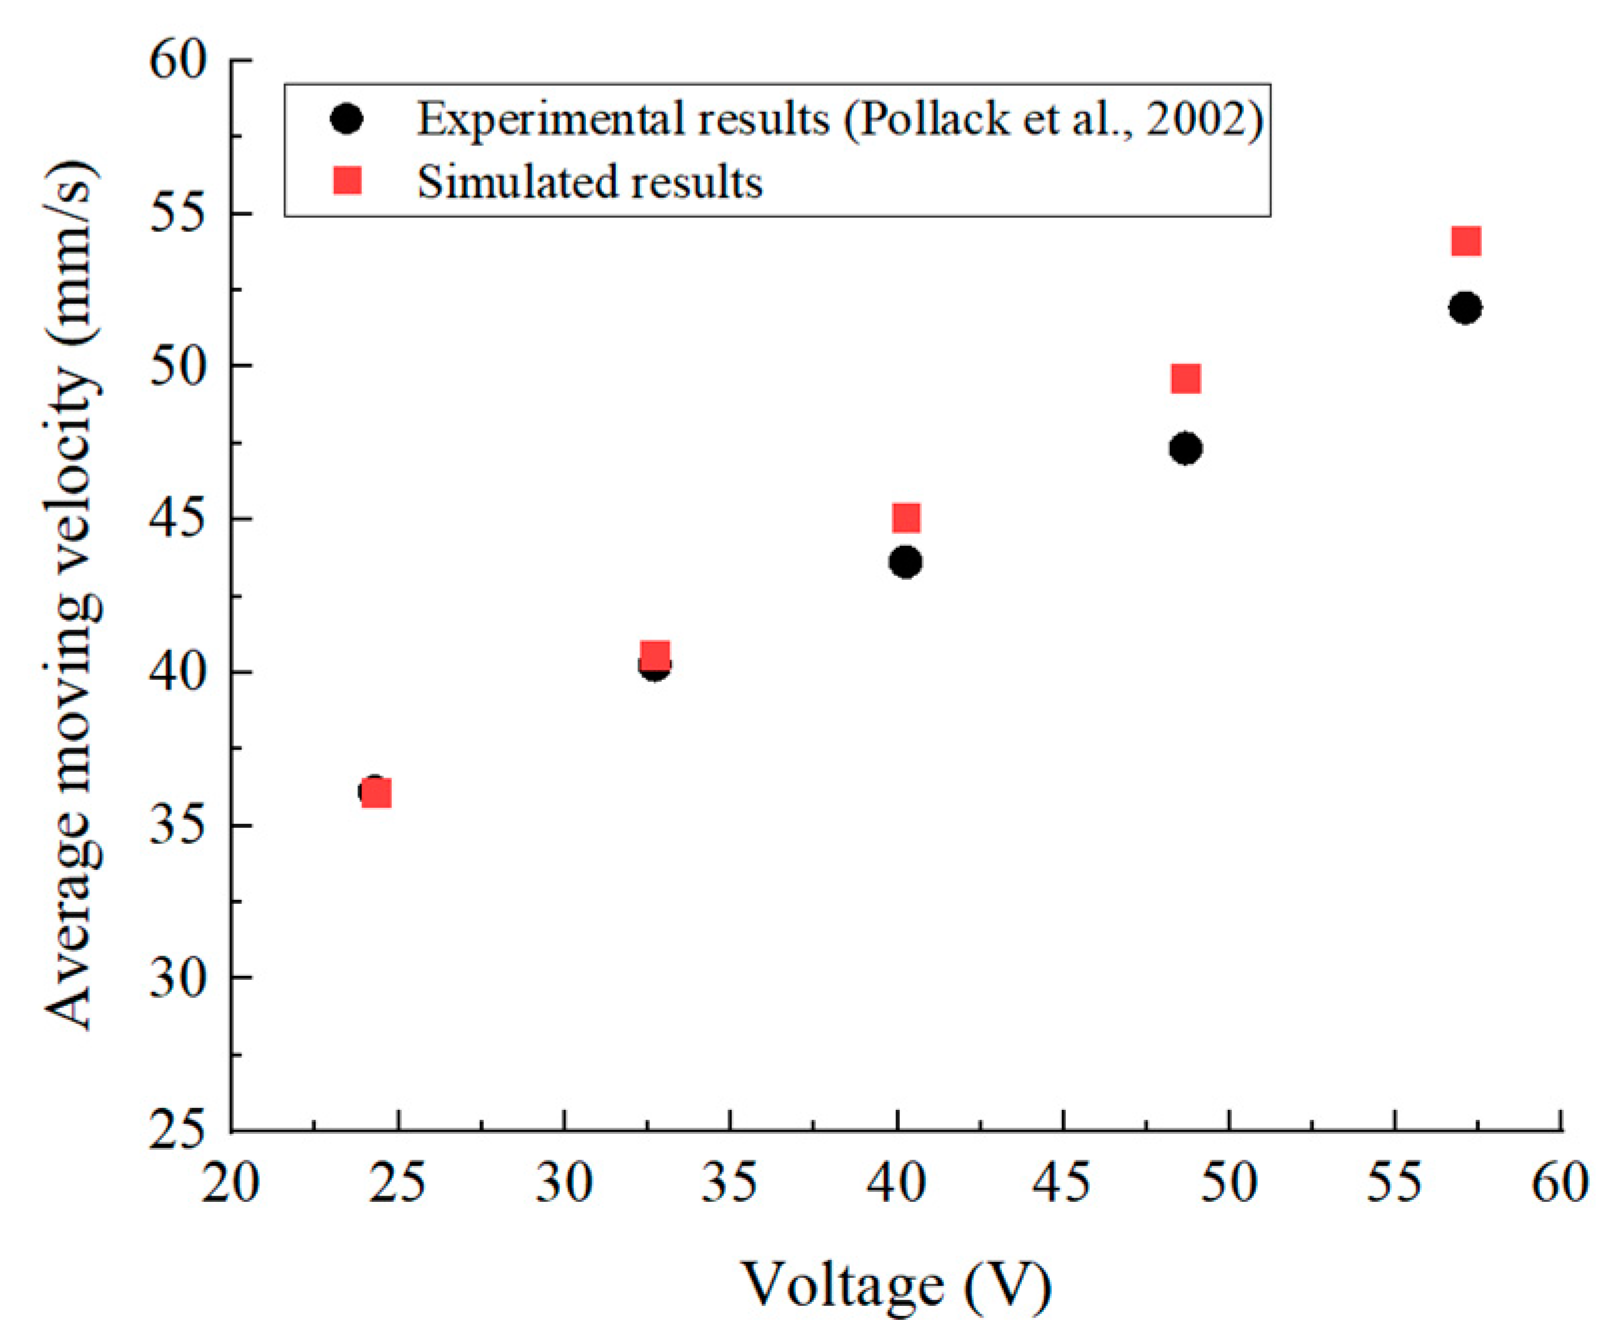
To validate the appropriateness of the calculation parameters and settings, we conducted simulations of KCL droplets driven by voltage in a 300 μm wide channel using COMSOL. These results were then compared with experimental data as reported in Pollack et al. [17], as depicted in Figure 5. Upon close examination of the droplet velocity, it is evident that the simulation results closely align with the experimental findings. This congruence suggests that the employed simulation method effectively captures the EWOD phenomenon.
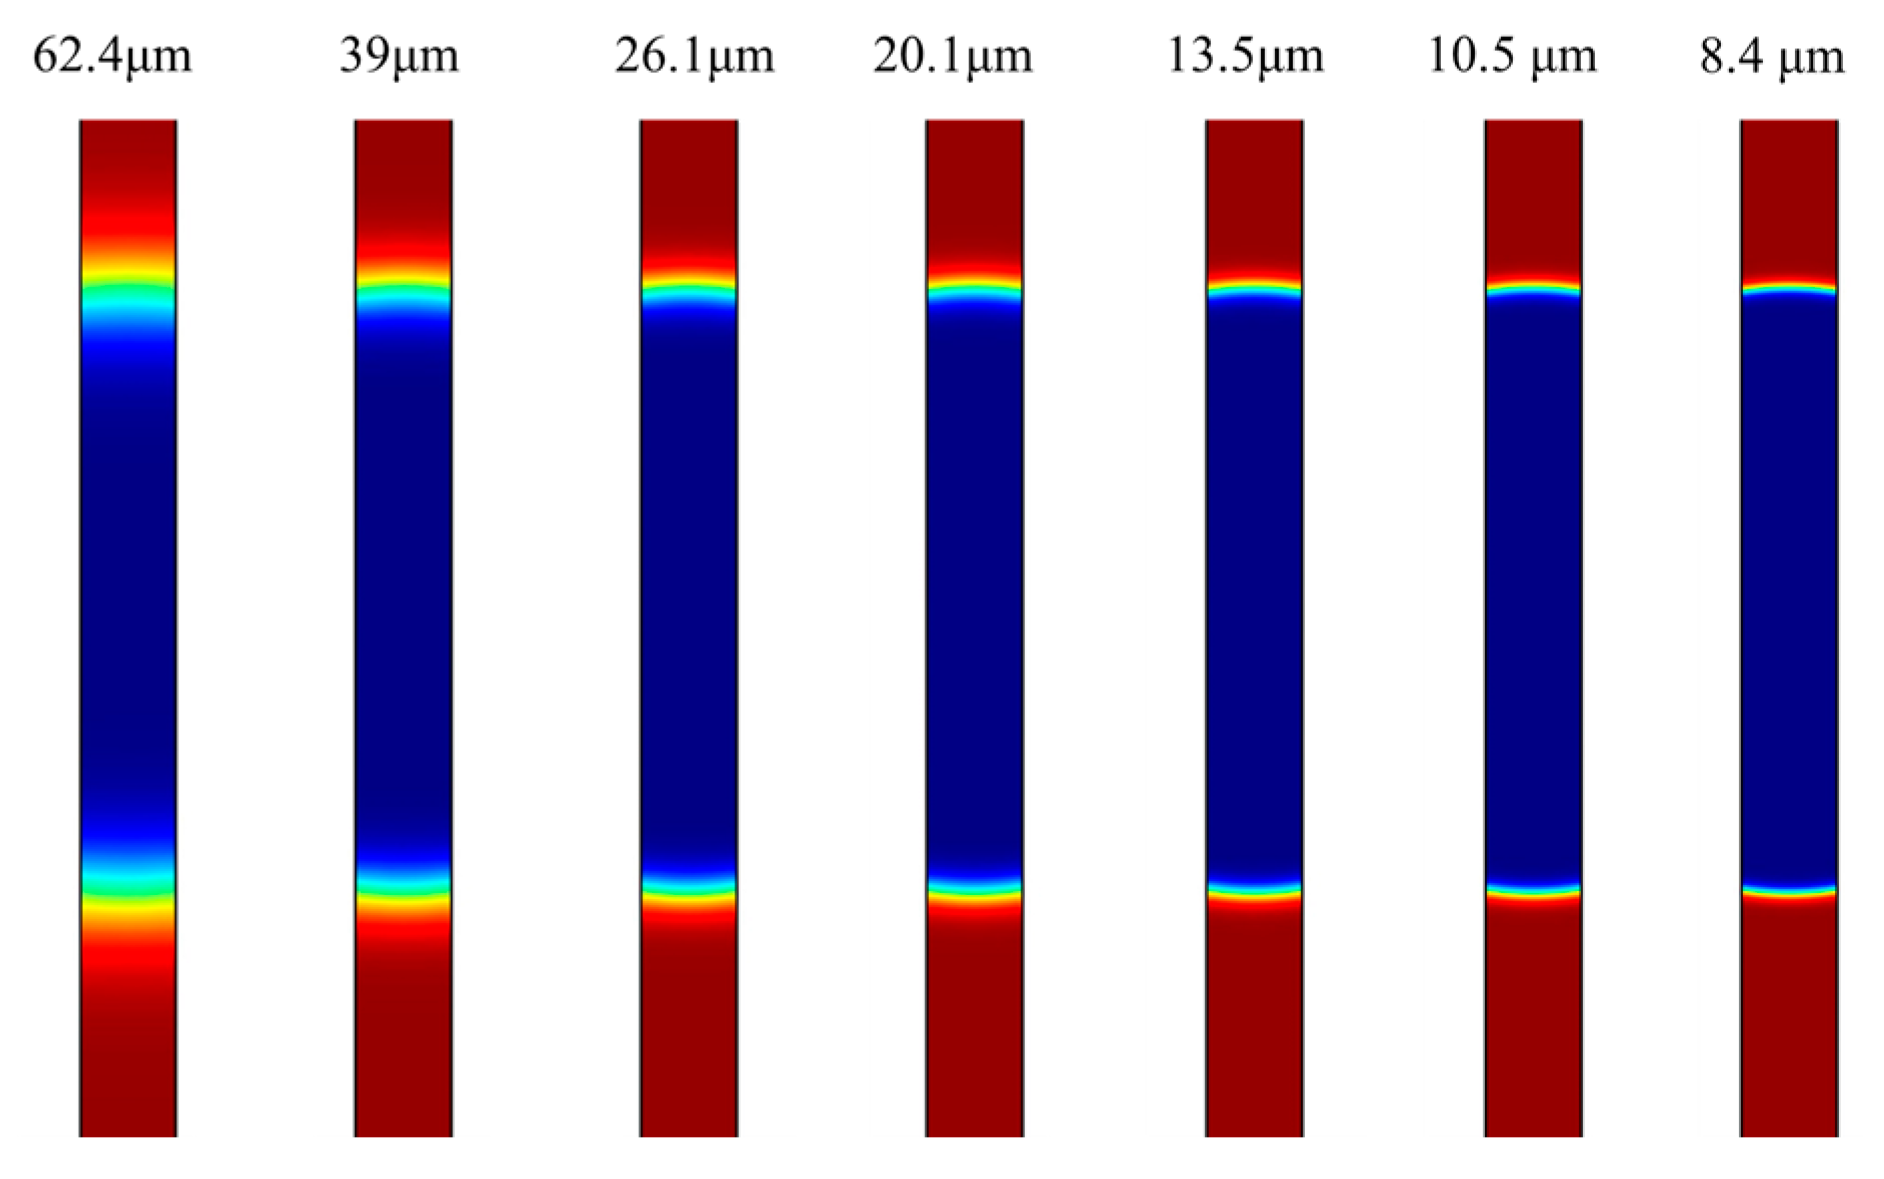
To ensure an optimal grid resolution while maintaining computational efficiency, a sensitivity analysis of the grid was conducted. The grid division was performed using COMSOL’s automatic calibration with respect to the fluid mechanics physical field grid. The grid size was regulated by the automatic adaptation feature of the COMSOL software 5.5, offering users the ability to choose from predefined settings for grid coarseness, including Extreme coarsening (62.4 μm), Ultra coarsening (39 μm), Coarse (26.1 μm), Coarsening (20.1 μm), General (13.5 μm), Refine (10.5 μm), More refined (8.4 μm), resulting in nine grid levels, ranging from ultra-fine to extremely coarse. The effect of different grid sizes on the calculation accuracy was assessed, specifically regarding the two-phase flow interface between the KCL droplet (depicted in blue) and the surrounding silicone oil (depicted in red). As illustrated in Figure 6, it becomes evident that as the grid size decreases, the interface of the droplet becomes progressively clearer. However, as the grid size becomes finer and finer, there is no substantial difference in the clarity of the droplet interface. Consequently, for subsequent calculations, a refined grid size was chosen, striking a balance between computational precision and efficiency.
3. Results and Discussion
As previously mentioned, the flow within the micropump is contingent on the oscillation of the confined droplet in the connecting channel. Consequently, it is reasonable to anticipate some fluctuations at the micropump’s outlet. In more adverse scenarios, these fluctuations can potentially result in backflow, which has the potential to cause the micropump to fail completely. To guide our subsequent analysis and optimization efforts, we will focus on three key performance parameters: the pumping volume (Q), the flow rate (q), and the maximum pressure (Pmax). The pumping volume (Q) is the cumulative volume of liquids at the micropump’s outlet, serving as an indicator of the pump’s transporting capacity, while the flow rate (q) is the measure of the volume of fluid transported by the micropump per unit of time [19]:
The maximum pressure (Pmax) mentioned later refers to the maximum pressure at the outlet compared to the pressure in the surrounding environment which is set to 0. Pmax indicates the potential energy that micropumps can achieve.
3.1. Pumping Volume and Maximum Pressure
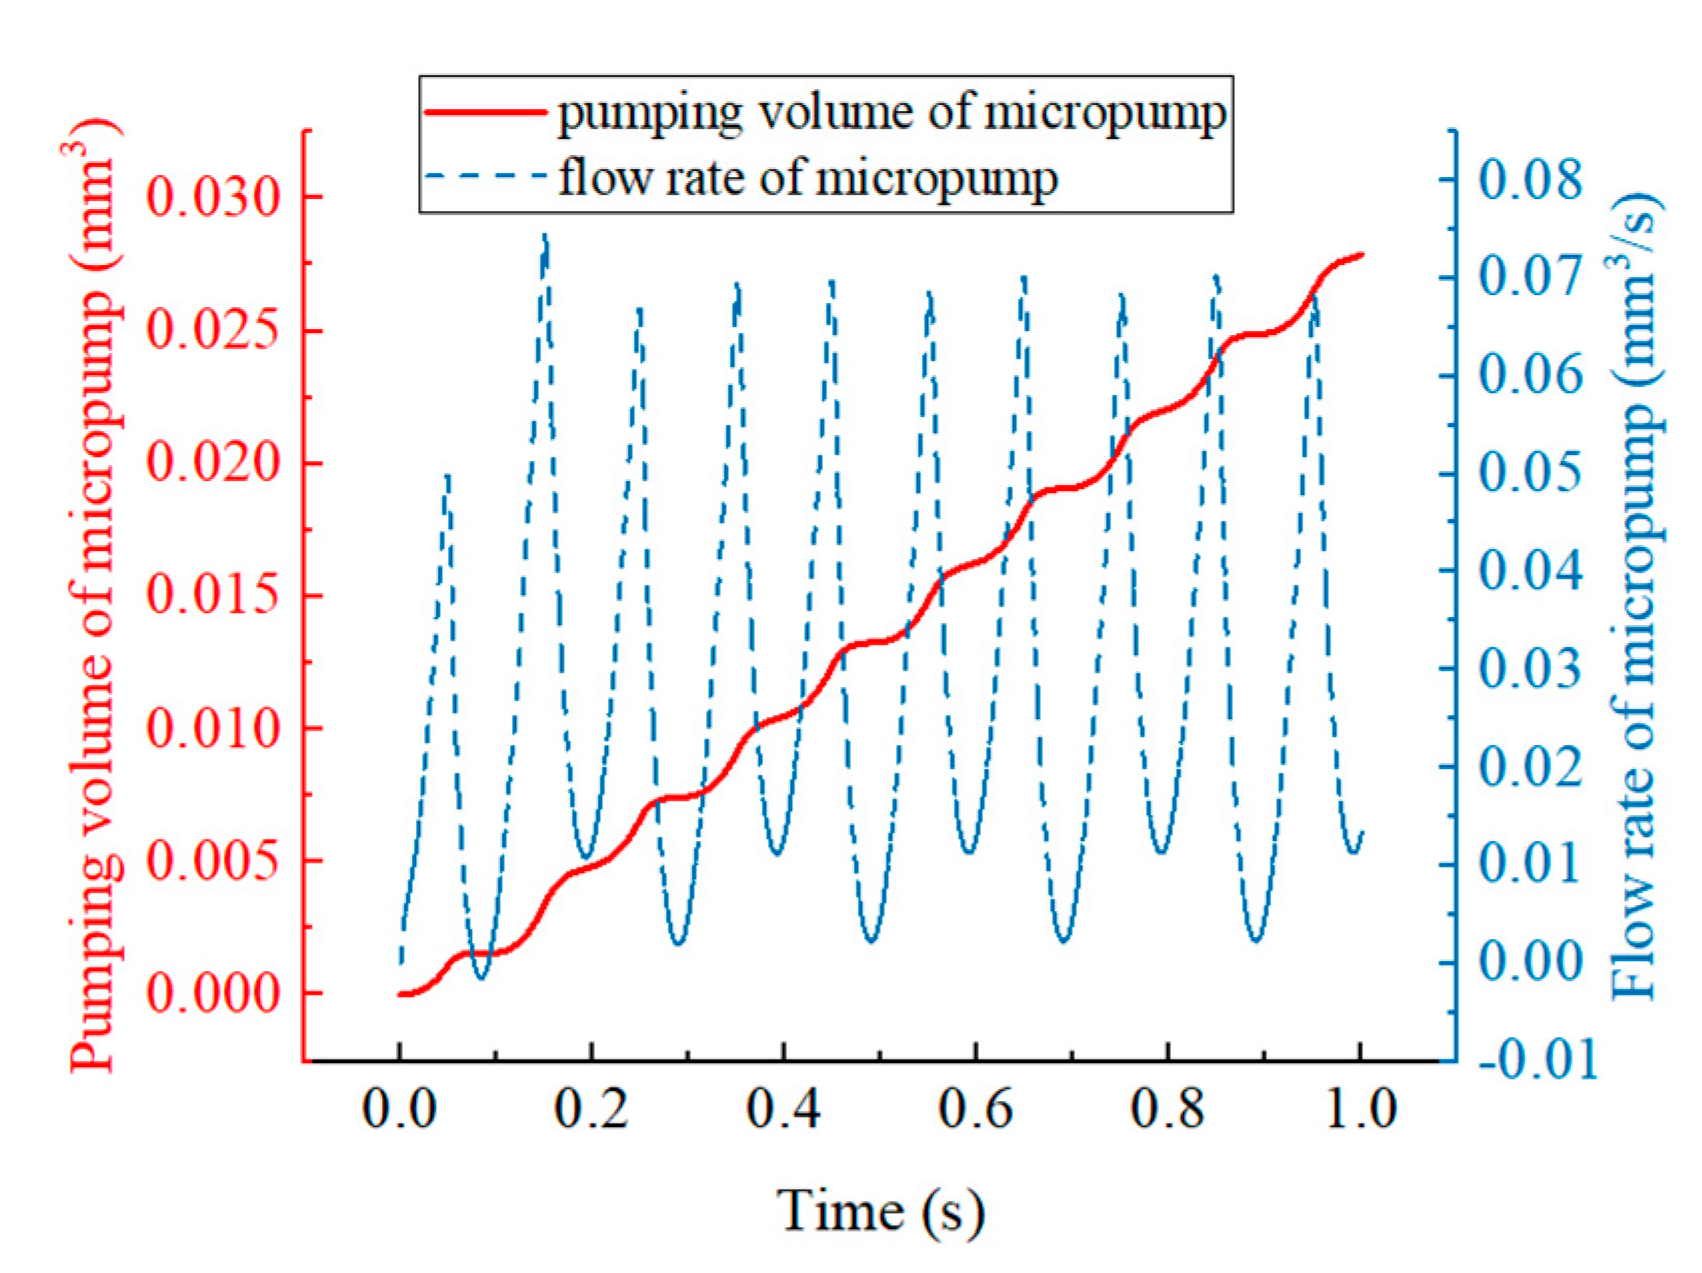
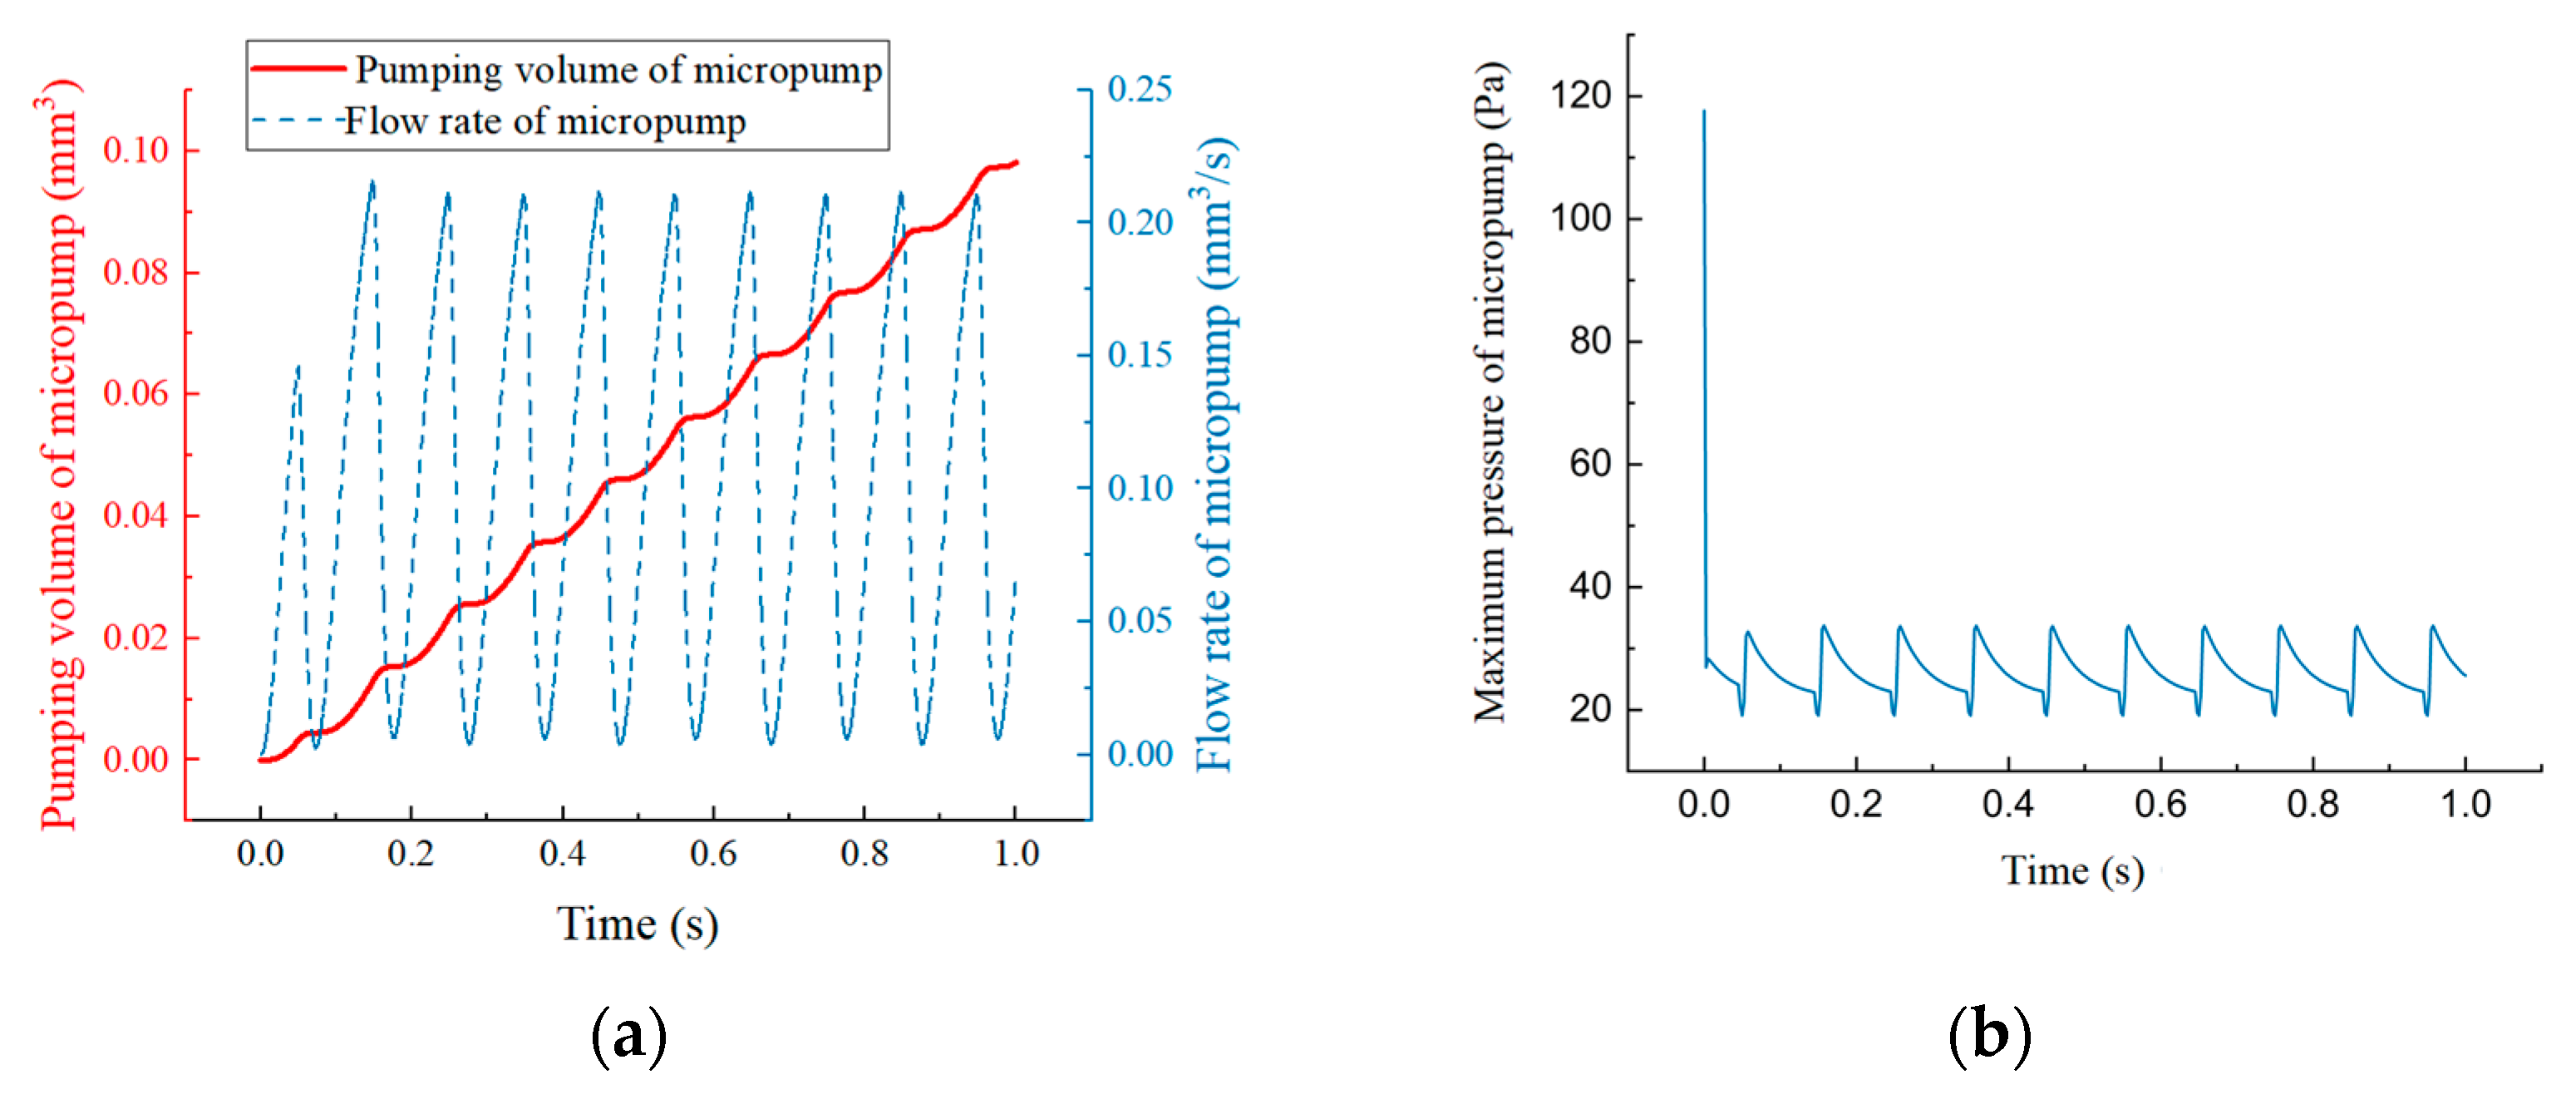
In this section, we will investigate the micropump’s performance by examining two key parameters: pumping volume (Q) and maximum pressure (Pmax). As illustrated in Figure 7, the flow rate (q) at the outlet consistently maintains a positive value throughout the entire pumping cycle, albeit with some minor fluctuations. This steady flow contributes to a gradual increase in the pumping volume (Q), clearly demonstrating the micropump’s effectiveness in preventing significant backflow. Also, it is worth noting that the pumping volume at the outlet of the micropump fluctuates very little, and there is no sharp abrupt change.
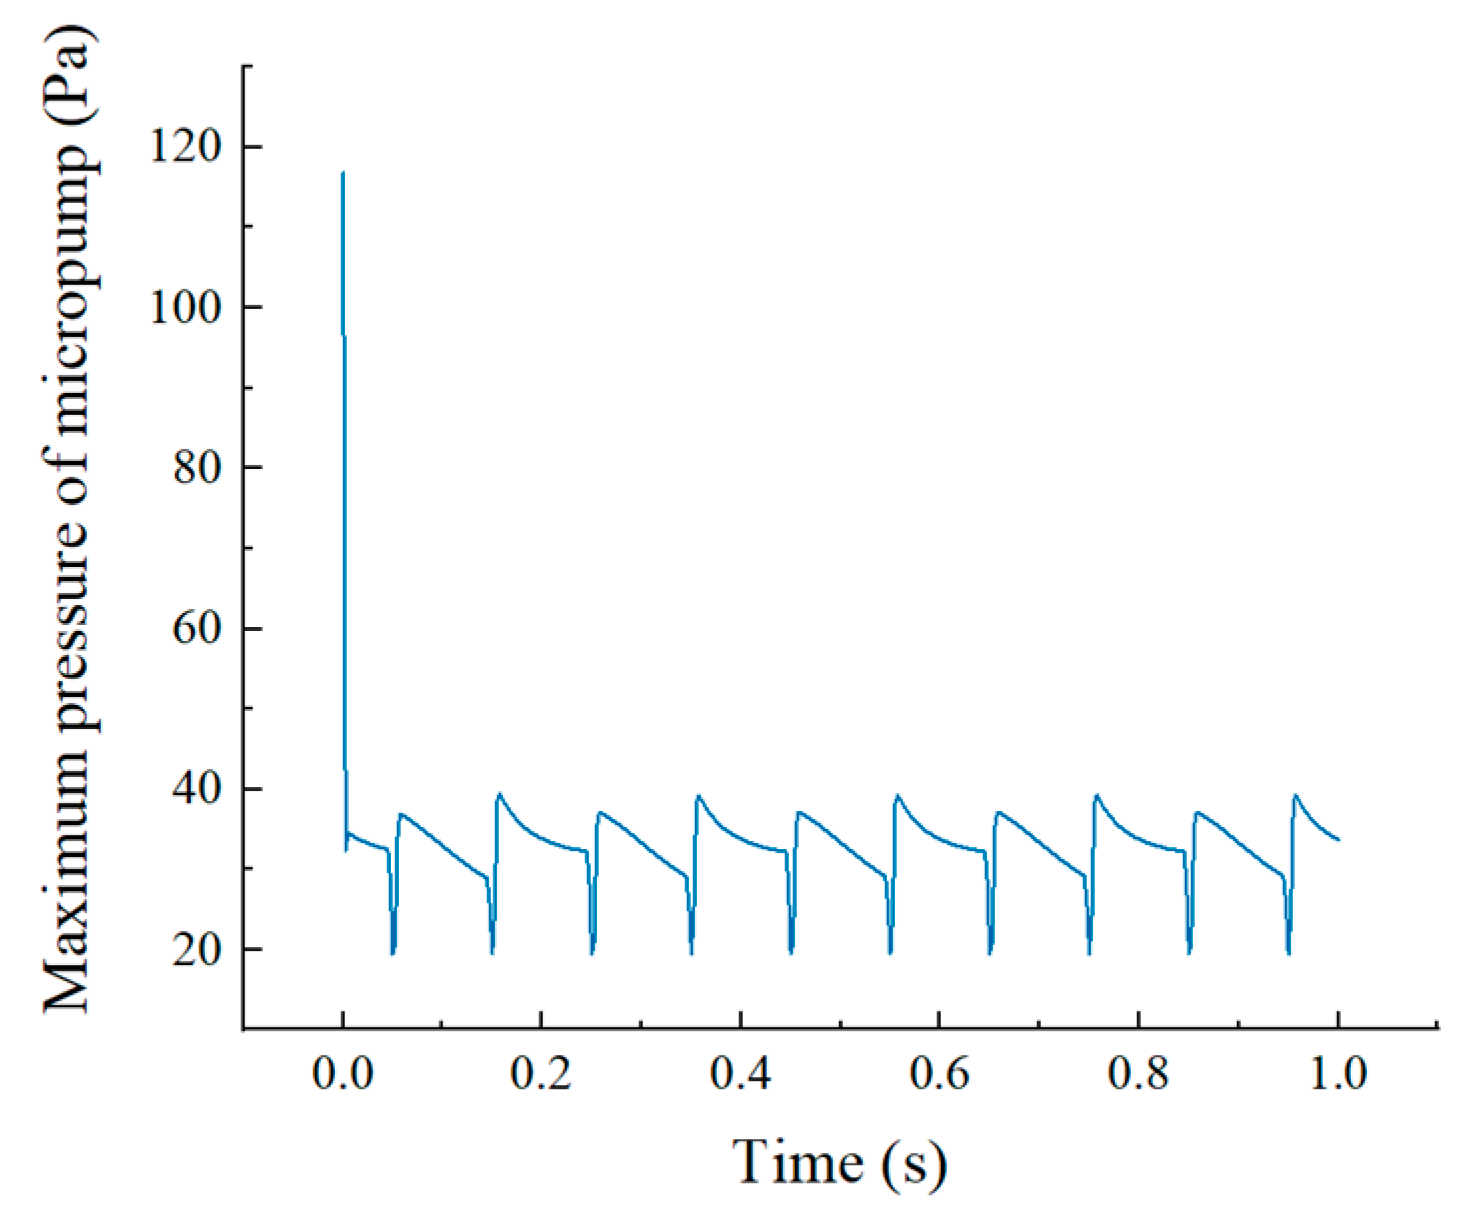
Figure 8 presents the dynamic evolution of the maximum pressure within the micro-pump. Notably, an initial pressure peak is observed at t = 0 s. This occurrence can be attributed to the transient solver of COMSOL 5.5, which requires some time to achieve a stable state. Consequently, we recommend excluding this initial high-pressure data point from our subsequent analysis. However, following this initial spike, the maximum pressure consistently experiences regular fluctuations. It is essential to emphasize that the maximum pressure within the micropump remains consistently low throughout the analysis once we remove the anomalous pressure reading at 0 s.
3.2. Internal Flow Field Analysis
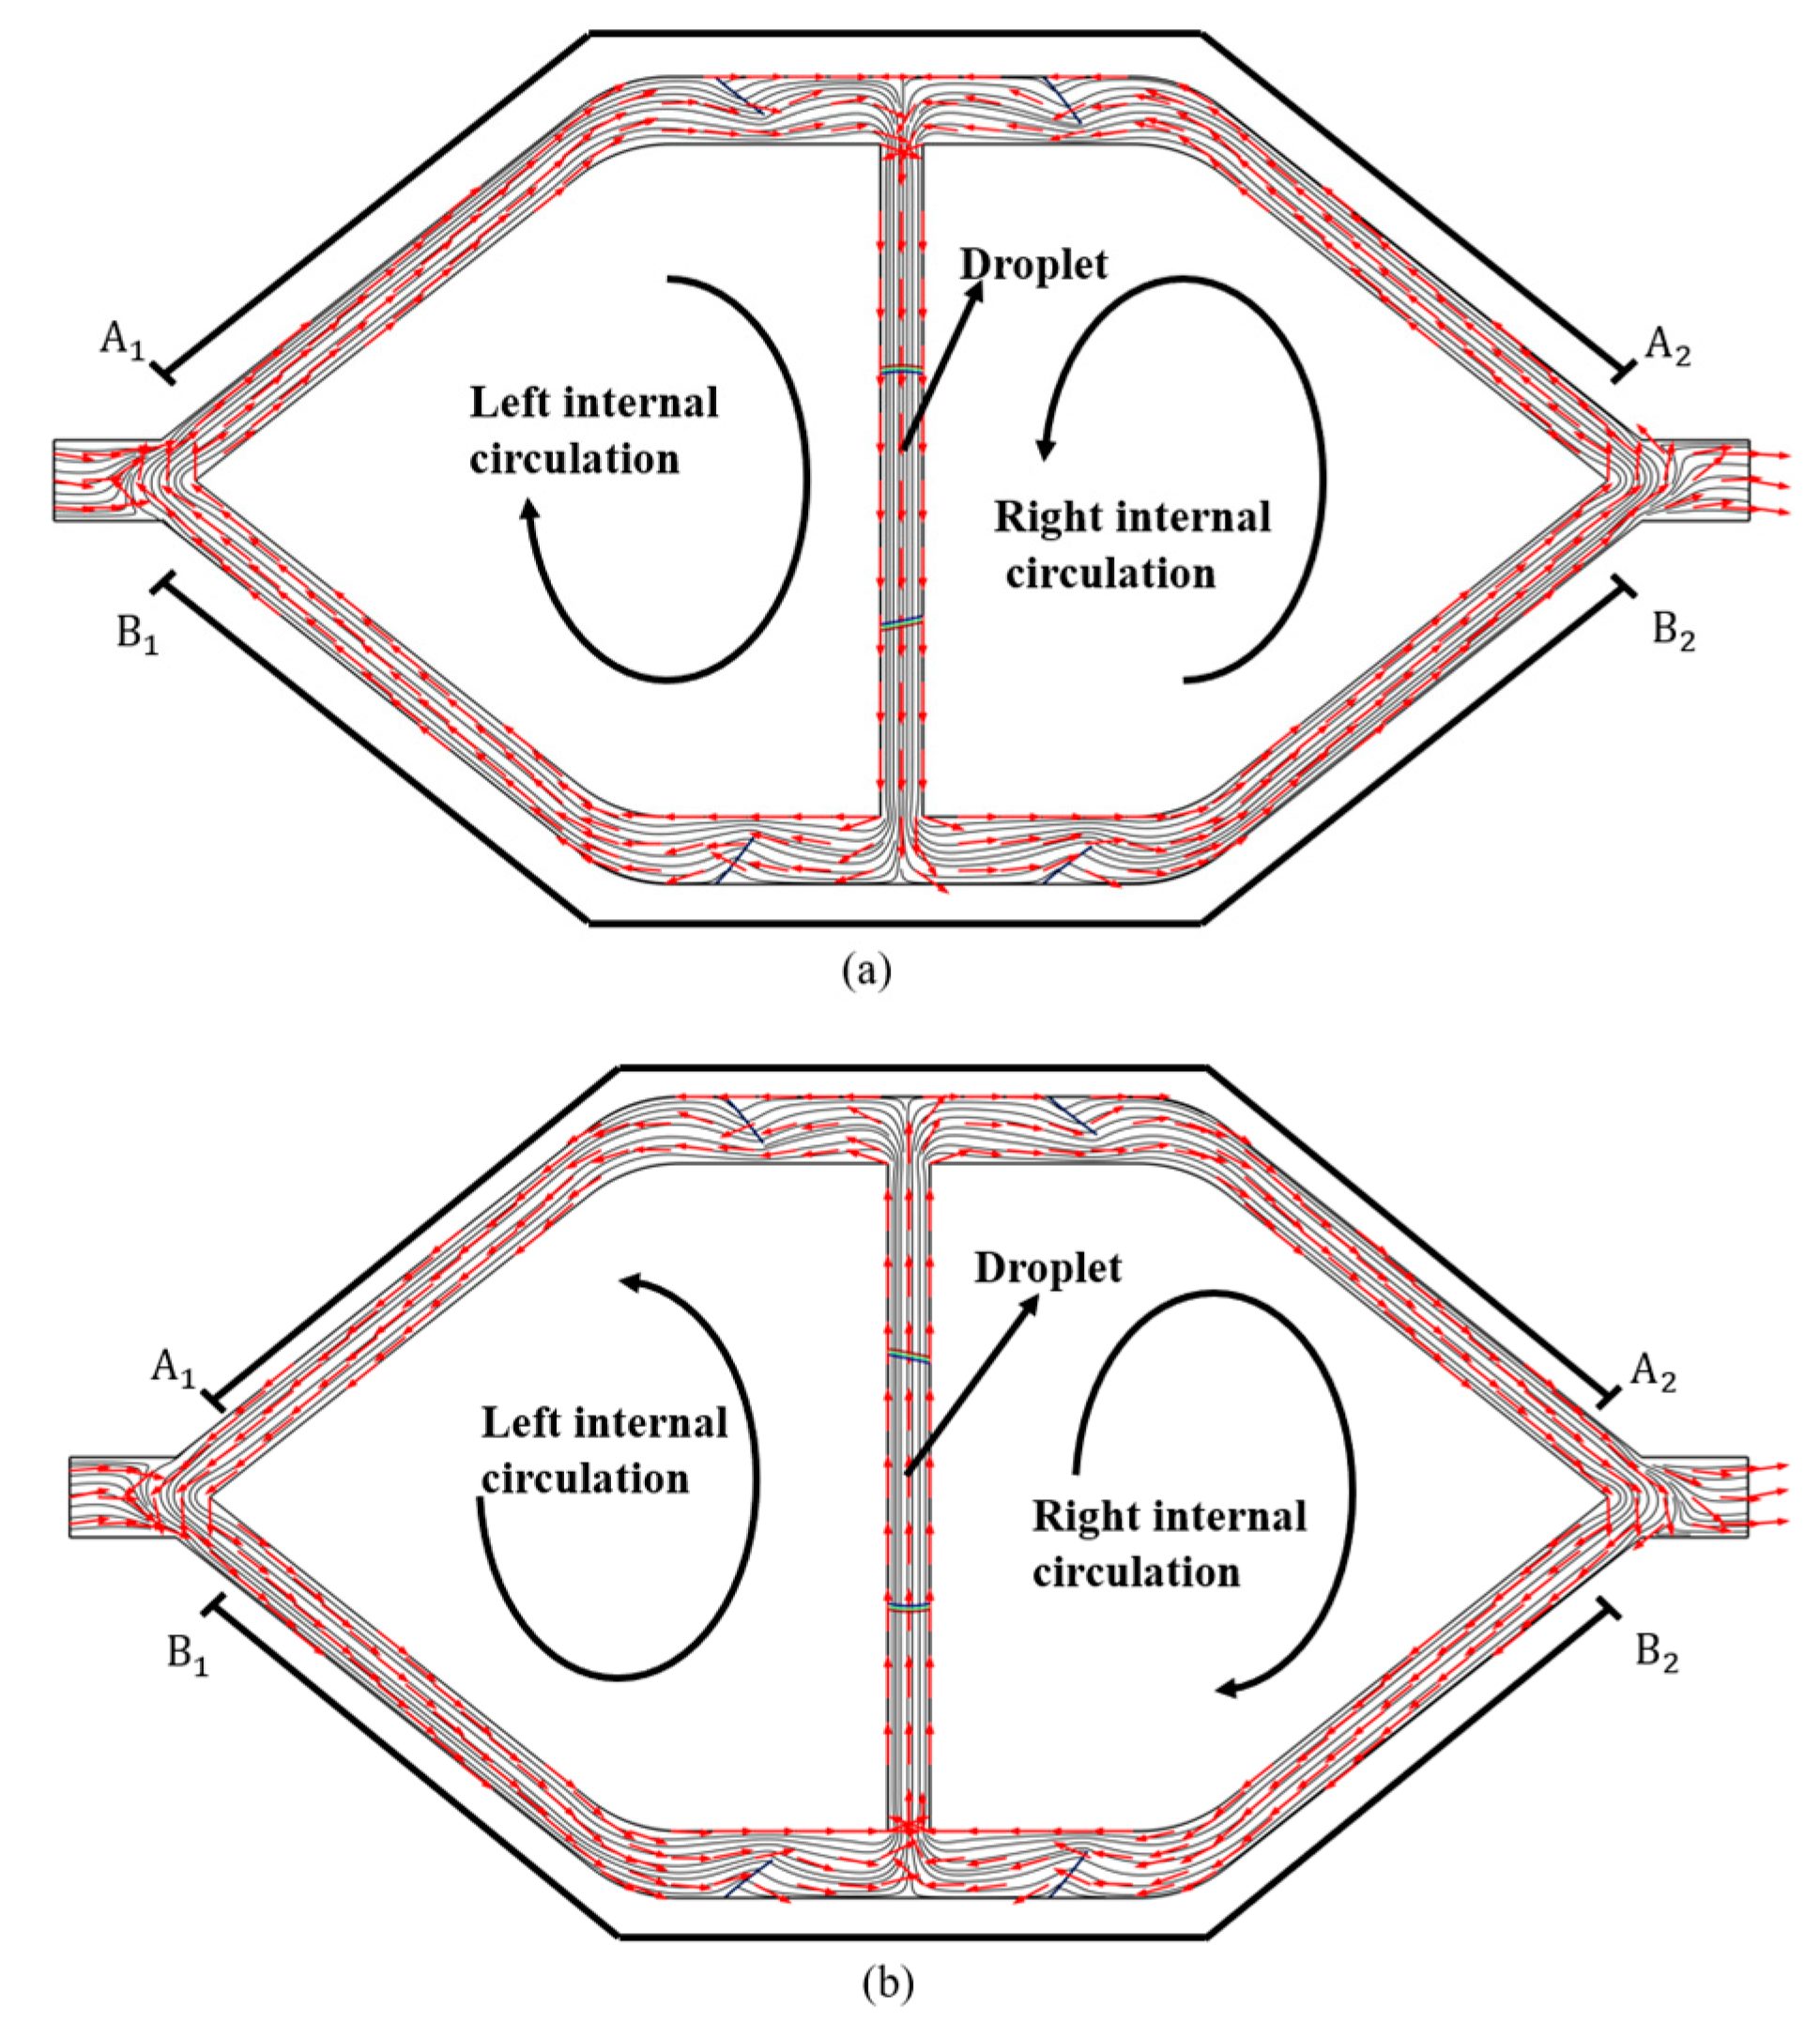
In Figure 9a, we observe the flow field as the KCL droplet descends due to the applied voltage. The microfluid within the pump chamber moves downward along with the KCL droplet [22,23]. Consequently, the microfluid from the pump chamber enters the B1B2 section during the pumping process, while the microfluid in the A1A2 section flows into the pump chamber concurrently. The extent of deformation in the flexible valve varies, leading to differing resistance levels for the microfluid. Consequently, more microfluid flows toward the B2 end compared to the amount directed to the B1 end. Similarly, more microfluid is extracted from the A1 end than from the A2 end. In Figure 9b, the microfluid within the pump chamber moves upwards as the KCL droplet ascends. During this phase, the microfluid flowing into the A1A2 section from the pump chamber acts as a pumping flow, while the microfluid entering the pump chamber from the B1B2 section serves as a supply. Under these conditions, the microfluid flowing towards the A2 end from the pump chamber exceeds that directed to the A1 end. Likewise, the microfluid flowing into the pump chamber from the B1 end surpasses that from the B2 end.
Upon examining the streamline distribution at the entrance and exit of the micropump, as depicted in Figure 9a,b, a continuous curving of the streamlines becomes evident near the inlet and outlet. This curvature indicates that a certain quantity of liquid flows back into the micropump. Regardless of whether the KCL droplet is moving upwards or downwards, this liquid is pumped out and subsequently returns to the micropump, forming a leftward circulation pattern. Simultaneously, the liquid near the outlet is pumped out and flows back into the micropump, generating a rightward circulation.
The distinction lies in the rotation direction of these circulations. When the KCL droplet moves downward, the left circulation is clockwise, and the right circulation is anticlockwise. Conversely, when the KCL droplet moves upward, the left circulation is anticlockwise, and the right circulation is clockwise. These left and right internal circulation directions are contingent on the KCL droplet’s movement. It can be deduced that both the motion of the microfluid and the directions of the left and right internal circulations change in response to alterations in the KCL droplet’s direction.
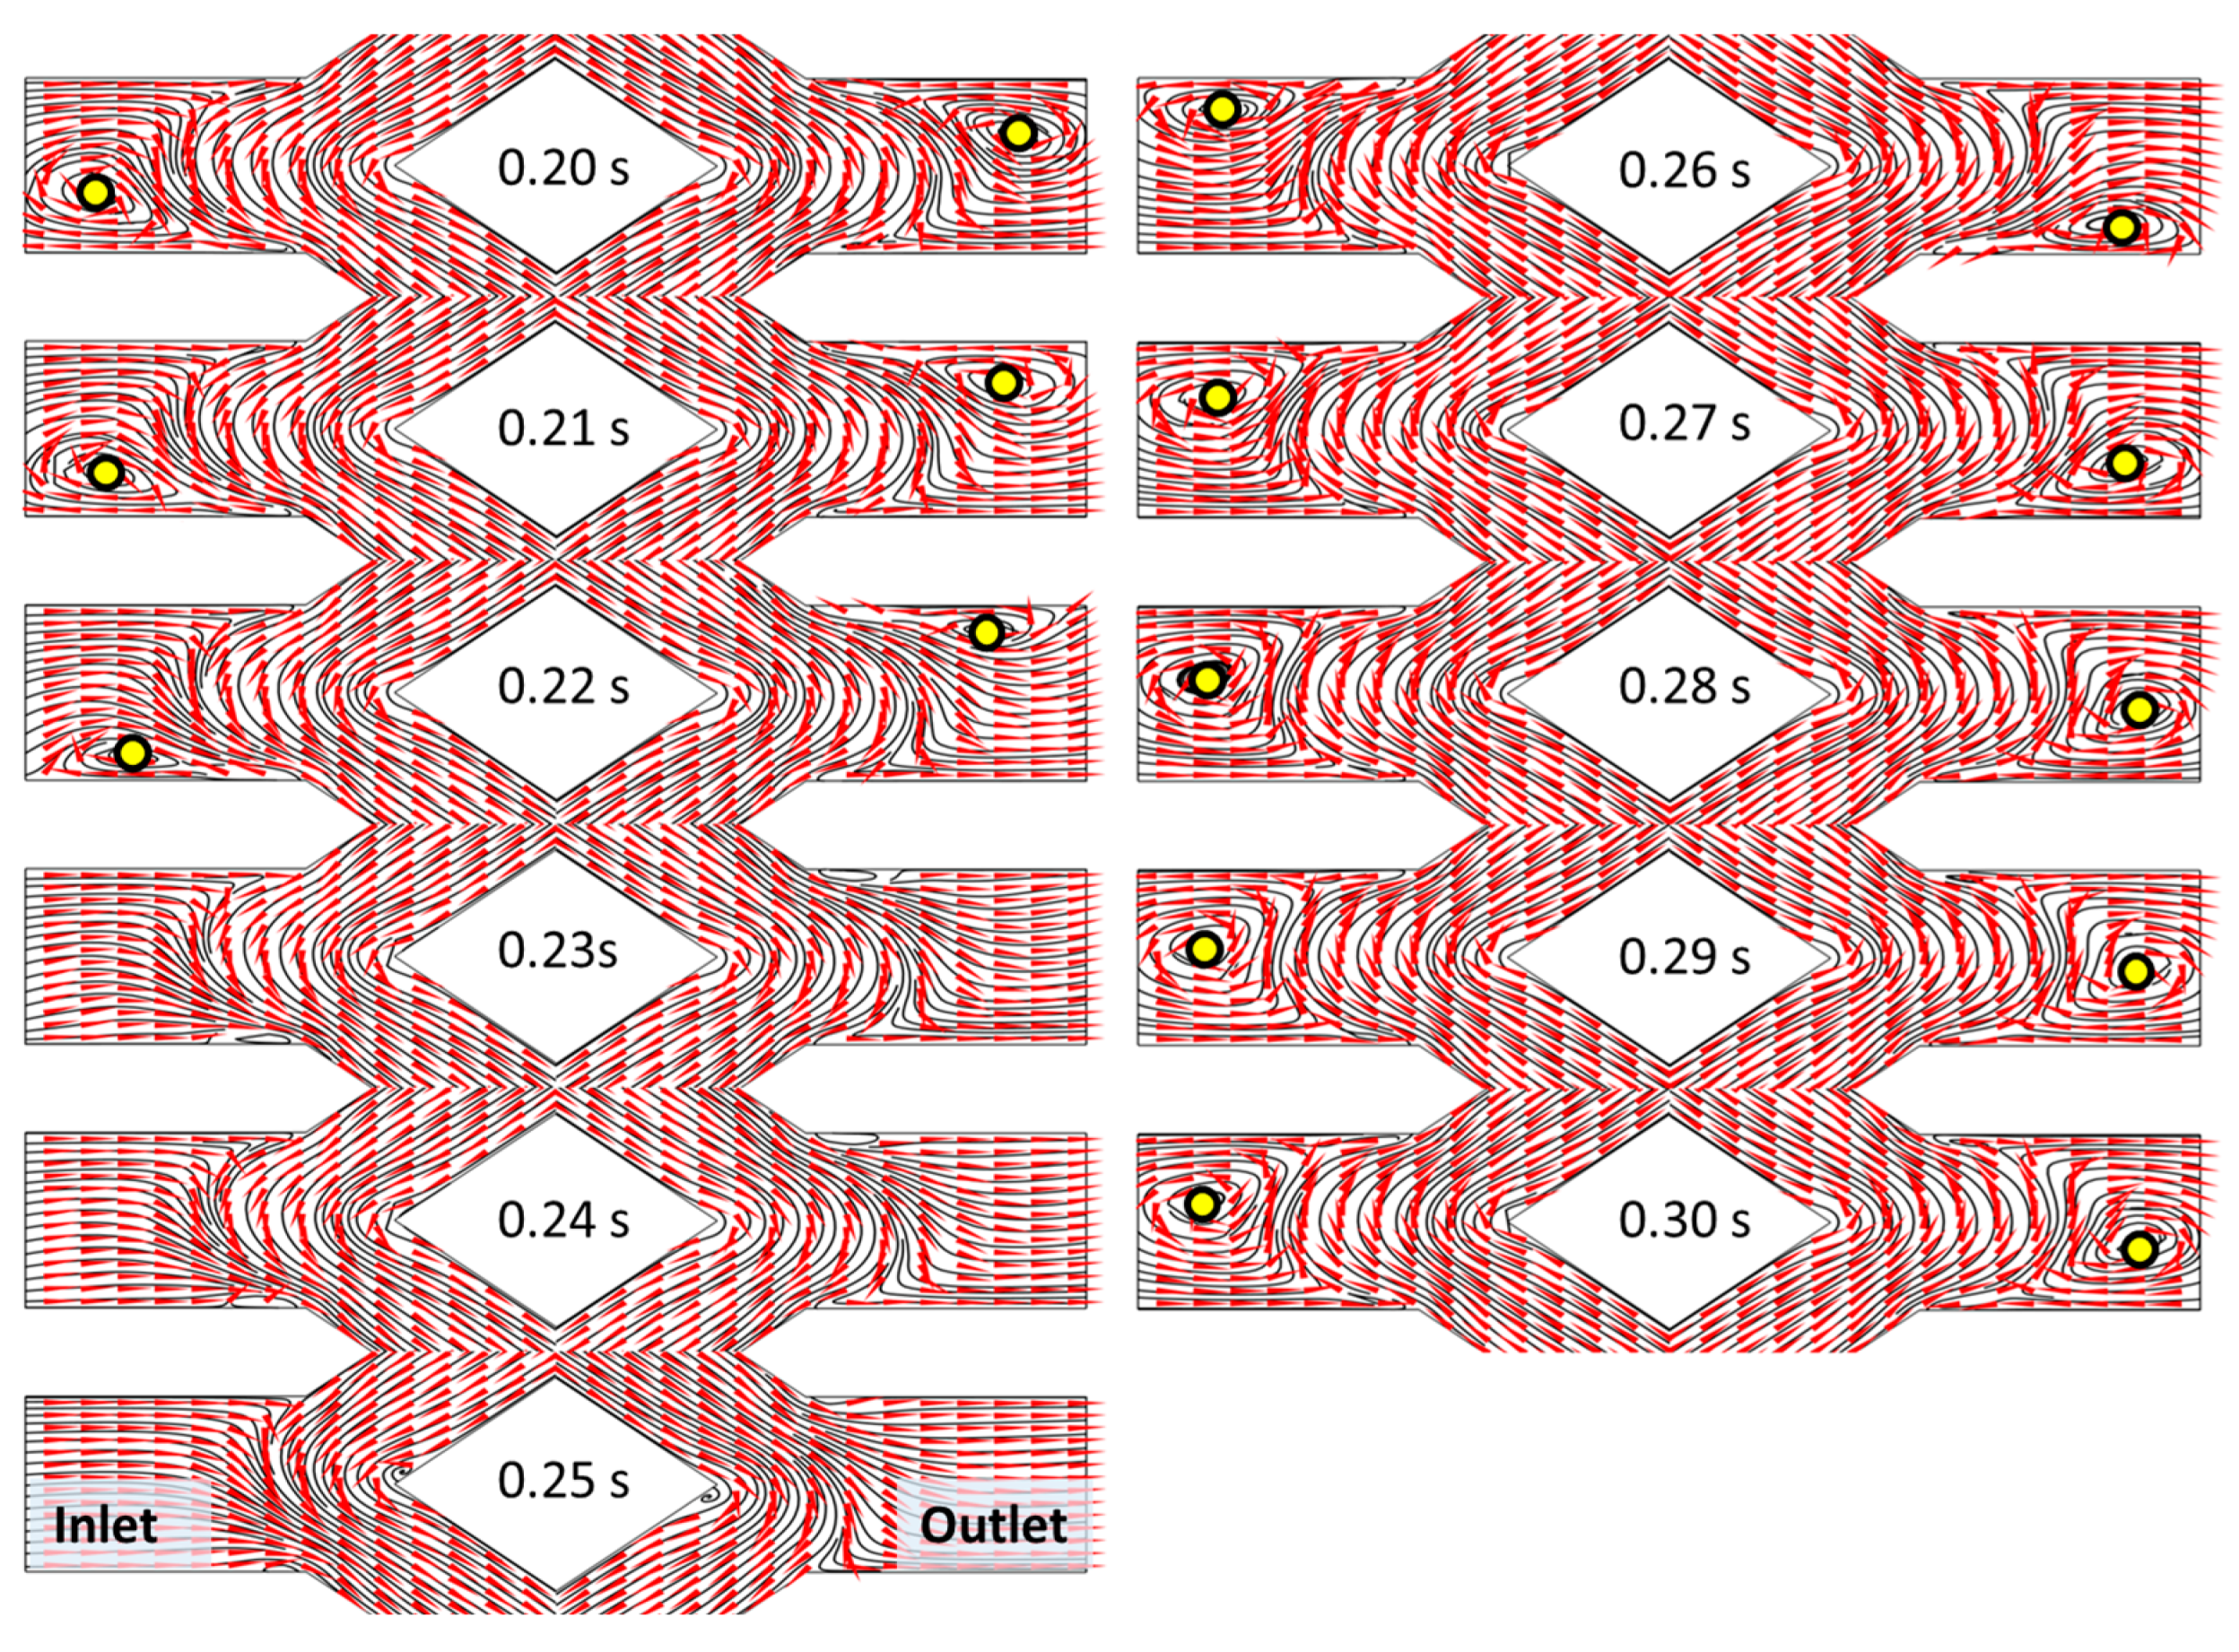
Vortices within the micropump’s internal flow field tend to emerge in regions where the direction of the left and right internal circulation undergoes change. Figure 10 provides a magnified view of the internal flow at the micropump’s inlet and outlet at various time points, ranging from 0.2 s to 0.3 s. The visualization shows the presence of vortices at both the inlet and outlet of the micropump. Remarkably, the figure illustrates the downward movement of a vortex from the center of the inlet, vanishing between 0.2 s and 0.25 s. During this time frame, the vortex at the outlet ascends from the center of the exit and ultimately dissipates. In the subsequent time interval from 0.26 s to 0.3 s, a vortex reappears at the upper end of the inlet and progresses towards the center. Simultaneously, a vortex forms at the lower part of the outlet and converges towards the center. It is essential to note that these alterations transpire in the first half of the cycle, and the variations in the second half of the cycle are inverse to those in the first half. The generation of these vortices results from the interplay between the internally circulating microfluid, which has altered its velocity direction, and the microfluid at the inlet and outlet, which has not yet changed its velocity. By observing the streamlines and velocity vector arrows around the vortex, it can be observed that the microfluids around the vortex are less mixed with each other, and their flow state still conforms to the laminar flow characteristics without any turbulence.
3.3. Flexible Valve Deformation
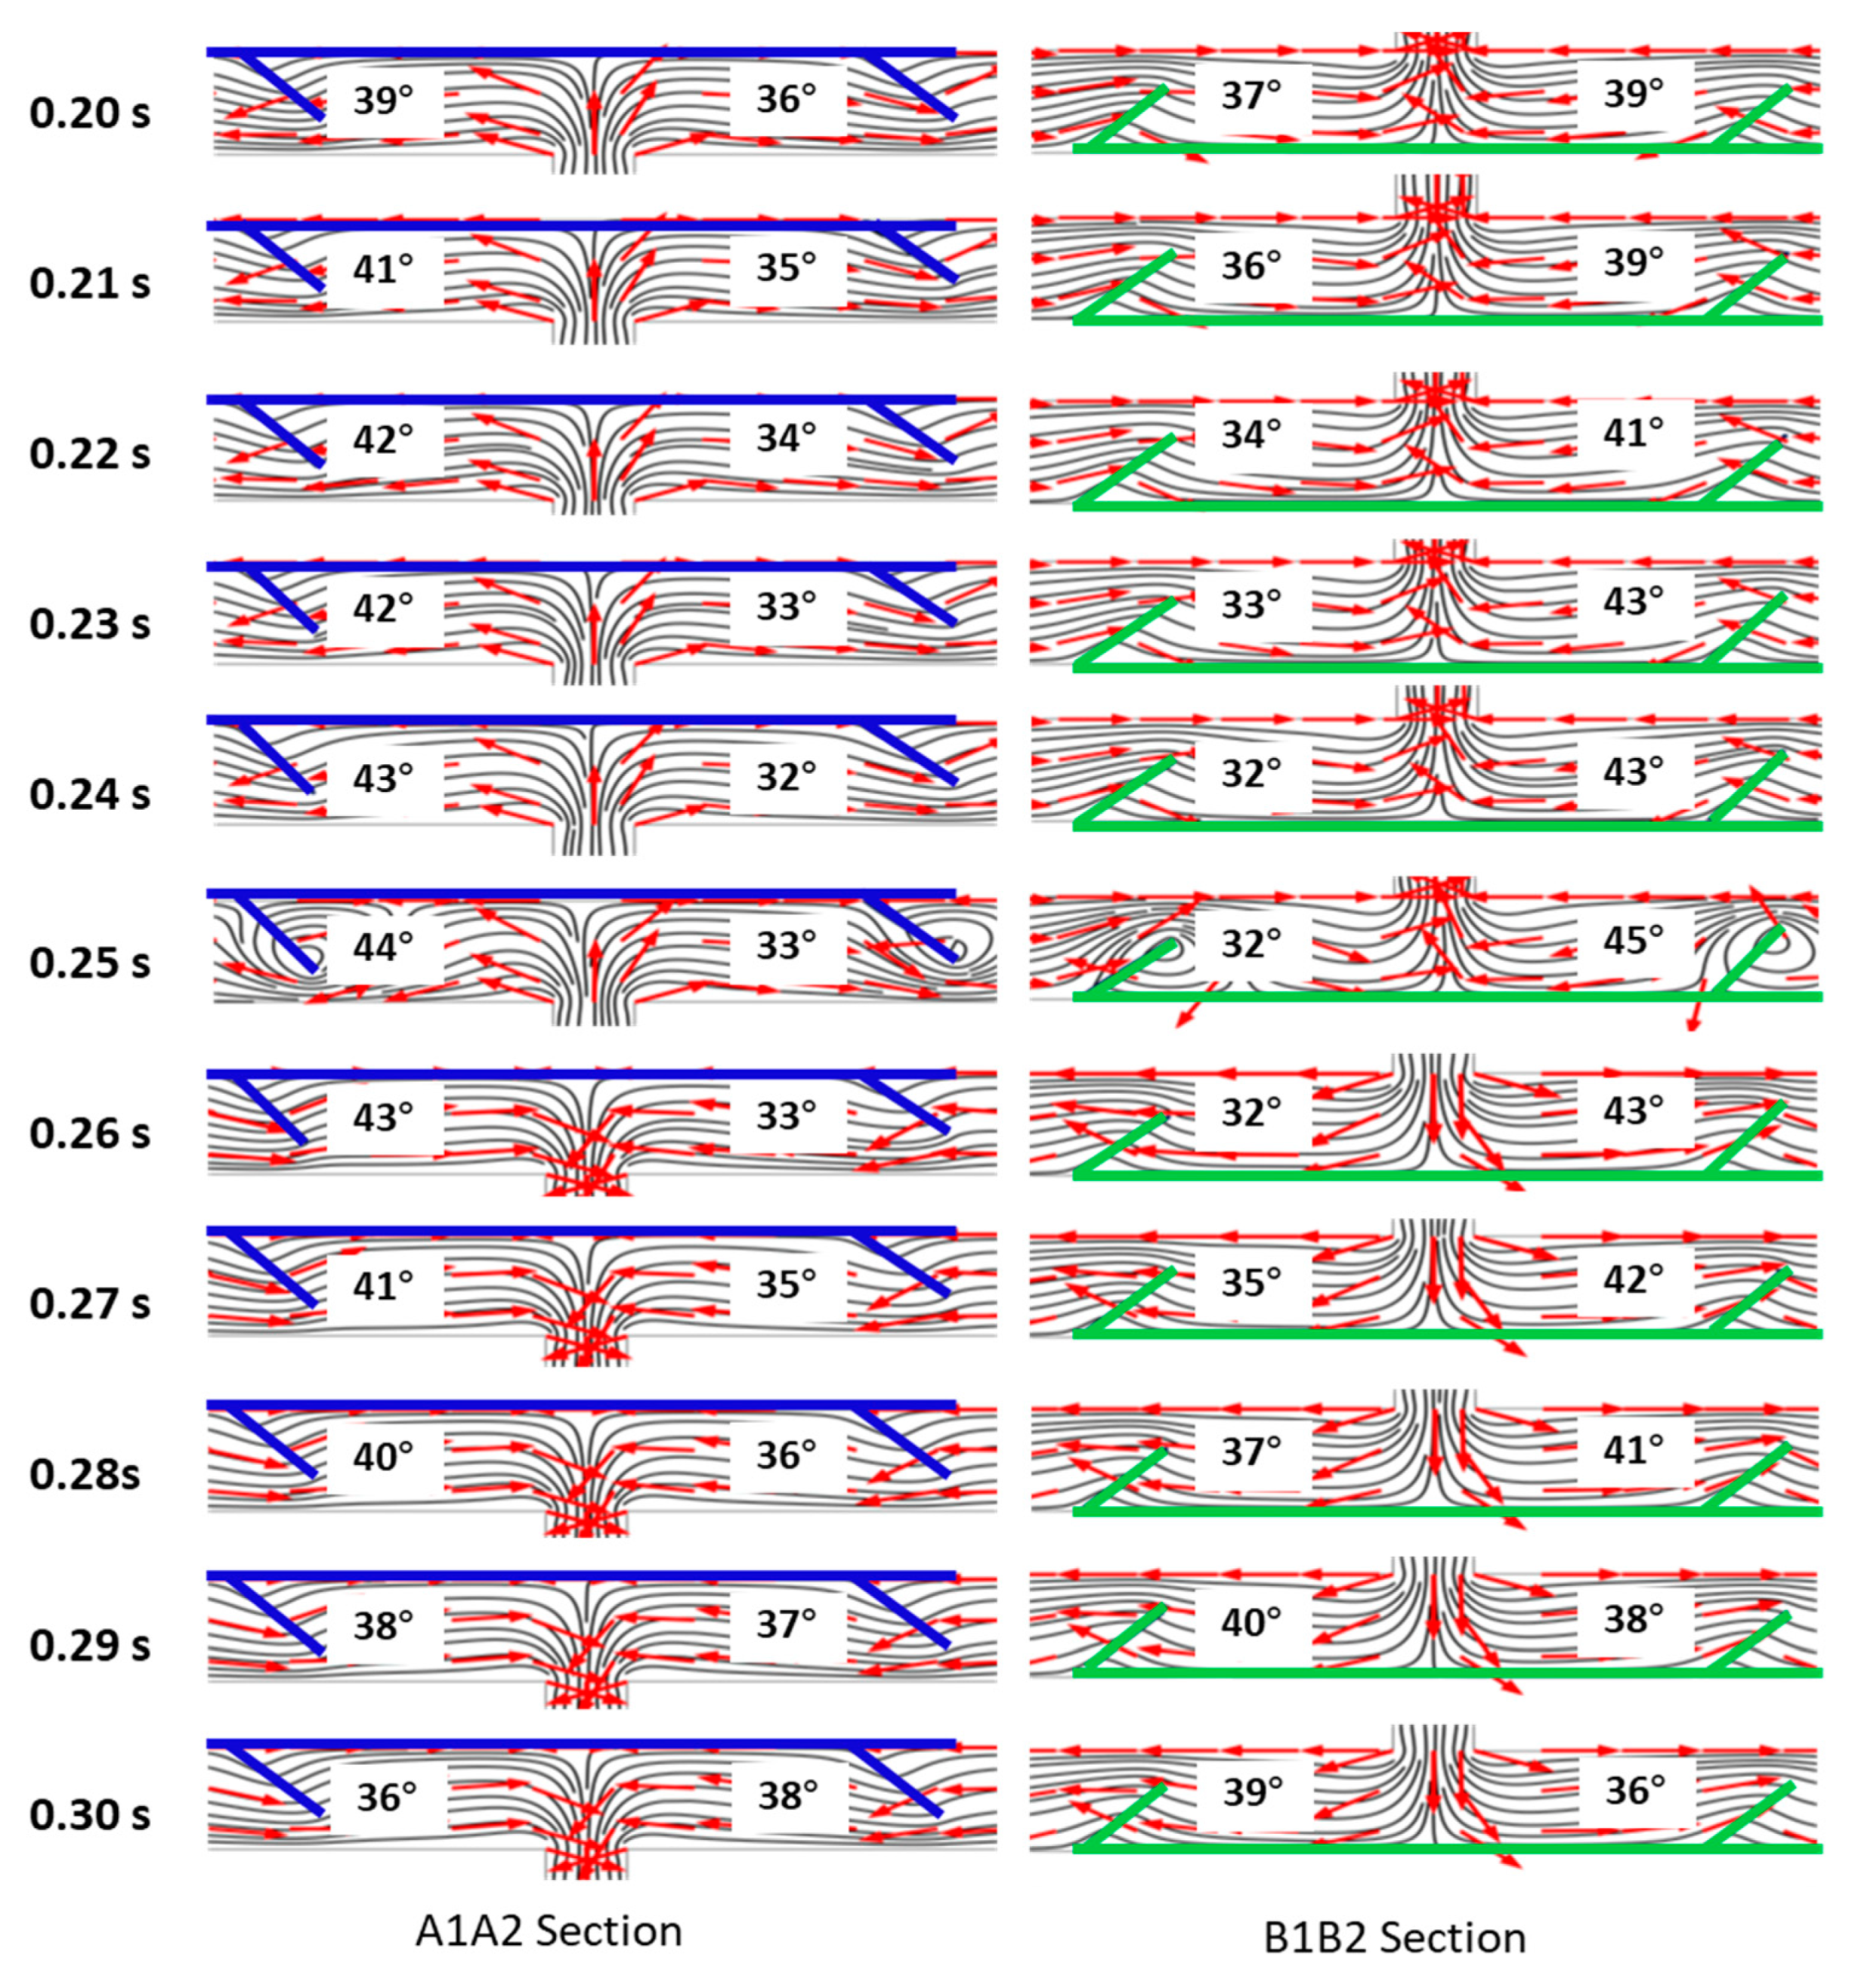
The extent of resistance encountered by the microfluid can be gauged by examining the deformation of the flexible valve. Consequently, the issue of flexible valve deformation is also a topic of significance. Figure 11 provides an amplified perspective of the internal flow within the flexible valve at various time points, ranging from 0.2 s to 0.3 s, encompassing half a period. This illustration reveals that the A1A2 and B1B2 sections experience discernible deformation, yet it is crucial to note that the degree of deformation in the flexible valve is somewhat limited. As a result, the disparity in resistance posed to the microfluid is relatively minor.
3.4. Analysis of Velocity Distribution in the Micropump
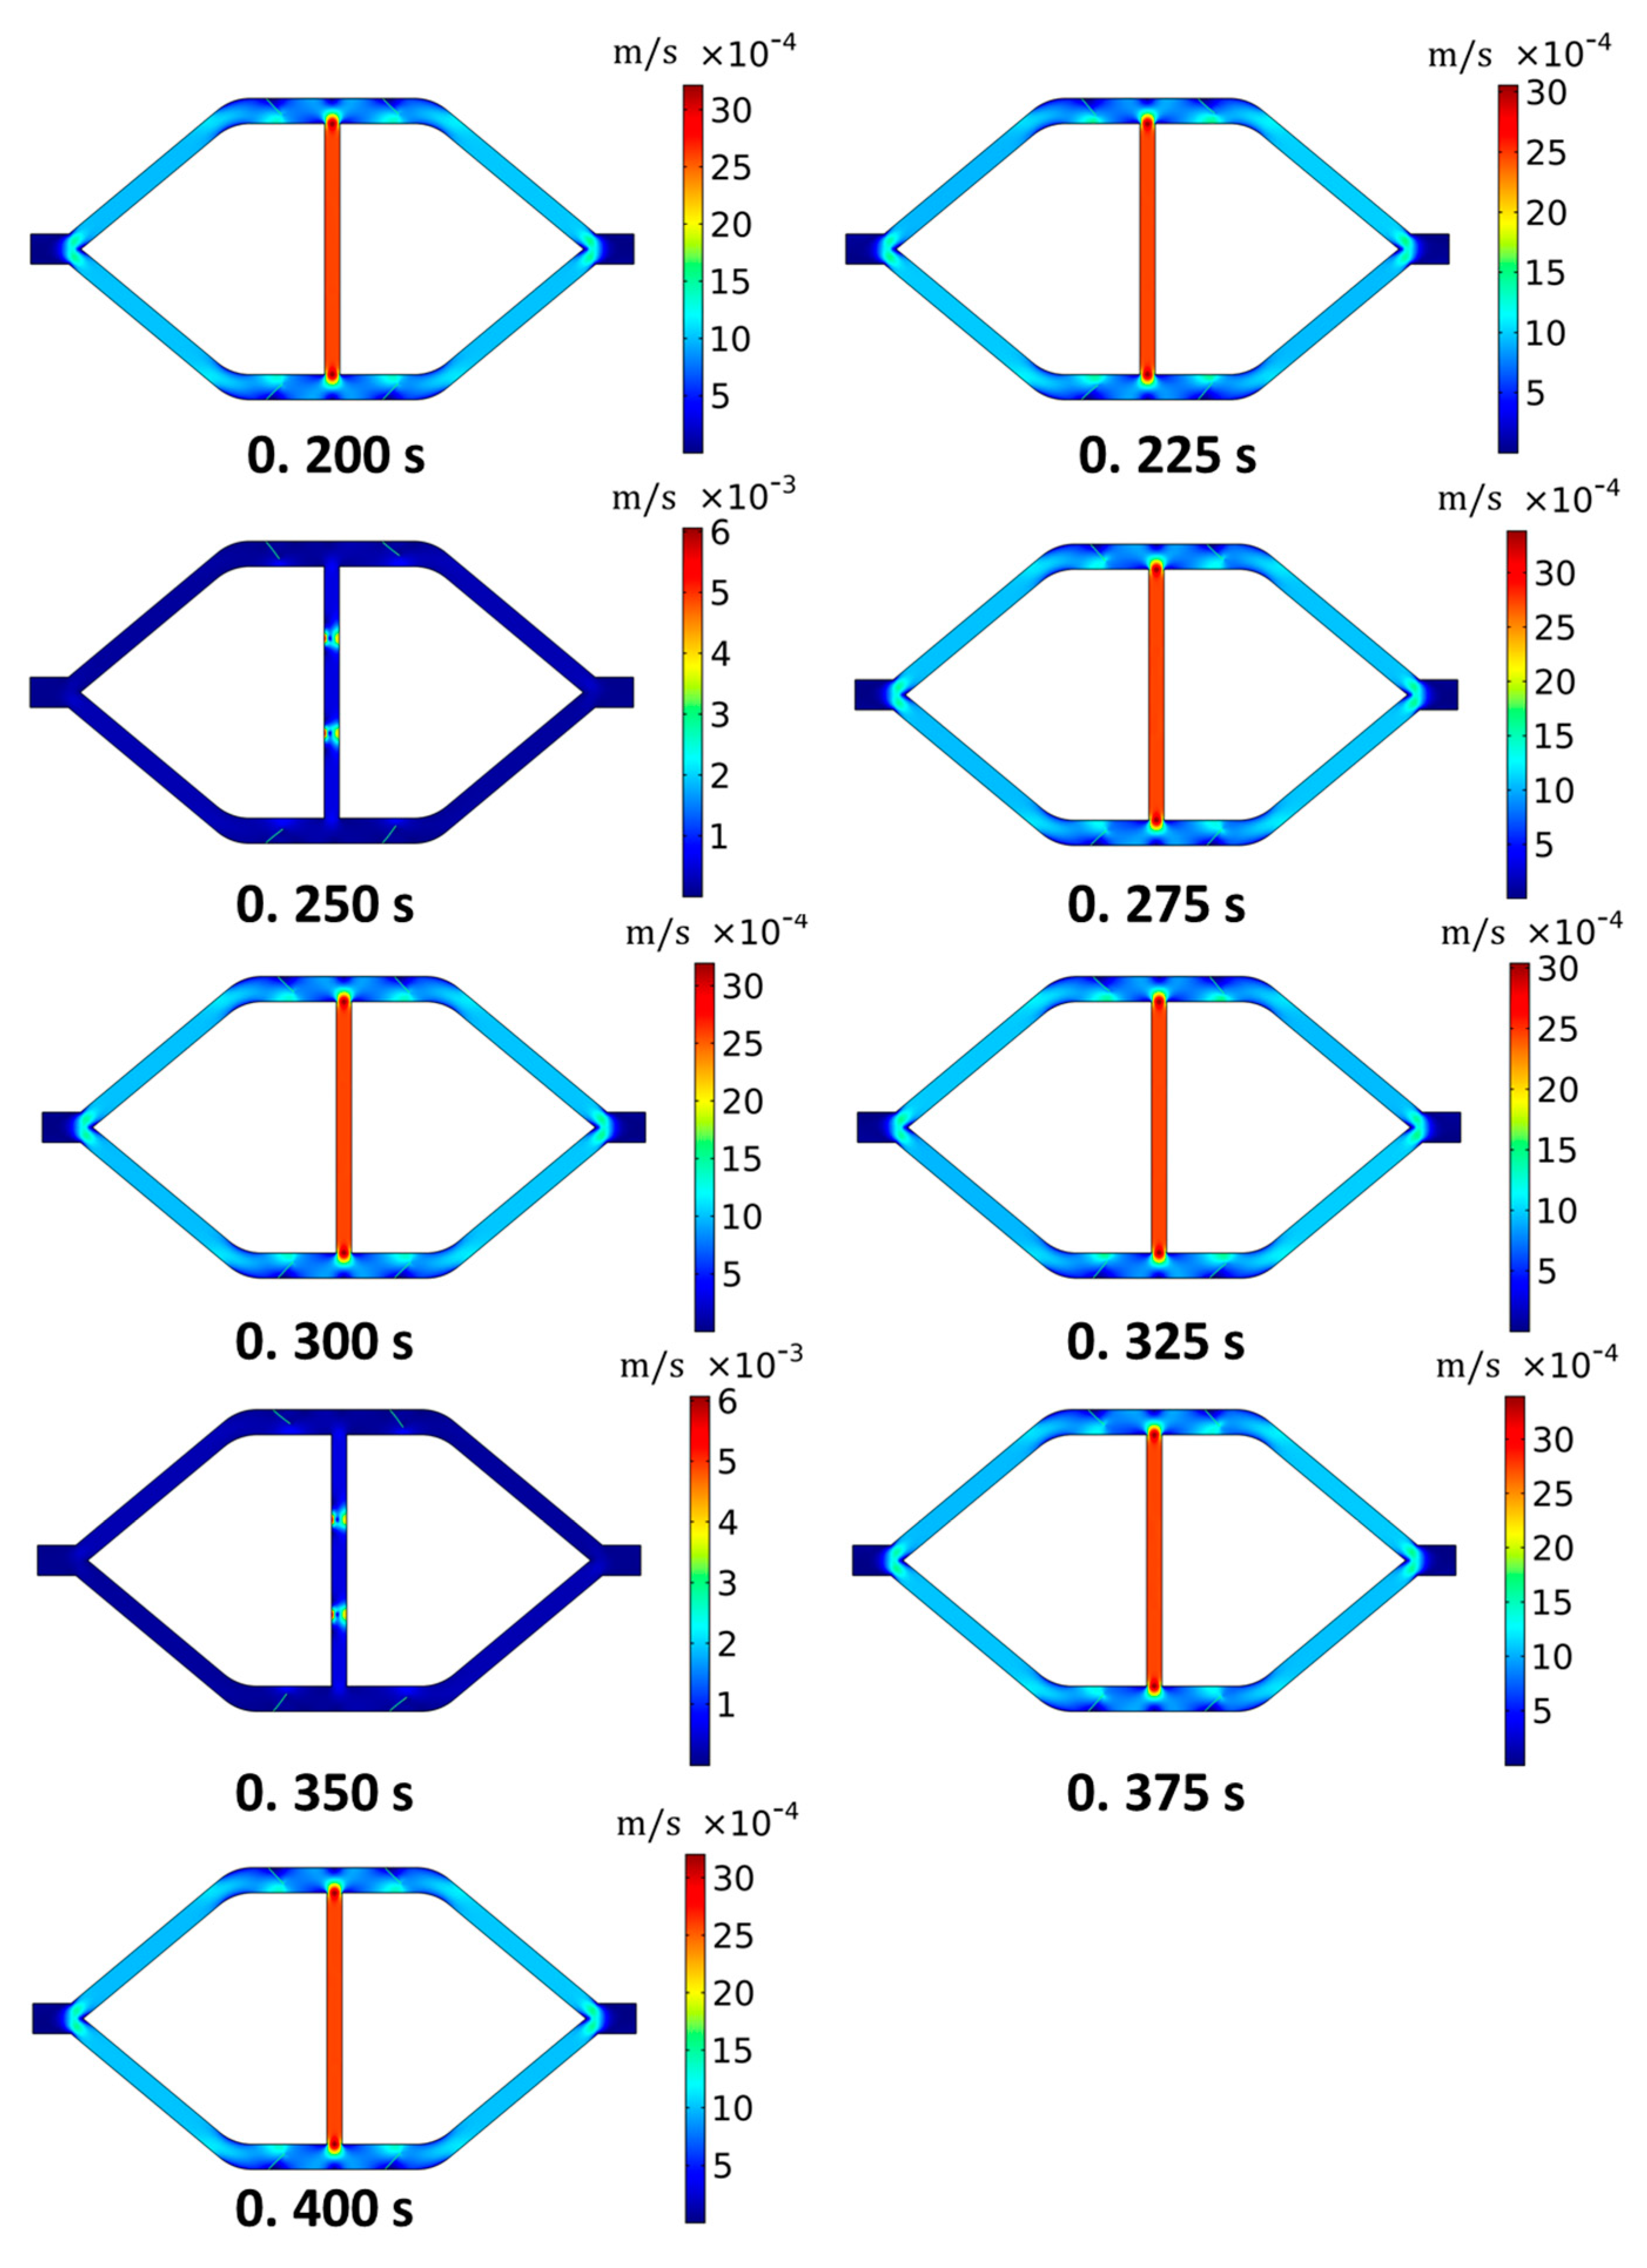
Figure 12 depicts the velocity contours of the parallel EWOD flexible valve micropump over the course of one full period, spanning from 0.2 s to 0.4 s. Notably, at 0.25 s and 0.35 s, the internal flow velocity within the micropump is considerably lower than at other time points, signifying a relatively static state. This phenomenon arises from variations in the electrowetting angle (θew) of the KCL droplet during these moments. Consequently, when the electrowetting angle changes at 0.25 s and 0.35 s, the velocity at each end of the KCL droplet is significantly higher than in other regions. The KCL droplet’s motion primarily occurs within the pump chamber, which has a width of 300 μm that is narrower than the 500 μm width of the microchannel. This explains why the maximum velocity within the micropump is situated in the pump chamber for the rest of the time in Figure 11. Moreover, it is evident that the velocity at the inlet and outlet of the micropump is considerably lower than in other regions. This leads to the conclusion that the primary driver of the overall flow within the micropump is the result of the left and right internal circulation, along with the microfluid flow at the inlet and outlet of the micropump.
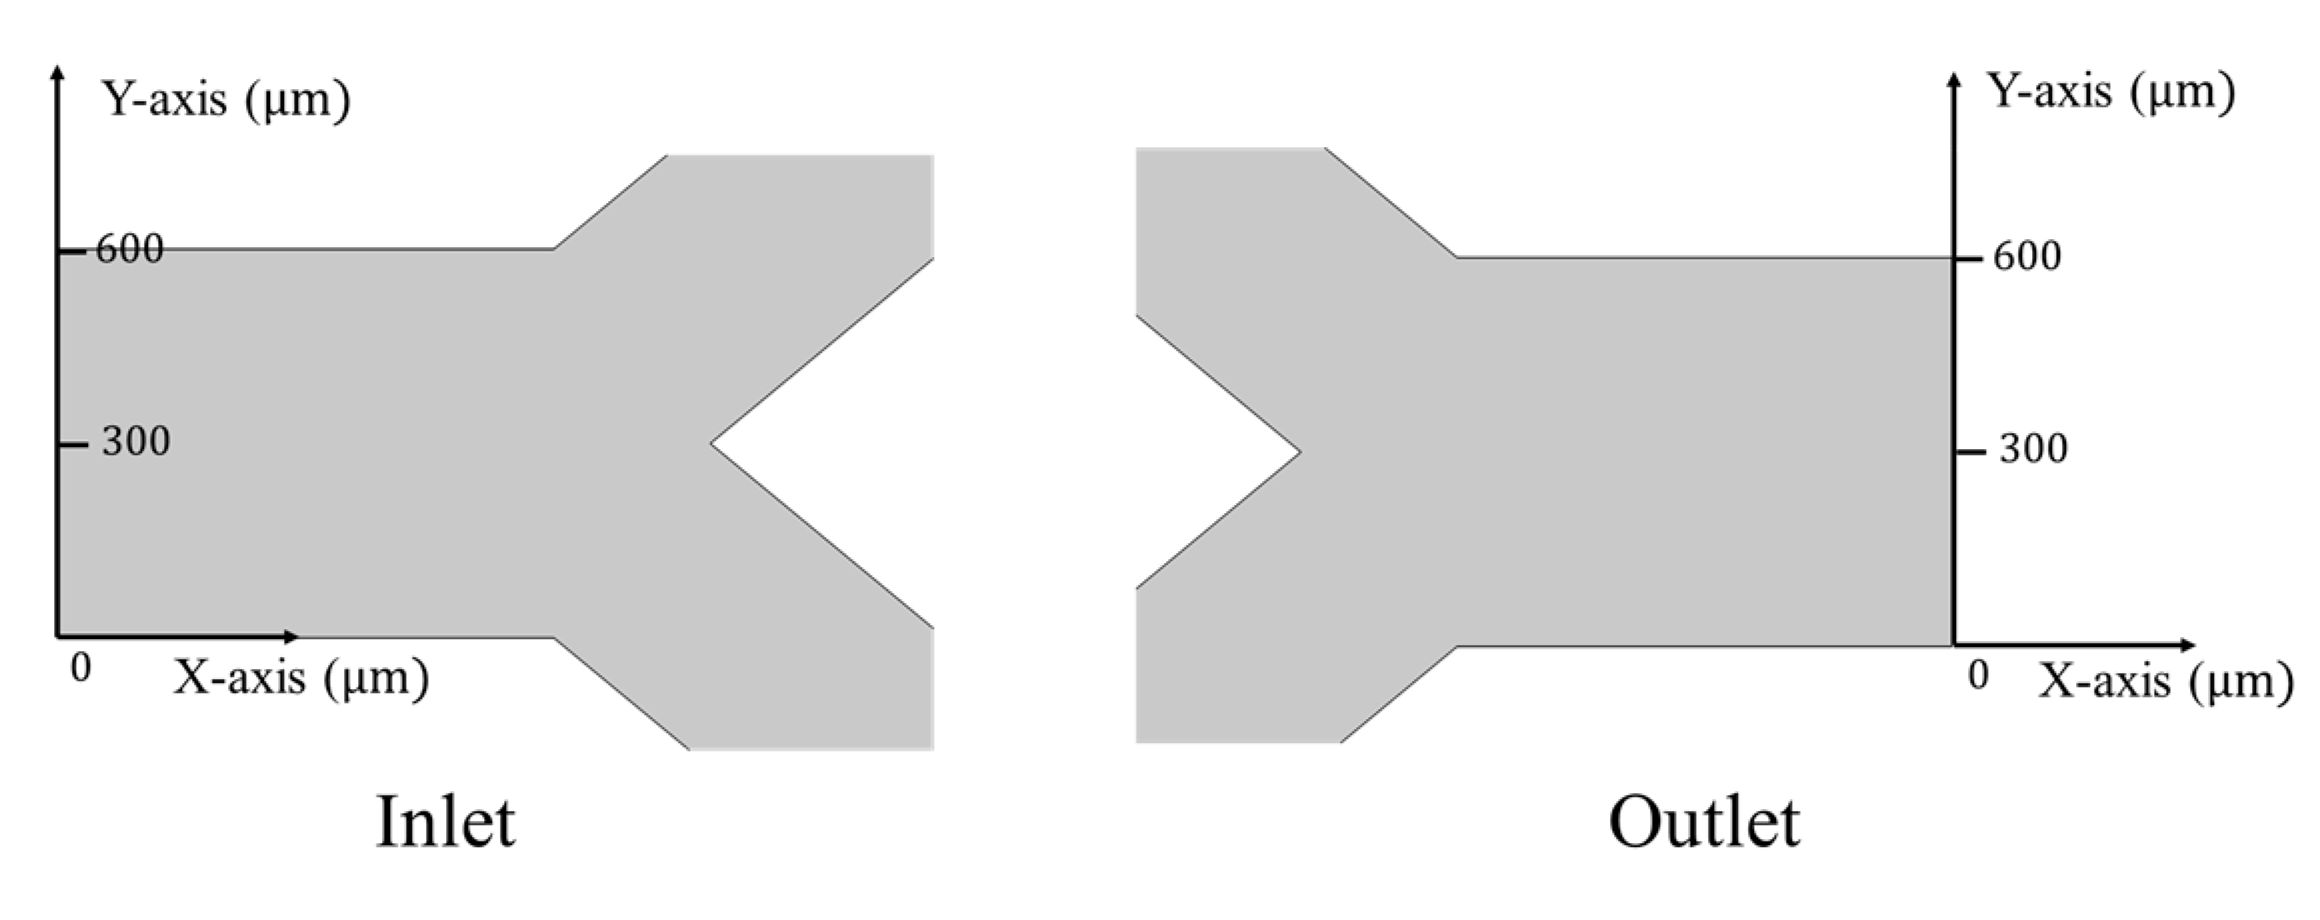
Hereinafter, we will analyze the velocity distribution in proximity to the micropump’s inlet and outlet. To facilitate this discussion, we have established two plane Cartesian coordinate systems, as illustrated in Figure 13. In these coordinate systems, we will measure the velocities in both the X and Y directions to assess the presence of any macroscopic backflow within the micropump. This analysis will help us understand whether the flow at the inlet and outlet is influenced by the left and right internal circulation.
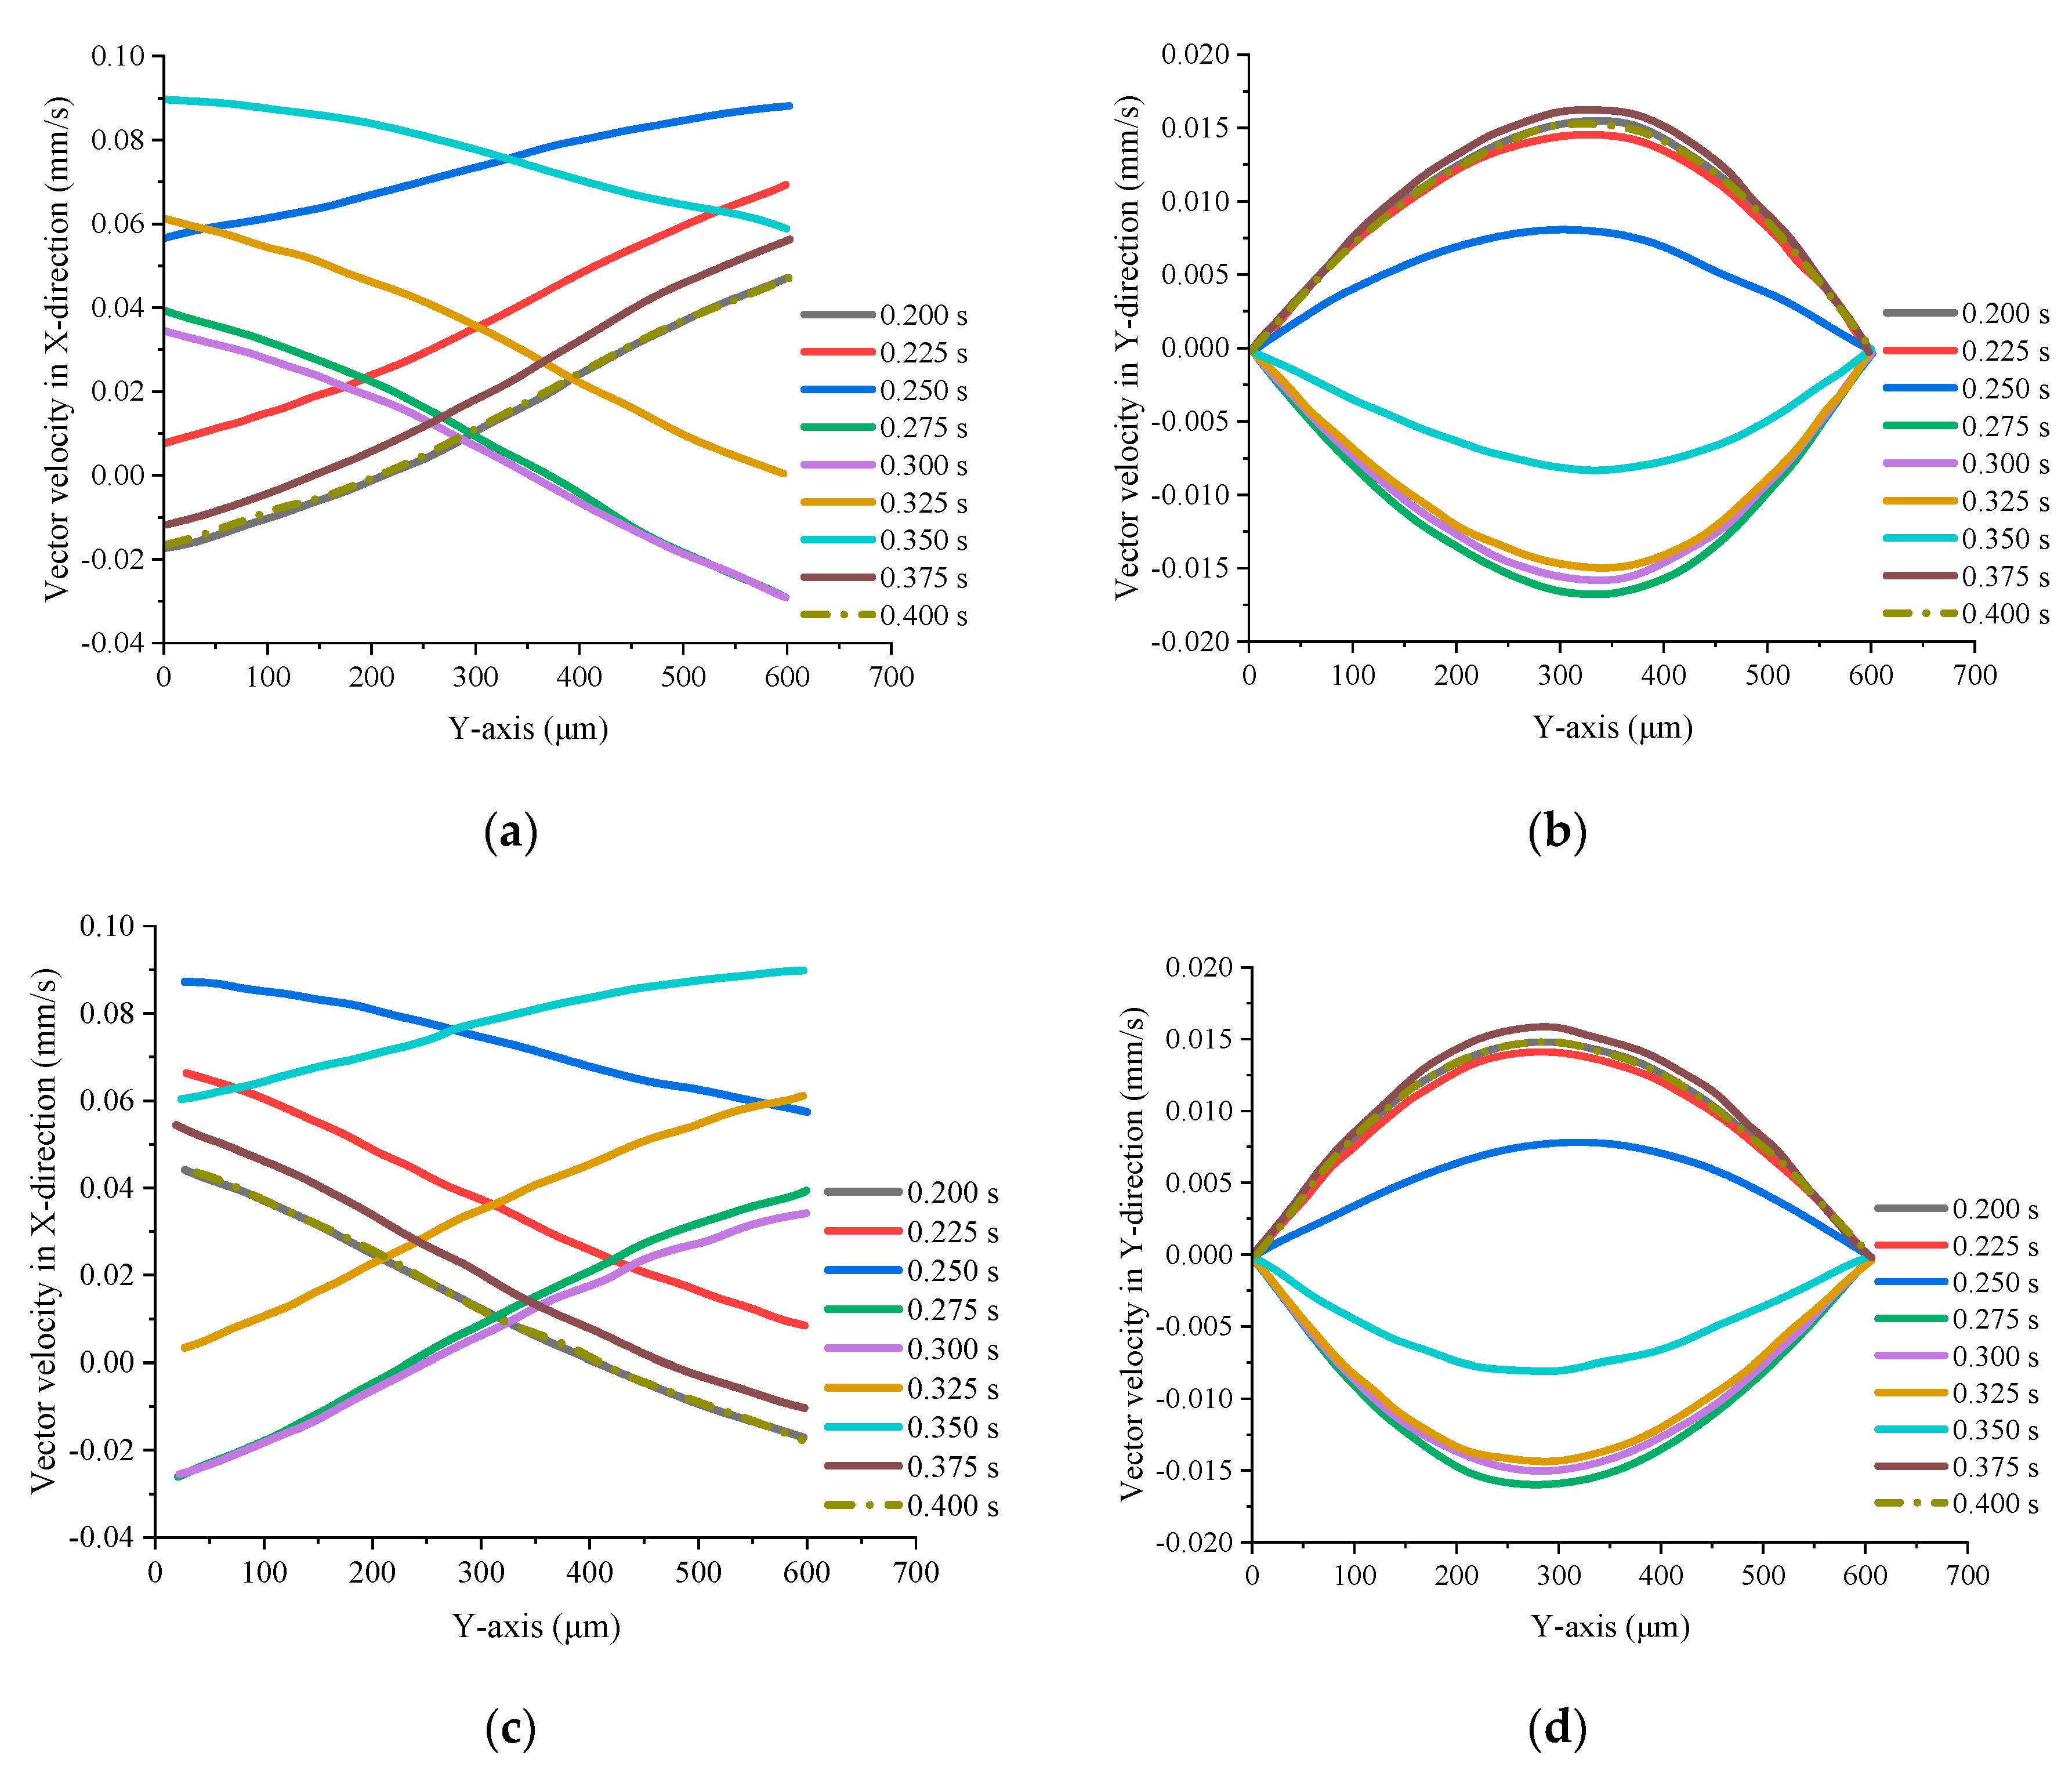
Following the establishment of the plane Cartesian coordinate system shown in Figure 13, the velocity distribution at the inlet and outlet of the micropump in both the X and Y directions is measured over one pumping cycle, as depicted in Figure 14. Figure 14a,b display the velocity distribution in the X and Y directions at the inlet, respectively, while Figure 14c,d show the corresponding velocity distributions at the outlet. It is evident that the velocity distribution at various points in both the inlet and outlet is not uniform and undergoes regular changes throughout one period. Notably, at time points such as 0.2 s, 0.275 s, 0.3 s, 0.375 s, and 0.4 s, the micropump exhibits minor backflow at a micro-level, as evidenced in Figure 14a,c. It is essential to note that these time points closely coincide with the appearance of vortices, suggesting that microscopic backflow occurs when vortices are generated. As observed in Figure 14b,d, the direction of flow at the inlet and outlet oscillates up and down over time. This fluctuation is closely tied to the fluctuations in the direction of the left and right internal circulation, affirming that the flow dynamics at the micropump’s inlet and outlet are primarily driven by the left and right internal circulation patterns.
4. Optimization of the Parallel EWOD Flexible Valve Micropump
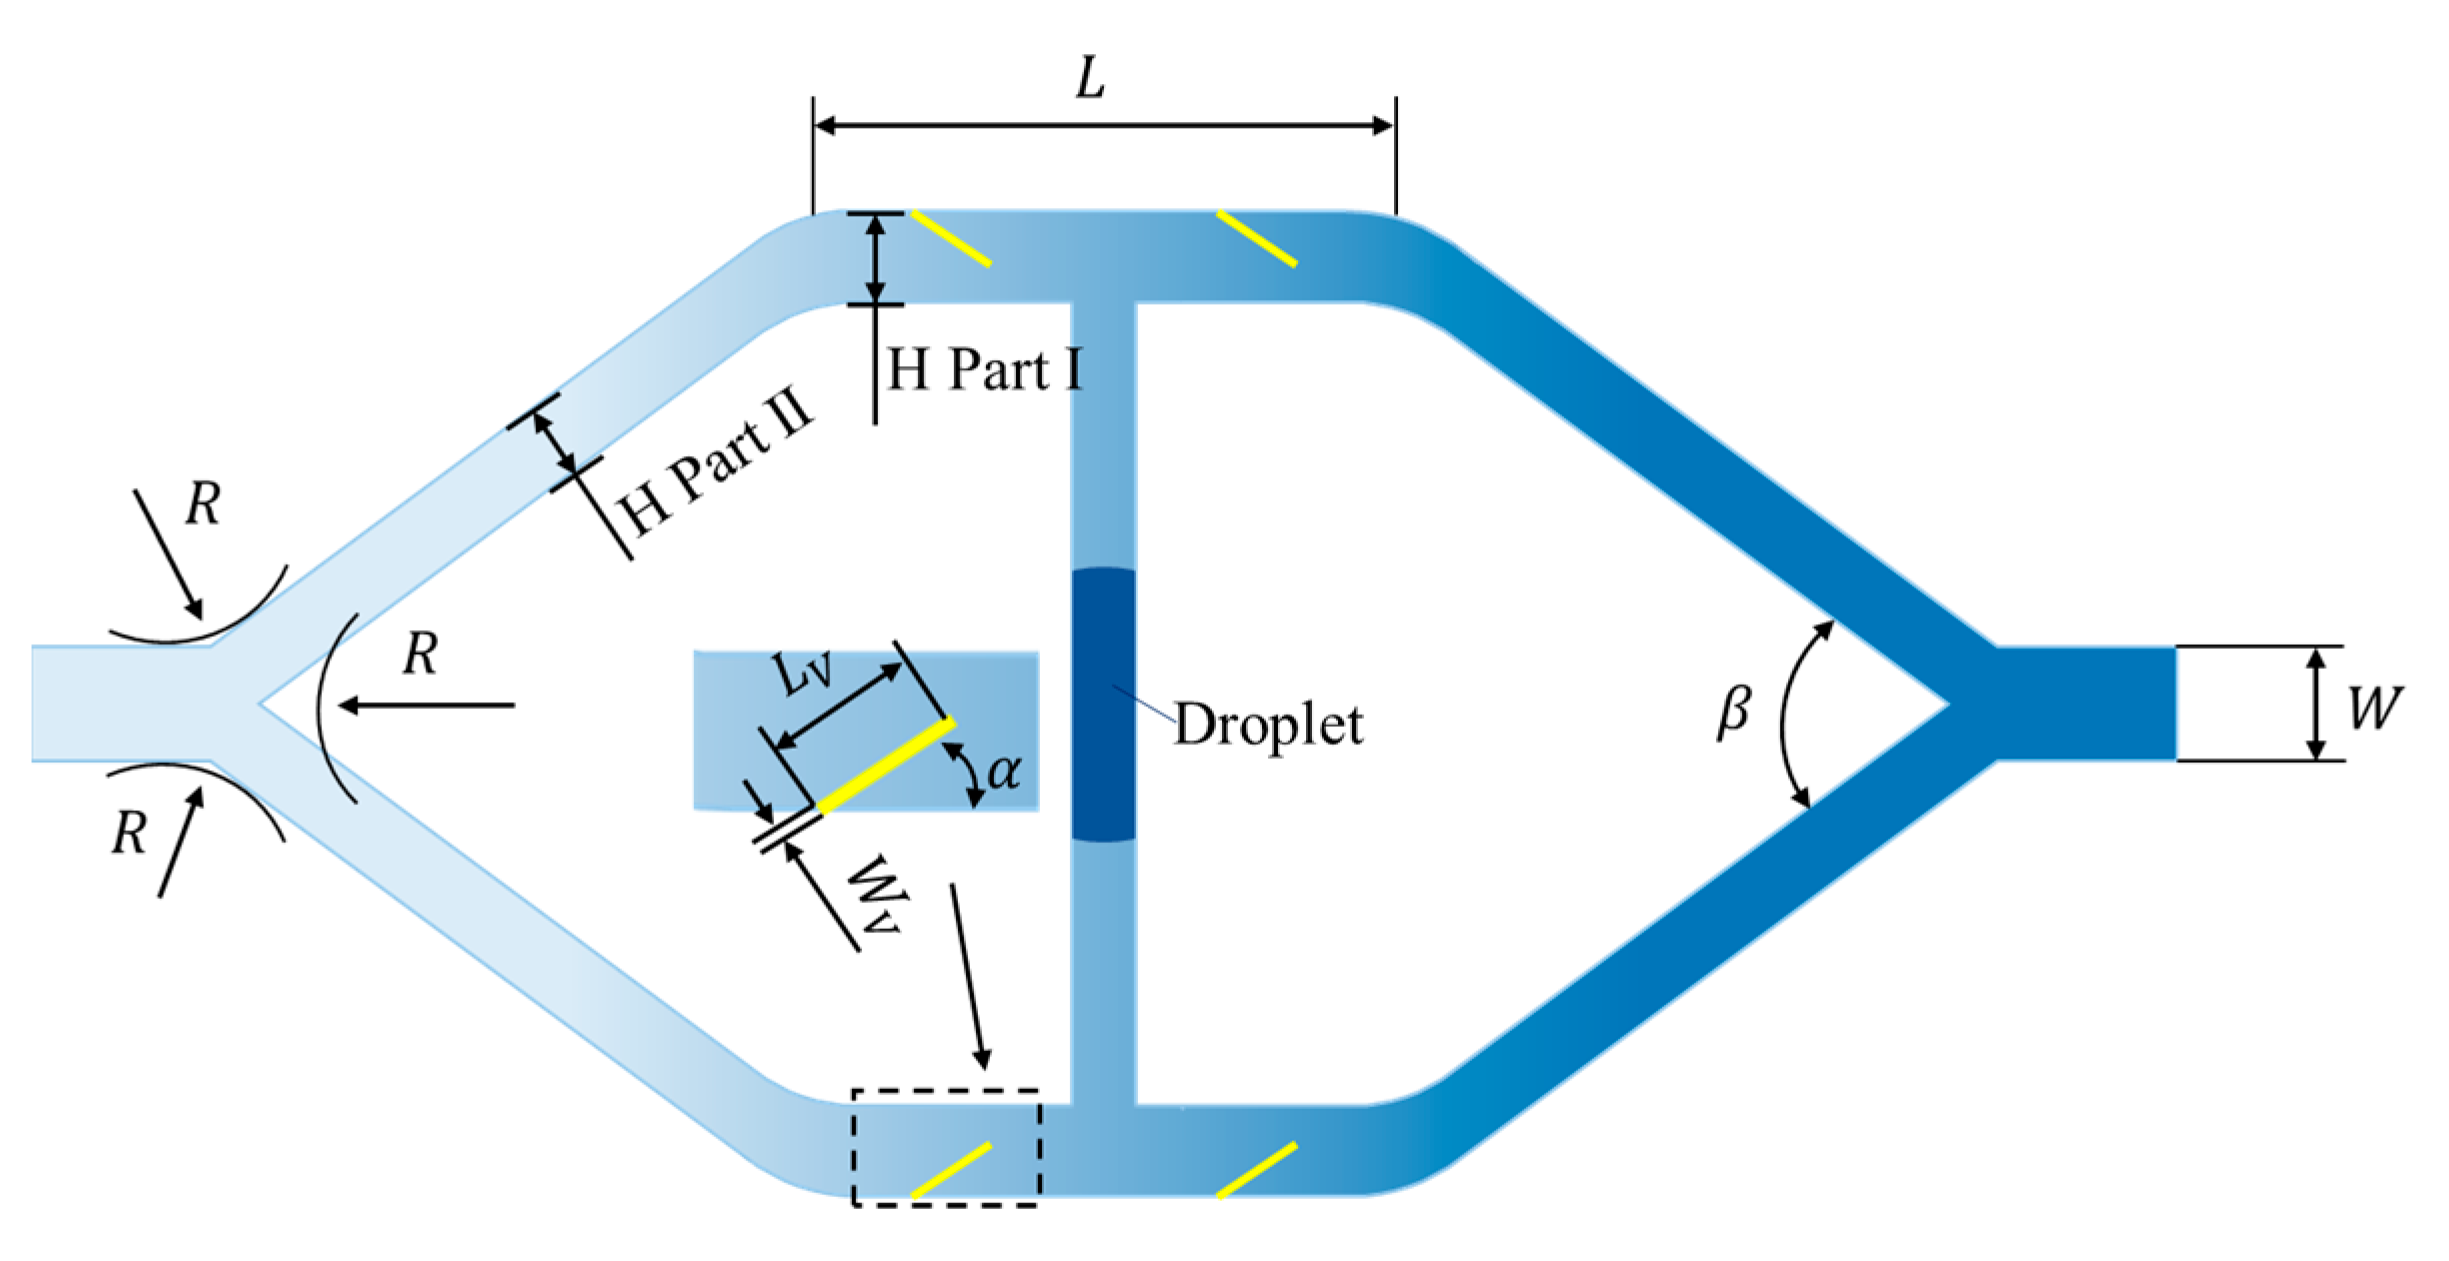
Based on the simulation results, it becomes evident that the performance of the EWOD micropump is significantly influenced by the geometry of each component. As shown in Figure 15, the geometric parameters include the width of the inlet and outlet of the micropump (W), the width (H) and length (L) of the microchannel, the radius of the round corner (R) at the inlet and outlet, the angle of the inclined channel (), the angle of the flexible valve (), the width of the flexible valve (Wv), the length of the flexible valve (LV) and the mechanical properties of flexible valves like the Young’s modulus (E) and the Poisson’s ratio (ν).
These structural parameters are optimized through the application of a single-factor multi-level optimization method. This method involves setting various values for each structural parameter, and conducting simulations of the fluid flow conditions with these different values while keeping other parameters constant. The pumping volume is then evaluated under these varying conditions, and the most favorable value is selected as the optimal parameter value in a horizontal comparison. The reference simulation before the optimization is based on the parameters in Table 2.
4.1. Width of the Inlet and Outlet
As shown in Table 3, we varied the inlet and outlet widths of the micropump to assess the impact of the outlet width on its performance. The initial width of the outlet in the original model is set at 600 μm.
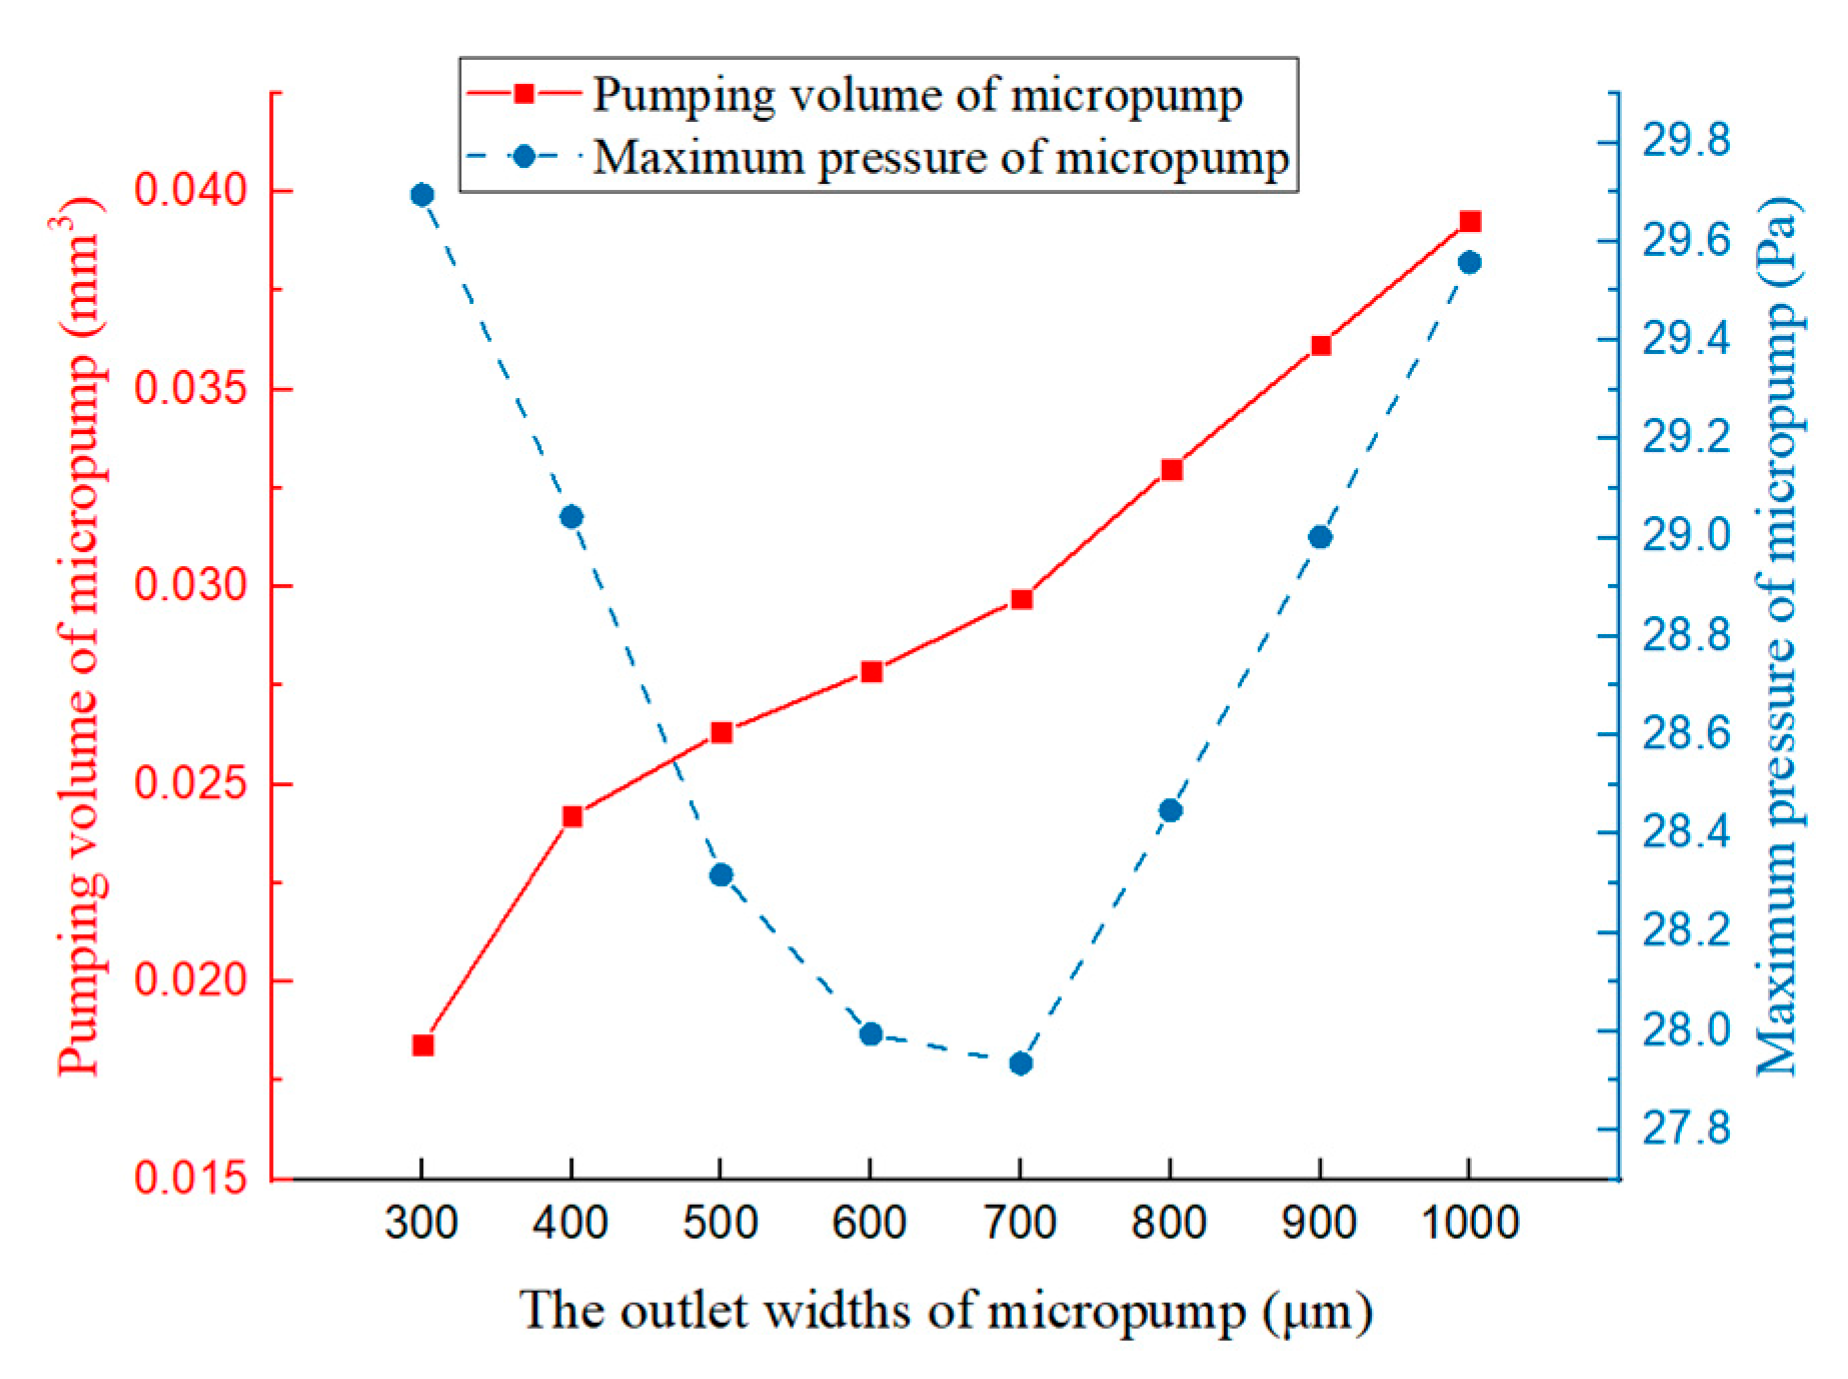
Figure 16 presents the pumping volume (Q) and maximum pressure (Pmax) at 1 s for various widths of the micropump’s inlet and outlet. It is important to clarify that volume Q represents the accumulated pump volume within a 1 s interval. Notably, the micropump’s pumping volume demonstrates a continuous rise as the inlet and outlet widths increase. Conversely, the maximum pressure of the micropump exhibits a convex curve, with its lowest point occurring at a width of 700 μm. The trend is like the results of Ameri et al. [19], where the pumping volume increases with the increase in the maximum pressure for W > 700 μm.
Figure 17 illustrates the velocity distribution along the X direction (Figure 17a) and the Y direction (Figure 17b) at the micropump outlet at various widths denoted as W, observed at 0.29 s. It is worth noting that the coordinates correspond to those presented in Figure 13. The transition from W4 to W5 results in a notable shift in the position of the backflow, as indicated in Figure 17a. Vortices disappear, causing the backflow to relocate from the upper end of the outlet to the lower end. As a result, the microfluid flow near the outlet becomes smoother, with no vortices obstructing the microfluid’s passage. This is the underlying reason behind the increased flow rate of the micropump and the corresponding rise in backflow.
Analysis of Figure 17b reveals how vortices impact the direction and magnitude of microfluidic oscillations at the outlet. Specifically, microfluid at the outlet flows downward for widths ranging from W1 to W4, and conversely, it flows upward for widths ranging from W5 to W8.
4.2. Width of the Side Channel
As shown in Figure 15, the side channel in the micropump can be divided into two sections. The first section, known as part I, corresponds to the horizontally aligned portion of the microchannel, where the flexible valve is originally positioned. The second section, referred to as part II, consists of an inclined microchannel with a slope of 5/6, connecting the inlet and outlet to the part I in the micropump. It is important to note that when the width of either part of the microchannel is altered, the width of the other part of the microchannel is simultaneously adjusted to maintain the relationship. In the context of discussing microchannel width, the initial width of part I is set at 500 μm, and the initial width of part II is 380 μm. The parameters associated with these two sections are detailed in Table 4.
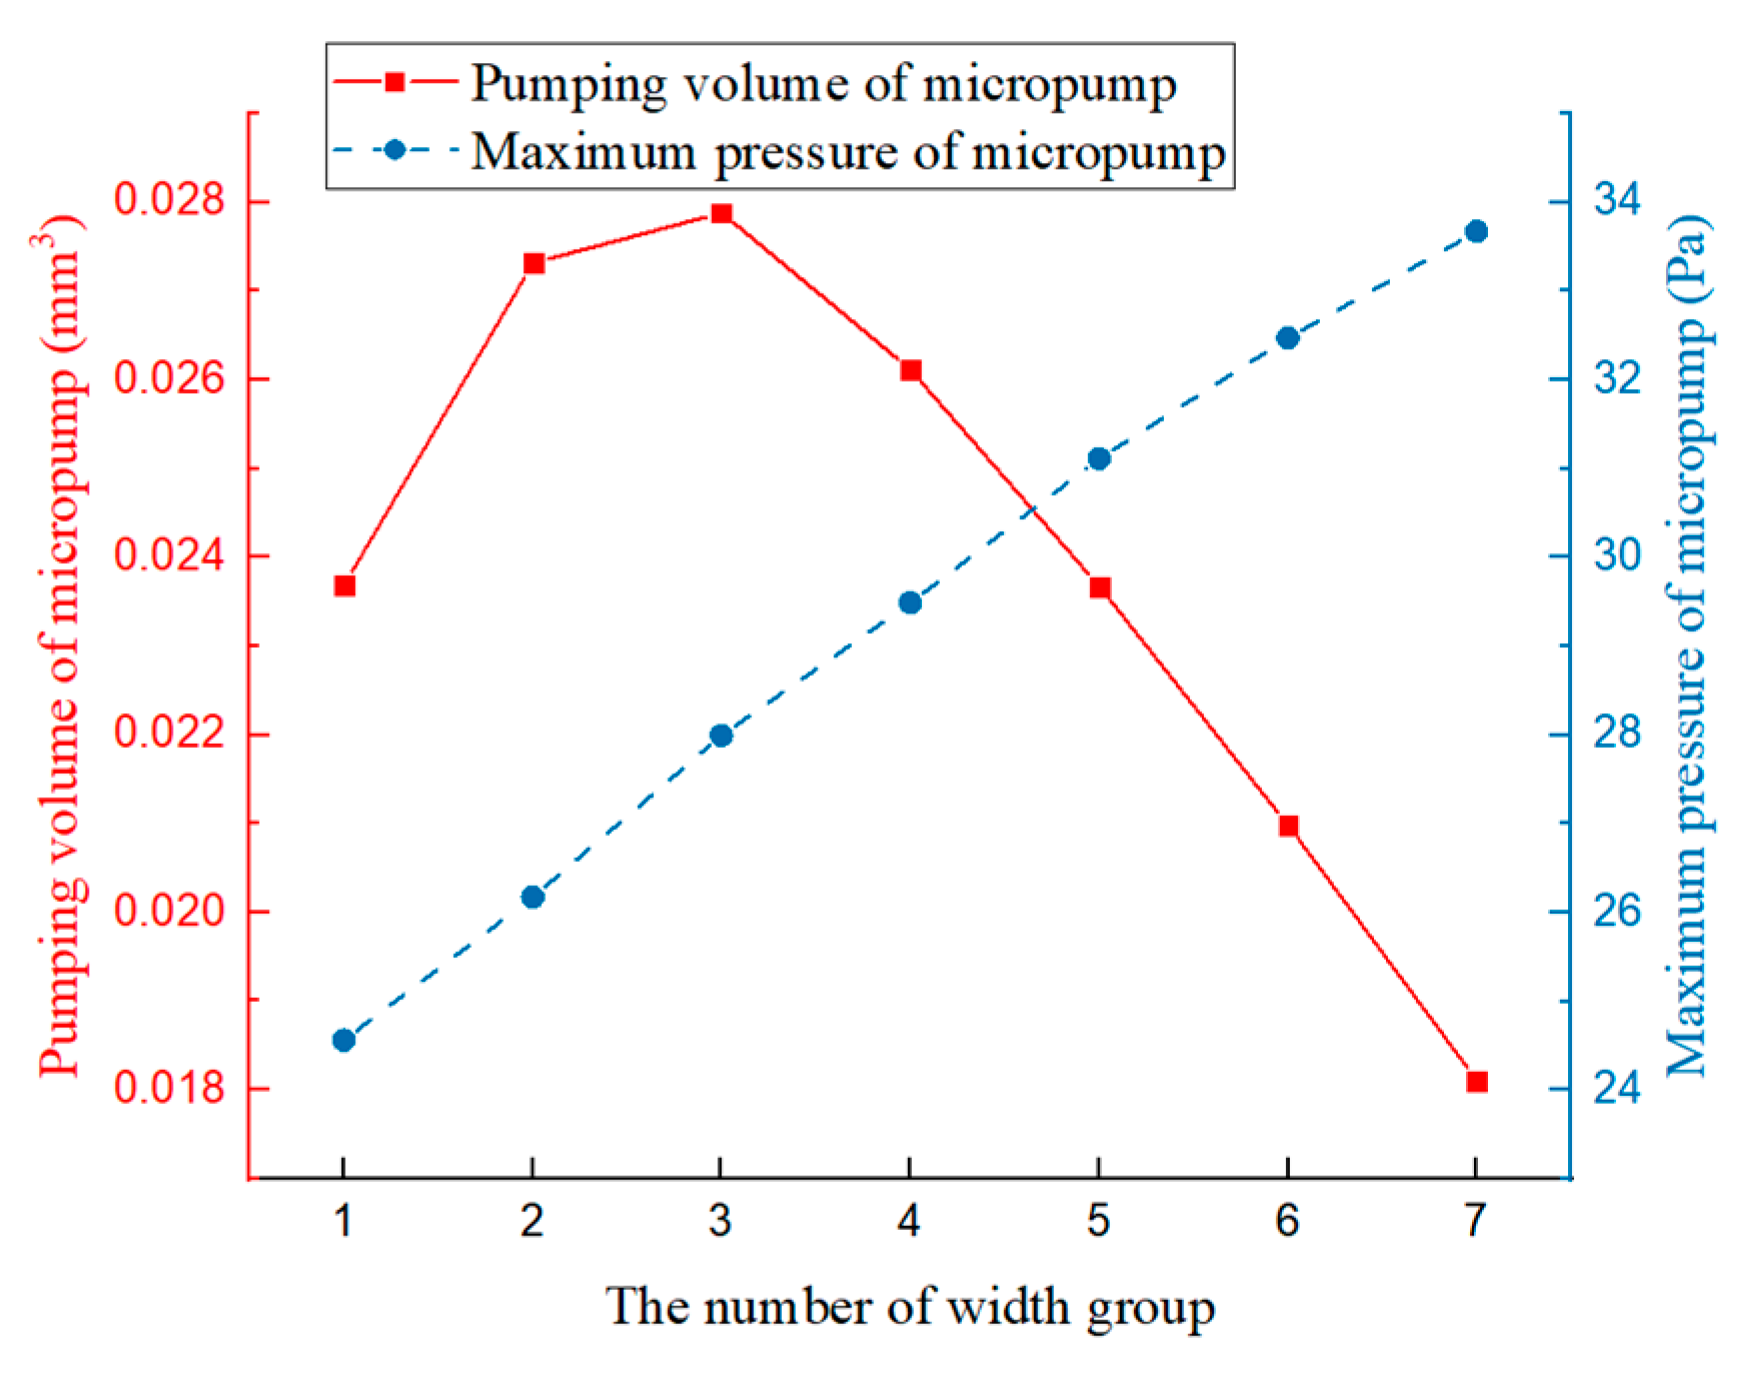
The variations in the pumping volume and maximum pressure at different microchannel widths H at 1 s are shown in Figure 18. The pumping volume of the micropump reaches its maximum at and the maximum pressure of the micropump is positively correlated with the width of the micropump. This is because the channel with a smaller width hinders the liquid flow and affects the flow efficiency and too large a channel width has a negative impact on the backflow speed of the liquid [24].
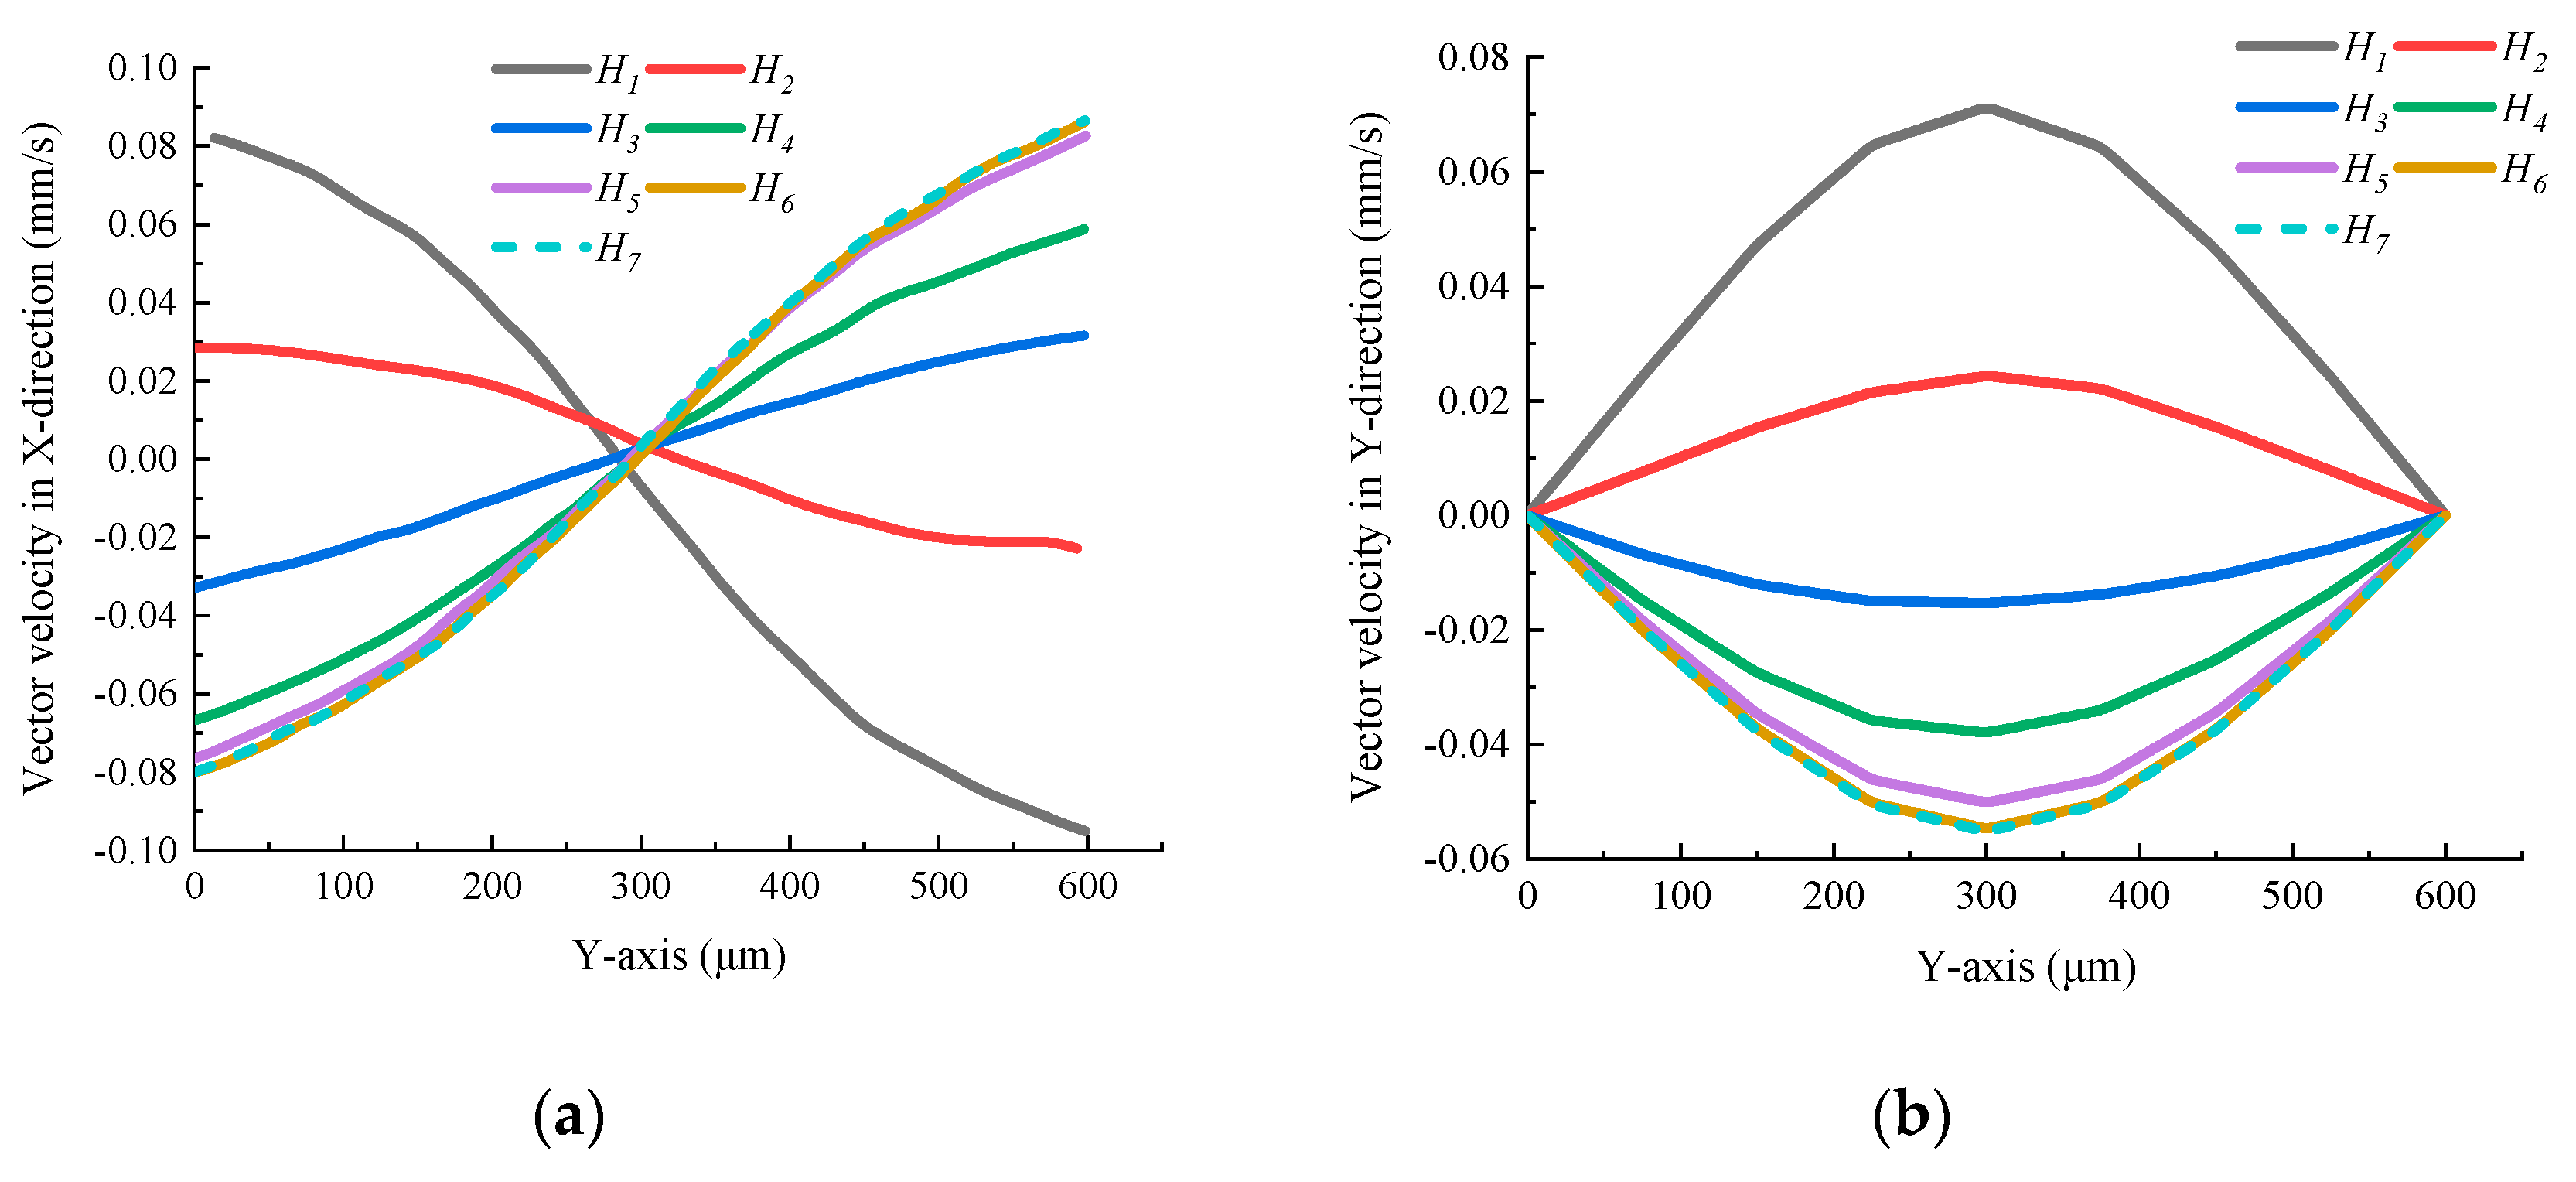
The velocity distribution in the X direction and Y direction at the outlet of the micropump is shown in Figure 19a and Figure 19b, respectively. The position of the backflow at the outlet of the micropump and the direction of microfluid fluctuation up and down are changed by whether vortices are generated. Microfluid flow is less blocked when there are no vortices, and the absolute value of the flow velocity in the X direction is greater when the vortex is generated. The above results are consistent with what is discussed in Section 4.1.
4.3. Influence of Microchannel Length on Micropump Performance
The microfluid pumped out of the pump chamber will flow into the microchannel first, so the microchannel must be long enough for the microfluid to flow steadily. However, the size of the microchannel, if it is too long, will increase the volume of the micropump flow and reduce its integration. The parameters that are analyzed of microchannel length are shown in Table 5 (the length of the microchannel in the original model is 4000 ).
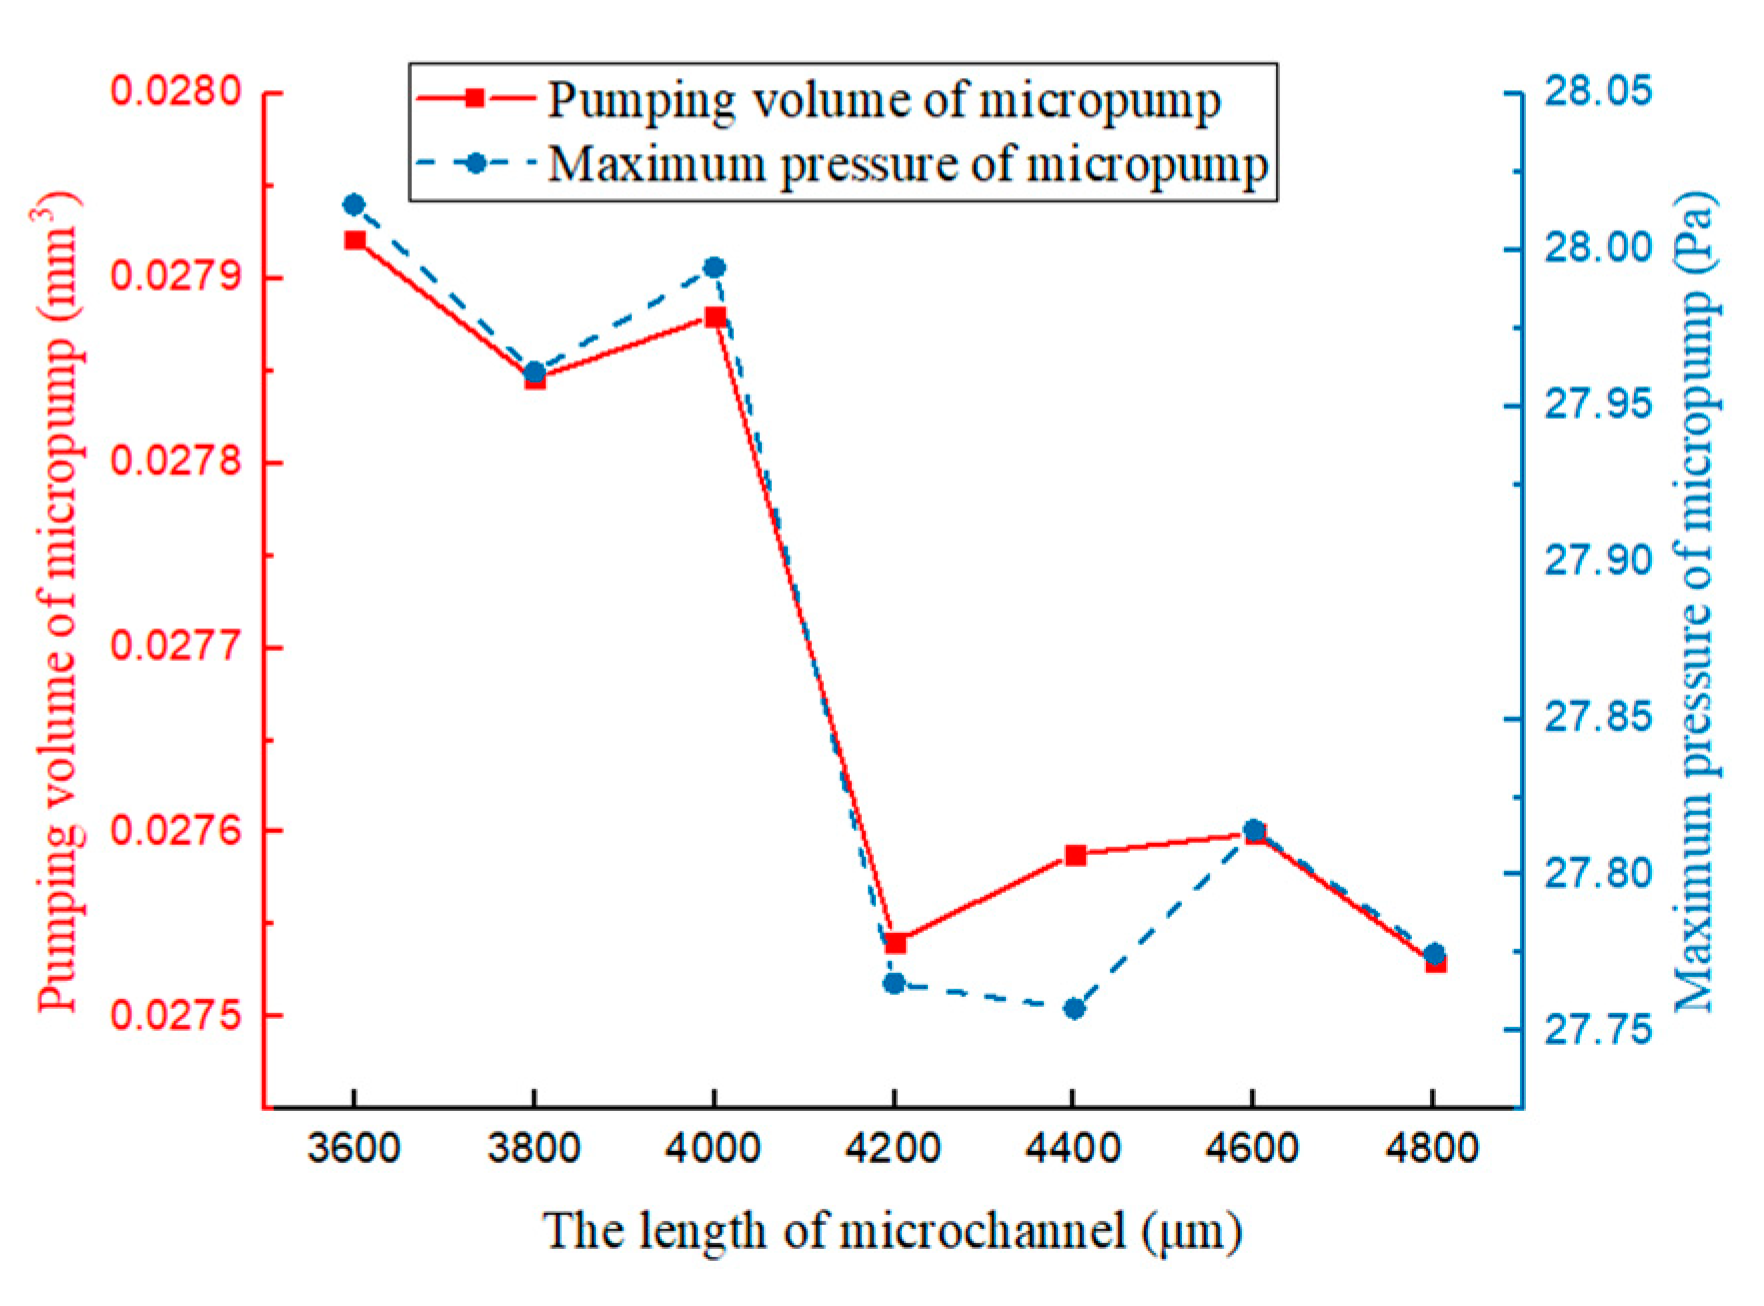
The pumping volume and maximum pressure, with different microchannel lengths at 1 s, are shown in Figure 20. The pumping volume and maximum pressure of the micropump are decreased with the increase in the length of the microchannel. The difference between the maximum and minimum values of the pumping volume of the micropump is only 1.4%, and the difference between the maximum and minimum values of the maximum pressure of the micropump is only 0.9%. Therefore, the increase in the length of the microchannel does not change the performance of the micropump significantly. Based on the above data, it can be concluded that the flow of microfluid from the pump chamber into the microchannel has nearly plateaued when the length of the microchannel is 3600 , and the performance of the micropump may be reduced if the length of the microchannel is increased.
4.4. Microchannel Fillet near the Inlet and Outlet
The tendency of the microfluid to move away from its original direction of flow to follow the bulging surface is called the Condal effect [14]. According to the Condal effect, the tendency of the flow of the microfluid will be changed when the interface wall, which is where the inlet and outlet of the micropump and the two microchannels are communicated, will carry on the fillet processing then make the microfluid flow in the three channels more smoothly. The interfaces of the inlet and outlet of the three channels are brought on fillet processing, a total of six places. As shown in Table 6, the fillet radius is parameterized. The fillet radii of these six places are 0 in the original model.
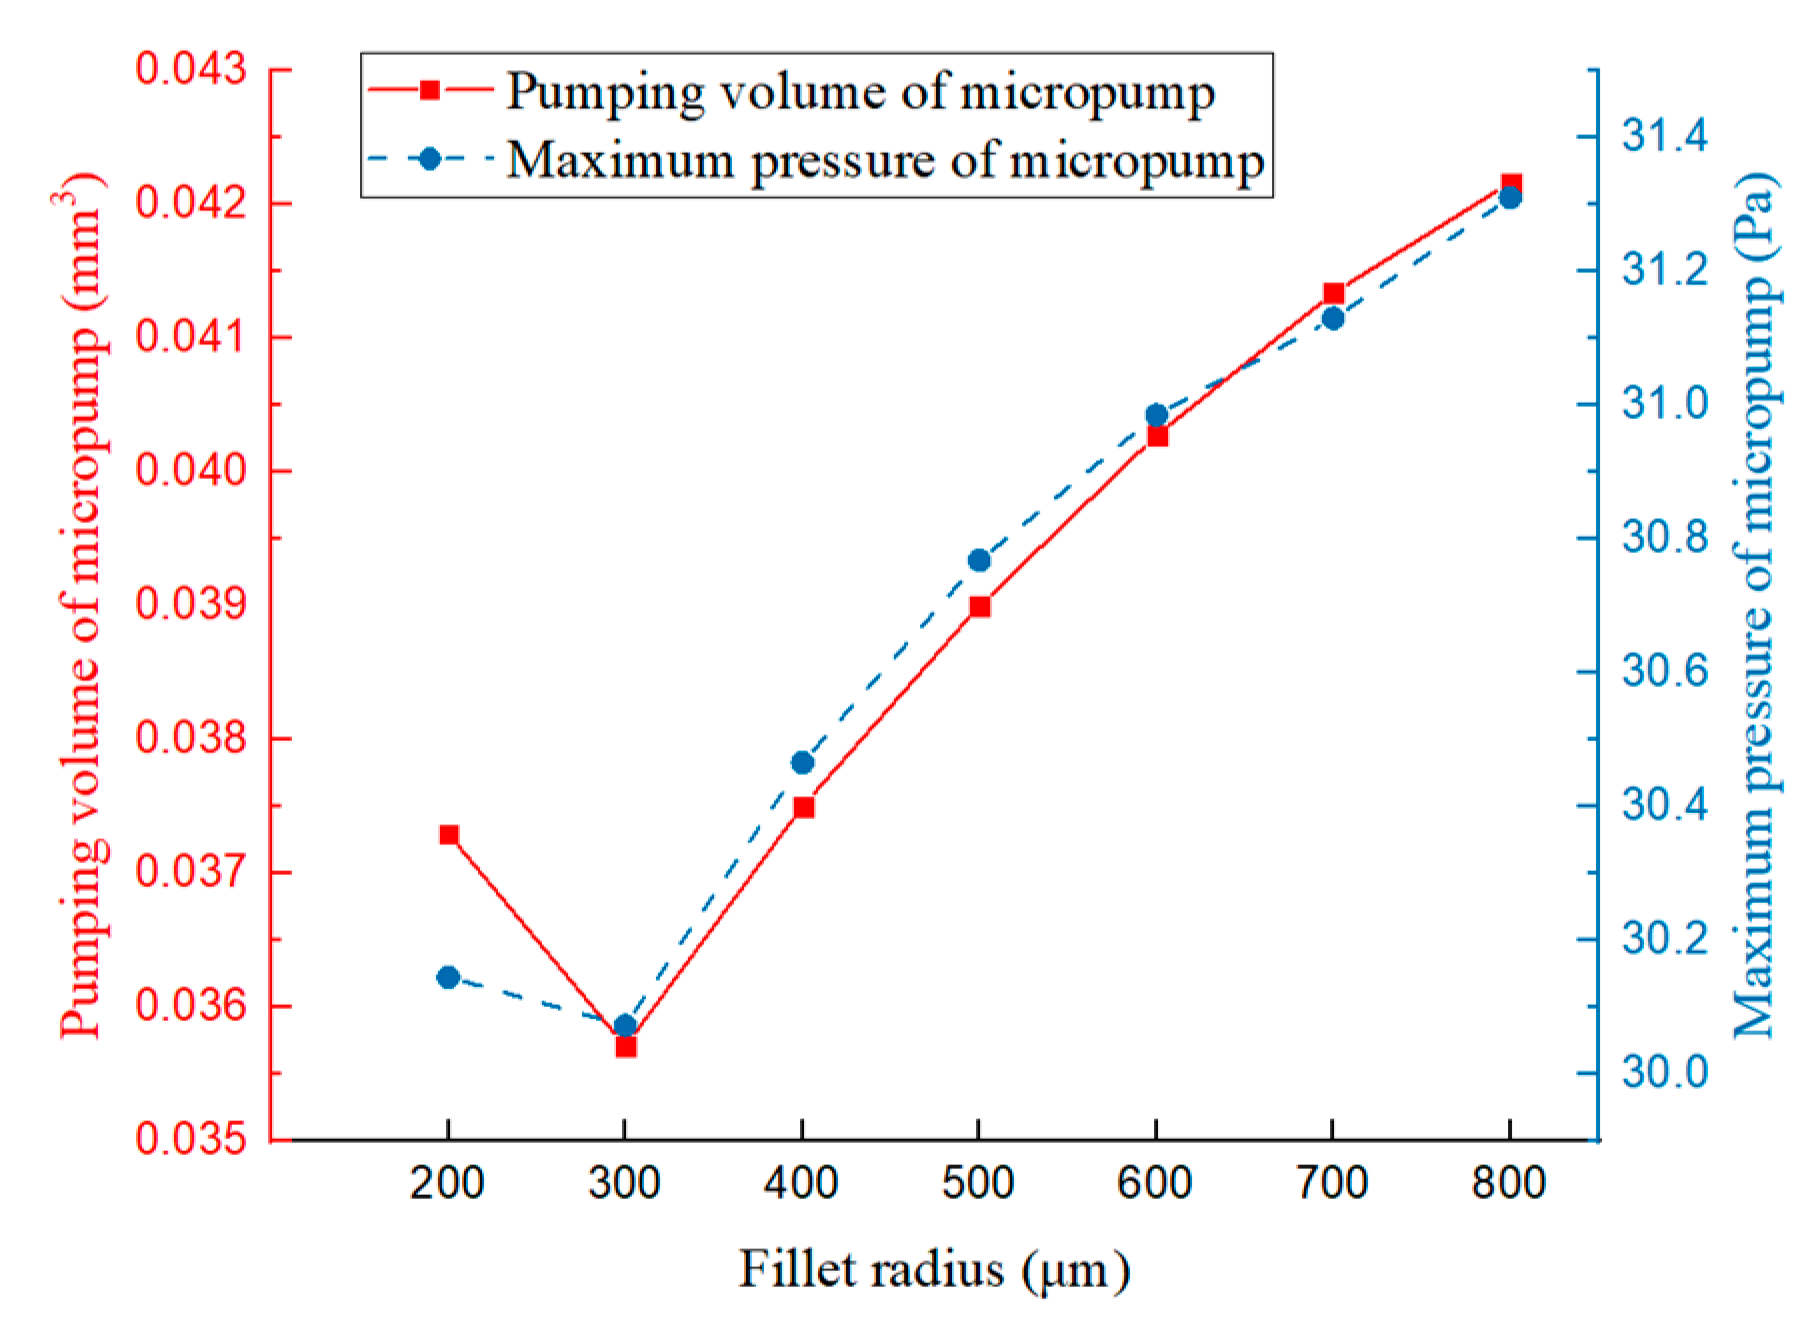
Figure 21 shows the curves of pumping volume and maximum pressure with different fillet radii at 1 s. The pumping volume of the micropump after fillet treatment is much larger than that of the original model. The pumping volume of the micropump increases wholly with the increase in fillet radius. The tendency of the maximum pressure variation of the micropump is consistent with the pumping volume.
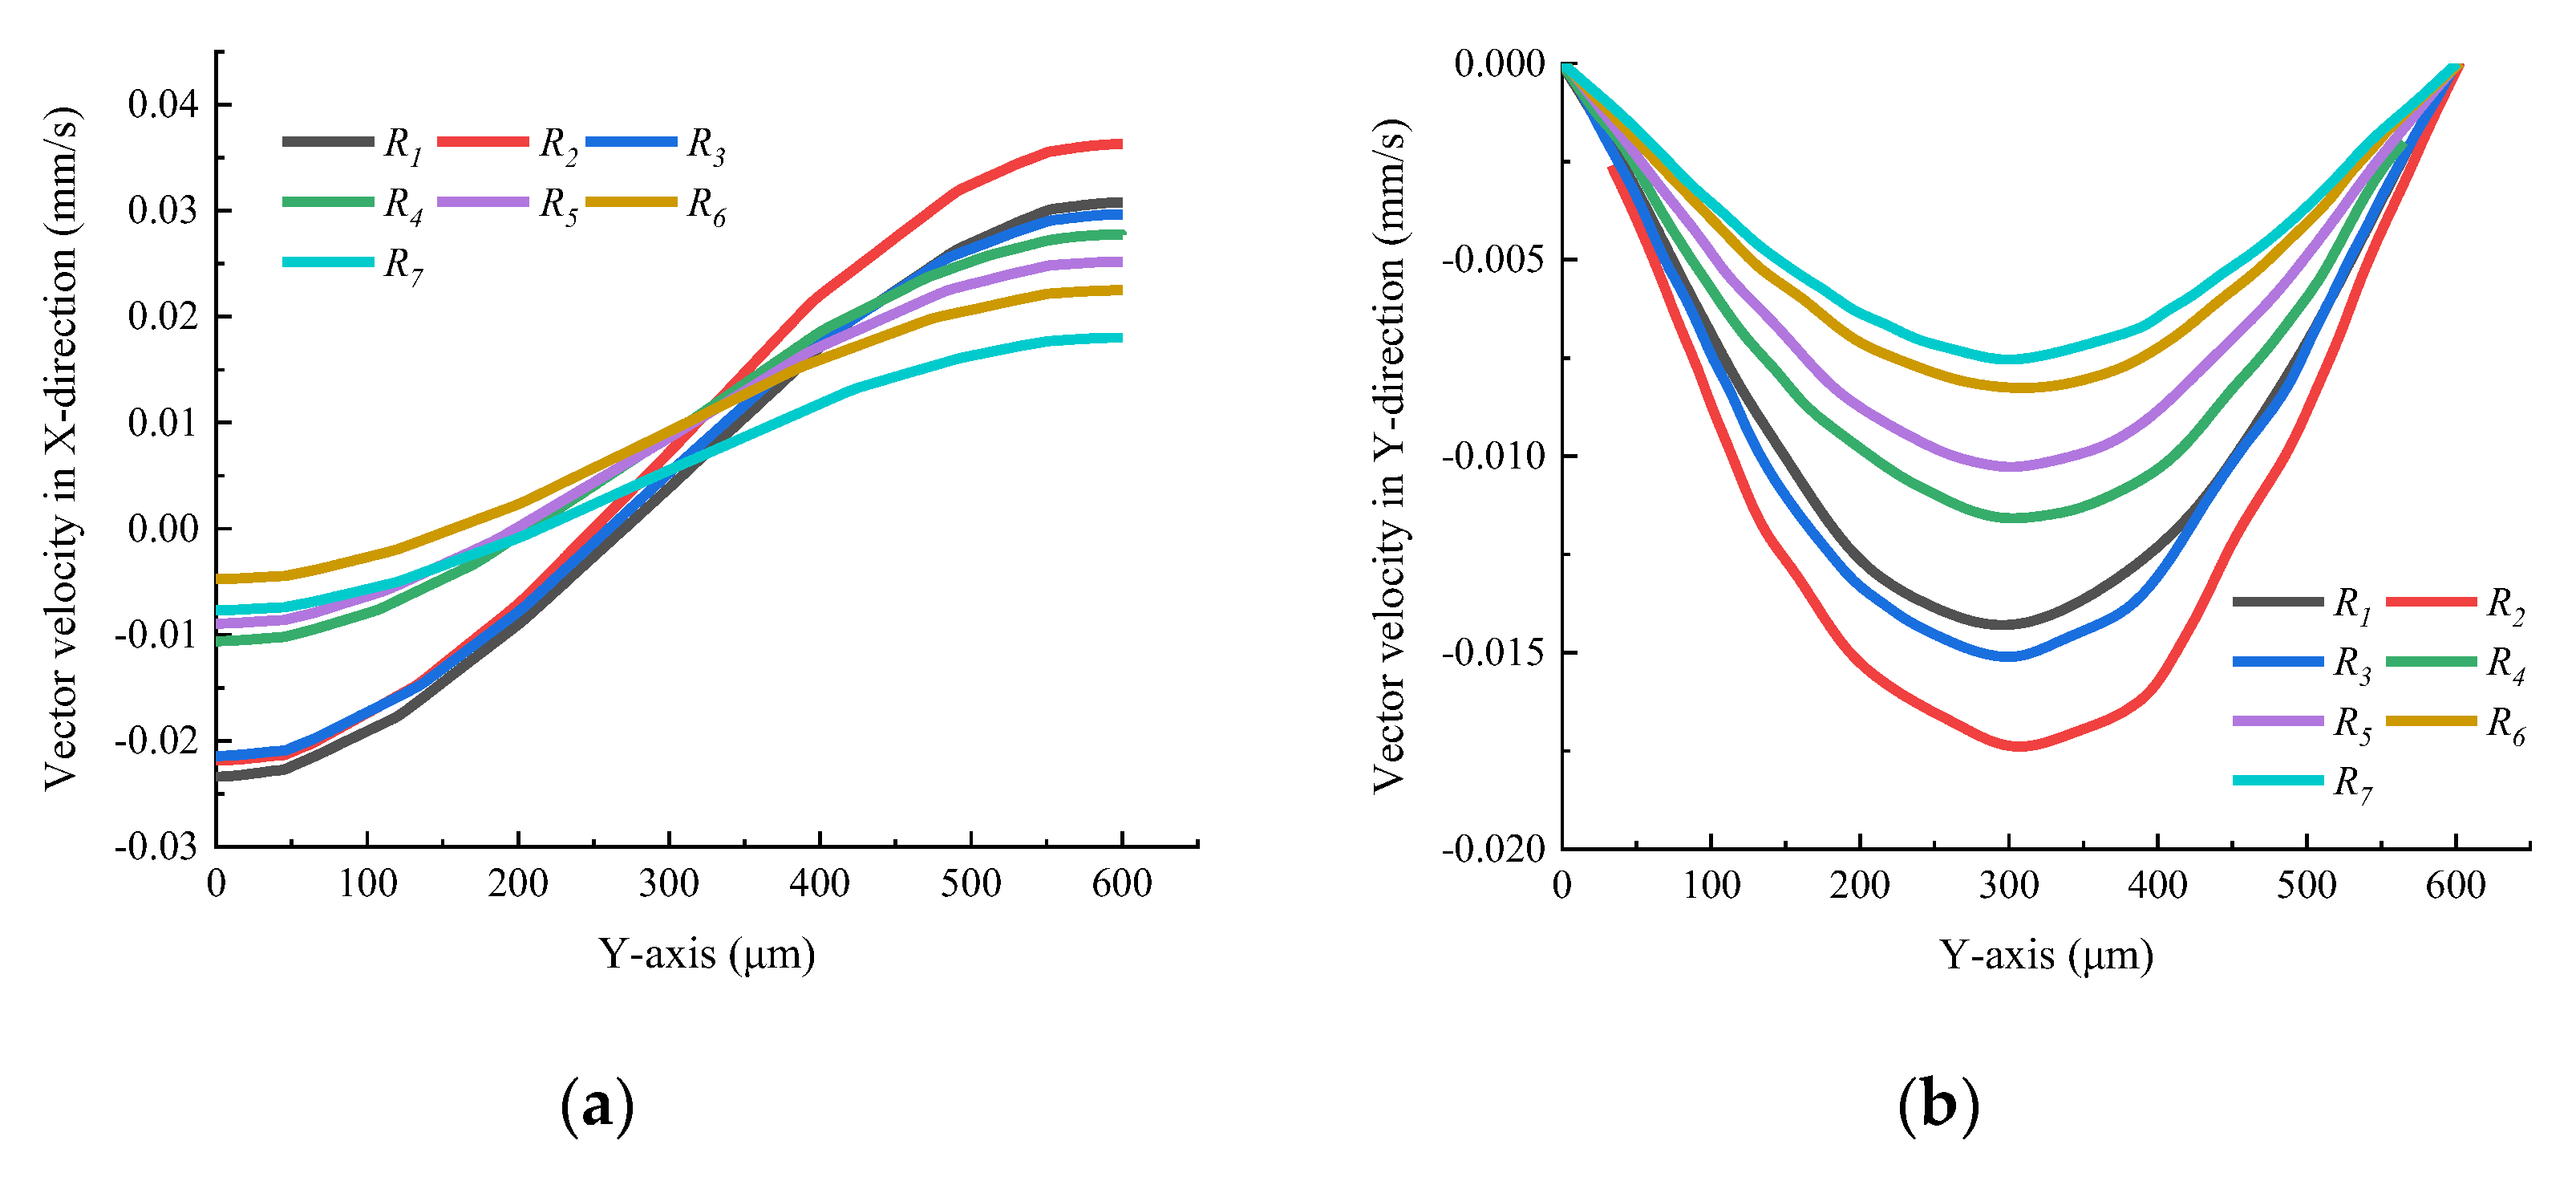
Figure 22 shows the vector velocity distribution at the outlet with different fillet radii in the X direction and Y direction at 0.29 s. Figure 22a is the X-direction and Figure 22b is the Y-direction. It can be found that the microcosmic backflow is weakened as a whole with the increase in fillet radius from Figure 22a, which is helpful in improving the pumping performance of the micropump. It can be found that the up-and-down fluctuation of the microfluid at the outlet of the micropump is reduced with the increase in fillet radius from Figure 22b, which is helpful to improve the stability of the micropump.
4.5. Microchannel Angle
The flow tendency of the left and right internal circulation at the inlet and outlet will be changed by changing the microchannel angle, so the microfluid flow at the micropump inlet can be mastered by discussing the microchannel angle. As shown in Table 7, the microchannel angle is parameterized. In the original model, the microchannel angle is .
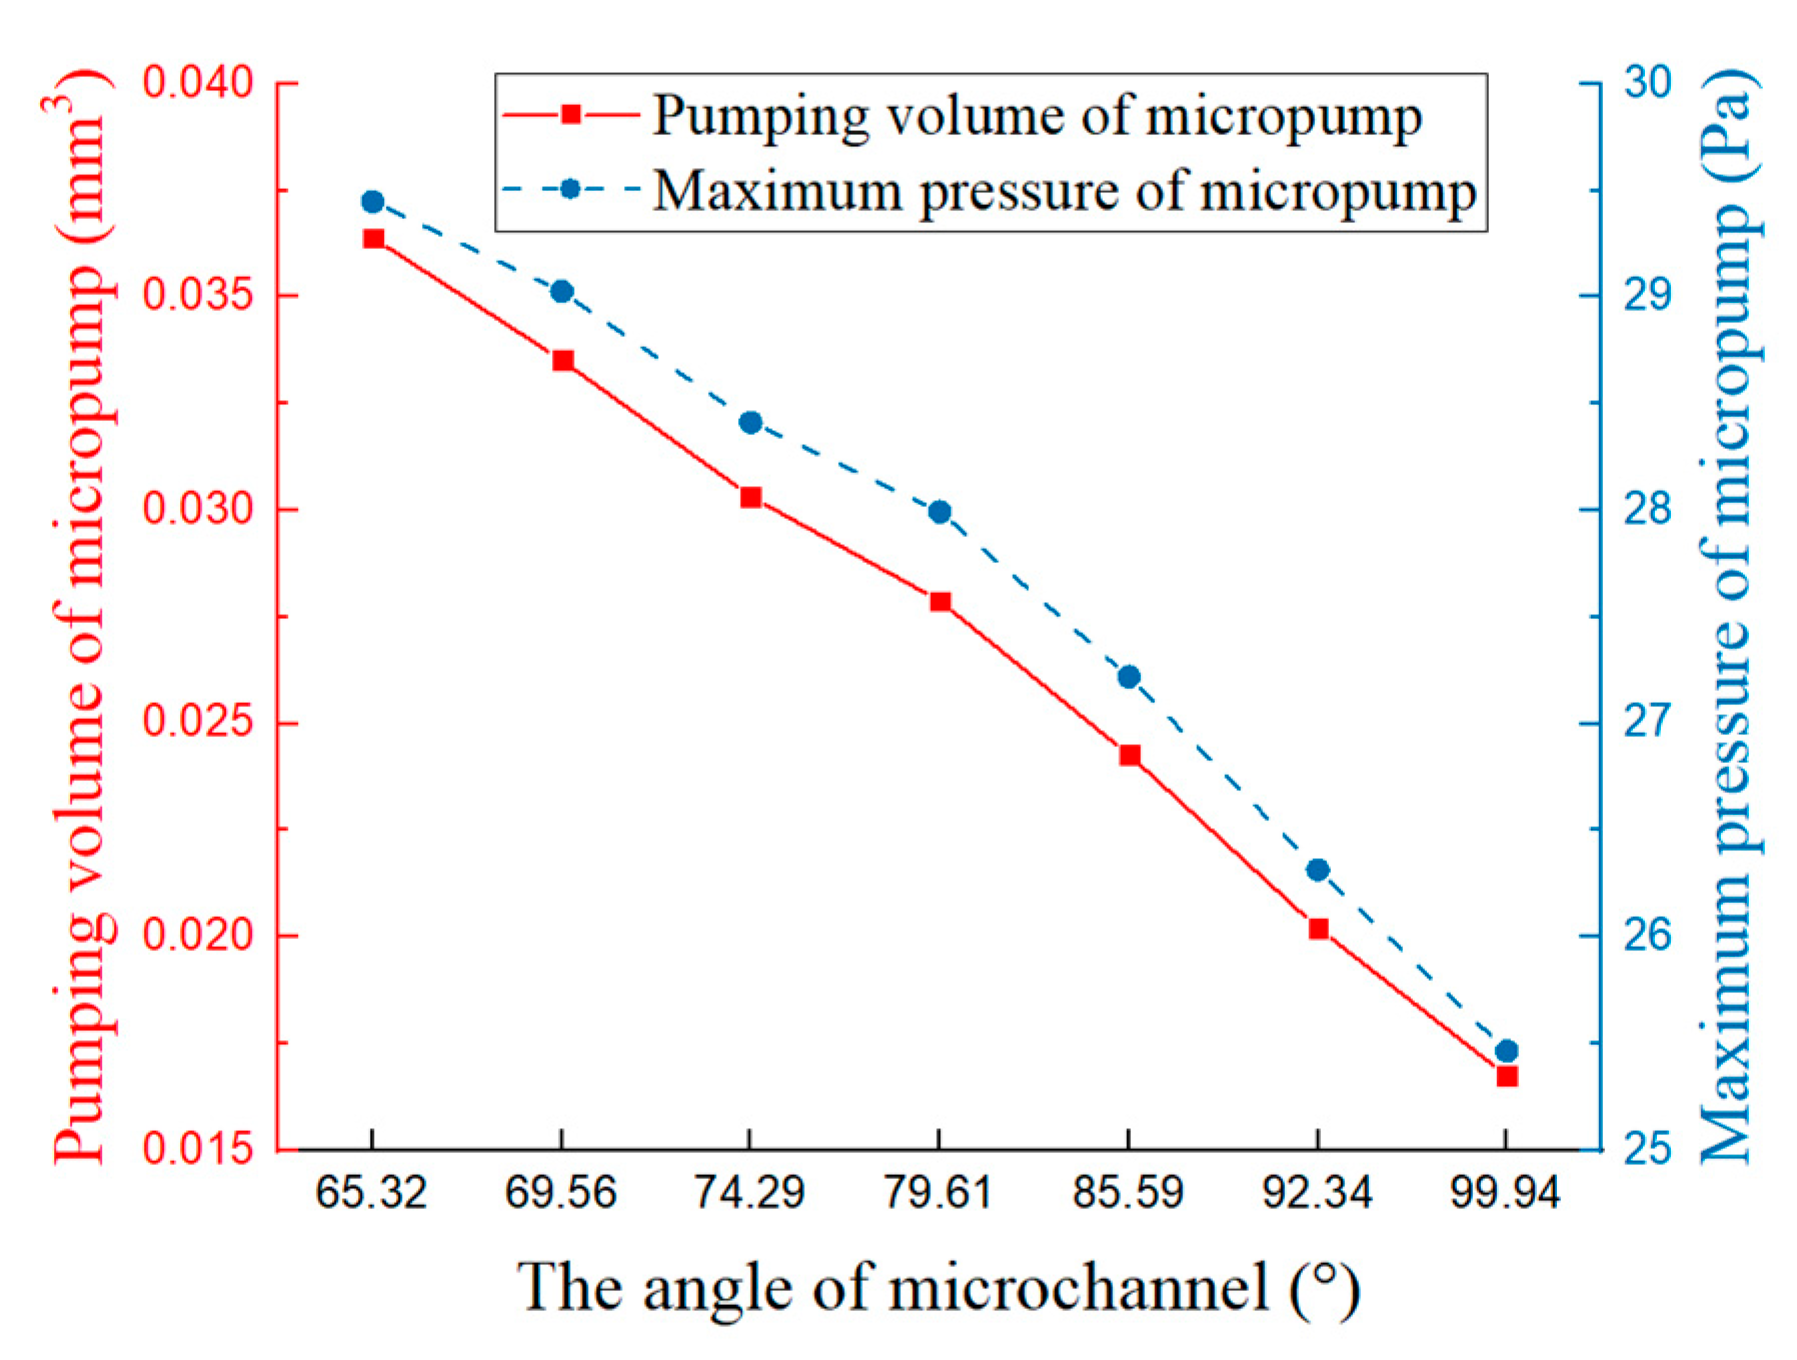
Figure 23 shows the curves of pumping volume and maximum pressure at 1 s with different microchannel angles. The pumping volume and maximum pressure of the micropump are decreased with the increase in the microchannel angle. The interaction between the microfluidics of the left and right internal circulation and the microfluid that flow in and out of the micropump is strengthened by the smaller microchannel angle, which equally enhances the “sucked in” and “thrown out” functions of the left and right internal circulation microfluid.
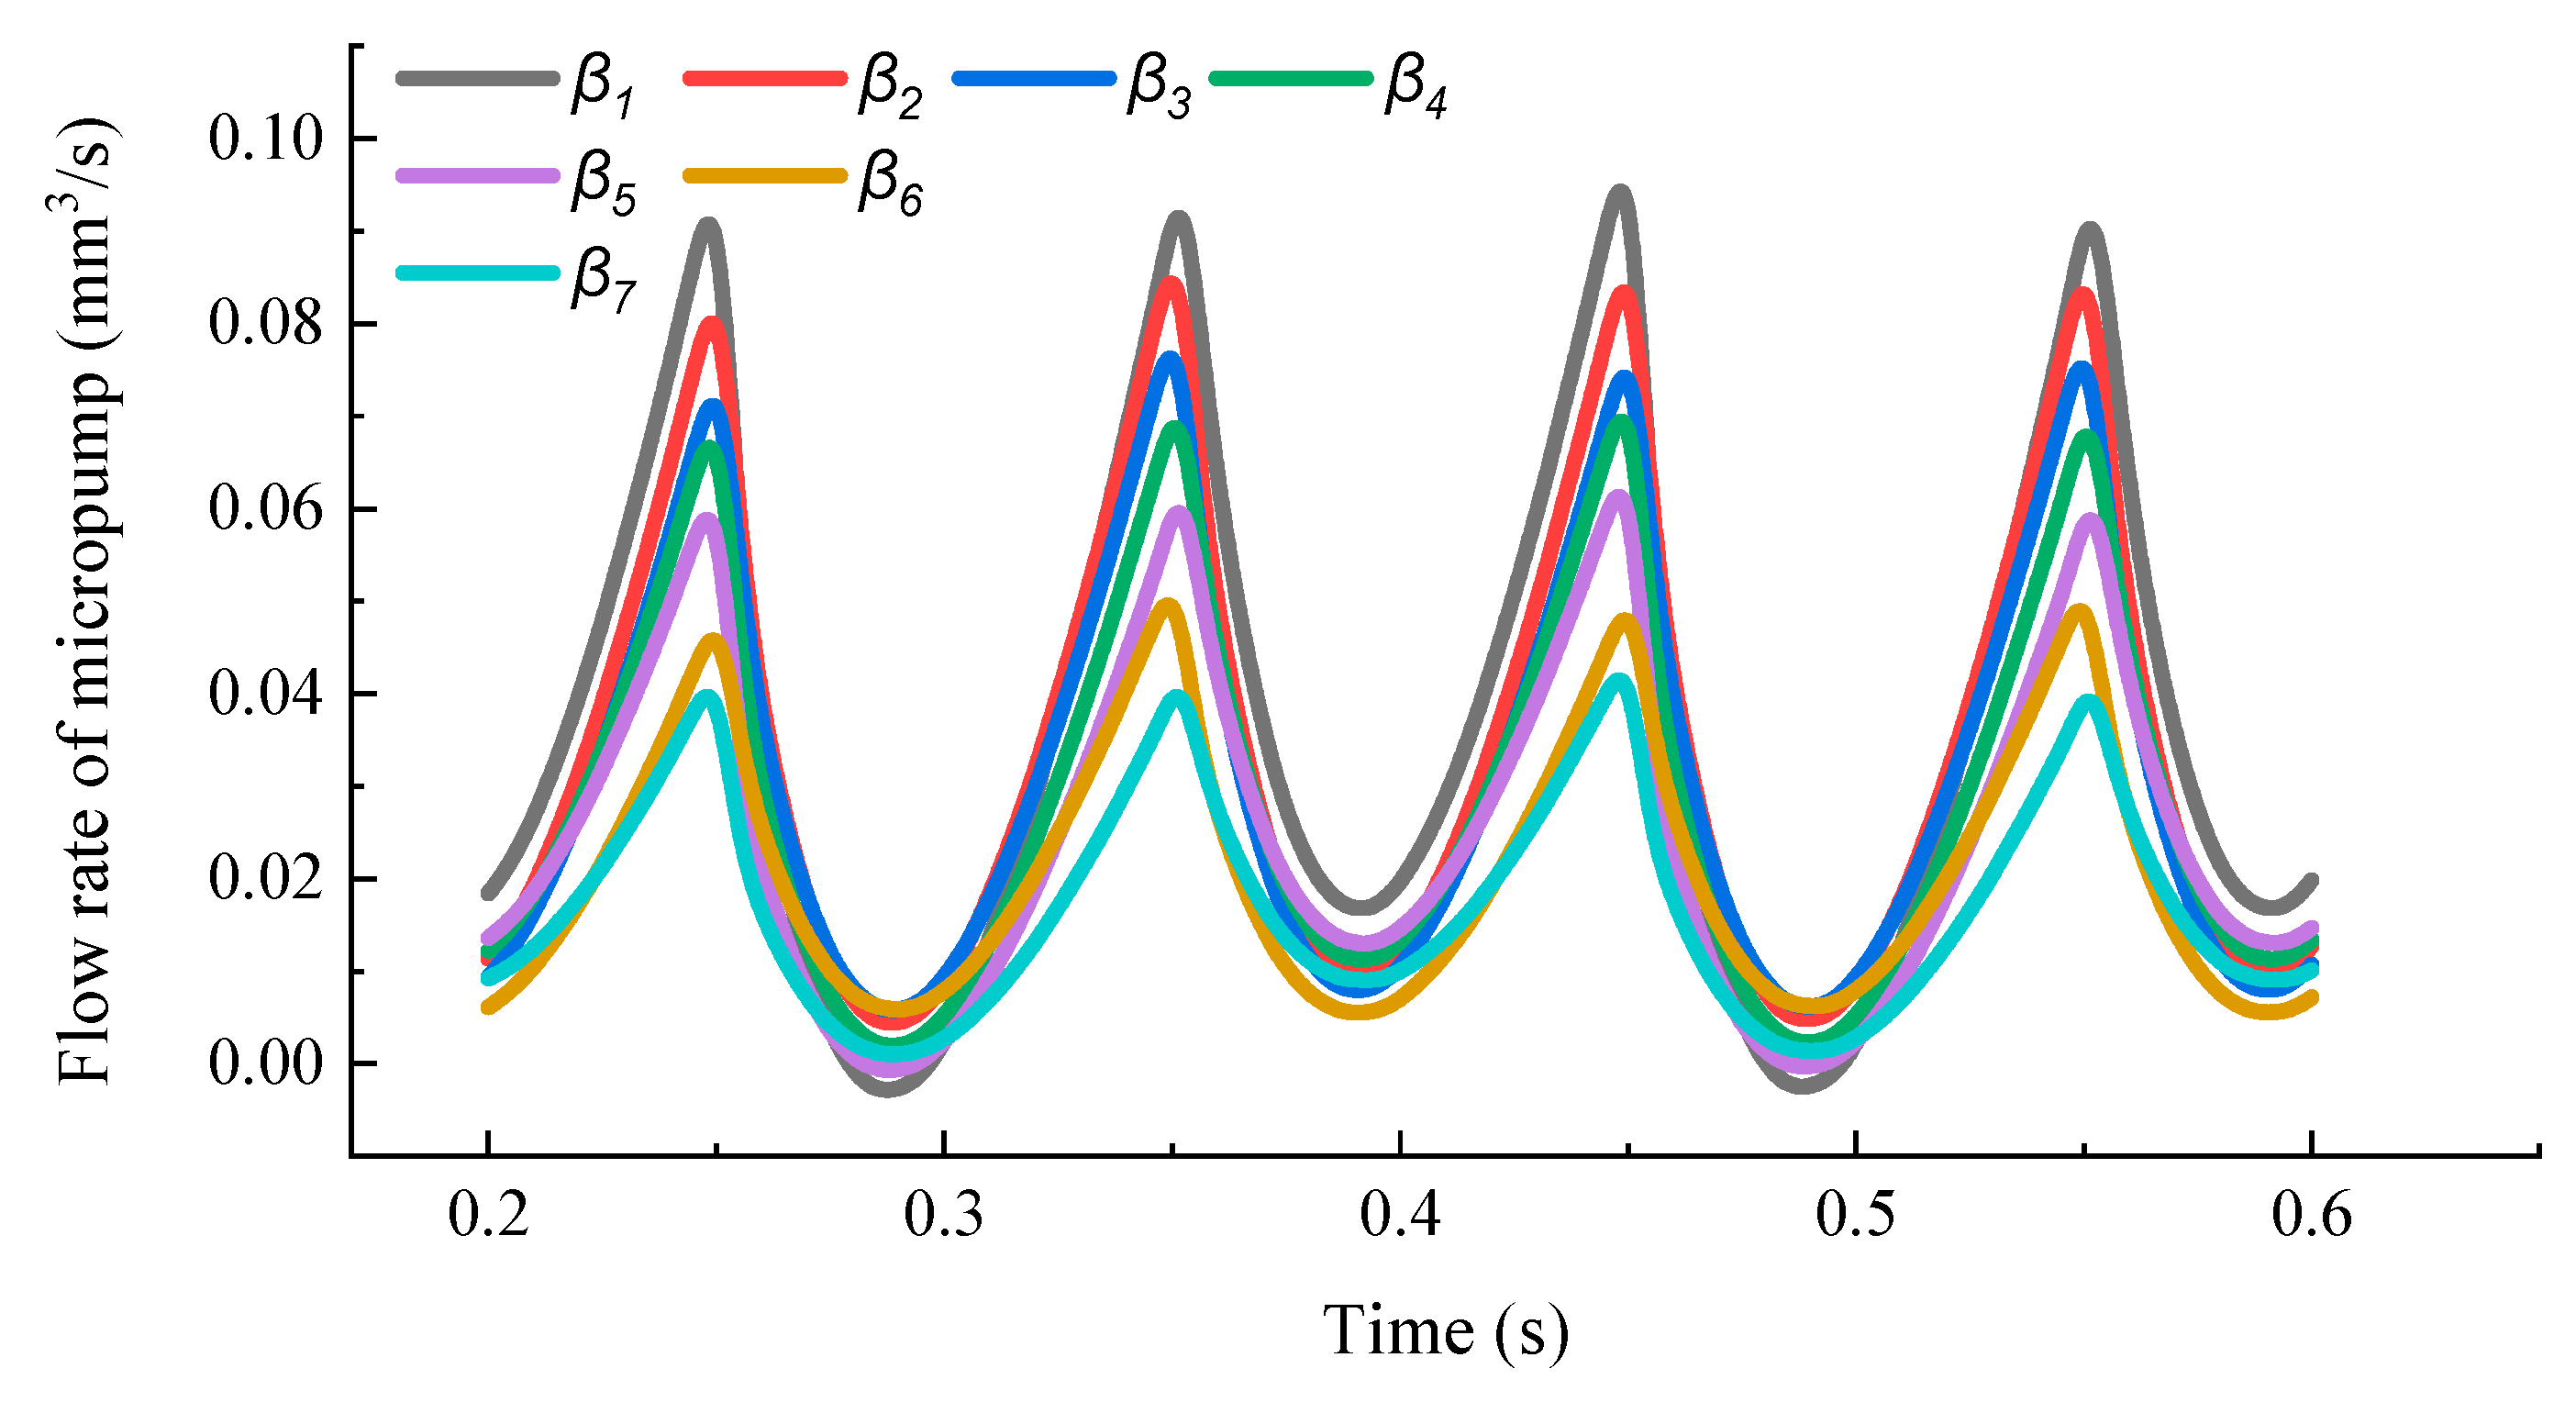
Figure 24 shows the curves of the micropump flow with different microchannel angles of two cycles from 0.2 s to 0.6 s. A little macroscopic backflow has appeared in the micropump when the microchannel angle is and . Still, the macroscopic one-way output of the micropump can be guaranteed when the parameters of the microchannel angle are other values. We may conclude that changing the structural parameters of the micropump may lead to macroscopic backflow of the micropump. Not only should the size of the flow be considered, but also to avoid micropump backflow when the structural parameters of the EWOD micropump are optimized to minimize the fluctuation in the micropump pumping volume.
4.6. Analysis of the Structural Parameters of the Flexible Valve
The difference in flow resistance caused by flexible valves and the characteristics of flexible valves that cannot completely close the microfluid path is why the left and right internal circulation of the micropump is generated, so it is necessary to analyze the structural parameters of the flexible valve.
4.6.1. Influence of the Placement Angle of the Flexible Valve
The position of the flexible valve and the stress on it at both ends in the working state are affected by the placement angle. The different angle parameters of the flexible valve are shown in Table 8 (the angle of the original model is 45°).
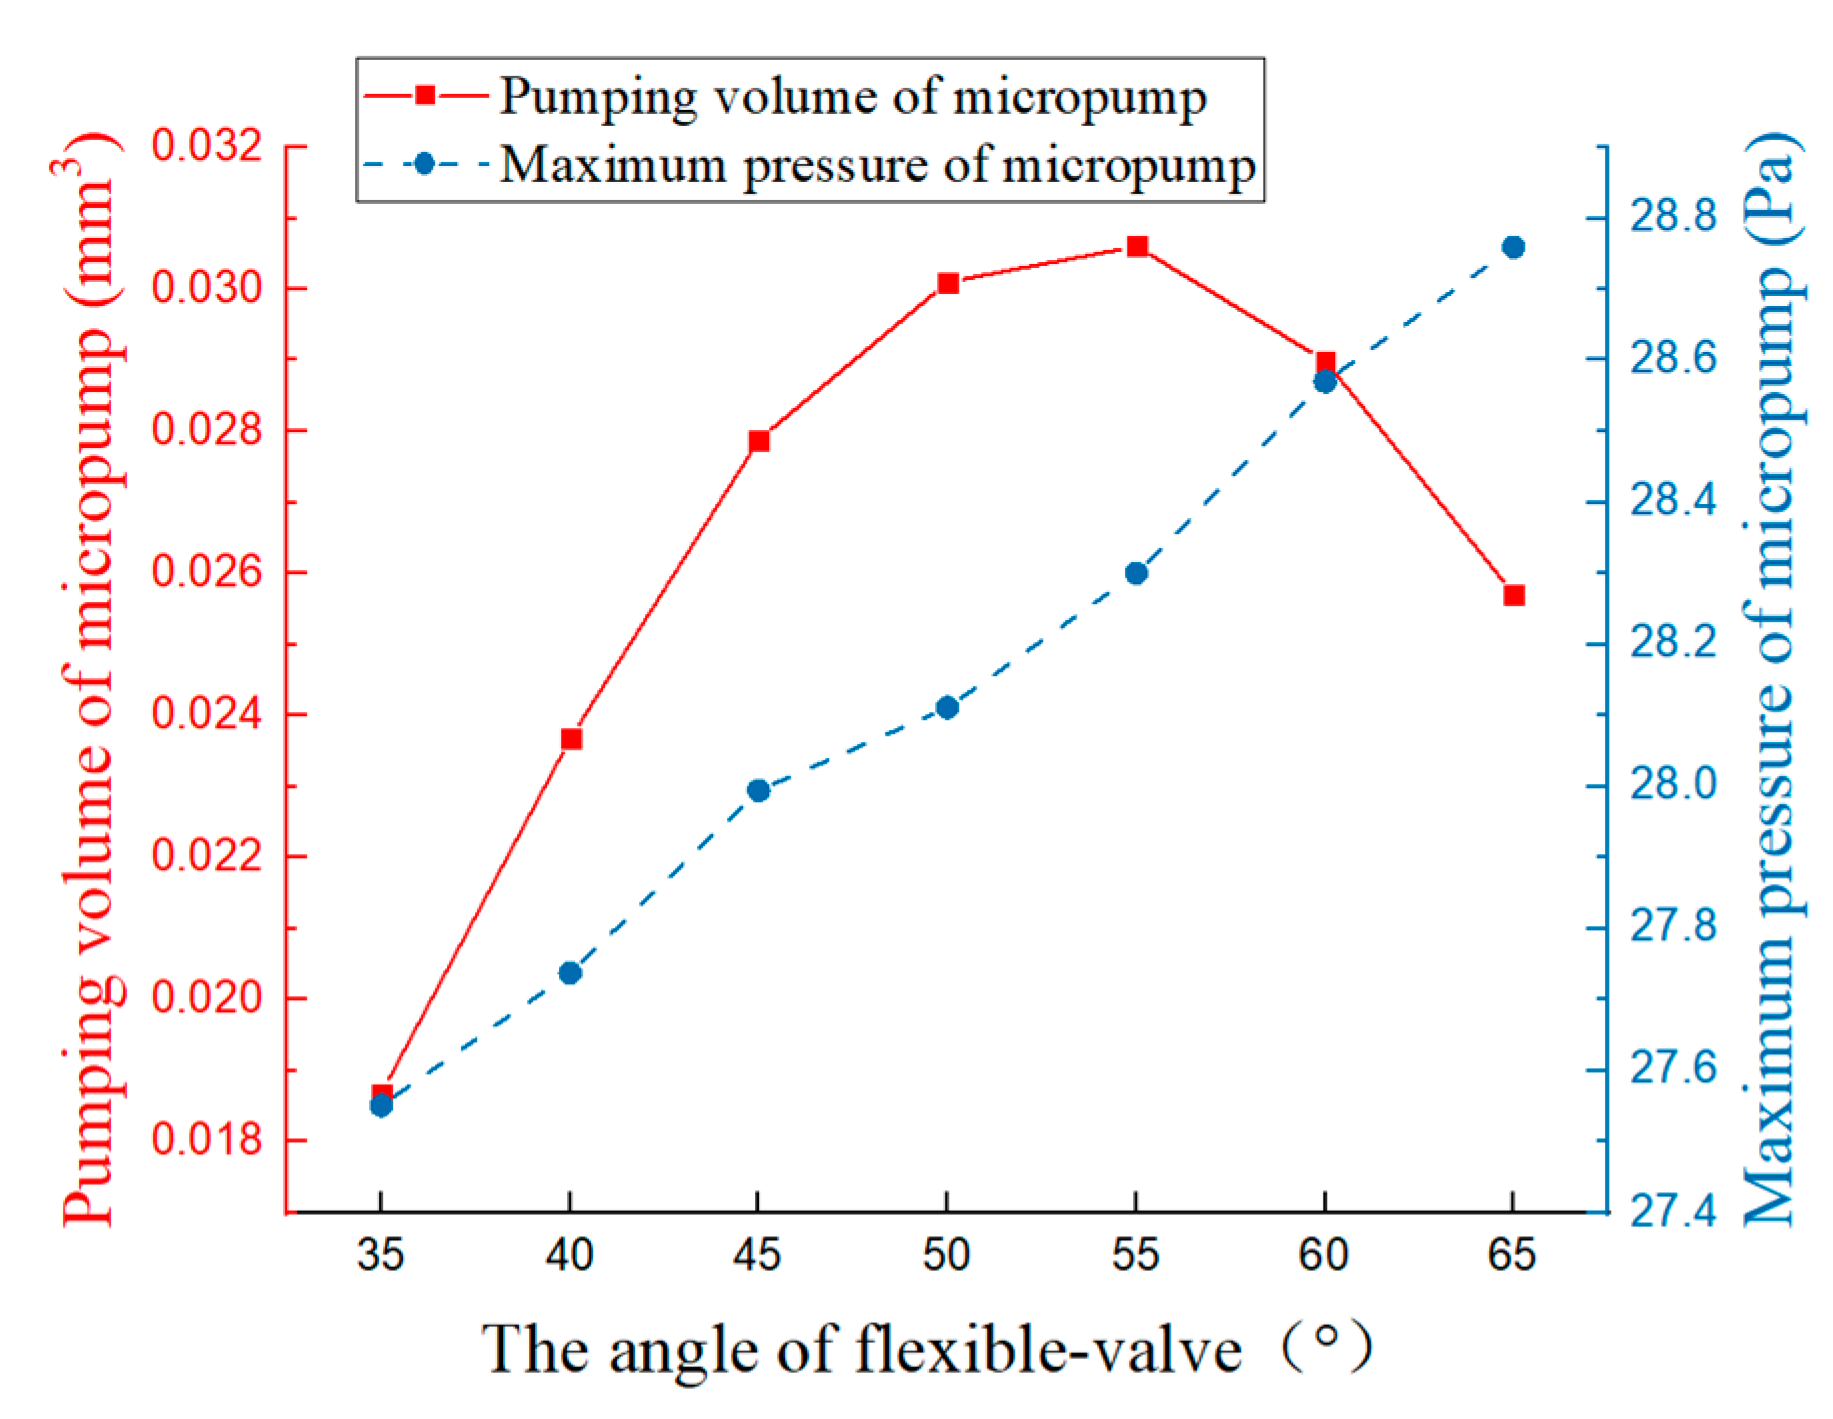
Figure 25 shows the curves of pumping volume and maximum pressure with different flexible valve angles at 1 s. It can be seen that the variation between the pumping volume of the micropump and the angle of the flexible valve presents a downward parabola, and reaches the maximum value when the angle of the flexible valve is . As shown in Figure 25, the maximum pressure of the micropump is positively correlated with the angle of the flexible valve. This is because the larger resistance to the microfluid is generated by the larger angle of the flexible valve.
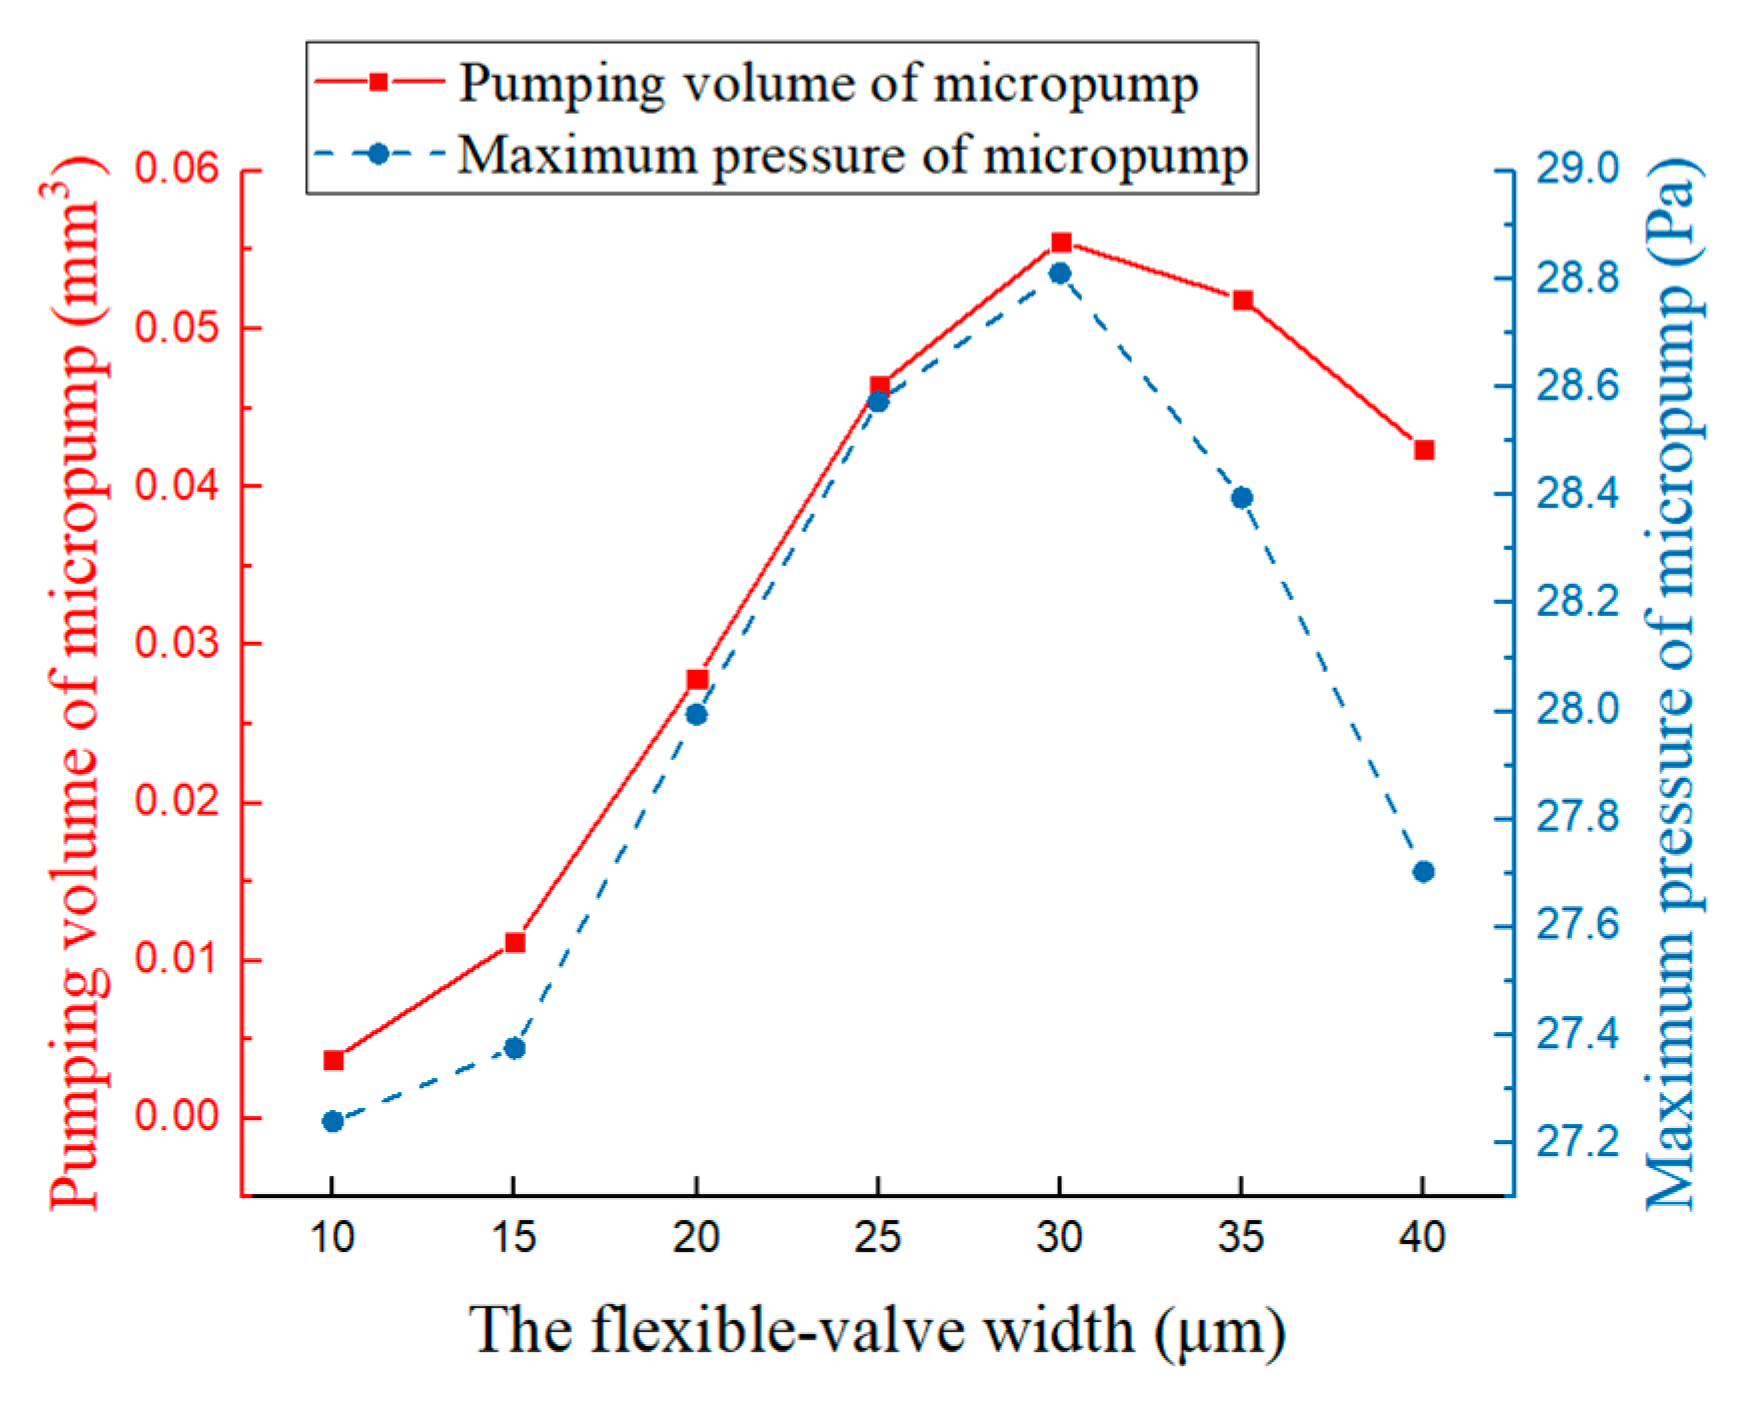
4.6.2. Influence of the Width of the Flexible Valve
With a wider flexible valve, the flexibility of the flexible valve will be worse, and the flexural rigidity will be better. The size of deformation when the micropump is working is also affected by the width of the flexible valve. The width parameters of the flexible valve are shown in Table 9 (the width of the original model is 20 ).
Figure 26 shows the curves of pumping volume and maximum pressure at different flexible valve widths at 1 s. The maximum value of the pumping volume and the maximum pressure of the micropump are achieved at the same time when the flexible valve width is 300 . This is because when the width of the flexible valve is less than 300 , the deformation of the flexible valve is too large, which leads to a small effective unidirectional flow. When the width of the flexible valve is more than 300 , the deformation of the flexible valve is too small and also leads to a small effective unidirectional flow. Therefore, 300 is the optimal value of the flexible valve width.
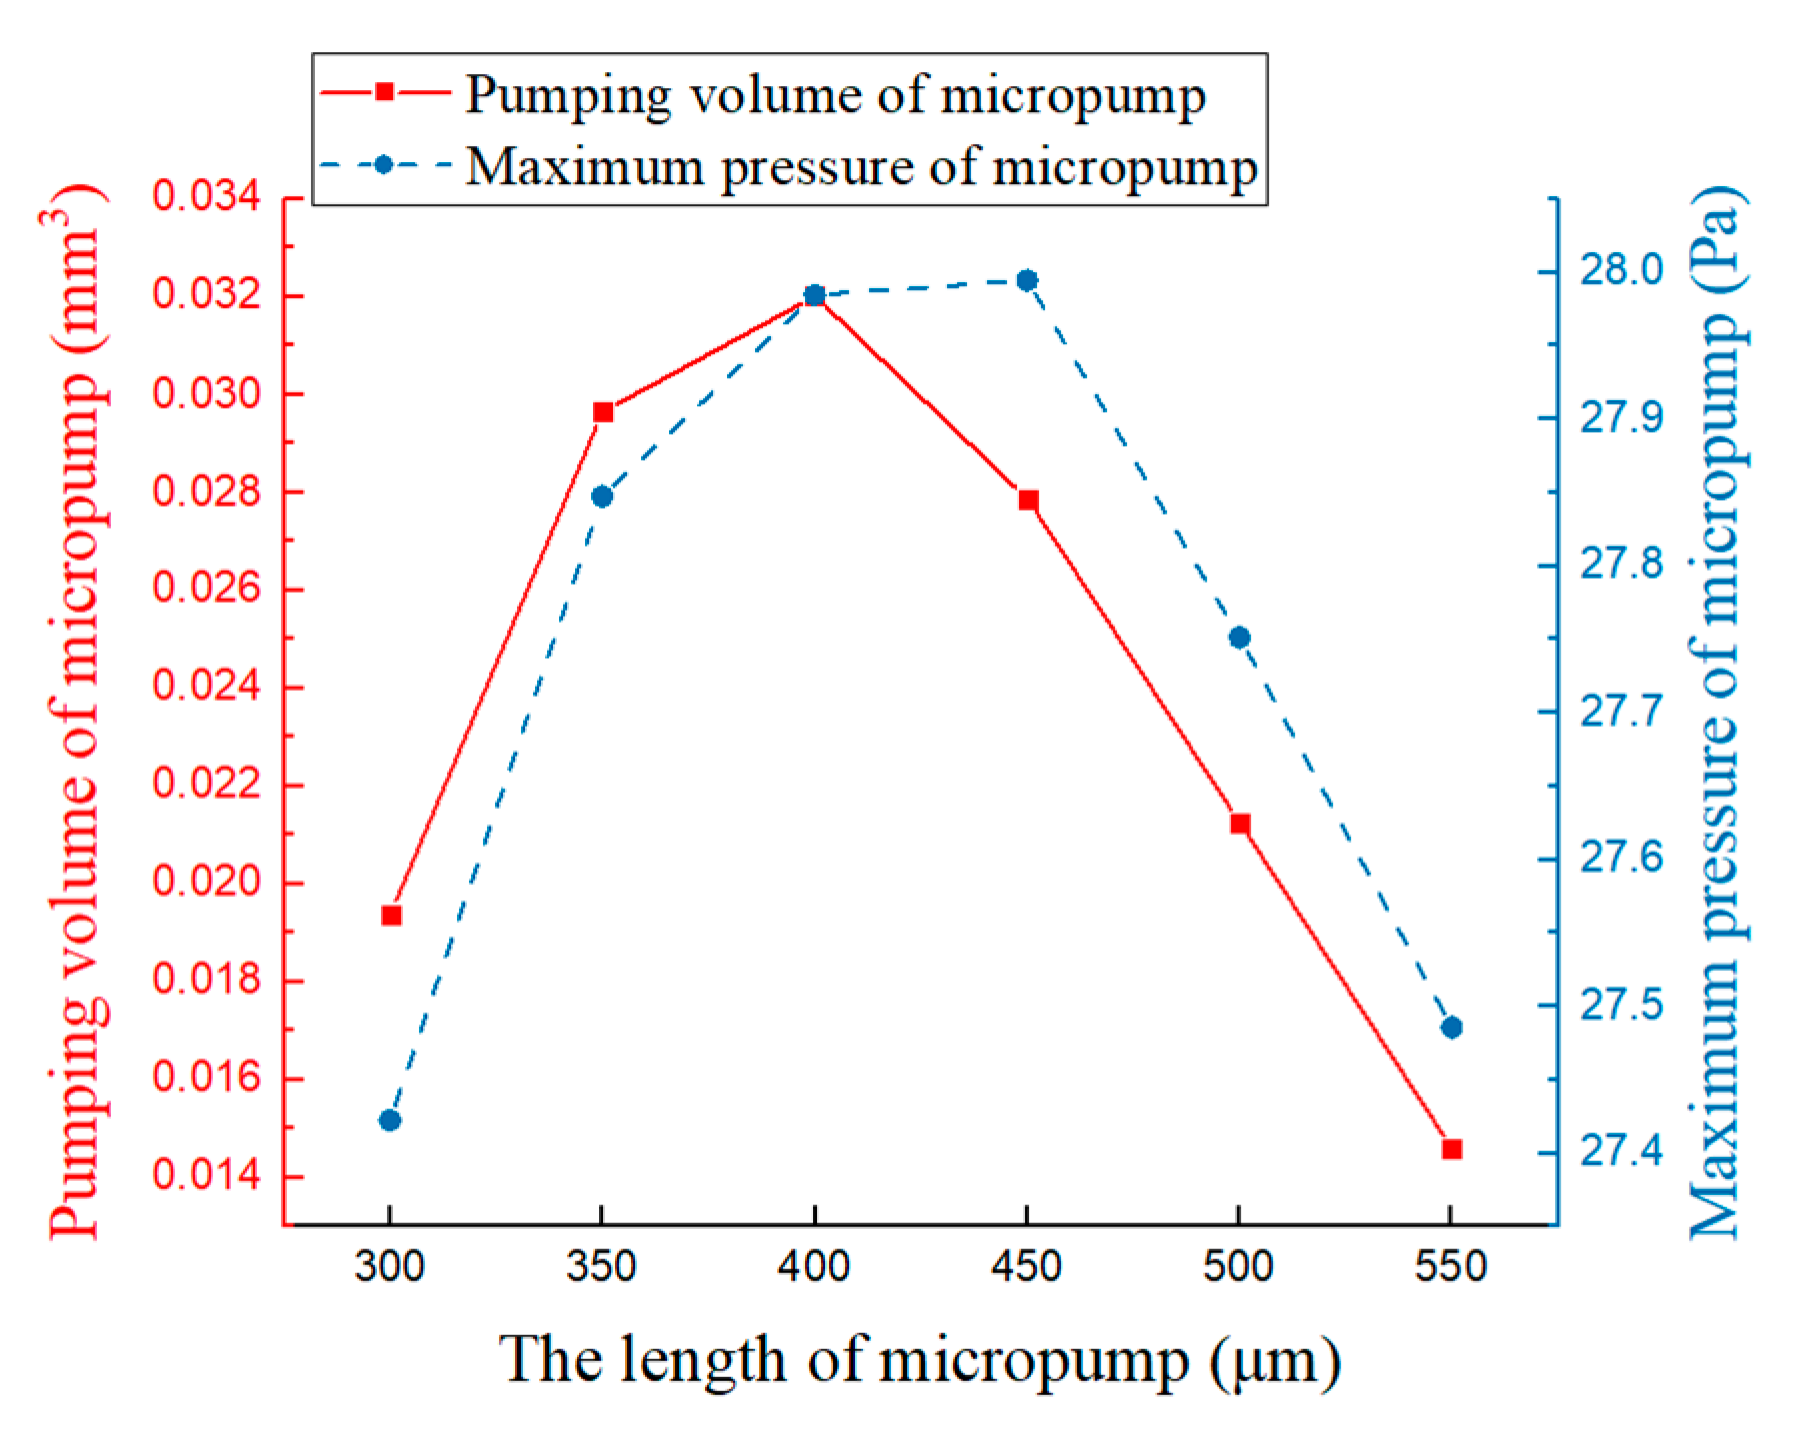
4.6.3. Influence of the Length of the Flexible Valve
The closure degree of the microchannel and the size of the deformation of the flexible valve are affected by the length of the flexible valve. Different length parameters of the flexible valve are shown in Table 10 (the length of the original model is 450 ).
The chart of pumping volume and maximum pressure with different flexible valve lengths is shown in Figure 27. It is clear that the maximum value of the pumping volume is achieved when the length of the flexible valve is 400 , and the maximum pressure is achieved when the length of the flexible valve is 450 .
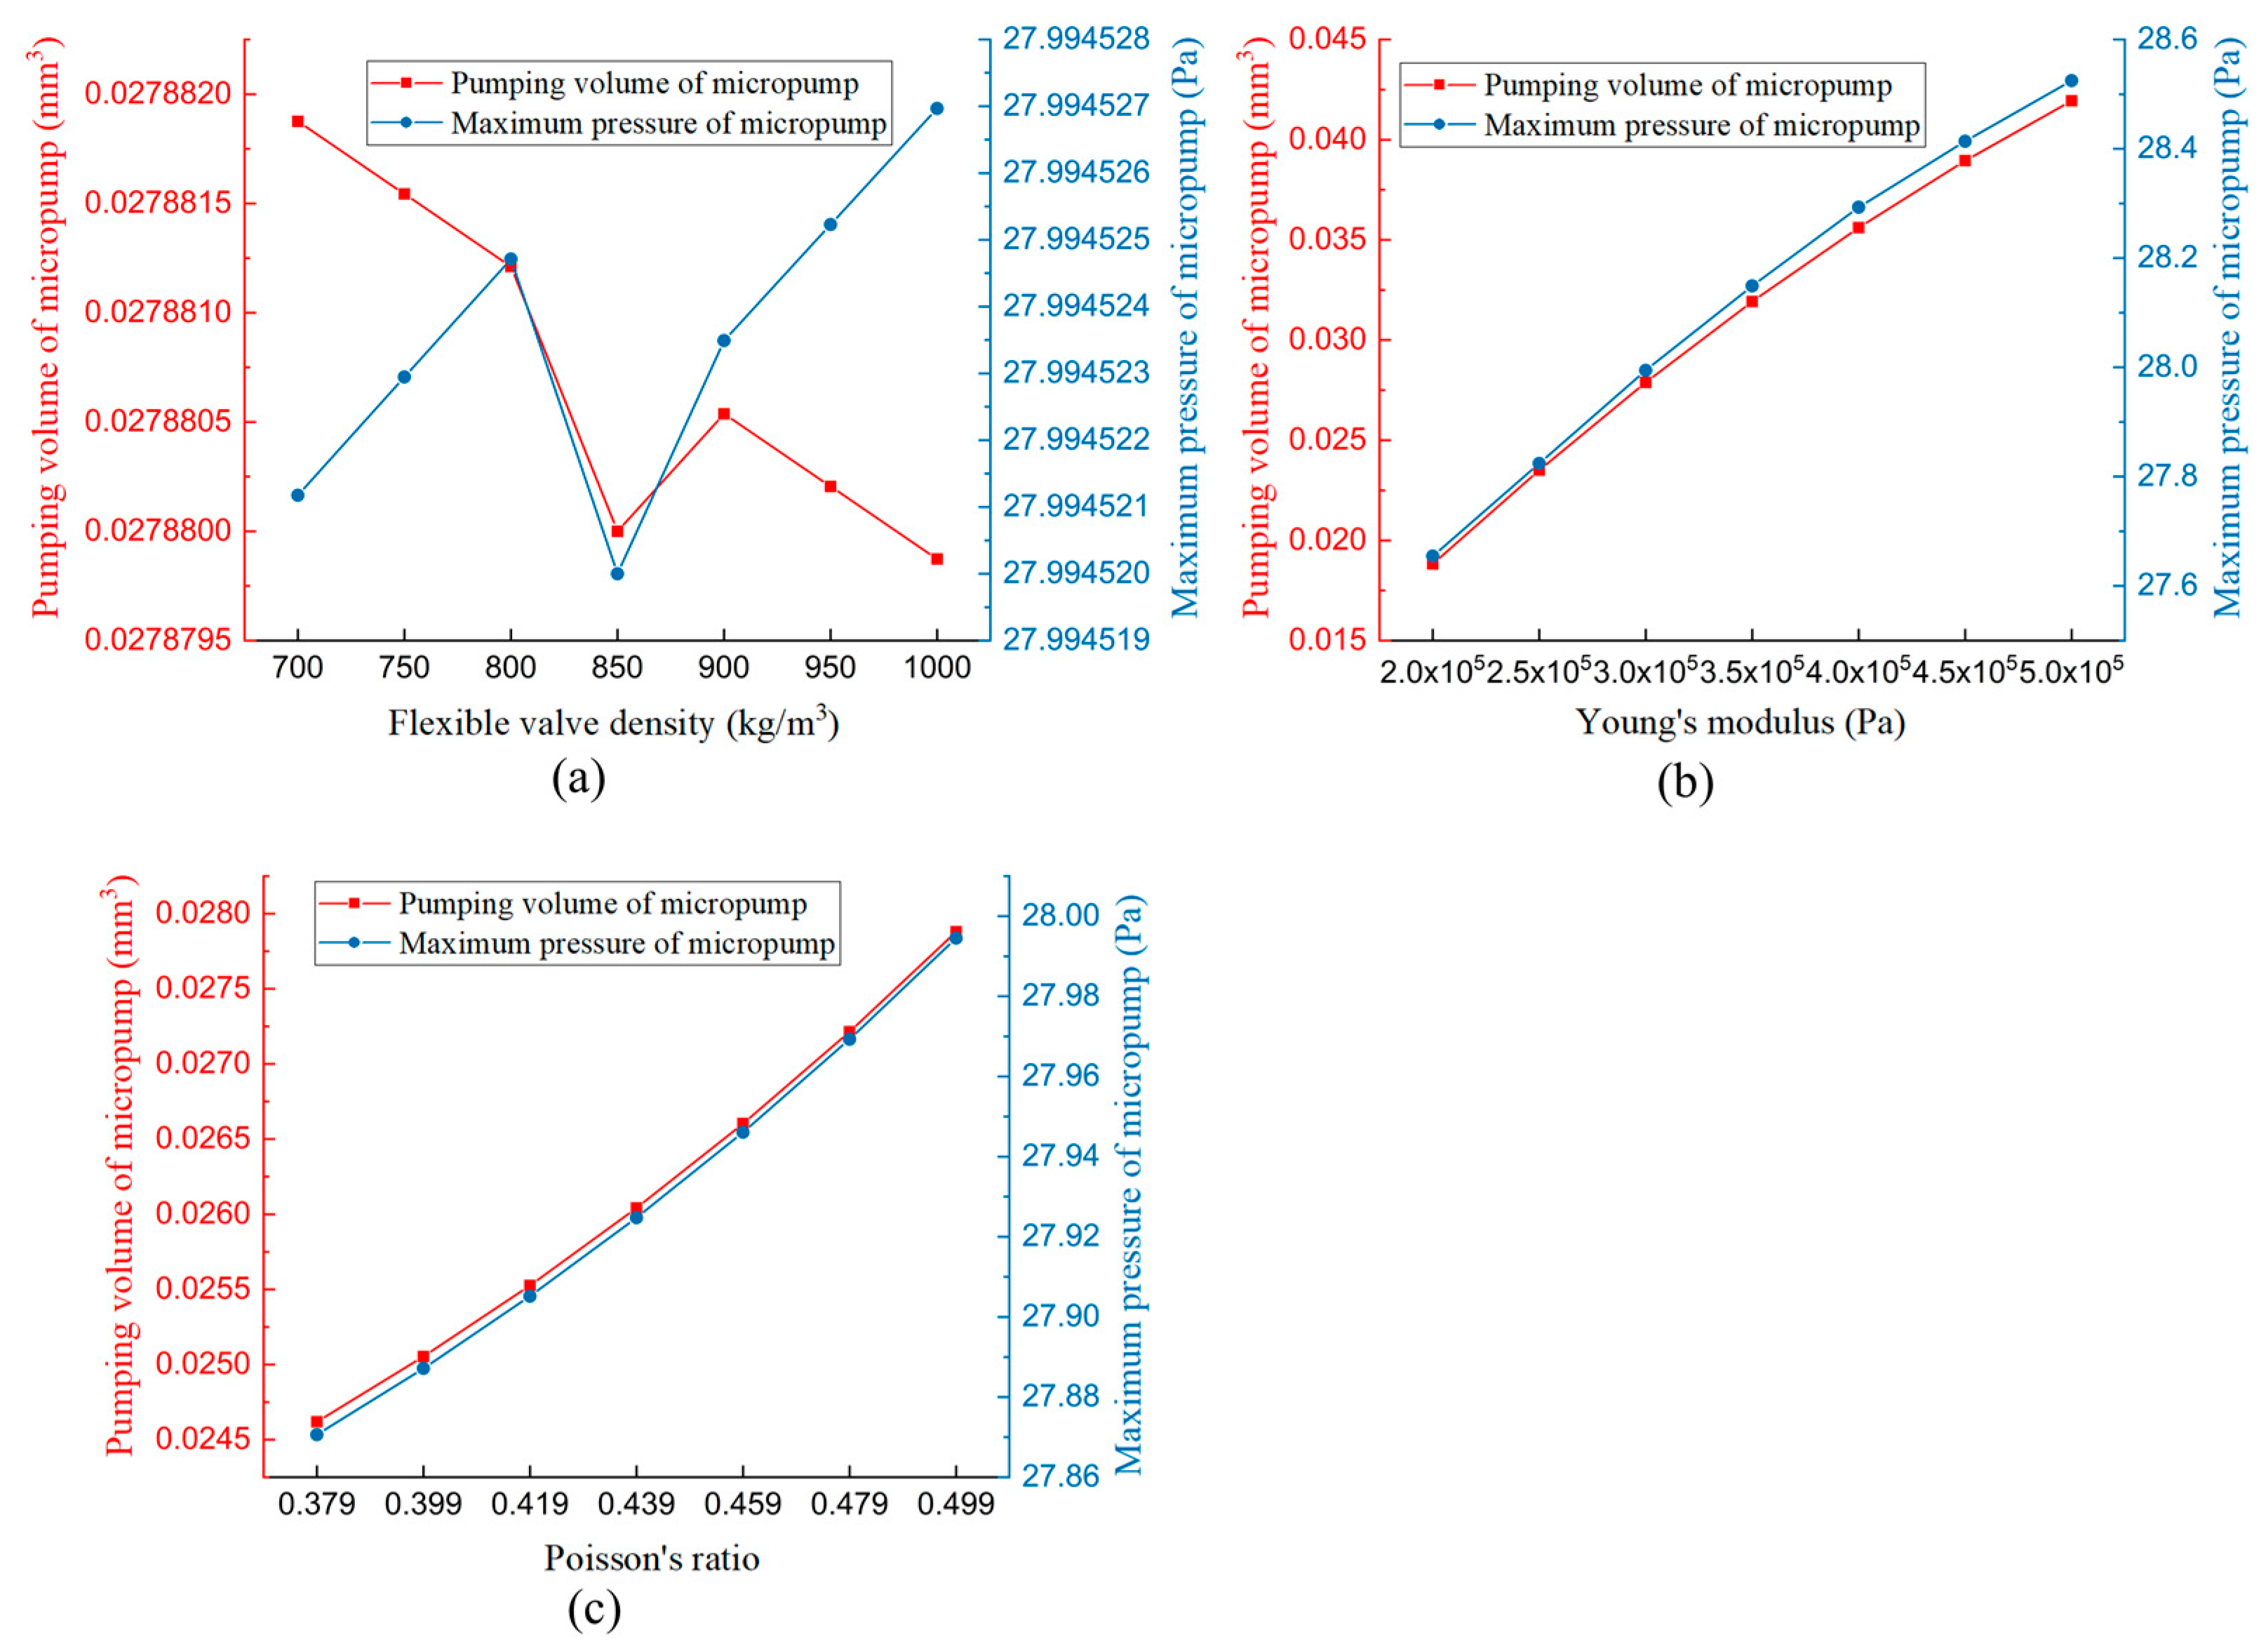
4.6.4. Influence of the Material Properties of Flexible Valves
The selected density, Young’s modulus, and Poisson’s ratio of the flexible valve in the simulation are parameterized, as shown in Table 11.
The influence of the density of the flexible valve on the performance of the micropump is shown in Figure 28a, the influence of Young’s modulus of the flexible valve on the performance of the micropump is shown in Figure 28b, and the influence of Poisson’s ratio of the flexible valve on the performance of the micropump is shown in Figure 28c. Because the volume of the components in a microfluid device is too small, gravity is no longer the dominant force. It can be seen that the influence of flexible valve density on the performance of the micropump is very small from Figure 28a. From Figure 28b,c, it can be seen that the pumping volume and maximum pressure increase steadily with the increase in Young’s modulus and Poisson’s ratio.
4.7. Global Optimization of Structural Parameters
The structural parameters of the model hold significant practical importance. By preemptively analyzing the impact of these parameters, we can identify optimal ratios for various operating conditions. This approach not only enhances the understanding of the parallel EWOD flexible valve micropump but also contributes to cost reduction in actual production by pinpointing its weaknesses and providing guidance for performance improvement. This section focuses on optimizing the micropump’s pumping volume. Based on the structural parameter analysis and simulation results presented in this section, a set of optimal parameter ratios is detailed in Table 12.
Further analysis of the micropump’s inlet reveals that wider inlet and outlet dimensions are preferable, with a set width of 1000 μm. The width of the microchannel’s parts I and II remains unchanged at 500 μm and 380 μm, consistent with the original model. To ensure smoother microfluid flow at the channel intersection, a fillet radius of 800 μm is employed at the micropump’s inlet and outlet. The microchannel’s length is minimized to 3600 μm.
In determining the angle parameters of the microchannel and the flexible valve, we consider the prevention of backflow and the flexible valve’s deformation within reasonable limits. Consequently, a range of potential optimal parameter combinations is selected from five parameter groups for numerical analysis. The final parameter values are as follows: the microchannel’s angle is set at 79.61 degrees, the flexible valve’s placement angle at 55 degrees, the flexible valve’s width is 25 μm, its length is 450 μm, its density is 850 kg/m3, the Young’s modulus is 5 × 10⁵ Pa, and the Poisson’s ratio is 0.499.
The pumping volume and flow rate of the optimized micropump are illustrated in Figure 29. A comparison between Figure 6 and Figure 7 reveals that, after optimizing the structural parameters, the micropump’s pumping volume reaches 0.0981 mm3 (Figure 28a), which is approximately 3.5 times that of the original model. Additionally, the maximum pressure reaches 33.7513 Pa (Figure 28b), approximately 1.2 times that of the original model. As a result, the optimized micropump outperforms the original model in terms of both pumping volume and maximum pressure.
These results are close to the results of the micropump designed by Liu et al. and Zeng et al. (Liu et al.’ results are q = 110 mL/min, p = 142 kPa, and their structure size is 53.8 × 22 × 5 mm3, with a voltage of 170 V [24]; Zeng et al.’ results are q = 318 mL/min, p = 4.05 kPa, and their structure size is 54 × 49 × 15 mm3, with a voltage of 130 V [25]).
5. Conclusions
In the present study, we utilized the Finite Element Method (FEM) within COMSOL Multiphysics 5.5 software to simulate the flow behavior of a double-chamber parallel EWOD flexible valve micropump. Our investigation focused on analyzing the impact of key structural parameters on the micropump’s performance and ultimately proposed optimized parameters. The primary conclusions drawn from this research are as follows:
(1) We successfully conducted a comprehensive numerical simulation of the double-chamber parallel flexible valve micropump, confirming that this pump has smaller pumping-volume fluctuations and higher output pressure.
(2) An in-depth analysis was conducted on the influence of the structural parameters, including the width of the inlet and outlet of the micropump, the width of the micro-channel, the length of the microchannel, the round corner at the inlet and outlet, the angle of the microchannel, the angle of the flexible valve placement, the width of the flexible valve, and the length of the flexible valve. Additionally, we considered the material properties of flexible valves on pumping performance. Based on the observed influence patterns, we formulated a set of optimal combinations of structural parameters with the pumping volume of the micropump as the target. The resulting pumping volume is approximately 3.5 times that achieved with the original structural parameters.
Our numerical optimization of the EWOD micropump has significant implications for the design of micropumps in applications requiring precise manipulation of picoliters of liquid, or in cases where contamination must be strictly controlled, such as in cell analysis and viral diagnosis, for example in PCR tests. It is important to note that our optimization is based on a two-dimensional simulation, neglecting the effects from flow in the perpendicular direction. Nonetheless, the aspect ratio of the flow channel can also influence the pump’s performance. Furthermore, in practical scenarios, the properties of the working liquids can vary considerably, particularly in terms of viscosity and wetting abilities, which may significantly impact the pump’s performance. We plan to further investigate these geometric parameters and physical properties to offer more reliable guidance for the design of EWOD micropumps.
Author Contributions
Conceptualization, F.J. and J.W.; methodology, J.W.; software, J.W.; validation, J.W.; formal analysis, J.W.; investigation, F.J.; resources, F.J.; data curation, J.W.; writing—original draft preparation, J.W.; writing—review and editing, T.D.; visualization, J.W.; supervision, F.J.; project administration, T.D.; funding acquisition, F.J. All authors have read and agreed to the published version of the manuscript.
Funding
This research was funded by Research on Extension Design Methods for Guangfu Cultural and Creative Products, grant number GD23XYS029; and Research on the Teaching Model of Specialization Innovation Integration for Graduate Professional Courses, grant number 202235349.
Data Availability Statement
This study uses numerical simulation data; if readers would like these data, please email the corresponding author to obtain the simulation data.
Acknowledgments
We acknowledge the support given by Z.G. Jiang.
Conflicts of Interest
The authors declare no conflict of interest.
References
- Wang, Y.N.; Fu, L.M. Micropumps and biomedical applications-A review. Microelectron. Eng. 2018, 195, 121–138. [Google Scholar] [CrossRef]
- Ge, M.; Petkovek, M.; Zhang, G.; Jacobs, D.; Olivier, C.D. Cavitation dynamics and thermodynamic effects at elevated temperatures in a small Venturi channel. Int. J. Heat. Mass. Transf. 2021, 170, 120970. [Google Scholar] [CrossRef]
- Zhou, P.; Zhang, T.; Simon, T.W.; Cui, T. Simulation and experiments on a valveless micropump with fluidic diodes based on topology optimization. J. Microelectromech. Syst. 2022, 31, 292–297. [Google Scholar] [CrossRef]
- Apte, D.; Ge, M.; Coutier-Delgosha, O. Numerical investigation of a cavitating nozzle for jetting and rock erosion based on different turbulence models. Geoenergy Sci. Eng. 2023, 231, 212300. [Google Scholar] [CrossRef]
- Mohith, S.; Karanth, P.; Navin; Kulkarni, S.M. Recent trends in mechanical micropumps and their applications: A review. Mechatron. Sci. Intell. Mach. 2019, 60, 34–55. [Google Scholar] [CrossRef]
- Matsumoto, H.; Colgate, J.E. Preliminary investigation of micropumping based on electrical control of interfacial tension. In Proceedings of the Micro Electro Mechanical Systems, an Investigation of Micro Structures, Sensors, Actuators, Machines & Robots, Napa Valley, CA, USA, 11–14 February 1990; pp. 105–110. [Google Scholar]
- Yang, S.C.; Liu, C.H. An electrolysis-bubble-actuated micropump using electrowetting on dielectric (EWOD) for 1xN micro-sample switches. In Proceedings of the TRANSDUCERS 2009—2009 International Solid-State Sensors, Actuators and Microsystems Conference, Denver, CO, USA, 21–25 June 2009; pp. 2018–2021. [Google Scholar]
- Lee, S.; Lee, D.; Choi, M.; Chung, S.K. AC EWOD-induced asymmetric droplet oscillation and manipulation. Sens. Actuators A Phys. 2022, 347, 113910. [Google Scholar] [CrossRef]
- Yamamoto, K.; Takagi, S.; Ichikawa, Y.; Motosuke, M.J. Lubrication effects on droplet manipulation by electrowetting-on-dielectric (EWOD). Appl. Phys. 2022, 132, 204701. [Google Scholar] [CrossRef]
- Sukthang, K.; Kampeera, J.; Sriprachuabwong, C.; Kiatpathomchai, W.; Pengwang, E.; Tuantranont, A.; Wechsatol, W. Sensitivity validation of EWOD devices for diagnosis of early mortality syndrome (EMS) in shrimp using colorimetric LAMP–XO technique. Sensors 2021, 21, 3126. [Google Scholar] [CrossRef]
- Shabani, R.; Cho, H.J. A micropump controlled by EWOD: Wetting line energy and velocity effects. Lab Chip 2011, 11, 3401–3403. [Google Scholar] [CrossRef]
- Jang, I.; Ko, H.; You, G.; Lee, H.; Paek, S.; Chae, H.; Lee, J.H.; Choi, S.; Kwon, O.; Shin, K.; et al. Application of paper EWOD (electrowetting-on-dielectrics) chip: Protein tryptic digestion and its detection using MALDI-TOF mass spectrometry. BioChip J. 2017, 11, 146–152. [Google Scholar] [CrossRef]
- Bohm, S.; Phi, H.B.; Moriyama, A.; Dittrich, L.; Runge, E. Dimensioning and characterization of an EWOD-driven chip integrated micropump using time-resolved simulations. In Proceedings of the MikroSystemTechnik Congress 2021, Stuttgart-Ludwigsburg, Germany, 8–10 November 2021; pp. 1–4. [Google Scholar]
- Wen, J.F.; Jiang, F.; Shen, J. Design and Analysis of EWOD-driven Micropump. Chin. Hydraul. Pneum. 2020, 8, 106–111. [Google Scholar]
- Wei, Q.; Yao, W.; Gu, L.; Fan, B.; Gao, Y.; Yang, L.; Zhao, Y.; Che, C. Modeling, simulation, and optimization of electrowetting-on-dielectric (EWOD) devices. Biomicrofluidics 2021, 15, 014107. [Google Scholar] [CrossRef]
- Yan, J.; Dai, J.T.; Li, L.J. Design and analysis of Double-cavity micropump of flexible valve. J. Phys. Conf. Ser. 2022, 2390, 012061. [Google Scholar] [CrossRef]
- Pollack, M.G.; Shenderov, A.D.; Fair, R.B. Electrowetting-based actuation of droplets for integrated microfluidics. Lab Chip 2002, 2, 96–101. [Google Scholar] [CrossRef] [PubMed]
- COMSOL Co. COMSOL Multiphysics 5.0 Refecence Manual; COMSOL Co., Ltd.: Stockholm, Sweden, 2019. [Google Scholar]
- Ameri, A.R.; Imanparast, A.; Passandideh-Fard, M.; Shaegh, S.A.M. A whole-thermoplastic microfluidic chip with integrated on-chip micropump, bioreactor and oxygenator for cell culture applications. Anal. Chim. Acta 2022, 1221, 340093. [Google Scholar] [CrossRef]
- Peng, Y.H.; Wang, D.H. A novel multi-channel silicon-based piezoelectric micropump with active piezoelectric valve array. Smart Mater. Struct. 2022, 31, 075010. [Google Scholar] [CrossRef]
- Tavari, T.; Meamardoost, S.; Sepehry, N.; Akbarzadeh, P.; Nazari, M.; Hashemi, N.N.; Nazari, M. Effects of 3D electrodes arrangement in a novel AC electroosmotic micropump: Numerical modeling and experimental validation. Electrophoresis 2023, 44, 450–461. [Google Scholar] [CrossRef]
- Bohm, S.; Runge, E. Multiphysics simulation of fluid interface shapes in microfluidic systems driven by electrowetting on dielectrics. J. Appl. Phys. 2022, 132, 224702. [Google Scholar] [CrossRef]
- Wang, Z.; Bian, X.; Chen, L. A Numerical Study of Droplet Splitting using Different Spacers in EWOD Device. BioChip J. 2020, 14, 242–250. [Google Scholar] [CrossRef]
- Liu, X.; Li, X.; Wang, M.; Cao, S.; Wang, X.; Liu, G. A high-performance piezoelectric micropump with multi-chamber in series. Appl. Sci. 2022, 12, 4483. [Google Scholar] [CrossRef]
- Zeng, P.; Li, L.A.; Dong, J.; Cheng, G.; Kan, J.; Xu, F. Structure design and experimental study on single-bimorph double-acting check-valve piezoelectric pump. Proc. Inst. Mech. Eng. Part. C J. Mech. Eng. Sci. 2015, 230, 2339–2344. [Google Scholar] [CrossRef]
Figure 1.
The 2D structure (flow domain) of the double-chamber parallel flexible valve micropump.

Figure 2.
The dimensions of the microchannels.

Figure 3.
Contact angle and motion of liquid droplets, blue is KCL droplet, and red is silicon oil.

Figure 4.
The meshed geometry.

Figure 5.
A Comparison of droplet moving velocity between the simulation and the experiments [17].
Figure 5.
A Comparison of droplet moving velocity between the simulation and the experiments [17].

Figure 6.
Interface sharpness by varying grid resolution, blue is KCL droplet, and red is silicon oil.
Figure 6.
Interface sharpness by varying grid resolution, blue is KCL droplet, and red is silicon oil.

Figure 7.
The pumping volume and flow rate in the original micropump.

Figure 8.
The simulated maximum pressure with COMSOL.

Figure 9.
The flow field inside the micropump while the KCL droplet is moving down (a) and up (b) in the pump chamber. The gray line is a streamline, and the red arrow is flowing direction.
Figure 9.
The flow field inside the micropump while the KCL droplet is moving down (a) and up (b) in the pump chamber. The gray line is a streamline, and the red arrow is flowing direction.

Figure 10.
The magnified view of internal flow on the micropump inlet and outlet. The yellow dots indicate the core of the vortices at each time instant.
Figure 10.
The magnified view of internal flow on the micropump inlet and outlet. The yellow dots indicate the core of the vortices at each time instant.

Figure 11.
The magnified view of the internal flow and the corresponding deformation of the flexible valves, blue is upper wall and flexible valve, and green is bottom wall and flexible valve.
Figure 11.
The magnified view of the internal flow and the corresponding deformation of the flexible valves, blue is upper wall and flexible valve, and green is bottom wall and flexible valve.

Figure 12.
The velocity contours of the parallel EWOD flexible valve pump.

Figure 13.
The rectangular coordinate system at the inlet and outlet.

Figure 14.
The velocity distribution at the inlet (a,b) and outlet (c,d) of the micropump.

Figure 15.
The structural parameters of the micropump.

Figure 16.
The pumping volume and the maximum pressure in the micropump at different widths of inlet and outlet.
Figure 16.
The pumping volume and the maximum pressure in the micropump at different widths of inlet and outlet.

Figure 17.
The velocity distribution at different widths of the outlet, (a) is X-direction, and (b) is Y-direction.
Figure 17.
The velocity distribution at different widths of the outlet, (a) is X-direction, and (b) is Y-direction.

Figure 18.
The relationship of pumping volume and maximum pressure with different microchannel widths.
Figure 18.
The relationship of pumping volume and maximum pressure with different microchannel widths.

Figure 19.
The vector velocity distribution at the outlet with different microchannel widths, (a) is X-direction, and (b) is Y-direction.
Figure 19.
The vector velocity distribution at the outlet with different microchannel widths, (a) is X-direction, and (b) is Y-direction.

Figure 20.
The relationship of pumping volume and maximum pressure with different microchannel lengths.
Figure 20.
The relationship of pumping volume and maximum pressure with different microchannel lengths.

Figure 21.
The relationship of pumping volume and maximum pressure with a different fillet radius.

Figure 22.
The vector velocity distribution at the outlet with a different fillet radius, (a) is X-direction, and (b) is Y-direction.
Figure 22.
The vector velocity distribution at the outlet with a different fillet radius, (a) is X-direction, and (b) is Y-direction.

Figure 23.
The relationship of pumping volume and maximum pressure with different microchannel angles.
Figure 23.
The relationship of pumping volume and maximum pressure with different microchannel angles.

Figure 24.
The flow rate of the micropump with different microchannel angles.

Figure 25.
The relationship of pumping volume and maximum pressure with different flexible valve angles.
Figure 25.
The relationship of pumping volume and maximum pressure with different flexible valve angles.

Figure 26.
The relationship of pumping volume and maximum pressure with different flexible valve width.
Figure 26.
The relationship of pumping volume and maximum pressure with different flexible valve width.

Figure 27.
The relationship of pumping volume and maximum pressure with different flexible valve lengths.
Figure 27.
The relationship of pumping volume and maximum pressure with different flexible valve lengths.

Figure 28.
The relationship of pumping volume and maximum pressure with different flexible valve material properties, (a) the effect of flexible valve density on the performance of micropumps, (b) the effect of flexible valve Young’s modulus on micropump performance, and (c) the effect of flexible valve Poisson’s ratio on micropump performance.

Figure 29.
The Pumping performance of in the optimized micropump, (a) is the pumping volume and flow rate, (b) is the maximum pressure.
Figure 29.
The Pumping performance of in the optimized micropump, (a) is the pumping volume and flow rate, (b) is the maximum pressure.


Table 1.
Table of basic physical characteristics of KCL solution and silicone oil.
| Material | |||
|---|---|---|---|
| KCL solution | 1000 | 0.87 | 2 |
| Silicone oil | 1000 | 0.1 |
Table 2.
A list of the parameters in the reference simulation before the optimization.
| Items | W | H | L | R | β | α | Wv | Lv | E | ν |
|---|---|---|---|---|---|---|---|---|---|---|
| Value | 600 | 500 | 4000 | 0 | 79.61° | 45° | 20 | 450 | 3 × 10⁵ Pa | 0.499 |
Table 3.
The width of the outlet and inlet of the micropump.
| Cases | ||||||||
|---|---|---|---|---|---|---|---|---|
| Width () | 300 | 400 | 500 | 600 | 700 | 800 | 900 | 1000 |
Table 4.
The width parameters of the microchannel.
| Cases | |||||||
|---|---|---|---|---|---|---|---|
| Width of Part I () | 400 | 450 | 500 | 550 | 600 | 650 | 700 |
| Width of Part II () | 310 | 350 | 380 | 420 | 460 | 500 | 540 |
Table 5.
The length parameters of the microchannel.
| Cases | |||||||
|---|---|---|---|---|---|---|---|
| Length () | 3600 | 3800 | 4000 | 4200 | 4400 | 4600 | 4800 |
Table 6.
The fillet-radius parameters of the microchannel.
| Cases | |||||||
|---|---|---|---|---|---|---|---|
| Radius () | 200 | 300 | 400 | 500 | 600 | 700 | 800 |
Table 7.
The angle parameters of the microchannel.
| Cases | |||||||
|---|---|---|---|---|---|---|---|
| Angle () | 65.32 | 69.56 | 74.29 | 79.61 | 85.59 | 92.34 | 99.94 |
Table 8.
The angle parameters of the flexible valve.
| Cases | |||||||
|---|---|---|---|---|---|---|---|
| Angle () | 35 | 40 | 45 | 50 | 55 | 60 | 65 |
Table 9.
The width parameters of the flexible valve.
| Cases | |||||||
|---|---|---|---|---|---|---|---|
| Width () | 10 | 15 | 20 | 25 | 30 | 35 | 40 |
Table 10.
The length parameters of the flexible valve.
| Cases | ||||||
|---|---|---|---|---|---|---|
| Length () | 300 | 350 | 400 | 450 | 500 | 550 |
Table 11.
The material properties of the flexible valve.
| Cases | 1 | 2 | 3 | 4 | 5 | 6 | 7 |
|---|---|---|---|---|---|---|---|
| Density (kg/) | 700 | 750 | 800 | 850 | 900 | 950 | 1000 |
| Young’s modulus | |||||||
| Poisson’s ratio | 0.379 | 0.399 | 0.419 | 0.439 | 0.459 | 0.479 | 0.499 |
Table 12.
The structural parameters of optimization.
| Cases | |||||||||||
|---|---|---|---|---|---|---|---|---|---|---|---|
| Valve | 1000 | 500 380 | 3600 | 800 | 25 | 450 | 850 kg/ | 5 | 0.499 |
Disclaimer/Publisher’s Note: The statements, opinions and data contained in all publications are solely those of the individual author(s) and contributor(s) and not of MDPI and/or the editor(s). MDPI and/or the editor(s) disclaim responsibility for any injury to people or property resulting from any ideas, methods, instructions or products referred to in the content. |
© 2023 by the authors. Licensee MDPI, Basel, Switzerland. This article is an open access article distributed under the terms and conditions of the Creative Commons Attribution (CC BY) license (https://creativecommons.org/licenses/by/4.0/).
Share and Cite
MDPI and ACS Style
Jiang, F.; Wen, J.; Dong, T. Flow Analysis and Structural Optimization of Double-Chamber Parallel Flexible Valve Micropumps. ChemEngineering 2023, 7, 111. https://0-doi-org.brum.beds.ac.uk/10.3390/chemengineering7060111
AMA Style
Jiang F, Wen J, Dong T. Flow Analysis and Structural Optimization of Double-Chamber Parallel Flexible Valve Micropumps. ChemEngineering. 2023; 7(6):111. https://0-doi-org.brum.beds.ac.uk/10.3390/chemengineering7060111
Chicago/Turabian StyleJiang, Fan, Jinfeng Wen, and Teng Dong. 2023. "Flow Analysis and Structural Optimization of Double-Chamber Parallel Flexible Valve Micropumps" ChemEngineering 7, no. 6: 111. https://0-doi-org.brum.beds.ac.uk/10.3390/chemengineering7060111