Article

Optimizing Extract Preparation from Laurel (Laurus nobilis L.) Leaves Using a Pulsed Electric Field

by
Theodoros Chatzimitakos
,
Vassilis Athanasiadis
*,
Dimitrios Kalompatsios
,
Konstantina Kotsou
,
Martha Mantiniotou
,
Eleni Bozinou
and
Stavros I. Lalas
Department of Food Science and Nutrition, University of Thessaly, Terma N. Temponera Street, 43100 Karditsa, Greece
*
Author to whom correspondence should be addressed.
Submission received: 31 December 2023 / Revised: 21 February 2024 / Accepted: 22 February 2024 / Published: 1 March 2024

Abstract

:
This study explores the bioactive compound extraction from laurel (Laurus nobilis L.) leaves using a pulsed electric field (PEF) as a standalone extraction technique. The primary parameters impacting the extraction process were optimized through response surface methodology. Specifically, solvent composition (ethanol and water mixtures) and liquid-to-solid ratio, along with other key PEF conditions (i.e., electric field intensity, pulse period, and pulse length) were examined. The antioxidant capacity was evaluated through DPPH and FRAP assays, whereas total polyphenol content was also measured. A comparison was also made between the extracts produced with and without PEF. The results showed that after 30 min of extraction, the best parameters were a pulse period of 355 μs, a pulse duration of 55 μs, and an electric field intensity of 0.6 kV/cm. A liquid-to-solid ratio of 10 mL/g was chosen, whereas the best solvent was determined to be 25% (v/v) ethanol/water mixture. The PEF-treated extract contained 77% more polyphenols compared to the untreated sample. In addition, PEF-treated samples had a rise of up to 288% for certain individual polyphenols. Correlation analyses also revealed interesting trends among bioactive compounds and the antioxidant capacity of the extracts. The effect of the investigated parameters on polyphenol recovery was demonstrated, indicating that comparable investigations should consider these parameters to optimize polyphenol extraction yield. Regarding green and non-thermal standalone techniques, PEF outshines other extraction techniques as it could also be used as a sustainable way to swiftly generate health-promoting extracts from medicinal plants.

1. Introduction

From ancient times, medicinal plants have been evaluated for their therapeutic capacity and several other benefits including those related to health and aesthetics [1]. Medicinal plants generate a variety of secondary metabolites, some of which include aromatic compounds and essential oils [2]. The secondary metabolites found in medicinal plants are mostly natural antioxidants and preservatives and have a plethora of applications, including in medicine, cosmetics, and even food sectors [3]. The chemical composition of plant extracts is the most crucial factor in determining their effectiveness. Precipitation, temperature, height, and soil type are among the environmental elements that can affect these values [4]. Variations in polyphenol content have an immediate effect on the nutritional value of plant-based foods. Given their well-known capacity to scavenge reactive oxygen species, foods rich in antioxidants are in great demand [5].
Laurus nobilis L., commonly referred to as laurel, is a tall, slender, evergreen tree or shrub with multiple branches and scented broadleaf leaves. It is a member of the Lauraceae family, native to the Mediterranean basin but nowadays widely distributed across Europe and Asia [6,7]. It was historically acknowledged as a symbol of triumph in athletic and military contests, as well as a symbol of peacefulness, during the era of ancient Greeks and the Romans [8]. In addition to their long history of usage in folk medicine, the leaves of this plant have long been enjoyed as a flavoring agent in traditional food. As a result, much research has been conducted on their chemical composition and biological activities in comparison to other plant parts [9]. Laurel leaves contain several beneficial compounds, including norisoprenoids, alkaloids, tocopherols, and a vast number of polyphenols, including flavonoids, phenolic acids, and lignans. Specifically, quercetin, kaempferol, and isorhamnetin are the major polyphenols found in laurel leaves [10]. These compounds are well-known for their antioxidant and anti-inflammatory properties [11]. Among the many desirable characteristics of laurel leaf extracts are their thermostability, lack of phytotoxic effects, headache- and stomach-relieving properties, as well as their ability to prevent bacterial and fungal infections [12].
Plant materials contain a wide range of polyphenolic structures, from simple to complex, and highly polymerized polyphenols, which frequently interact with other components including polysaccharides and lipids. Recovering these antioxidants is a difficult procedure [13]. Hence, determining an ideal extraction approach that guarantees the efficient recovery of the beneficial qualities of polyphenols remains challenging. To achieve this, a multitude of techniques could be implemented [14]. While conventional extraction methods, including maceration and infusion, are generally feasible to implement, they frequently require a significant investment of time, energy, and solvent. On top of being impractical for use on bigger scales, these methods can lead to the loss of thermally sensitive polyphenolic compounds and are hard to automate [10,15]. Pulsed electric field (PEF) is an innovative method that is well suited to the development of “green” sustainable bioactive compound extraction. It emerges from the diminished energy demands per unit of processed product [16,17]. Breaking the cell membrane structure through electroporation is the fundamental notion behind PEF. In a treatment chamber. The food sample is placed between two electrodes, where several values of electric field strength could take place in order to extract bioactive compounds nonthermally from a solid plant tissue [18]. This technique is also defined as non-destructive and non-thermal, capable of lowering processing time and decreasing energy consumption [19,20]. It is reported that the employment of the PEF technique can result in improved yields when extracting intracellular bioactive compounds from various plant sources compared to conventional extraction techniques [21,22,23].
Although the plant offers important health-promoting benefits to humans, there is a scarcity of studies related to the optimization of the extraction process using PEF technique as a standalone extraction technique for laurel leaves. Its green and non-thermal nature, along with the standalone capability, are of great significance to produce laurel leaves extracts in a short time. Consequently, employing response surface methodology to optimize the extraction procedure and produce high added value extracts using PEF as a standalone extraction technique was the aim of this study. Initially, green solvent mixtures including water and ethanol for the extraction process were investigated along with the liquid-to-solid ratio using a Box–Behnken design. Following this, key PEF parameters including pulse duration, pulse period, electric field strength, and extraction duration were also examined through a Box–Behnken design. Optimum extraction conditions were revealed through a partial least squares model and variable importance plot. Laurel leaves extracts were assessed as a source of antioxidant compounds, with a particular focus on their potential applications in pharmaceutical and food industries.

2. Materials and Methods

2.1. Chemicals and Reagents

All information about the chemicals and reagents used is provided in the Supplementary Material.

2.2. Plant Material

For all experiments, laurel (Laurus nobilis L.) leaves were bought from a local shop in Karditsa, Greece. Distilled water was used to cleanse the plant in order to remove sediment and pollen particles. To freeze-dry the sample, a Biobase BKFD10P freeze-dryer (Jinan, China) was utilized. The moisture content was measured at 41.31 ± 0.25%. Subsequently, a blender was employed to reduce the dry laurel leaves to a fine powder of less than 400 μm. The sample was kept at −40 °C until further analysis.

2.3. Plant Extraction

The extraction procedure including PEF was based on a previous study [24]. All information is provided in the Supplementary Material and Table S1.

2.4. Optimization with Response Surface Methodology (RSM) and Experimental Design

To attain optimal extraction efficiency of bioactive compounds and assessment of antioxidant capacity from laurel leaves extracts, the RSM technique was applied. Information is given in detail in the Supplementary Material.

2.5. Kinetics Analysis

The extraction process of total polyphonic compounds and their antioxidant capacity measured by FRAP and DPPH assays for the optimum laurel leaves extract (X1: 0.6, X2: 55, and X3: 355) using PEF were assessed by first-order and second-order kinetic models in this study. The samples were measured at various time intervals ranging between 1 and 40 min to determine TPC, FRAP, and DPPH values. The rate constant (k) at extraction time (t) was calculated using the first-order and second-order kinetic models as previously described by Hobbi et al. [25].

2.6. Polyphenol Determination

2.6.1. Total Polyphenol Content (TPC)

Total polyphenol content (TPC) was calculated as mg gallic acid equivalents (GAE) per g of dry weight (dw) and was evaluated based on a previous study [26]. Further information is given in the Supplementary Material.

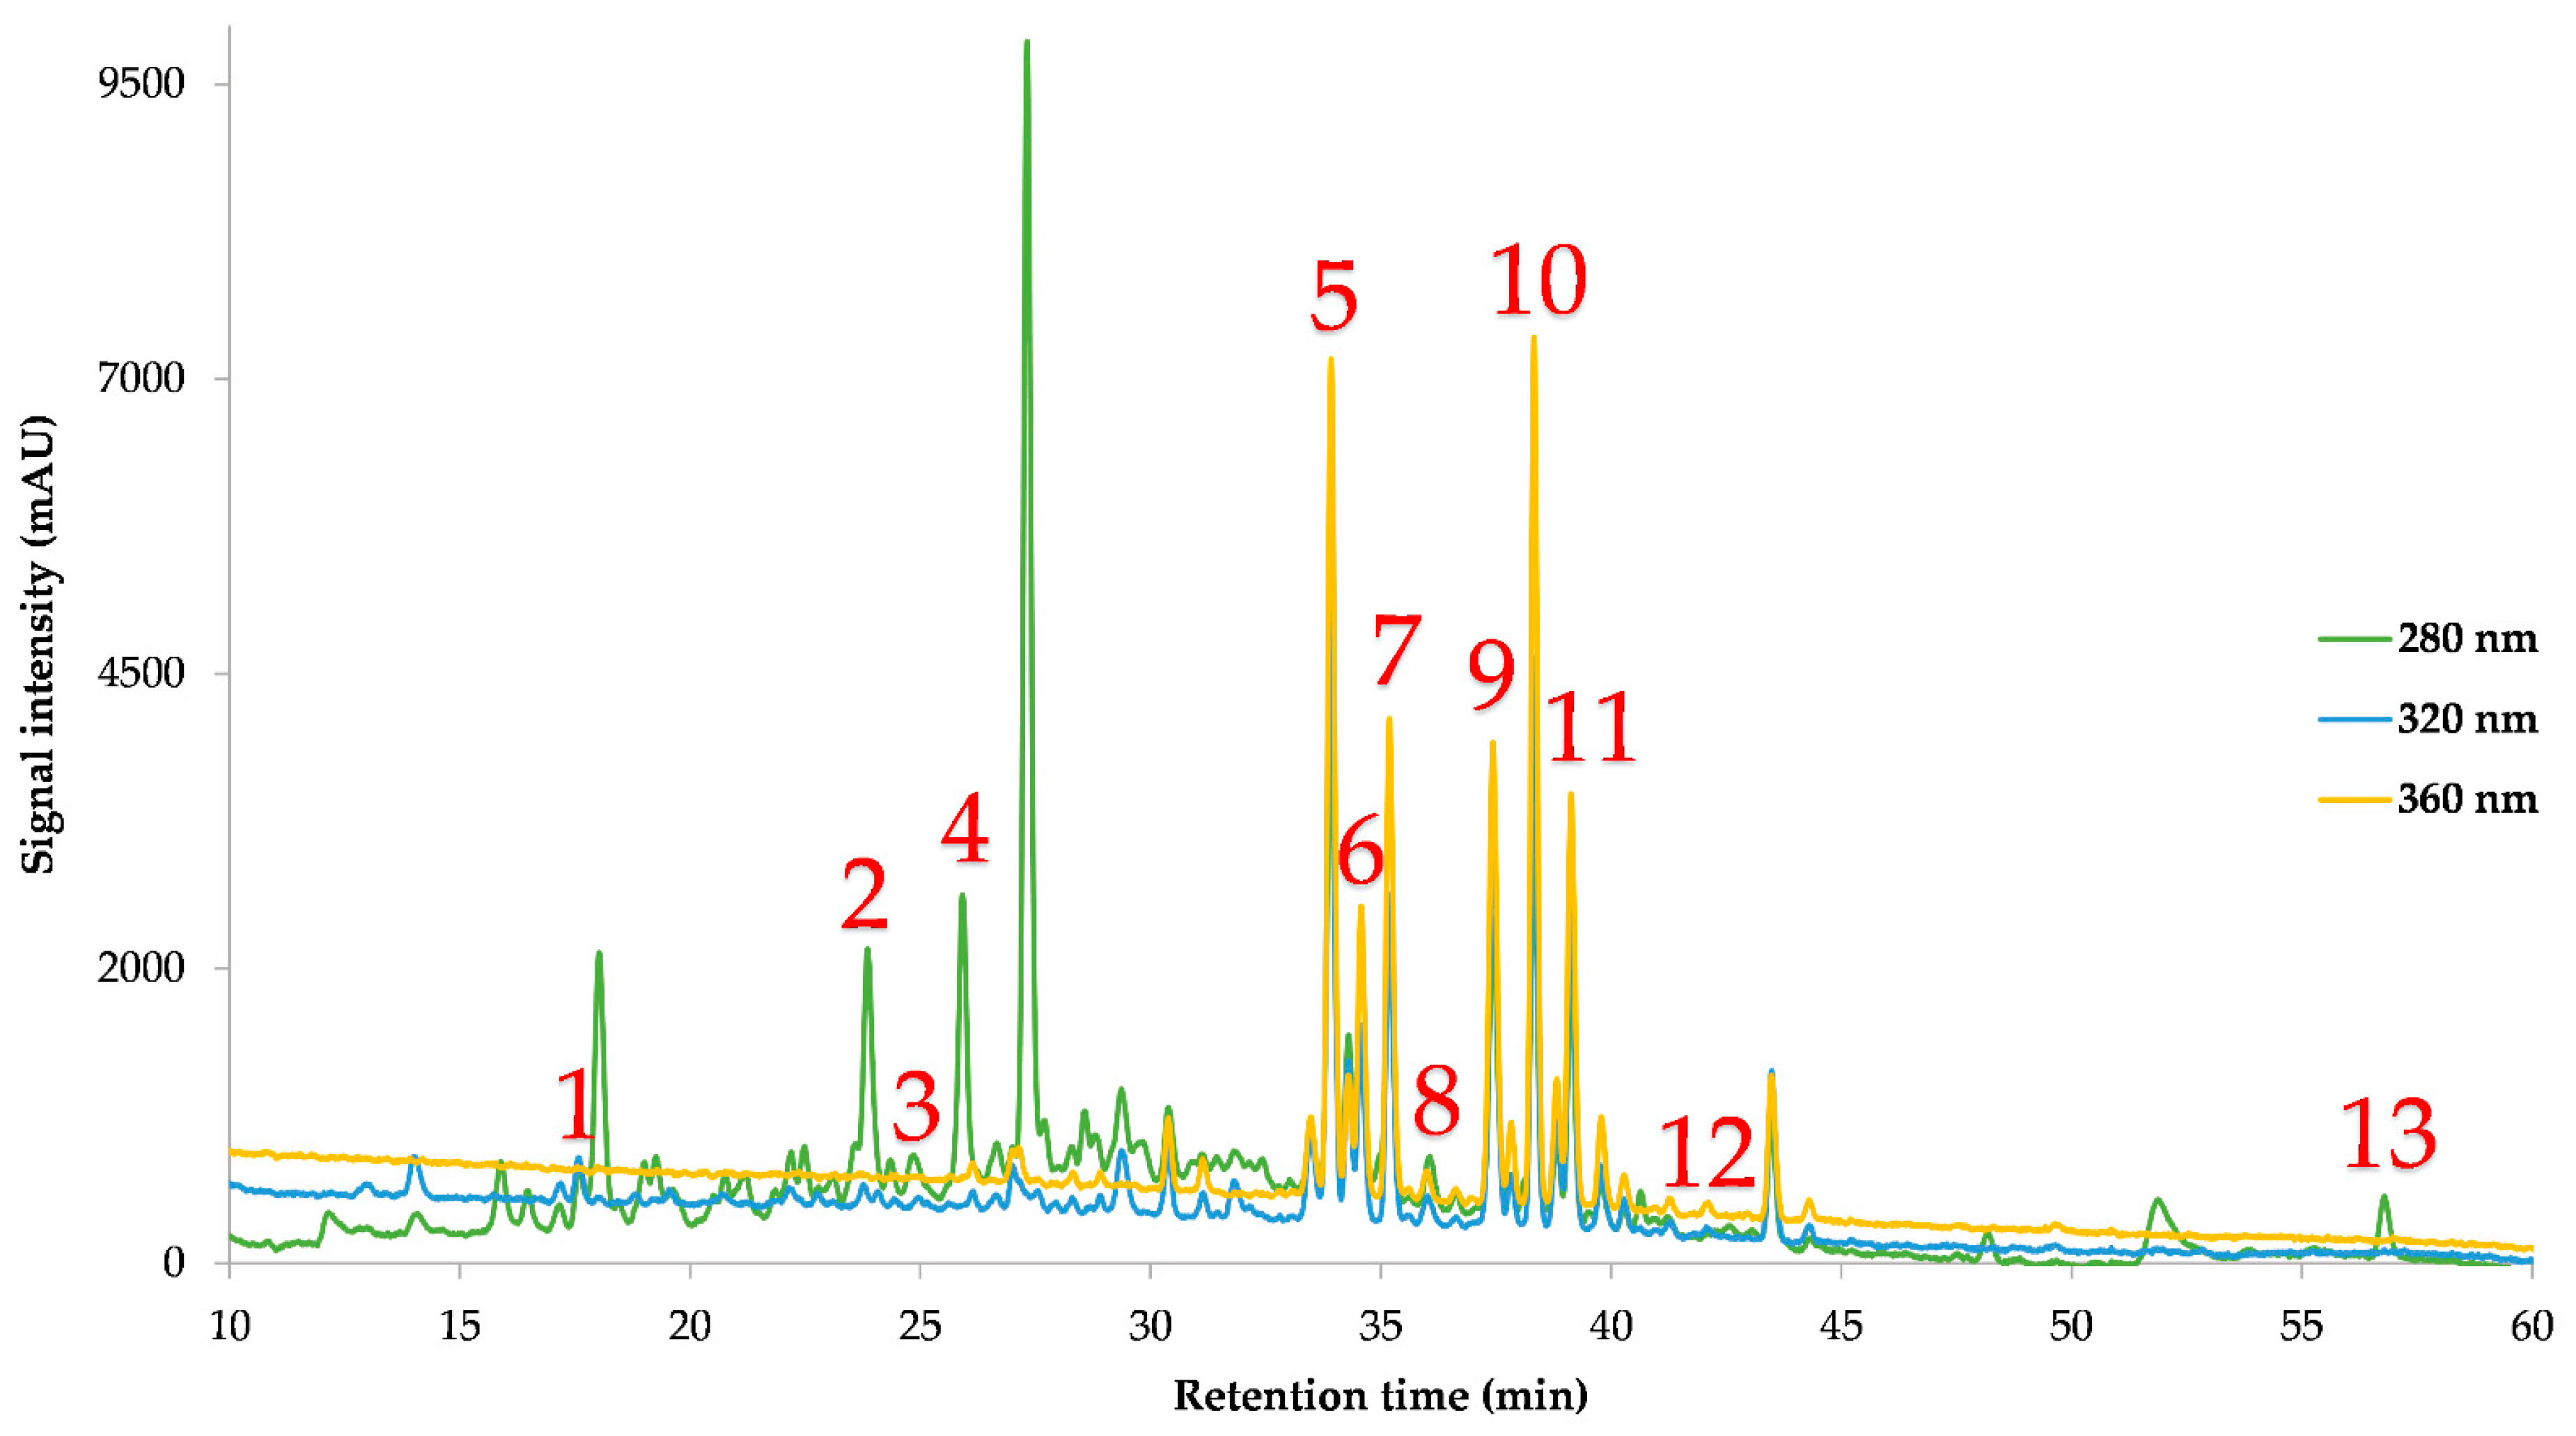
2.6.2. HPLC Quantification of Polyphenolic Compounds

The individual polyphenolic compounds from the laurel extracts were identified and quantified using High-Performance Liquid Chromatography (HPLC), based on our prior research [26]. Information is given in the Supplementary Material.

2.7. Antioxidant Capacity of the Extracts

2.7.1. Ferric-Reducing Antioxidant Power (FRAP) Assay

The ferric-reducing antioxidant power (FRAP) was calculated as μmol of ascorbic acid equivalents (AAE) per gram of dw based on a previous established methodology by Shehata et al. [27]. Information is given in the Supplementary Material.

2.7.2. DPPH Antiradical Activity Assay

The antiradical activity for DPPH (calculated as μmol AAE per gram of dw) was evaluated based on a previously established methodology [27]. Information is given in the Supplementary Material.

2.8. Statistical Analysis

Detailed information about statistical analysis is given in the Supplementary Material.

3. Results and Discussion

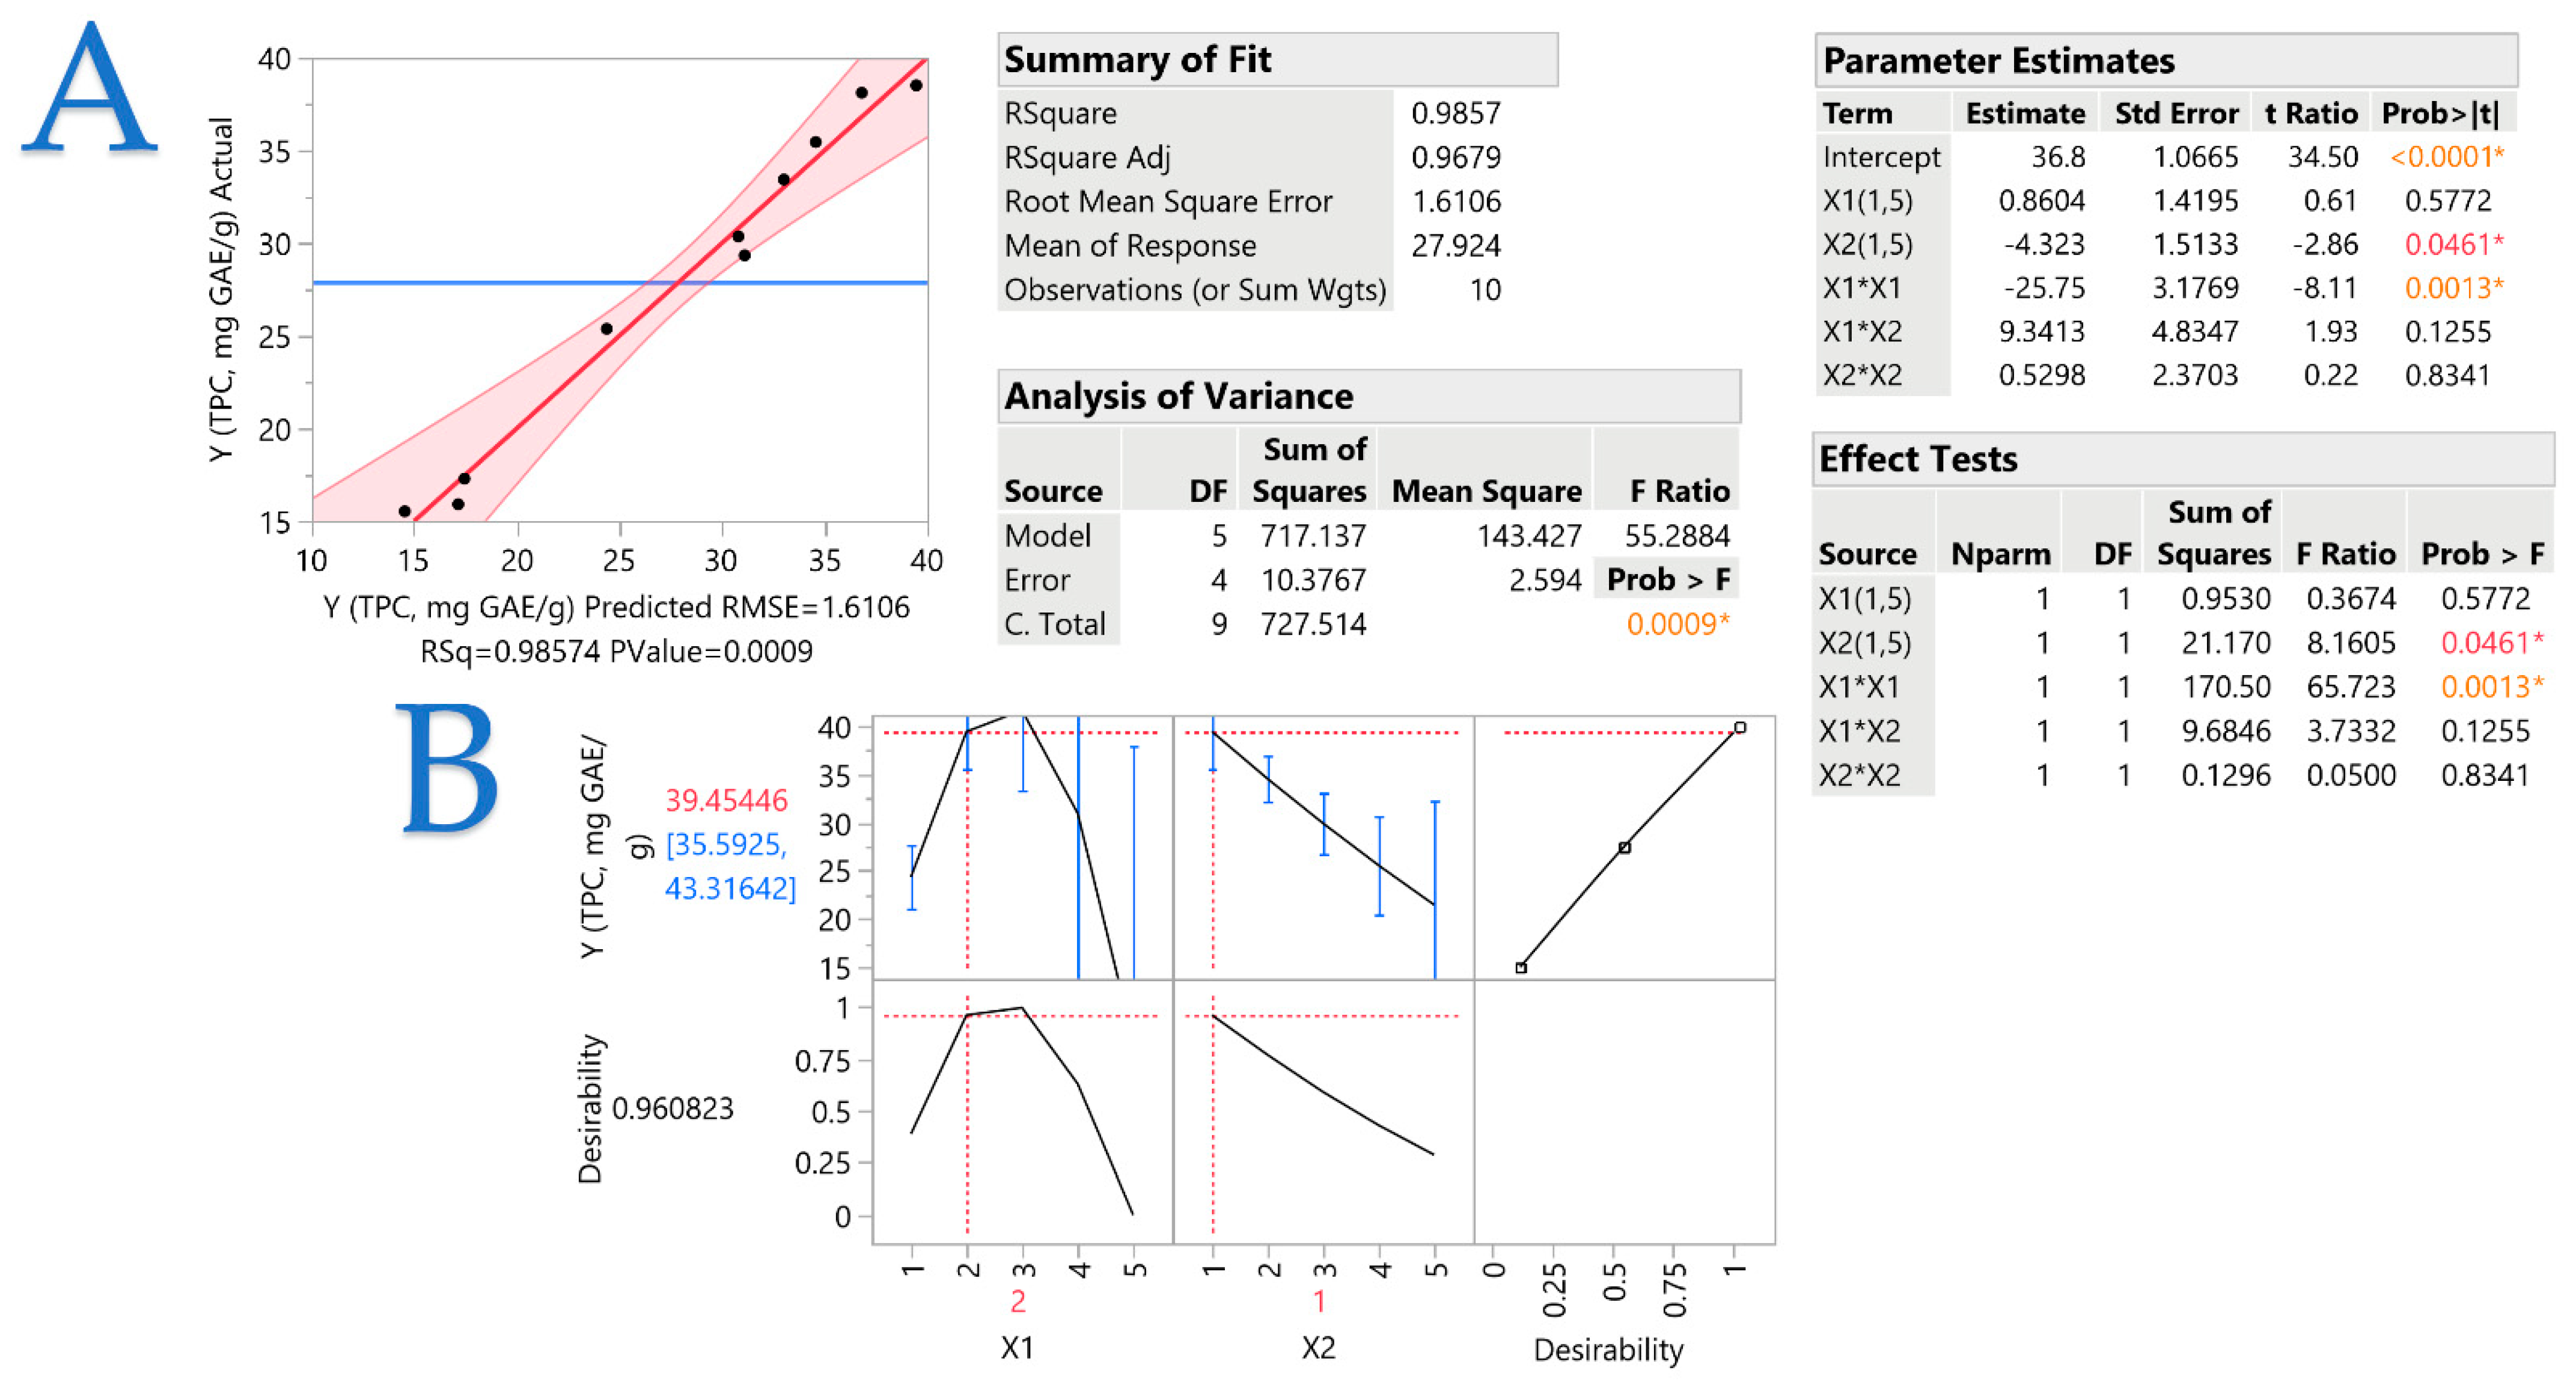
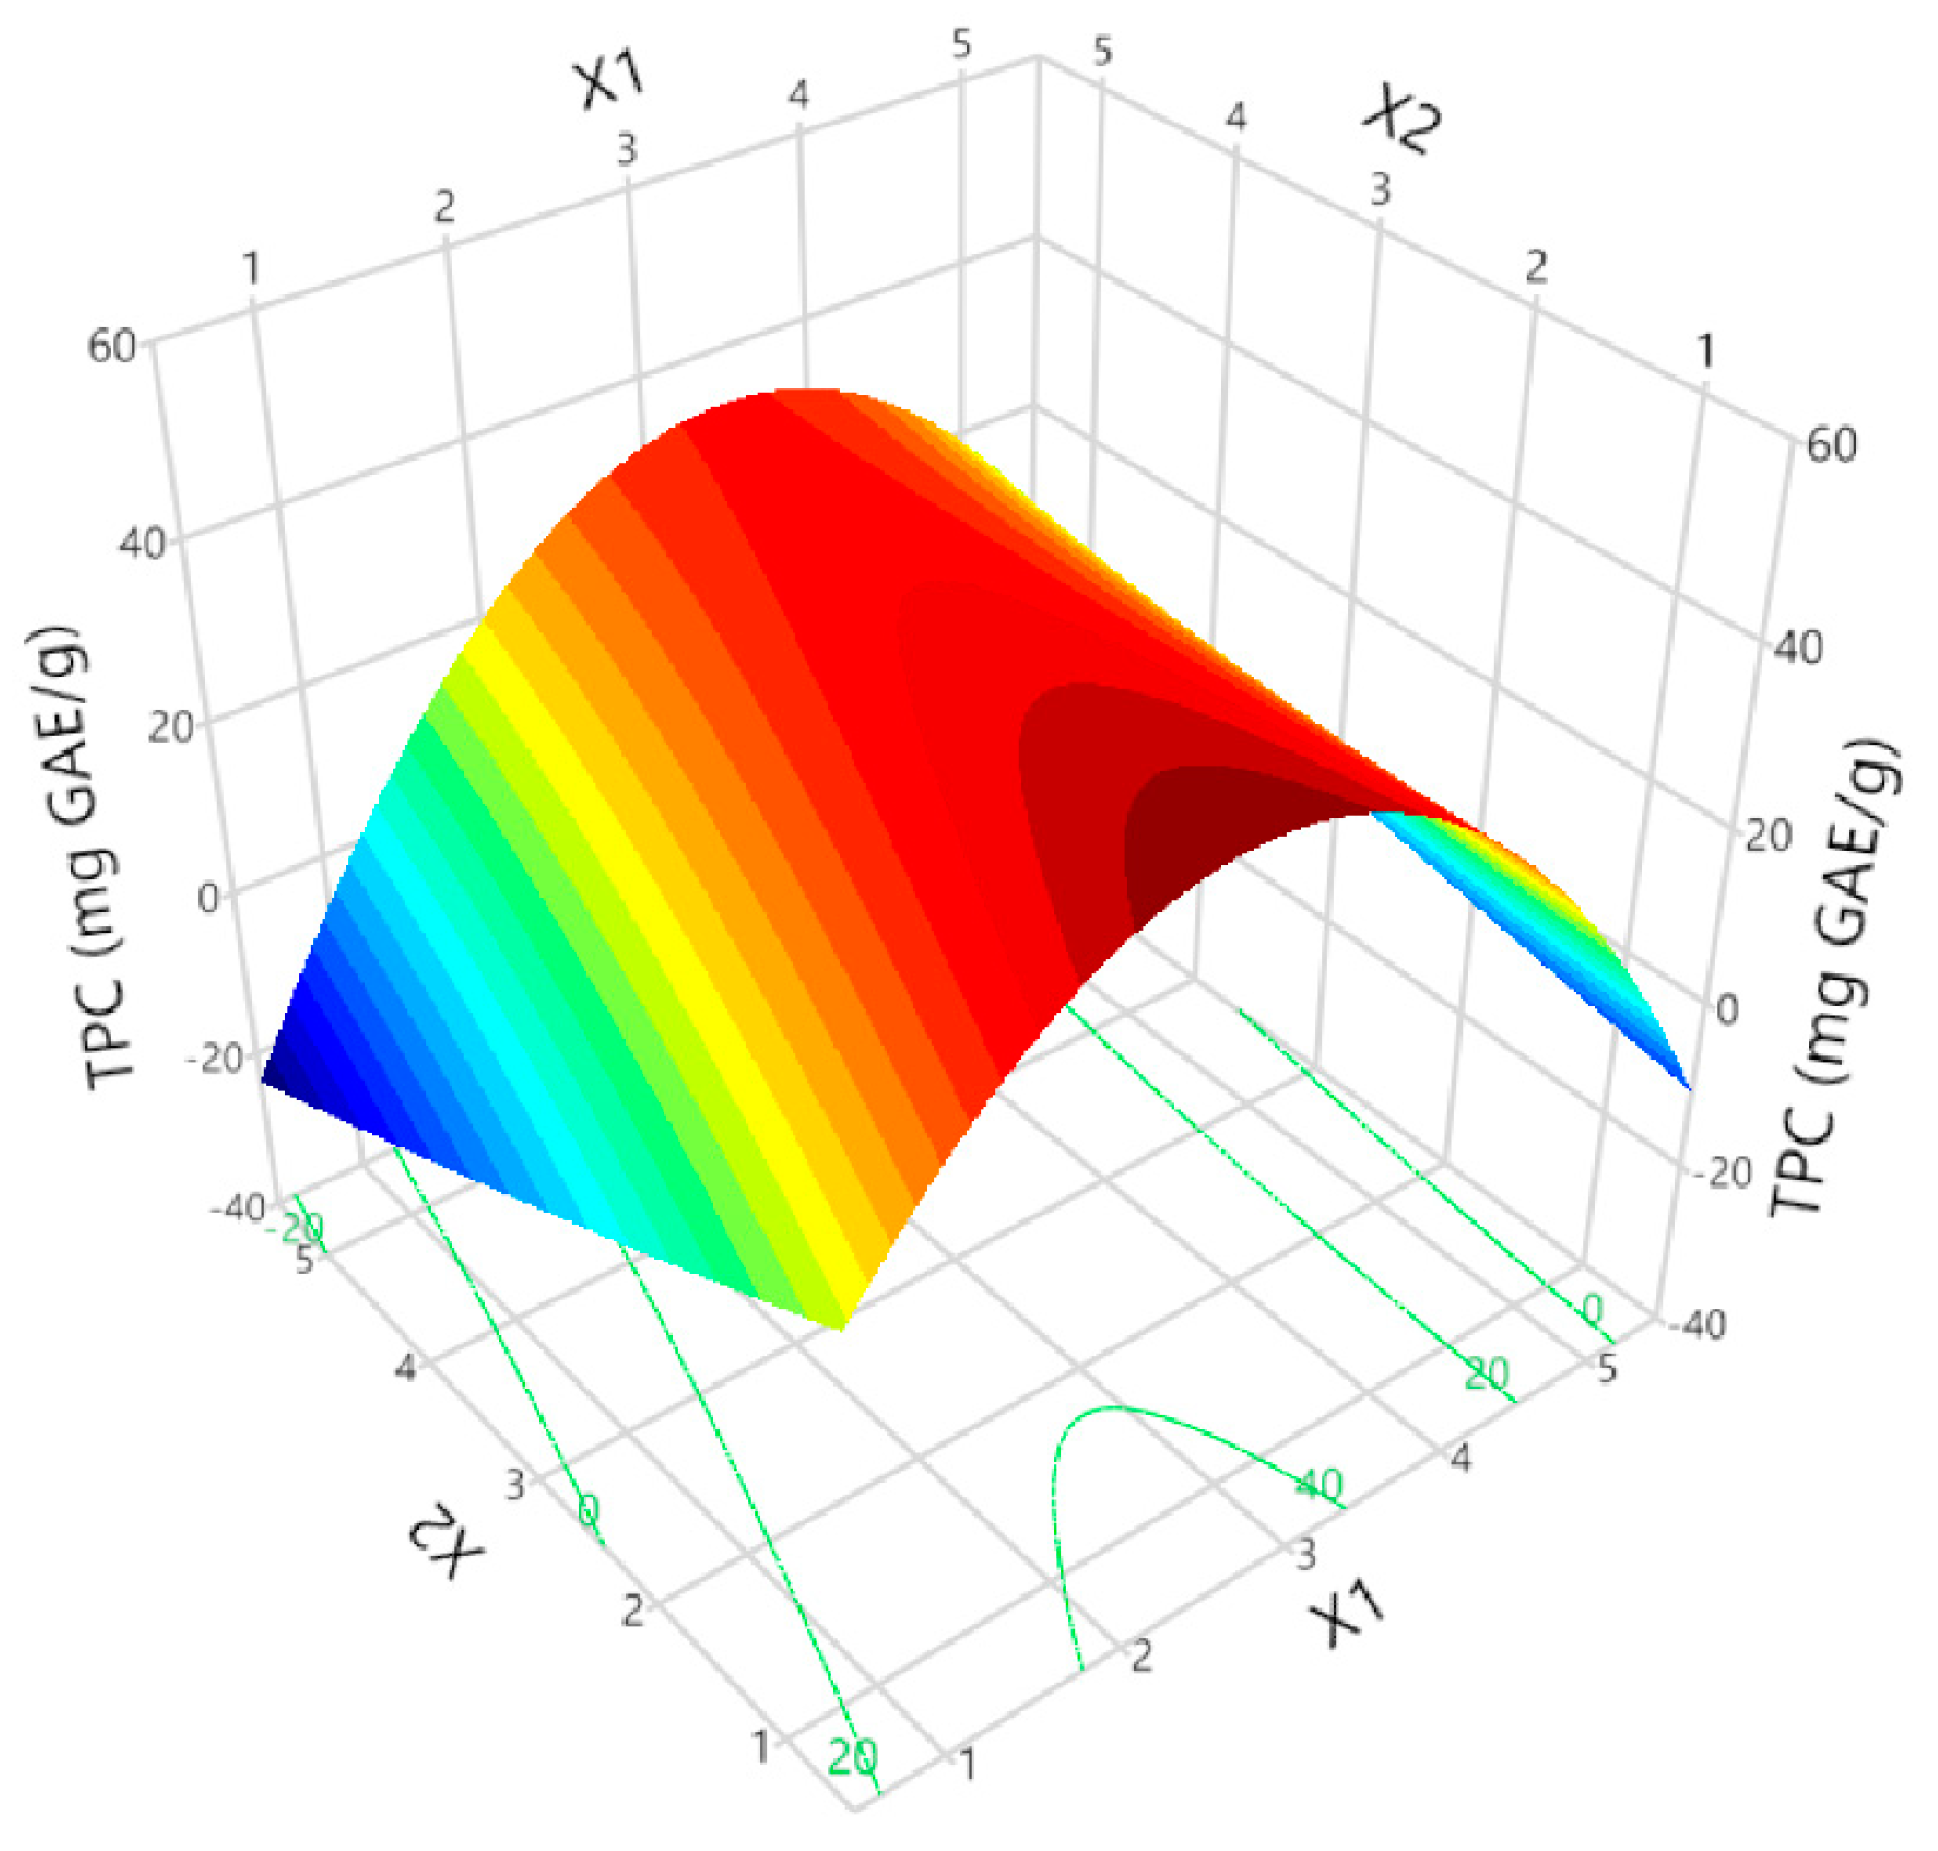
3.1. Determination of the Optimal Solvent and Liquid-to-Solid Ratio

Determining the optimal solvent and liquid-to-solid ratio through a Box–Behnken design was the initial purpose of this study. The Box–Behnken design depends upon three-level incomplete factorial designs. The three-level full factorial design defines the efficiency of an experimental design as the number of coefficients in the estimated model divided by the number of experiments. A comparison of the Box–Behnken designs and the Doehlert matrix, central composite design, and three-level full factorial design revealed that the Box–Behnken designs show greater efficiency than the central composite design [28]. Furthermore, a vast benefit is that it aids the determination of optimal experimental conditions by avoiding extreme treatment combinations. It also allows parameter interaction in a short time, as it significantly decreases the number of experiments [29]. A combination of the two parameters was carried out, as demonstrated in Table 1. Following this, the mixtures underwent PEF treatment for 20 min at 0.8 kV/cm electric field strength, 55 μs of pulse duration, and 550 μs of pulse period. Following centrifugation at 10,000× g, the TPC values were determined in order to obtain the most optimal outcomes. A comparison between the predicted and observed response (i.e., TPC, which was expressed as mg GAE/g dw) in relation to the optimization of the laurel extraction procedure is illustrated in Figure 1. The actual value has a positive correlation with the predicted value (p-value 0.0009 and R2 0.9857), which increases the validity of the specific result, as indicated in plot A. Regarding the desirability function for the optimization of the extraction process (plot B), an increase in TPC was observed in moderate ethanol concentration (25 and 50% v/v). On the other hand, the liquid-to-solid ratio had a more complex correlation with TPC. The highest R values were observed at 20 and 10. To that end, a combination of 25% v/v ethanol and liquid-to-solid ratio of 10 was found to be the most optimal extraction combination, reaching 38.50 mg GAE/g of TPC, a statistically significant value (p < 0.05) among the others. These outcomes were also verified by the three-dimensional graphs in Figure 2, where it can be deduced that the highest TPC value (red area) was obtained between 20 and 30% v/v of ethanol concentration in the X1 variable and at low values of the X2 variable (i.e., 10 mL/g liquid-to-solid ratio). It should also be noted that the X1 variable had greater impact than the X2 variable, as high TPC values were also observed in area between 20 and 30% v/v of ethanol concentration, regardless of liquid-to-solid ratio. The desirability function (with a value of 0.9608) verified the previously described conditions.

3.2. Optimization of PEF Conditions

Several factors affect the effectiveness of other traditional methods, such as the solvent used, the level of agitation, and the temperature [30]. Excessive solvent usage, prolonged processing times, decreased extraction efficiencies, potential degradation of thermolabile bioactive compounds, and the use of harmful chemicals are some of the drawbacks linked with conventional extraction methods [31,32]. Similarly, other green extraction techniques like membrane processes, supercritical fluid extraction, or microwave-assisted extraction demand excessive energy consumption or expensive apparatus [33,34]. Therefore, food products rich in polyphenols are more easily accessible after PEF treatment. In terms of sustainability, extraction procedures including PEF treatment demand less energy consumption than other techniques [35]. The unique short time of a PEF-based extraction technique contributes to energy conservation [36]. After determining the ideal solvent concentration and liquid-to-solid ratios, the next objective was to improve the conditions of the PEF treatment. The parameters that were applied to maximize the efficiency of PEF extraction using the Box–Behnken design are listed in Table 2, including the independent (electric field intensity, X1; pulse duration, X2; pulse period, X3; extraction duration, X4) and coded variables (−1, 0, 1). The various combinations of X1X4 throughout the experimental procedure, as well as the measured and predicted TPC, FRAP, and DPPH values, are detailed in Table 3. The observed TPC values varied between 29.58 and 36.39 mg GAE/g dw, suggesting that in order to obtain the maximum polyphenol recovery, an electric field strength of 0.8 kV/cm may be necessary. The FRAP (462.27–581.47 μmol AAE/g) and DPPH (190.98–230.09 μmol AAE/g dw) values varied significantly. The findings, as presented in Table 3, suggest that in order to induce a significant antioxidant effect in the extracts, an intermediate electric field strength of 0.6 kV/cm is necessary. A pulse period value of 550 μs was optimal in all assays.
The impact of the independent variables (X1X4) on the recovery of the identified bioactive compounds through HPLC-DAD analysis is displayed in Table 4. A wide range of polyphenols including flavonoids and phenolic acids was quantified, revealing a statistically significant (p < 0.05) range among the polyphenol concentrations. The several design points had a cumulated sum of 3.79–14.70 mg/g, with kaempferol 3-O-β-rutinoside (0.03–7.25 mg/g), isorhamnetin 3-glucoside (0–6.83 mg/g), quercetin 3-D-galactoside (0.75–4.31 mg/g), and kaempferol 3-glucoside (0.53–1.59 mg/g) accounting as the major polyphenols. A member of flavonol compounds, isorhamnetin 3-glucoside, can halt oxidative stress and prevent diabetes. The aglycon isorhamnetin can reduce blood pressure, safeguard endothelial cells from oxidized low-density lipoprotein, and lessen the impact of ischemia-reperfusion on ventricular myocytes [37]. Kaempferol, a common flavonol, could be present in different glycosidic forms in plant tissues. Kaempferol 3-rutinoside demonstrates neuroprotective, anti-aging, anti-hepatotoxic, and antioxidative properties, in addition to protecting against multi-infarct dementia and cerebral ischemic injury [38]. Kaempferol 3-glucoside has also several health benefits. Apart from boosting the immune system, it decreases inflammation. Improving cognitive function, lowering the risk of diabetes, and lowering the risk of some cancers are some of the potential benefits [39]. Quercetin 3-D-galactoside has antimicrobial, anti-inflammatory, and antioxidant properties in addition to its potential to prevent hypertension and cardiovascular diseases [40].
To recover the majority of polyphenols, 20 min of extraction was found to be optimal in most cases. In addition, design point 16 effectively recovered most of the polyphenols achieving 11.14 mg/g. On the other hand, design point 1 reached 14.7 mg/g of polyphenols, the highest possible, 76% of which were obtained by quercetin 3-D-galactoside and isorhamnetin 3-glucoside concentrations, equaling total polyphenols measured in design point 16. The polyphenols that were identified and quantified through HPLC-DAD are illustrated in Figure 3 with a representative chromatograph.
Table 5 contains the statistical variables, including coefficients (≥0.95) and second-order polynomial equations (models), which indicate an acceptable fit for the models. The relationship between the predicted and actual response for each investigated parameter, along with the corresponding desirability functions, are illustrated in Figures S1–S3 plots. In plot A, high R2 coefficients (≥0.95) mean that experimental values were close to the predicted, whereas the desirability functions shed light on the impact of each PEF parameter in the assays in B plots. For instance, low electric field strength (0.6 kV/cm) was required for extracts with high antioxidant capacity in the FRAP assay. The response graphs in three dimensions for the TPC, FRAP, and DPPH variables are presented in Figures S4–S6. They illustrate how the combination of the PEF variables affect the outcome of each assay, with the red color being the most optimum. Figure S7 shows a bivariate analysis of TPC, FRAP, and DPPH assays by each model estimate. The model equations have a high correlation with the predicted values, with 0.8985, 0.973, and 0.9889 for TPC, FRAP, and DPPH assays, respectively. The p-value of each model is <0.0001, which means there is no significant difference among the variables. The R2 values are 0.8073, 0.9466, and 0.9779 for TPC, FRAP, and DPPH assays, respectively, which indicates no large random errors in the model.

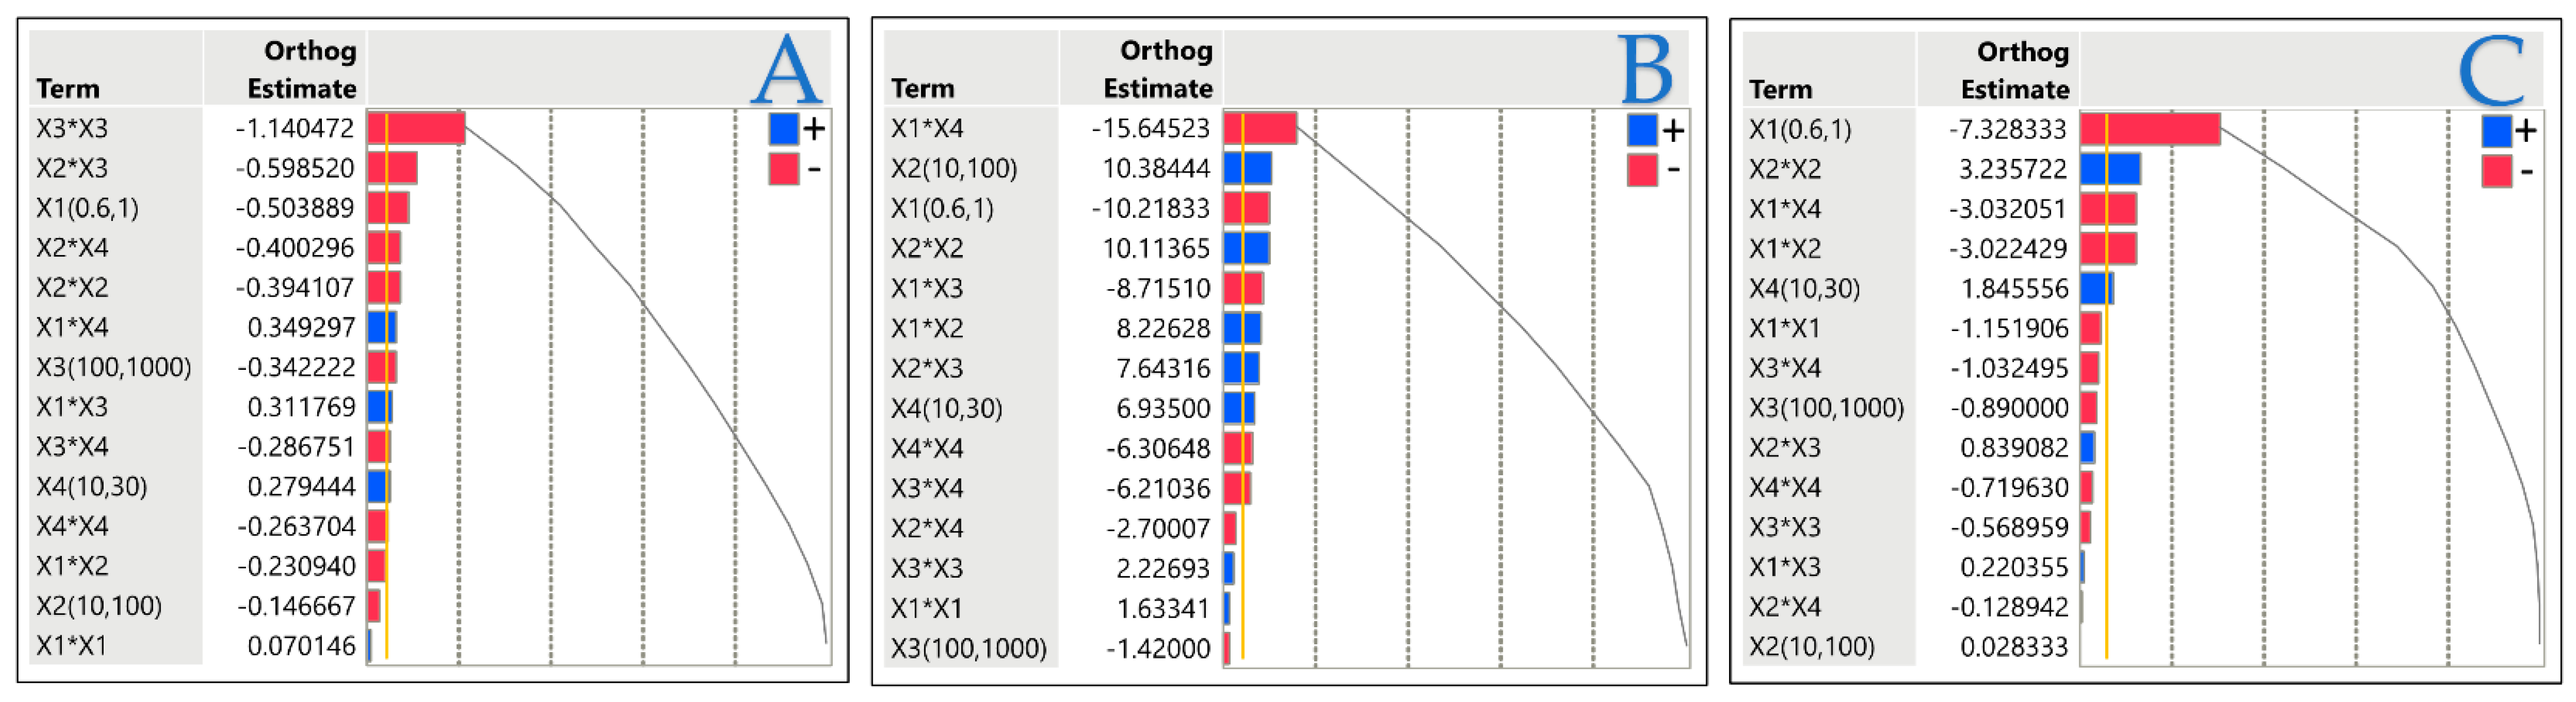
3.3. Impact of Extraction Parameters to Assays through Pareto Plot Analysis

A standardized Pareto plot was used to evaluate the main effects and their interactions based on statistical significance (p < 0.05). The independent variables (electric field intensity, X1; pulse duration, X2; pulse period, X3; extraction duration, X4) and their interactions that affected TPC, and FRAP and DPPH antioxidant activity are displayed in Figure 4. It also displays the orthogonal coded estimates, which are derived from the transformation that orthogonalizes the estimates. Regarding the effects of extraction parameters through the Pareto plot, it could be concluded that X1, X2, and X3 had a negative impact on TPC. The highest negative contribution was achieved with a X32 combination, indicating that polyphenol recovery was sensitive to pulse period changes. However, it should be noted that the X1 variable had a vast negative contribution to the DPPH assay. This could be a subject of high electric field strength decomposing antioxidant compounds. A similar trend was observed in the study by Zhang et al. [41] who revealed that DPPH radical scavenging was positively correlated with increased electric field strength until it reached a plateau. After a certain value of electric field strength, the scavenging activity was decreased.

3.4. Optimal Extraction Conditions

Conventional extraction techniques present a number of challenges, such as prolonged processing times, decreased efficacy in extracting bioactive compounds, huge solvent consumption, dangerous solvents, and potential deterioration of thermolabile bioactive compounds [31]. Considerable advances have been achieved in recent years with regard to the development of extraction methods that reduce the reliance on dangerous solvents, secure human health, and use less energy [42]. PEF acts as a treatment that uses brief electrical power pulses to electroporate cell membranes non-thermally across a range of electric field strengths and make bioactive compounds extraction easier. The compounds of interest in plant-based foods are then transferred to the extraction solvent [43]. Conductivity, polarity, and solubility parameters are of high importance, should PEF be used as an extraction technique [44]. The impact of these parameters on extraction can be attributed to a multitude of factors. These include variations in solvation strength, solubility restrictions, and the incapability of the solvent to penetrate and disrupt the cell [45]. Water is a highly ecological and cost-effective solvent. The extraction of polar compounds is greatly enhanced by this solvent. Nevertheless, in order to isolate molecules with lower polarity, it is possible to employ organic solvents such as ethanol or methanol to dissolve bioactive compounds more efficiently compared to water [46]. Taking into consideration their food-grade potential, water and ethanol mixtures serve as an ideal combination that yields more efficiency than other binary solvents [47].
To identify the highest anticipated values for TPC and antioxidant assays (FRAP and DPPH), the desirability function was used. The highest values of the assays were accomplished through different PEF conditions. In the quantification of maximized TPC value from laurel leaves at a predicted value of 36.17 mg GAE/g dw, a 15-min extraction was required with 0.6 kV/cm of electric field strength, 75 μs of pulse duration, and 415 μs of pulse period. A comparable study by Generalić Mekinić et al. [48] involved the measurement of TPC in laurel leaves extracts. They used a conventional solid-liquid extraction with 80% ethanol as a solvent for 60 min at 60 °C through a 50:1 liquid-to-solid ratio. The higher TPC content (148.3 mg GAE/g leaves) could be a matter of different cultivars. What should be highlighted are the extraction conditions, where it appears that our approach is faster, less energy-consuming, and non-thermal, making the process more sustainable. The same electric field strength was necessitated for the maximum predicted response for antioxidant assays FRAP and DPPH. Further information about optimal extraction conditions is shown in Table 6.

3.5. Kinetic Modelling of Optimal Extract

The values of TPC, FRAP, and DPPH assays against time from the optimal extract along with the kinetic model evaluation were investigated. Figure S8 shows the time course of TPC, FRAP, and DPPH assays during extraction. The results revealed acceptable R2 values, which were measured to be ~0.96 on average for all assays. It should be noted that the values reached a plateau beyond 30 min in all assays. To that end, the examined time did not exceed that time in the investigation of kinetics. The first-order kinetic model (Figure S9) was applied to the experimental data of the extraction kinetics by plotting ln(Cs/(CsCt)) against t. The slope and the intercept of the plot were used to calculate the first-order rate constant (k) and R2. The plot indicates that the extraction of TPC, FRAP, and DPPH assays from laurel leaves using PEF, under the optimal PEF conditions (X1: 0.6, X2: 55, X3: 355), follows a linear form of the first-order model. The k-values obtained were 0.1107 min−1, 0.1161 min−1, and 0.1384 min−1 for TPC, FRAP, and DPPH assays, respectively. The R2 values of the extraction kinetics models were 0.9794, 0.9882, and 0.9822 for TPC, FRAP, and DPPH assays, respectively. The moderate correlation was also demonstrated by the root mean square error (RMSE) index, which had a range of 0.1779–0.2618, with the DPPH assay having the highest value. This moderate correlation was also revealed through the experimental and predicted values of the assays under examination and could be verified further in Figure S9. The values of ln(Cs/(CsCt)) against time (30 min) in TPC (1.45), FRAP (1.36), and DPPH (1.29) assays had a ~6–30% difference from the predicted values from the first-order kinetics.
To evaluate the suitability of the second-order kinetic model (Figure S10) for describing the extraction kinetics of TPC, FRAP, and DPPH assays from laurel leaves by PEF, the plots of t/Ct versus t were constructed and the second-order rate constant (k) and coefficient of determination (R2) were calculated. The k-values were 0.0073 g/(mg min), 0.0136 g/(mg min), and 0.0324 g/(mg min) for TPC, FRAP, and DPPH assays, respectively. The R2 values were 0.9949, 0.9967, and 0.9941 for TPC, FRAP, and DPPH assays, respectively. Regarding second-order kinetics, it appeared that R2 were greater than their corresponding values in first-order kinetics (>0.99), indicating an ideal fit of the model to the experimental data. The corresponding experimental and predicted values in TPC (0.3722), FRAP (0.0236), and DPPH (0.0603) showed insignificant differences (<5%) between them. Similarly, the considerably lower value of the RMSE by about ten-fold revealed that the extraction process probably fit second-order kinetics.

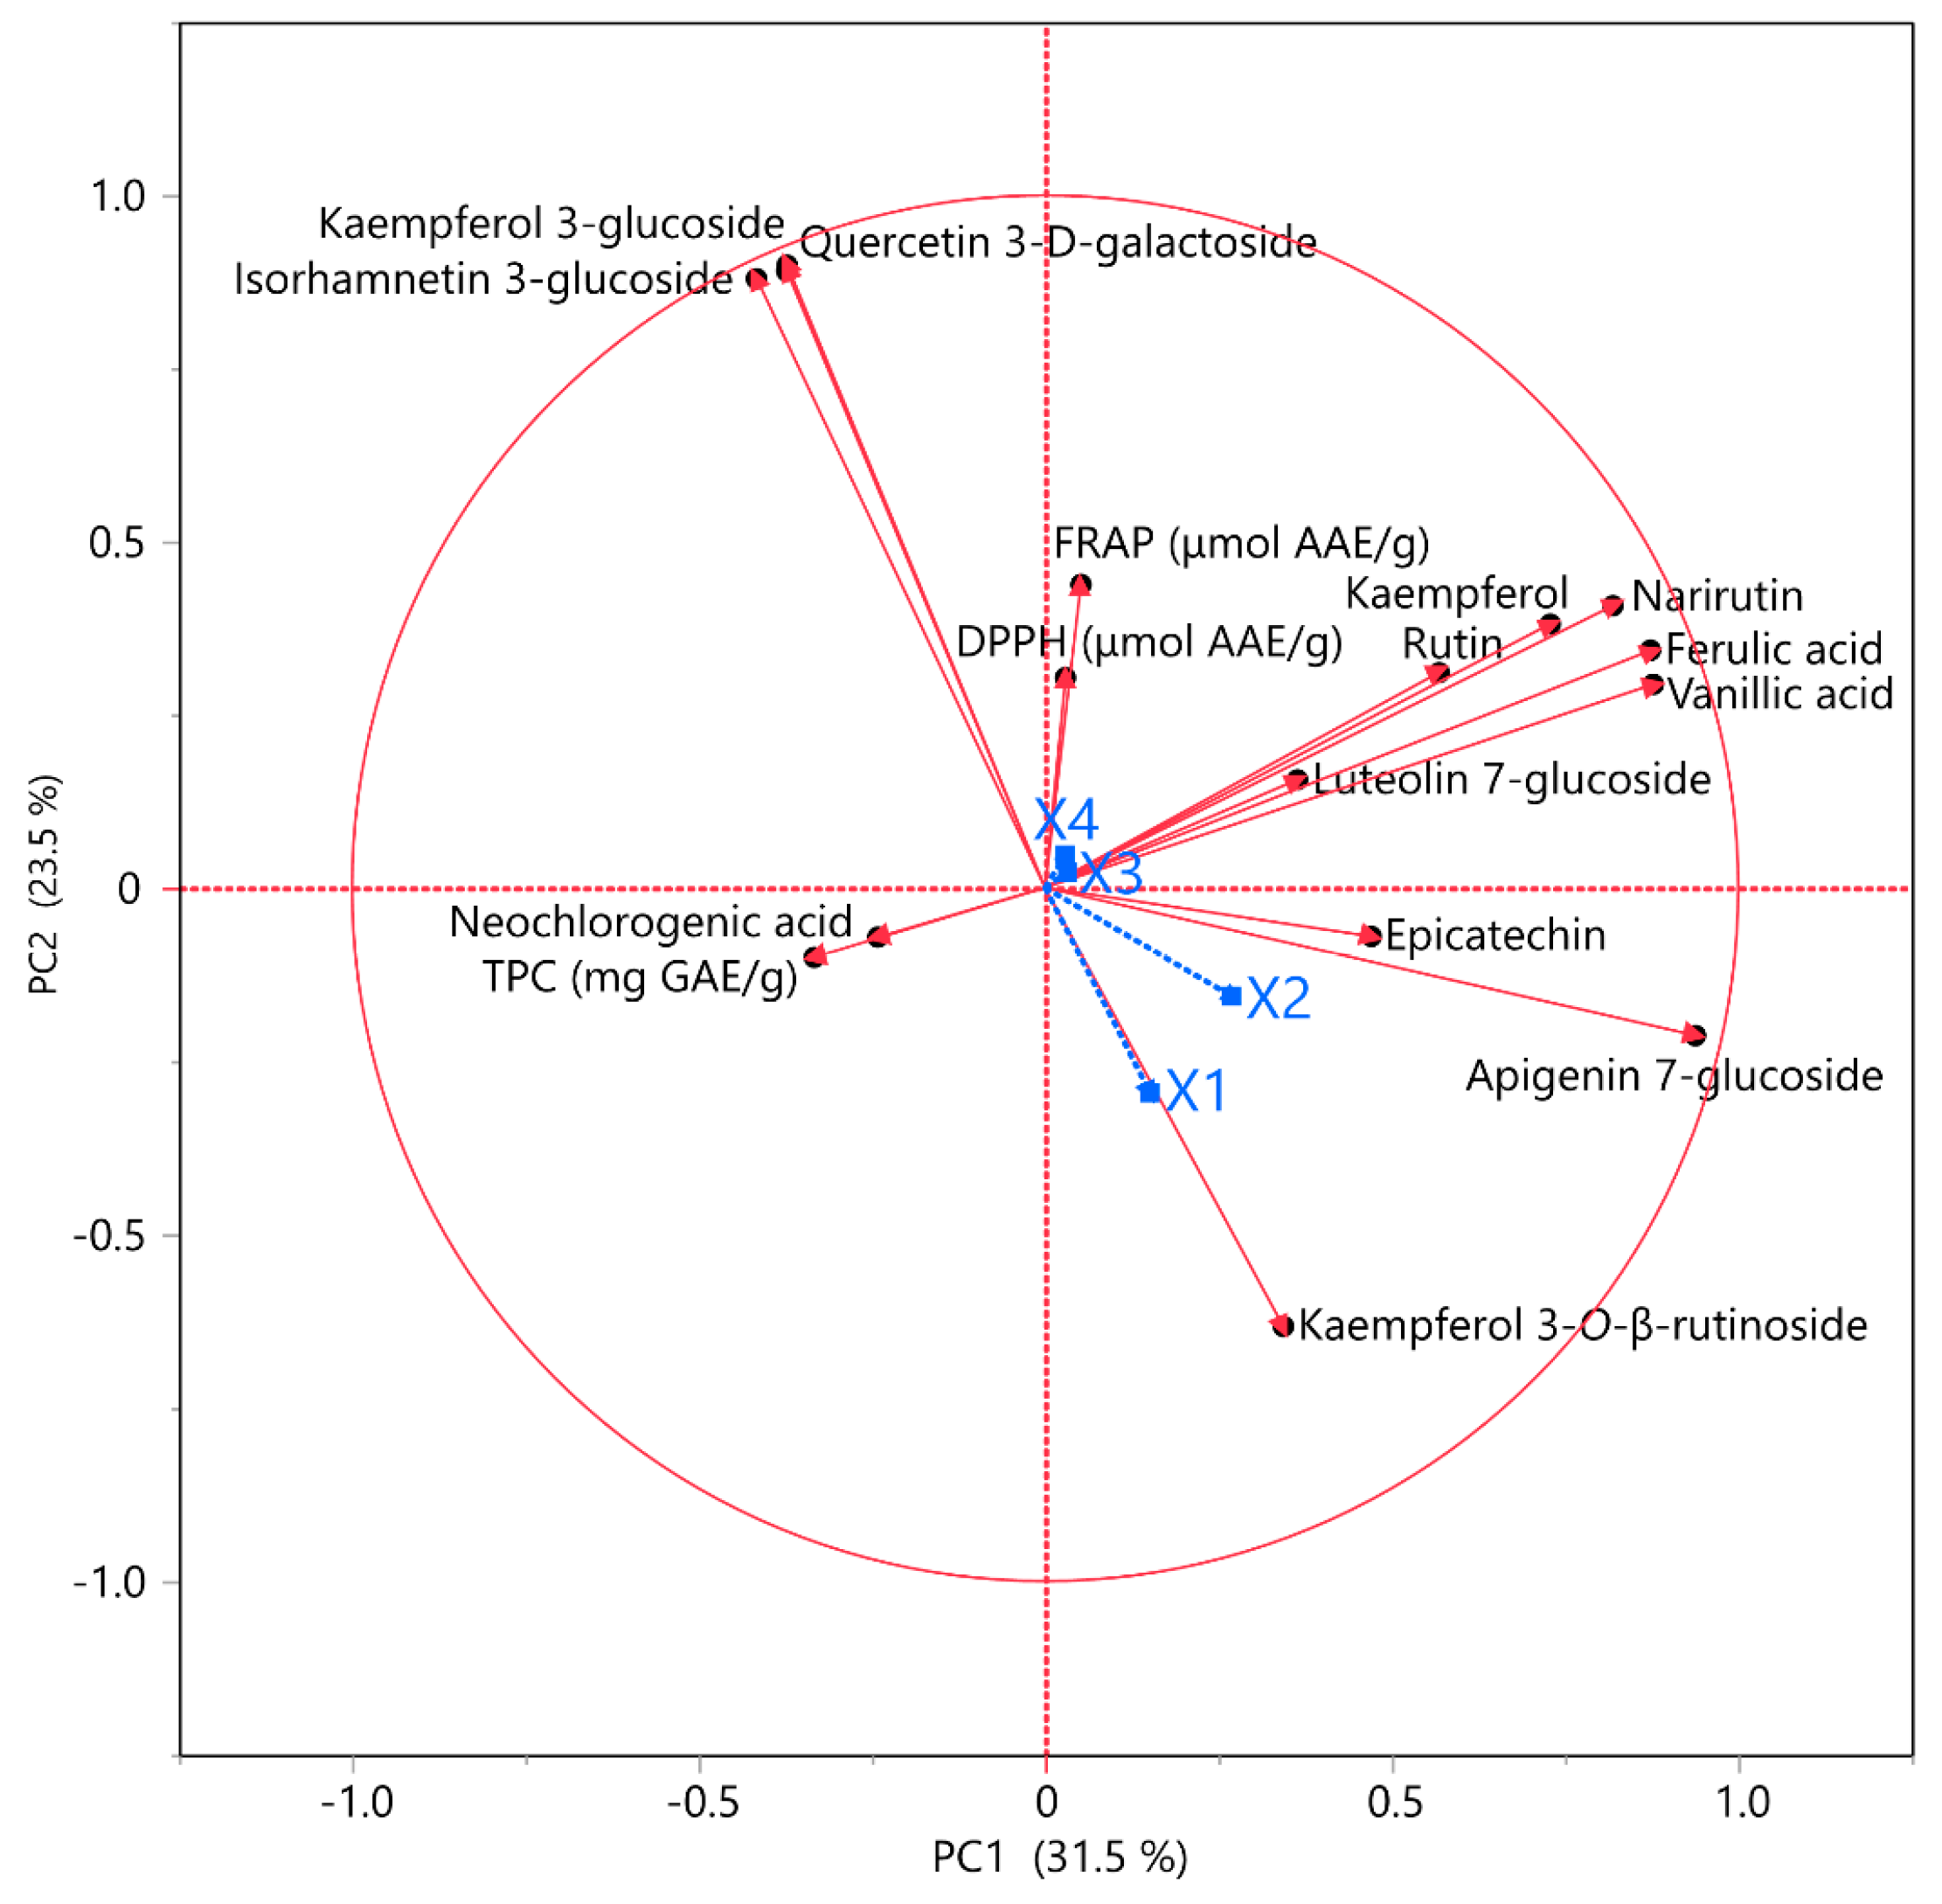
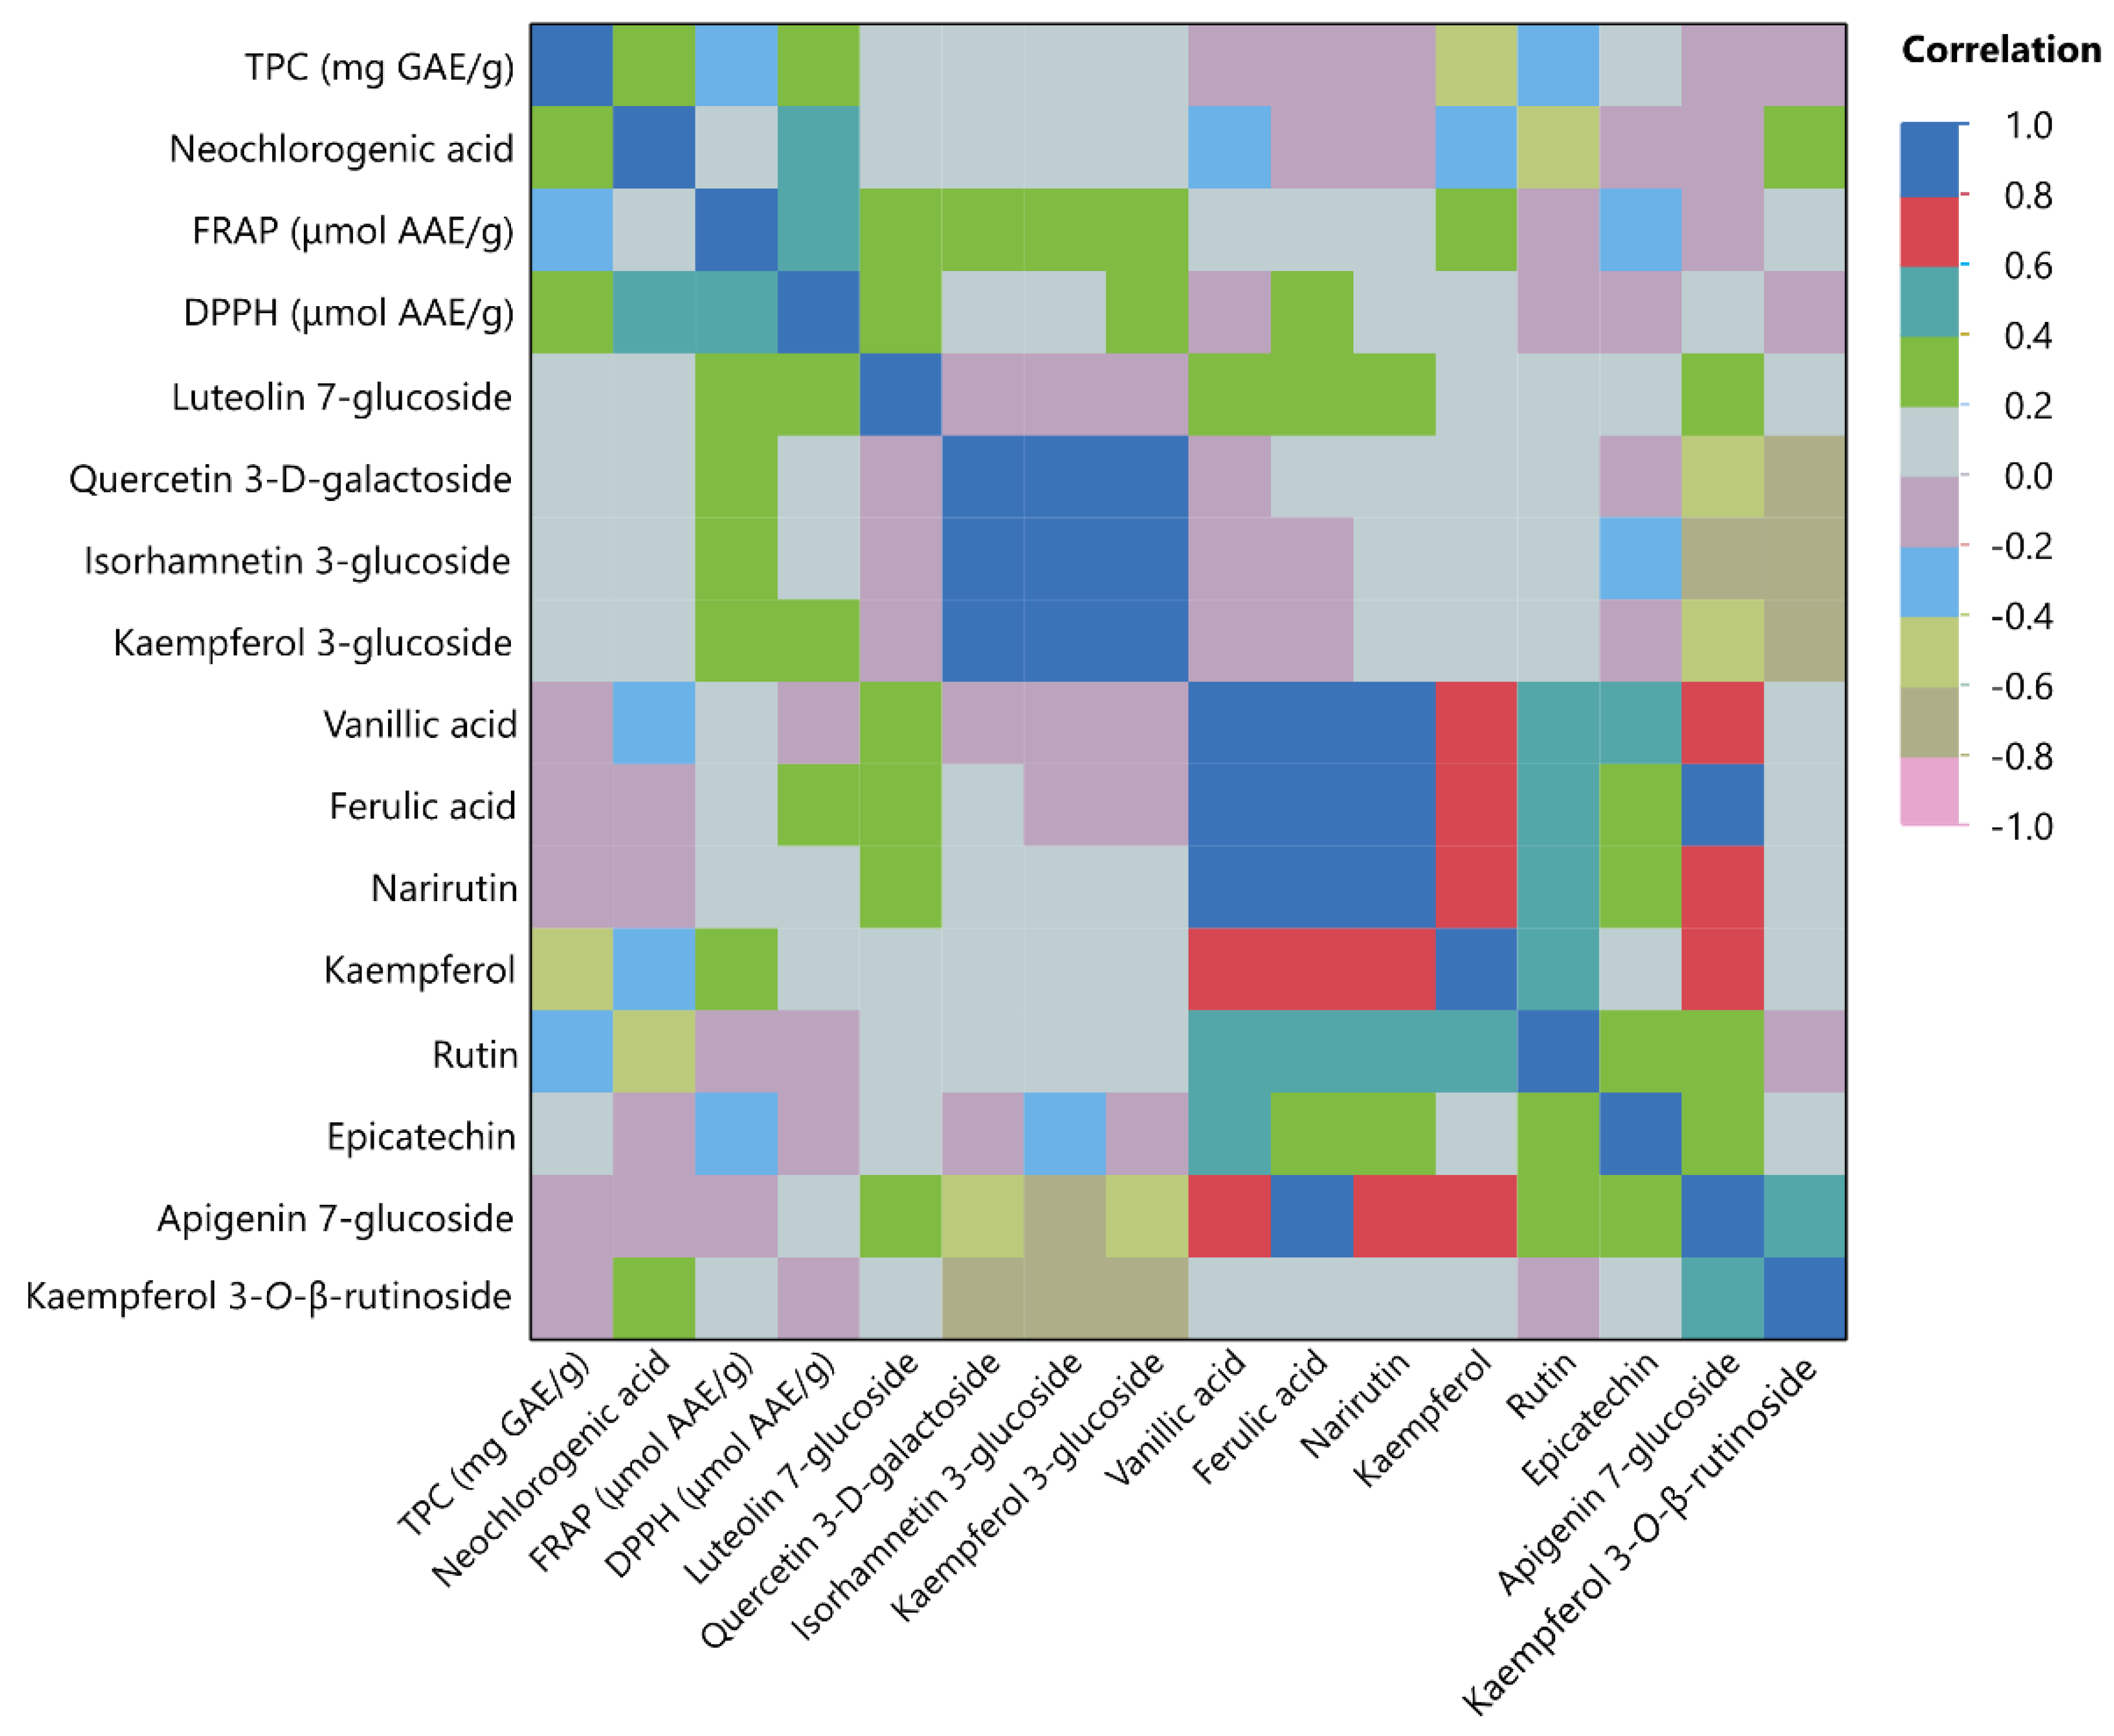
3.6. Principal Component Analysis (PCA) and Multivariate Correlation Analysis (MCA)

In order to extract additional information from variables and conduct a more thorough analysis of the data, PCA was employed, the results of which are illustrated in Figure 5. The aim of the investigation was to identify whether a correlation between TPC, FRAP, and DPPH with individual polyphenols was observed. The graph explained the 55% of the variance. The contribution of independent variables was also considered important to the analysis. It was observed that three polyphenols (i.e., narirutin, ferulic acid, and vanillic acid) were positioned in proximity to each other on the graph. Their high measured concentration in design point 16 would be a possible explanation, meaning these polyphenols were affected by the same PEF parameters. On the other hand, kaempferol 3-galactoside, isorhamnetin 3-glucoside, and quercetin 3-D-galactoside were discriminated from the other polyphenols and were positioned together, as they were found on their maximum concentration in design point 1. The same rationale was also underlying with neochlorogenic acid. There is a negative correlation with ferulic acid and narirutin and a positive correlation with TPC. However, it is of great interest that variable X4 positioned close to antioxidant assays parameters, indicating a positive correlation with them, compared to variable X1 (vide infra).
The MCA diagram provides further insight into the correlation among variables. An important advantage of this approach, as opposed to the previous correlation analysis, is its capacity to measure the extent of negative or positive correlation among the investigated variables. The color scale used indicates correlation values from −1 to 1, as elucidated in the following caption. The results of this analysis are shown in Figure 6. A strong positive correlation (<0.6) was observed with vanillic acid and ferulic acid, narirutin, kaempferol, and apigenin 7-glucoside. The most possible explanation lies in the polarity of these polyphenols and the distribution coefficient with the extraction solvent used (i.e., 25% v/v ethanol). A similar rationale could lie behind the strong negative correlation (>0.6) of kaempferol 3-O-rutinoside with isorhamnetin 3-glucoside and kaempferol 3-glucoside. An interesting outcome was the correlation between the TPC and FRAP assay, which was rather insignificant but negative as well. A possible explanation would be that PEF treatment led to several extracted polyphenols that had different antioxidant capacities, an effect that has also been reported elsewhere [49].

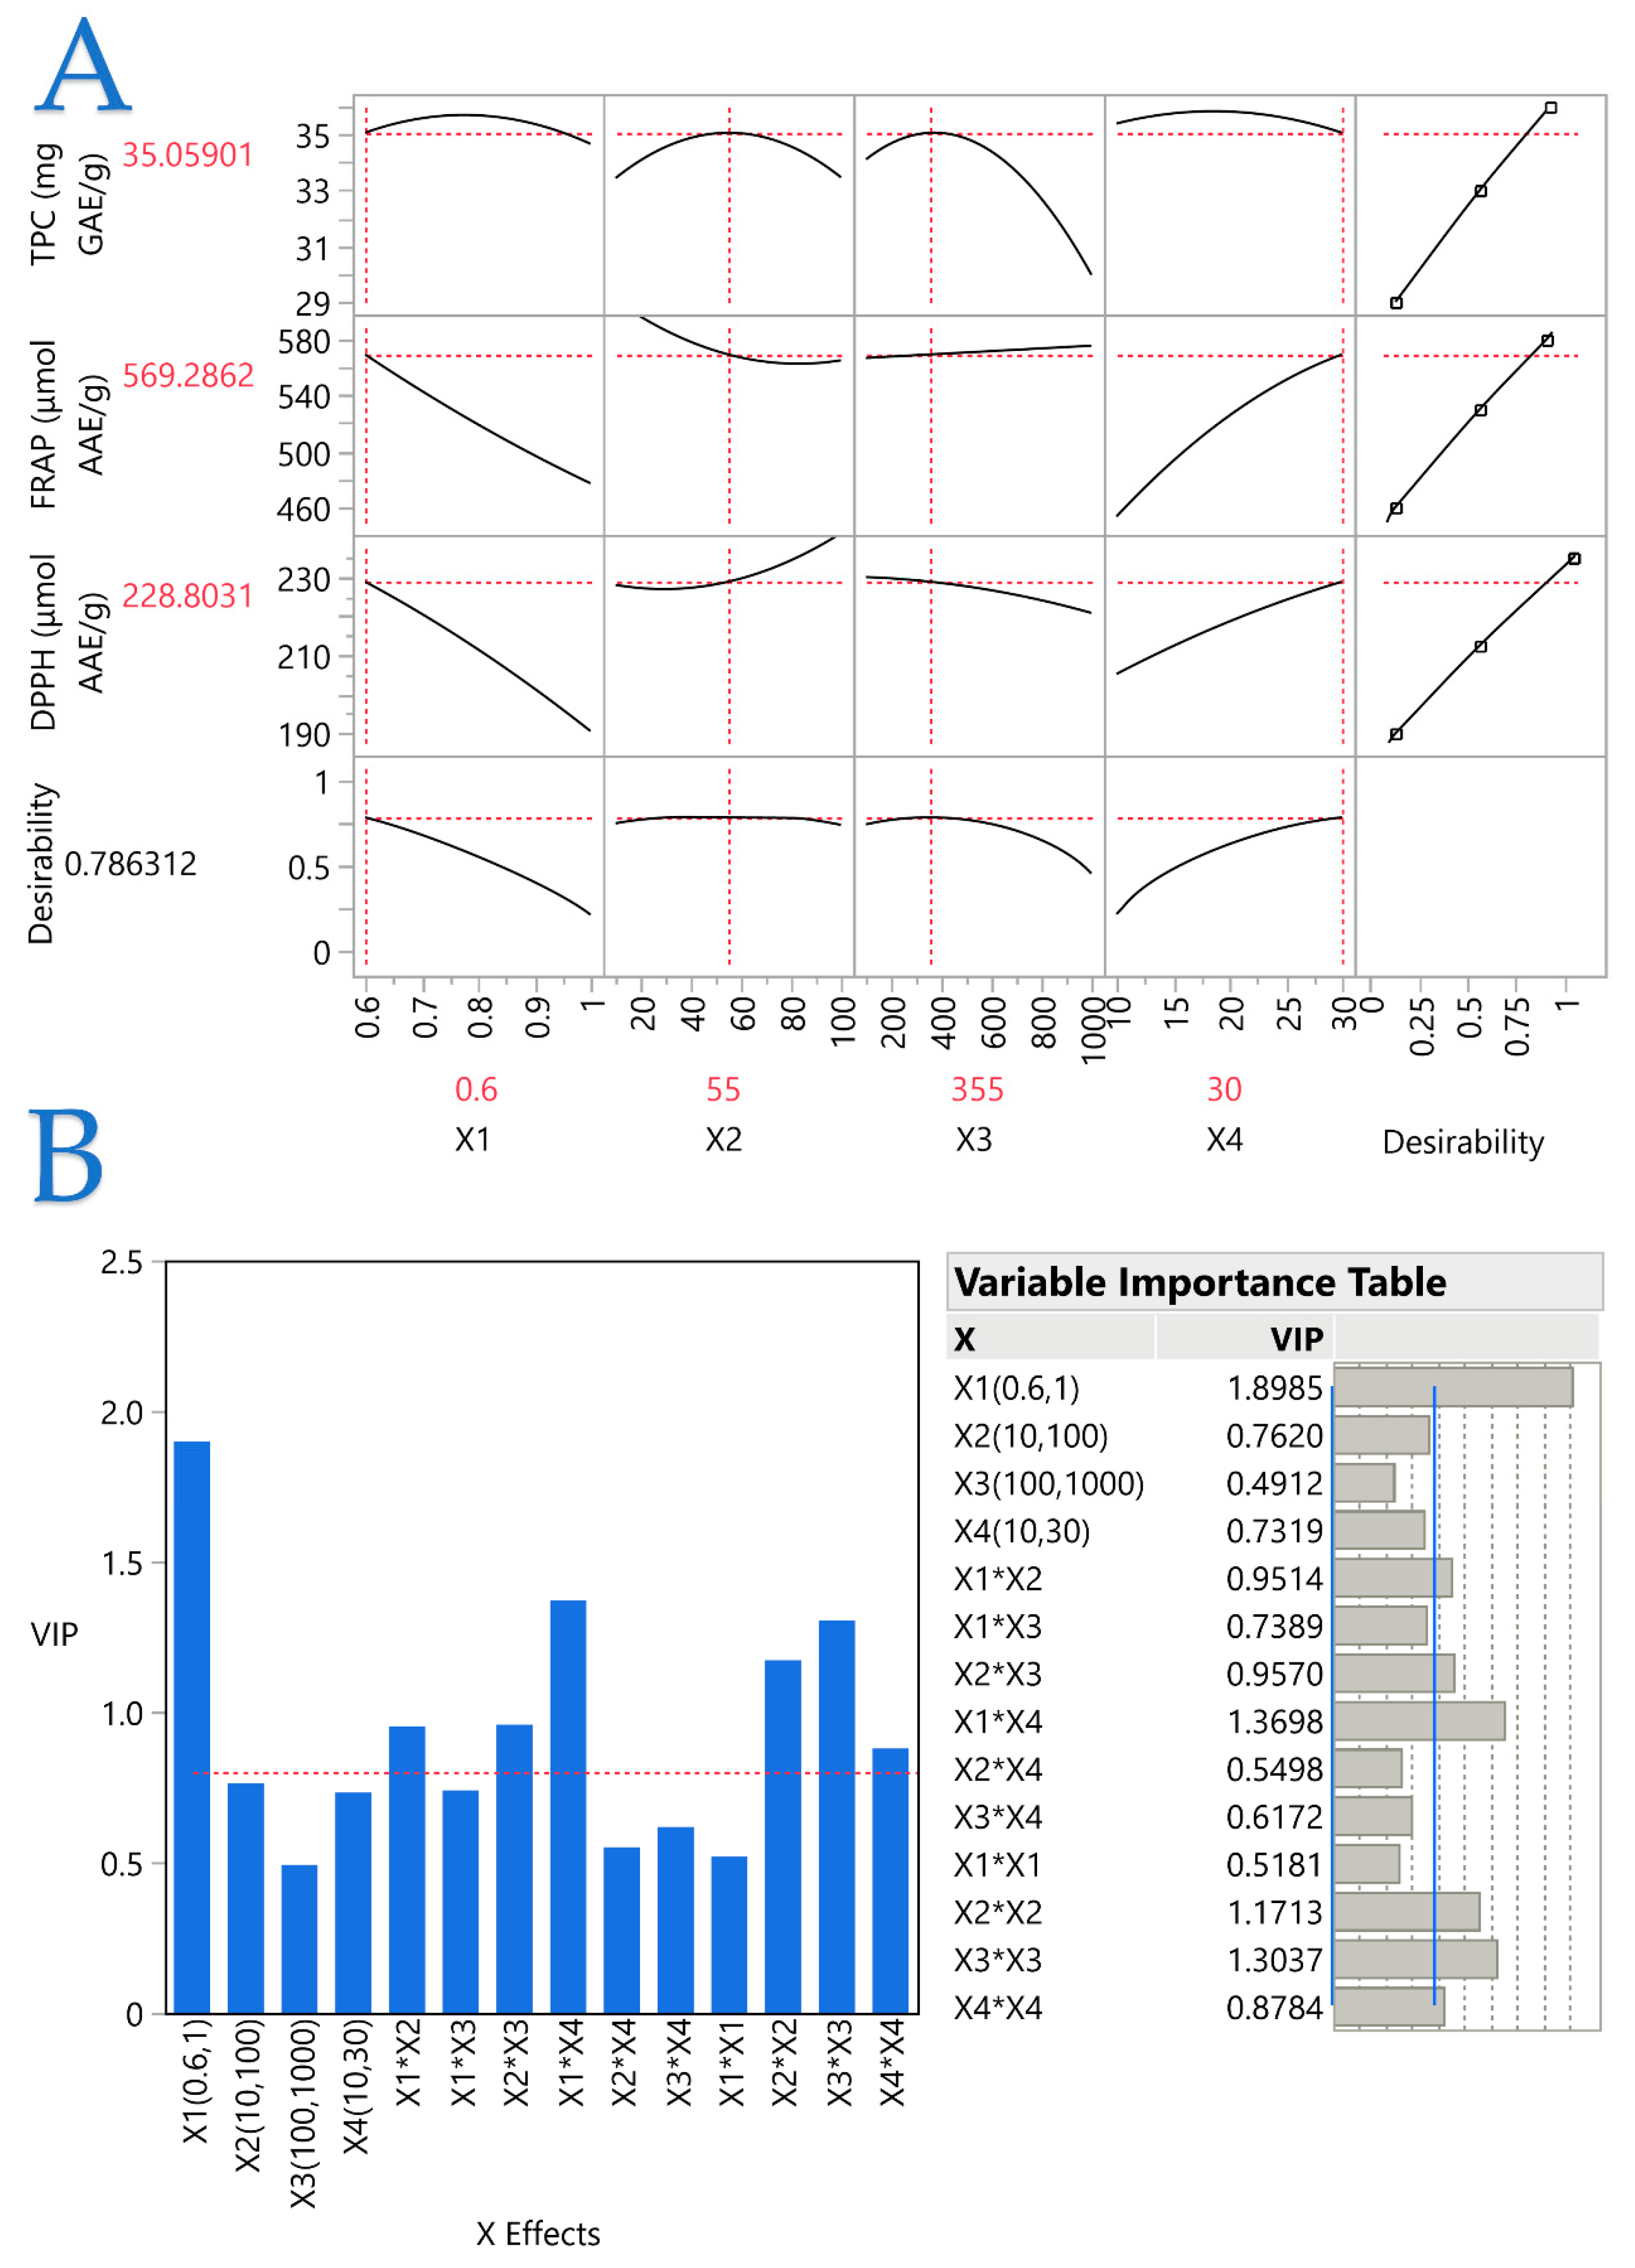
3.7. Partial Least Squares (PLS) Analysis and Variable Importance Plot (VIP) Coefficient

To determine the significance of the extraction parameters (X1, X2, X3, and X4), a PLS model was applied. The utilization of the PLS model to generate a correlation loading plot, as illustrated in Figure 7 (plot A), visually represents the effects of PEF conditions on laurel leaves. It can be concluded that the X1 variable, (i.e., electric field strength) did not contribute enough to yield maximum polyphenols; however, a negative correlation was observed with antioxidant assays. The higher the field strength, the lower the antioxidant capacity of the extracts. On the other hand, the X2 and X3 parameters (pulse duration and pulse period) had little or no impact, especially on the antioxidant assays. Extraction duration (i.e., parameter X4) showed a non-significant impact on TPC, though it was noticed that 30 min of extraction was the most beneficial in enhancing the antioxidant capacity of the extracts. A greater contribution from a variable (or a combination of variables) is indicated by a higher VIP coefficient, especially a value > 0.8, as shown in plot B. It was observed that variables X1 and X4 showed the highest contribution required for the most favorable results in both antioxidant assays.
The correlation between the experimental values and those generated by the PLS model was found to be 0.9876 and have slight deviations, as the p-value was measured at 0.0711. The implementation of PEF treatment led to extracts with high TPC or antioxidant capacity. By selecting the optimal PEF conditions, as shown in Table 7, a high percentage increase in the examined values was observed. The lowest percentage increase among PEF-treated and untreated samples was observed in TPC (77%), which led to extracts with 35.55 mg GAE/g dw. A study by Peiro et al. [50] suggested that PEF treatment could increase TPC by ~100%, reaching 160 mg GAE/100 g dw of lemon peels. Regarding laurel leaves, the study [51] by Rincón et al. examined the impact of extraction solvent. TPC ranged from 10 to 12 mg GAE/g dw of laurel leaves, indicating that a mixture of the two could be more effective. Similar results to ours were obtained in the research studies by Dobroslavić et al. [15,52], who used other “green” extraction techniques. TPC ranged from 31.87 to 49.30 mg GAE/g when pressurized liquid extraction was used. Microwave- and ultrasound-assisted extraction obtained 30.88–53.57 mg GAE/g and 24.43–36.74 mg GAE/g dw, respectively. However, the variance in the TPC observed to the above studies could be subject of different cultivars of laurel leaves. Finally, a study from Ramos et al. [12] indicated that the antioxidant capacity evaluated by FRAP assay using ethanol with maceration process recorded 136 μmol AAE/g dw. This value is comparable to our control sample but considerably lower than the PEF-treated sample (189.71 and 520.05 μmol AAE/g dw, respectively), highlighting the impact of PEF treatment on the laurel leaf extracts. As laurel leaf extracts are rich in antioxidants, it was essential to highlight the contribution of PEF to the antioxidant activity of the extracts, which was found significant. A future study could focus on the enhancement of other biological properties of laurel leaves extracts.
Finally, individual polyphenols analysis of both PEF-treated and untreated laurel leaf extracts revealed again a substantial percentage increase under the optimal PEF conditions, as mentioned above. The results are shown in Table 8. PEF-treated samples had a total of 12.12 mg/g of polyphenols, recording an 81.7% increase from the untreated samples. In most cases, statistically significant differences (p < 0.05) were observed in the polyphenol concentrations of laurel extracts after PEF treatment. With the specific PEF conditions, the major polyphenol was found to be kaempferol 3-O-β-rutinoside (7.40 mg/g). In the previous study by Dobroslavić et al. [15], similar compounds were identified, including ferulic acid (0.01 mg/g), rutin (0.97 mg/g), kaempferol 3-O-β-rutinoside (0.06 mg/g), whereas epicatechin (0.13–0.71 mg/g) was also quantified with other “green” techniques in the previous study from the same research team [52].

4. Conclusions

The aim of the present study was to identify whether high concentrations of bioactive compounds could be extracted from laurel leaves using “green” solvents (ethanol and water) in conjunction with the “green” PEF technique. To improve the efficiency of the process, a 0.6 kV/cm electric field strength was needed, accompanied by brief pulses of 55 μs over a duration of 355 μs, for a total extraction time of 30 min. Preliminary experiments revealed that 25% v/v of aqueous ethanol solution as solvent and a liquid-to-solid ratio of 10 were necessitated. When compared to the control (untreated) samples, the PEF-treated extracts demonstrated a 77% increase in polyphenol content. The increase in specific polyphenols varied between 25% and 288%. Antioxidant capacity by FRAP and DPPH assays increased significantly, by 174% and 90%, respectively. The amount of the recovered polyphenols was dependent on the duration and intensity of the electric field. Further investigation could be conducted to thoroughly elucidate the practical application of PEF-treated extracts or other biological activities of laurel leaves extracts. The as-prepared extracts are rich in antioxidant compounds that hold promise for the fortification of beverages or food products as well as cosmetic products.

Supplementary Materials

The following supporting information can be downloaded at: https://0-www-mdpi-com.brum.beds.ac.uk/article/10.3390/chemengineering8020026/s1, Table S1 represents the actual and coded levels of the independent variables for the Screening design. Figures S1–S3 comprise plots that illustrate the comparison between the actual response and the predicted response for each parameter under examination, accompanied by the desirability functions. Figures S4–S6 present three-dimensional response plots for the remaining responses. Figure S7 demonstrates the bivariate analysis of each parameter on the assays under investigation. Figure S8 depicts the time course of the same assays during extraction from laurel leaves using PEF, under the optimal extraction PEF conditions. Figures S9 and S10 show the first- and second-order kinetics of the assays under optimum PEF conditions.

Author Contributions

Conceptualization, V.A., T.C. and S.I.L.; methodology, V.A. and T.C.; software, V.A.; validation, T.C. and V.A.; formal analysis, D.K., E.B., V.A. and T.C.; investigation, E.B., K.K. and M.M.; resources, S.I.L.; data curation, D.K., M.M. and E.B.; writing—original draft preparation, D.K., M.M. and E.B.; writing—review and editing, V.A., T.C., D.K., K.K., E.B., M.M. and S.I.L.; visualization, D.K., K.K. and M.M.; supervision, V.A., T.C. and S.I.L.; project administration, S.I.L.; funding acquisition, S.I.L. All authors have read and agreed to the published version of the manuscript.

Funding

This research received no external funding.

Institutional Review Board Statement

Not applicable.

Informed Consent Statement

Not applicable.

Data Availability Statement

All related data and methods are presented in this paper. Additional inquiries should be addressed to the corresponding author.

Conflicts of Interest

The authors declare no conflicts.

References

  1. Petrovska, B.B. Historical Review of Medicinal Plants’ Usage. Pharmacogn. Rev. 2012, 6, 1–5. [Google Scholar] [CrossRef]
  2. Kumar, S.; Saini, R.; Suthar, P.; Kumar, V.; Sharma, R. Plant Secondary Metabolites: Their Food and Therapeutic Importance. In Plant Secondary Metabolites: Physico-Chemical Properties and Therapeutic Applications; Sharma, A.K., Sharma, A., Eds.; Springer Nature: Singapore, 2022; pp. 371–413. ISBN 9789811647796. [Google Scholar]
  3. Guimarães, R.; Sousa, M.J.; Ferreira, I.C.F.R. Contribution of Essential Oils and Phenolics to the Antioxidant Properties of Aromatic Plants. Ind. Crops Prod. 2010, 32, 152–156. [Google Scholar] [CrossRef]
  4. Li, Y.; Kong, D.; Fu, Y.; Sussman, M.R.; Wu, H. The Effect of Developmental and Environmental Factors on Secondary Metabolites in Medicinal Plants. Plant Physiol. Biochem. 2020, 148, 80–89. [Google Scholar] [CrossRef]
  5. Shahidi, F.; Ambigaipalan, P. Phenolics and Polyphenolics in Foods, Beverages and Spices: Antioxidant Activity and Health Effects—A Review. J. Funct. Foods 2015, 18, 820–897. [Google Scholar] [CrossRef]
  6. Rodríguez-Sánchez, F.; Arroyo, J. Reconstructing the Demise of Tethyan Plants: Climate-Driven Range Dynamics of Laurus since the Pliocene. Glob. Ecol. Biogeogr. 2008, 17, 685–695. [Google Scholar] [CrossRef]
  7. Paparella, A.; Nawade, B.; Shaltiel-Harpaz, L.; Ibdah, M. A Review of the Botany, Volatile Composition, Biochemical and Molecular Aspects, and Traditional Uses of Laurus nobilis. Plants 2022, 11, 1209. [Google Scholar] [CrossRef] [PubMed]
  8. Anzano, A.; de Falco, B.; Grauso, L.; Motti, R.; Lanzotti, V. Laurel, Laurus nobilis L.: A Review of Its Botany, Traditional Uses, Phytochemistry and Pharmacology. Phytochem. Rev. 2022, 21, 565–615. [Google Scholar] [CrossRef]
  9. Batool, S.; Khera, R.A.; Hanif, M.A.; Ayub, M.A. Chapter 5—Bay Leaf. In Medicinal Plants of South Asia; Hanif, M.A., Nawaz, H., Khan, M.M., Byrne, H.J., Eds.; Elsevier: Amsterdam, The Netherlands, 2020; pp. 63–74. ISBN 978-0-08-102659-5. [Google Scholar]
  10. Dobroslavić, E.; Repajić, M.; Dragović-Uzelac, V.; Elez Garofulić, I. Isolation of Laurus nobilis Leaf Polyphenols: A Review on Current Techniques and Future Perspectives. Foods 2022, 11, 235. [Google Scholar] [CrossRef]
  11. Stefanova, G.; Girova, T.; Gochev, V.; Stoyanova, M.; Petkova, Z.; Stoyanova, A.; Zheljazkov, V.D. Comparative Study on the Chemical Composition of Laurel (Laurus nobilis L.) Leaves from Greece and Georgia and the Antibacterial Activity of Their Essential Oil. Heliyon 2020, 6, e05491. [Google Scholar] [CrossRef] [PubMed]
  12. Ramos, C.; Teixeira, B.; Batista, I.; Matos, O.; Serrano, C.; Neng, N.R.; Nogueira, J.M.F.; Nunes, M.L.; Marques, A. Antioxidant and Antibacterial Activity of Essential Oil and Extracts of Bay Laurel Laurus nobilis Linnaeus (Lauraceae) from Portugal. Nat. Prod. Res. 2012, 26, 518–529. [Google Scholar] [CrossRef]
  13. Cheynier, V. Polyphenols in Foods Are More Complex than Often Thought. Am. J. Clin. Nutr. 2005, 81, 223S–229S. [Google Scholar] [CrossRef] [PubMed]
  14. Gil-Martín, E.; Forbes-Hernández, T.; Romero, A.; Cianciosi, D.; Giampieri, F.; Battino, M. Influence of the Extraction Method on the Recovery of Bioactive Phenolic Compounds from Food Industry By-Products. Food Chem. 2022, 378, 131918. [Google Scholar] [CrossRef] [PubMed]
  15. Dobroslavić, E.; Elez Garofulić, I.; Šeparović, J.; Zorić, Z.; Pedisić, S.; Dragović-Uzelac, V. Pressurized Liquid Extraction as a Novel Technique for the Isolation of Laurus nobilis L. Leaf Polyphenols. Molecules 2022, 27, 5099. [Google Scholar] [CrossRef] [PubMed]
  16. Velusamy, M.; Rajan, A.; Radhakrishnan, M. Valorisation of Food Processing Wastes Using PEF and Its Economic Advances—Recent Update. Int. J. Food Sci. Technol. 2023, 58, 2021–2041. [Google Scholar] [CrossRef]
  17. Athanasiadis, V.; Chatzimitakos, T.; Kotsou, K.; Kalompatsios, D.; Bozinou, E.; Lalas, S.I. Polyphenol Extraction from Food (by) Products by Pulsed Electric Field: A Review. Int. J. Mol. Sci. 2023, 24, 15914. [Google Scholar] [CrossRef] [PubMed]
  18. Zhang, C.; Lyu, X.; Arshad, R.N.; Aadil, R.M.; Tong, Y.; Zhao, W.; Yang, R. Pulsed Electric Field as a Promising Technology for Solid Foods Processing: A Review. Food Chem. 2023, 403, 134367. [Google Scholar] [CrossRef] [PubMed]
  19. Pappas, V.M.; Lakka, A.; Palaiogiannis, D.; Bozinou, E.; Ntourtoglou, G.; Batra, G.; Athanasiadis, V.; Makris, D.P.; Dourtoglou, V.G.; Lalas, S.I. Use of Pulsed Electric Field as a Low-Temperature and High-Performance “Green” Extraction Technique for the Recovery of High Added Value Compounds from Olive Leaves. Beverages 2021, 7, 45. [Google Scholar] [CrossRef]
  20. Ghoshal, G. Comprehensive Review on Pulsed Electric Field in Food Preservation: Gaps in Current Studies for Potential Future Research. Heliyon 2023, 9, e17532. [Google Scholar] [CrossRef]
  21. Ziagova, M.G.; Mavromatidou, C.; Samiotis, G.; Amanatidou, E. Total Phenolic Content and Antioxidant Capacity of Greek Medicinal and Aromatic Plant Extracts Using Pulsed Electric Field Followed by Ultrasounds Extraction Process. J. Food Process. Preserv. 2022, 46, e16639. [Google Scholar] [CrossRef]
  22. Lakka, A.; Bozinou, E.; Stavropoulos, G.; Samanidis, I.; Athanasiadis, V.; Dourtoglou, V.G.; Makris, D.P.; Lalas, S.I. Enhancement of Polyphenols Recovery from Rosa canina, Calendula officinalis and Castanea sativa Using Pulsed Electric Field. Beverages 2021, 7, 63. [Google Scholar] [CrossRef]
  23. Neri, L.; Giancaterino, M.; Rocchi, R.; Tylewicz, U.; Valbonetti, L.; Faieta, M.; Pittia, P. Pulsed Electric Fields (PEF) as Hot Air Drying Pre-Treatment: Effect on Quality and Functional Properties of Saffron (Crocus sativus L.). Innov. Food Sci. Emerg. Technol. 2021, 67, 102592. [Google Scholar] [CrossRef]
  24. Athanasiadis, V.; Chatzimitakos, T.; Makrygiannis, I.; Kalompatsios, D.; Bozinou, E.; Lalas, S.I. Antioxidant-Rich Extracts from Lemon Verbena (Aloysia citrodora L.) Leaves through Response Surface Methodology. Oxygen 2024, 4, 1–19. [Google Scholar] [CrossRef]
  25. Hobbi, P.; Okoro, O.V.; Delporte, C.; Alimoradi, H.; Podstawczyk, D.; Nie, L.; Bernaerts, K.V.; Shavandi, A. Kinetic Modelling of the Solid–Liquid Extraction Process of Polyphenolic Compounds from Apple Pomace: Influence of Solvent Composition and Temperature. Bioresour. Bioprocess. 2021, 8, 114. [Google Scholar] [CrossRef]
  26. Chatzimitakos, T.; Athanasiadis, V.; Makrygiannis, I.; Kalompatsios, D.; Bozinou, E.; Lalas, S.I. An Investigation into Crithmum maritimum L. Leaves as a Source of Antioxidant Polyphenols. Compounds 2023, 3, 532–551. [Google Scholar] [CrossRef]
  27. Shehata, E.; Grigorakis, S.; Loupassaki, S.; Makris, D.P. Extraction Optimisation Using Water/Glycerol for the Efficient Recovery of Polyphenolic Antioxidants from Two Artemisia Species. Sep. Purif. Technol. 2015, 149, 462–469. [Google Scholar] [CrossRef]
  28. Ferreira, S.L.C.; Bruns, R.E.; Ferreira, H.S.; Matos, G.D.; David, J.M.; Brandão, G.C.; da Silva, E.G.P.; Portugal, L.A.; dos Reis, P.S.; Souza, A.S.; et al. Box-Behnken Design: An Alternative for the Optimization of Analytical Methods. Anal. Chim. Acta 2007, 597, 179–186. [Google Scholar] [CrossRef]
  29. Yu, X.-L.; He, Y. Application of Box-Behnken Designs in Parameters Optimization of Differential Pulse Anodic Stripping Voltammetry for Lead(II) Determination in Two Electrolytes. Sci. Rep. 2017, 7, 2789. [Google Scholar] [CrossRef]
  30. Rifna, E.J.; Misra, N.N.; Dwivedi, M. Recent Advances in Extraction Technologies for Recovery of Bioactive Compounds Derived from Fruit and Vegetable Waste Peels: A Review. Crit. Rev. Food Sci. Nutr. 2023, 63, 719–752. [Google Scholar] [CrossRef]
  31. Chemat, F.; Rombaut, N.; Meullemiestre, A.; Turk, M.; Perino, S.; Fabiano-Tixier, A.-S.; Abert-Vian, M. Review of Green Food Processing Techniques. Preservation, Transformation, and Extraction. Innov. Food Sci. Emerg. Technol. 2017, 41, 357–377. [Google Scholar] [CrossRef]
  32. Kalompatsios, D.; Athanasiadis, V.; Palaiogiannis, D.; Lalas, S.I.; Makris, D.P. Valorization of Waste Orange Peels: Aqueous Antioxidant Polyphenol Extraction as Affected by Organic Acid Addition. Beverages 2022, 8, 71. [Google Scholar] [CrossRef]
  33. Conidi, C.; Drioli, E.; Cassano, A. Membrane-Based Agro-Food Production Processes for Polyphenol Separation, Purification and Concentration. Curr. Opin. Food Sci. 2018, 23, 149–164. [Google Scholar] [CrossRef]
  34. Giovanoudis, I.; Athanasiadis, V.; Chatzimitakos, T.; Kalompatsios, D.; Bozinou, E.; Gortzi, O.; Nanos, G.D.; Lalas, S.I. Implementation of Cloud Point Extraction Using Surfactants in the Recovery of Polyphenols from Apricot Cannery Waste. Eng 2023, 4, 1225–1235. [Google Scholar] [CrossRef]
  35. Golberg, A.; Sack, M.; Teissie, J.; Pataro, G.; Pliquett, U.; Saulis, G.; Stefan, T.; Miklavcic, D.; Vorobiev, E.; Frey, W. Energy-Efficient Biomass Processing with Pulsed Electric Fields for Bioeconomy and Sustainable Development. Biotechnol. Biofuels 2016, 9, 94. [Google Scholar] [CrossRef]
  36. Bocker, R.; Keven Silva, E. Pulsed Electric Field Technology as a Promising Pre-Treatment for Enhancing Orange Agro-Industrial Waste Biorefinery. RSC Adv. 2024, 14, 2116–2133. [Google Scholar] [CrossRef] [PubMed]
  37. Du, L.; Zhao, M.; Xu, J.; Qian, D.; Jiang, S.; Shang, E.; Guo, J.; Duan, J. Analysis of the Metabolites of Isorhamnetin 3-O-Glucoside Produced by Human Intestinal Flora in Vitro by Applying Ultraperformance Liquid Chromatography/Quadrupole Time-of-Flight Mass Spectrometry. J. Agric. Food Chem. 2014, 62, 2489–2495. [Google Scholar] [CrossRef]
  38. Wang, Y.; Tang, C.; Zhang, H. Hepatoprotective Effects of Kaempferol 3-O-Rutinoside and Kaempferol 3-O-Glucoside from Carthamus tinctorius L. on CCl4-Induced Oxidative Liver Injury in Mice. J. Food Drug Anal. 2015, 23, 310–317. [Google Scholar] [CrossRef]
  39. Riaz, A.; Rasul, A.; Hussain, G.; Zahoor, M.K.; Jabeen, F.; Subhani, Z.; Younis, T.; Ali, M.; Sarfraz, I.; Selamoglu, Z. Astragalin: A Bioactive Phytochemical with Potential Therapeutic Activities. Adv. Pharmacol. Sci. 2018, 2018, 9794625. [Google Scholar] [CrossRef] [PubMed]
  40. Septembre-Malaterre, A.; Boumendjel, A.; Seteyen, A.-L.S.; Boina, C.; Gasque, P.; Guiraud, P.; Sélambarom, J. Focus on the High Therapeutic Potentials of Quercetin and Its Derivatives. Phytomed. Plus 2022, 2, 100220. [Google Scholar] [CrossRef]
  41. Zhang, Z.-H.; Zeng, X.-A.; Brennan, C.S.; Brennan, M.; Han, Z.; Xiong, X.-Y. Effects of Pulsed Electric Fields (PEF) on Vitamin C and Its Antioxidant Properties. Int. J. Mol. Sci. 2015, 16, 24159–24173. [Google Scholar] [CrossRef] [PubMed]
  42. Sik, B.; Hanczné, E.L.; Kapcsándi, V.; Ajtony, Z. Conventional and Nonconventional Extraction Techniques for Optimal Extraction Processes of Rosmarinic Acid from Six Lamiaceae Plants as Determined by HPLC-DAD Measurement. J. Pharm. Biomed. Anal. 2020, 184, 113173. [Google Scholar] [CrossRef]
  43. Puértolas, E.; Saldaña, G.; Raso, J. Pulsed Electric Field Treatment for Fruit and Vegetable Processing. In Handbook of Electroporation; Miklavcic, D., Ed.; Springer International Publishing: Cham, Switzerland, 2016; pp. 1–21. ISBN 978-3-319-26779-1. [Google Scholar]
  44. Ranjha, M.M.A.N.; Kanwal, R.; Shafique, B.; Arshad, R.N.; Irfan, S.; Kieliszek, M.; Kowalczewski, P.Ł.; Irfan, M.; Khalid, M.Z.; Roobab, U.; et al. A Critical Review on Pulsed Electric Field: A Novel Technology for the Extraction of Phytoconstituents. Molecules 2021, 26, 4893. [Google Scholar] [CrossRef]
  45. Zbinden, M.D.A.; Sturm, B.S.M.; Nord, R.D.; Carey, W.J.; Moore, D.; Shinogle, H.; Stagg-Williams, S.M. Pulsed Electric Field (PEF) as an Intensification Pretreatment for Greener Solvent Lipid Extraction from Microalgae. Biotechnol. Bioeng. 2013, 110, 1605–1615. [Google Scholar] [CrossRef] [PubMed]
  46. Plaskova, A.; Mlcek, J. New Insights of the Application of Water or Ethanol-Water Plant Extract Rich in Active Compounds in Food. Front. Nutr. 2023, 10, 1118761. [Google Scholar] [CrossRef] [PubMed]
  47. Monroy, Y.M.; Rodrigues, R.A.F.; Sartoratto, A.; Cabral, F.A. Influence of Ethanol, Water, and Their Mixtures as Co-Solvents of the Supercritical Carbon Dioxide in the Extraction of Phenolics from Purple Corn Cob (Zea mays L.). J. Supercrit. Fluids 2016, 118, 11–18. [Google Scholar] [CrossRef]
  48. Generalić Mekinić, I.; Skroza, D.; Ljubenkov, I.; Katalinić, V.; Šimat, V. Antioxidant and Antimicrobial Potential of Phenolic Metabolites from Traditionally Used Mediterranean Herbs and Spices. Foods 2019, 8, 579. [Google Scholar] [CrossRef] [PubMed]
  49. Segovia, F.J.; Luengo, E.; Corral-Pérez, J.J.; Raso, J.; Almajano, M.P. Improvements in the Aqueous Extraction of Polyphenols from Borage (Borago officinalis L.) Leaves by Pulsed Electric Fields: Pulsed Electric Fields (PEF) Applications. Ind. Crops Prod. 2015, 65, 390–396. [Google Scholar] [CrossRef]
  50. Peiró, S.; Luengo, E.; Segovia, F.; Raso, J.; Almajano, M.P. Improving Polyphenol Extraction from Lemon Residues by Pulsed Electric Fields. Waste Biomass Valoriz. 2019, 10, 889–897. [Google Scholar] [CrossRef]
  51. Rincón, E.; Balu, A.M.; Luque, R.; Serrano, L. Mechanochemical Extraction of Antioxidant Phenolic Compounds from Mediterranean and Medicinal Laurus nobilis: A Comparative Study with Other Traditional and Green Novel Techniques. Ind. Crops Prod. 2019, 141, 111805. [Google Scholar] [CrossRef]
  52. Dobroslavić, E.; Elez Garofulić, I.; Zorić, Z.; Pedisić, S.; Dragović-Uzelac, V. Polyphenolic Characterization and Antioxidant Capacity of Laurus nobilis L. Leaf Extracts Obtained by Green and Conventional Extraction Techniques. Processes 2021, 9, 1840. [Google Scholar] [CrossRef]
Figure 1. Plot (A) illustrates the actual against the predicted response (TPC, mg GAE/g dw) for the optimization of extraction of laurel leaves achieved by hydroethanolic solutions. The inset tables provide statistics related to the evaluation of the resulting model. Values with color and asterisk denote statistically significant figures. Plot (B) displays the desirability function for the optimization of extraction of laurel leaves performed with hydroethanolic solutions.
Chemengineering 08 00026 g001
Figure 2. Three-dimensional graph denoting the covariation of X1 (C %, v/v) and X2 (R, mL/g) and the impact of the process variables considered on the response (TPC, mg GAE/g dw) for the optimization of extraction of laurel leaves achieved by hydroethanolic solutions.
Chemengineering 08 00026 g002
Figure 3. Representative HPLC chromatogram at 280, 320, and 360 nm of laurel leaves extract, displaying identified polyphenolic compounds. 1: neochlorogenic acid; 2: vanillic acid; 3: rutin; 4: epicatechin; 5: ferulic acid; 6: quercetin 3-D-galactoside; 7: luteolin 7-glucoside; 8: narirutin; 9: kaempferol 3-O-β-rutinoside; 10: kaempferol 3-glucoside; 11: apigenin 7-glucoside; 12: isorhamnetin 3-glucoside; 13: kaempferol.
Chemengineering 08 00026 g003
Figure 4. Pareto plots of transformed estimates for TPC (A), FRAP (B), and DPPH (C) assays. A reference yellow line is drawn on the plot to indicate the level of significance (p < 0.05). The cumulative sum grey line in the plots sums the absolute values of the estimates.
Chemengineering 08 00026 g004
Figure 5. Principal component analysis (PCA) for the measured variables. Each X variable is presented in blue.
Chemengineering 08 00026 g005
Figure 6. Multivariate correlation analysis of measured variables.
Chemengineering 08 00026 g006
Figure 7. Plot (A) displays the partial least squares (PLS) prediction profiler of each investigated variable and extrapolated desirability function for the optimization of laurel leaf extracts, while plot (B) displays the Variable Importance Plot (VIP) option graph with the VIP values for each X variable. The VIP scores are shown in the Variable Importance Table (VIT). Significance was emphasized by a red dashed line drawn in the plot (or by a blue line in the VIT) at 0.8.
Chemengineering 08 00026 g007
Table 1. Experimental values for the two investigated independent variables and the dependent variable’s response to total polyphenol content (TPC).
Design PointIndependent VariablesResponse TPC (mg GAE/g)
X1 (C %, v/v)X2 (R, mL/g)ActualPredicted
11 (0)2 (20)15.9117.15
22 (25)2 (20)35.4434.56
33 (50)3 (30)38.1036.80
44 (75)4 (40)29.3331.10
55 (100)4 (40)15.5314.55
61 (0)1 (10)25.3724.38
72 (25)1 (10)38.5039.45
83 (50)5 (50)33.4233.01
94 (75)3 (30)30.3530.79
105 (100)5 (50)17.2917.45
Table 2. The actual and coded levels of the independent variables were applied to maximize the efficiency of PEF extraction.
Independent VariablesCode UnitsCoded Variable Level
−101
Electric field strength (E, kV/cm)X10.60.81.0
Pulse duration (tpulse, μs)X21055100
Pulse period (T, μs)X31005501000
Extraction duration (t, min)X4102030
Table 3. Experimental values for the four investigated independent variables and the dependent variable’s responses.
Design PointIndependent VariablesResponses
TPC
(mg GAE/g dw)
FRAP
(μmol AAE/g)
DPPH
(μmol AAE/g)
X1 (E, kV/cm)X2 (tpulse, μs)X3 (T, μs)X4 (t, min)ActualPredictedActualPredictedActualPredicted
1−1 (0.6)−1 (10)0 (550)0 (20)34.0733.74558.40557.34214.45216.03
2−1 (0.6)1 (100)0 (550)0 (20)34.6834.50543.18545.75230.09231.82
31 (1.0)−1 (10)0 (550)0 (20)33.6433.43478.21483.94211.26209.75
41 (1.0)1 (100)0 (550)0 (20)31.8531.79548.48557.84195.49194.13
50 (0.8)0 (55)−1 (100)−1 (10)32.3331.94476.86476.50200.77201.47
60 (0.8)0 (55)−1 (100)1 (30)34.0734.27529.46529.58209.25212.37
70 (0.8)0 (55)1 (1000)−1 (10)32.9932.41496.32504.51207.08204.17
80 (0.8)0 (55)1 (1000)1 (30)31.7531.75484.38493.05204.83204.34
9−1 (0.6)0 (55)0 (550)−1 (10)35.4935.63476.10469.08203.28205.85
10−1 (0.6)0 (55)0 (550)1 (30)35.1334.65581.47571.18228.20227.14
111 (1.0)0 (55)0 (550)−1 (10)32.3432.30519.49519.72198.85199.62
121 (1.0)0 (55)0 (550)1 (30)35.6134.96462.27459.23192.26189.40
130 (0.8)−1 (10)−1 (100)0 (20)30.9730.75538.17538.73220.05216.48
140 (0.8)−1 (10)1 (1000)0 (20)32.7532.84508.48494.76209.72209.45
150 (0.8)1 (100)−1 (100)0 (20)34.0233.42526.50530.17212.23212.21
160 (0.8)1 (100)1 (1000)0 (20)29.5829.29576.24565.63210.62213.90
17−1 (0.6)0 (55)−1 (100)0 (20)33.9734.44508.78513.81220.84218.28
18−1 (0.6)0 (55)1 (1000)0 (20)31.4331.80544.07554.83216.71214.46
191 (1.0)0 (55)−1 (100)0 (20)30.7831.31537.45528.44192.82195.15
201 (1.0)0 (55)1 (1000)0 (20)31.4831.90482.17478.89190.98193.62
210 (0.8)−1 (10)0 (550)−1 (10)32.0432.36482.30485.14208.71209.99
220 (0.8)−1 (10)0 (550)1 (30)34.9335.28514.34519.98213.71216.20
230 (0.8)1 (100)0 (550)−1 (10)33.4534.00534.22530.33213.16210.75
240 (0.8)1 (100)0 (550)1 (30)32.1832.76538.20537.10216.82215.61
250 (0.8)0 (55)0 (550)0 (20)35.5335.80514.71515.10208.03208.95
260 (0.8)0 (55)0 (550)0 (20)36.3935.80514.03515.10210.73208.95
270 (0.8)0 (55)0 (550)0 (20)35.4935.80516.57515.10208.10208.95
Table 4. Coded values of the four investigated independent variables with the actual concentration of polyphenolic compounds, expressed in mg/g dw.
DPIndependent VariablesResponses
X1 (E, kV/cm)X2 (tpulse, μs)X3 (T, μs)X4 (t, min)NCAVARTECFAQ3GL7GNRTK3RK3GA7GI3GKMP
1−1 (0.6)−1 (10)0 (550)0 (20)0.020.480.360.070.384.310.280.060.081.590.066.830.18
2−1 (0.6)1 (100)0 (550)0 (20)0.040.470.360.100.380.800.290.065.920.850.130.030.18
31 (1.0)−1 (10)0 (550)0 (20)nd *0.570.490.120.410.830.290.090.030.560.170.050.18
41 (1.0)1 (100)0 (550)0 (20)0.010.480.380.090.360.750.280.035.410.530.111.010.17
50 (0.8)0 (55)−1 (100)−1 (10)0.020.540.370.110.400.850.290.086.240.570.150.060.17
60 (0.8)0 (55)−1 (100)1 (30)0.020.560.400.100.410.850.290.076.510.570.170.070.17
70 (0.8)0 (55)1 (1000)−1 (10)0.020.480.370.110.370.800.290.055.700.550.130.020.17
80 (0.8)0 (55)1 (1000)1 (30)0.020.450.380.100.360.780.280.035.390.540.12nd0.17
9−1 (0.6)0 (55)0 (550)−1 (10)0.020.470.370.110.390.810.280.045.970.550.14nd0.18
10−1 (0.6)0 (55)0 (550)1 (30)0.020.570.370.110.420.850.780.086.630.560.170.030.18
111 (1.0)0 (55)0 (550)−1 (10)0.020.500.400.090.370.790.280.035.770.540.13nd0.18
121 (1.0)0 (55)0 (550)1 (30)0.020.520.370.100.390.820.290.056.090.560.140.060.18
130 (0.8)−1 (10)−1 (100)0 (20)0.010.420.360.090.370.790.280.035.630.540.120.020.17
140 (0.8)−1 (10)1 (1000)0 (20)0.020.500.380.100.380.810.280.055.960.550.140.020.18
150 (0.8)1 (100)−1 (100)0 (20)0.020.500.360.100.390.800.290.065.960.550.140.010.17
160 (0.8)1 (100)1 (1000)0 (20)0.020.610.380.110.440.890.300.107.250.570.200.070.20
17−1 (0.6)0 (55)−1 (100)0 (20)0.040.48nd0.090.380.780.280.045.740.540.13nd0.17
18−1 (0.6)0 (55)1 (1000)0 (20)0.020.460.370.010.380.790.280.066.000.540.140.040.18
191 (1.0)0 (55)−1 (100)0 (20)0.010.520.380.100.380.800.280.066.000.550.13nd0.18
201 (1.0)0 (55)1 (1000)0 (20)0.010.490.360.090.370.760.270.055.760.540.130.010.18
210 (0.8)−1 (10)0 (550)−1 (10)0.020.480.390.100.390.820.300.065.940.550.14nd0.18
220 (0.8)−1 (10)0 (550)1 (30)0.040.41nd0.090.370.770.280.035.390.530.120.010.17
230 (0.8)1 (100)0 (550)−1 (10)0.010.520.370.090.380.800.290.045.830.550.130.010.17
240 (0.8)1 (100)0 (550)1 (30)0.010.510.440.090.390.810.290.065.890.550.140.010.18
250 (0.8)0 (55)0 (550)0 (20)0.030.39nd0.070.340.750.28nd4.710.530.100.020.16
260 (0.8)0 (55)0 (550)0 (20)0.040.530.380.110.390.830.280.095.970.560.150.060.17
270 (0.8)0 (55)0 (550)0 (20)0.010.500.370.100.390.810.280.065.860.550.140.040.17
* nd: not detected. NCA: neochlorogenic acid; VA: vanillic acid; RT: rutin; EC: epicatechin; FA: ferulic acid; Q3G: quercetin 3-D-galactoside; L7G: luteolin 7-glucoside; NRT: narirutin; K3R: kaempferol 3-O-β-rutinoside; K3G: kaempferol 3-glucoside; A7G: apigenin 7-glucoside; I3G: isorhamnetin 3-glucoside; KMP: kaempferol.
Table 5. Mathematical models generated through RSM were used to optimize the extraction process of laurel leaves. The models included only significant terms.
ResponsesSecond-Order Polynomial Equations (Models)R2p-ValueEquation
TPCY = 18.62 + 18.8X1 + 0.22X2 + 0.01X3 + 0.13X4 − 20.58X12 − 0.0008X22 − 0.00001X32 − 0.006X42 − 0.07X1X2 + 0.009X1X3 + 0.45X1X4 − 0.0001X2X3 − 0.002X2X4 − 0.0002X3X40.9501<0.0001(1)
FRAPY = 212.11 + 181.88X1 − 2.72X2 + 0.21X3 + 25.81X4 + 97.32X12 + 0.009X22 − 0.00001X32 − 0.14X42 + 2.38X1X2 − 0.25X1X3 − 20.32X1X4 + 0.001X2X3 − 0.02X2X4 − 0.004X3X40.9591<0.0001(2)
DPPHY = 116.53 + 141.52X1 + 0.34X2 + 0.007X3 + 4.44X4 − 45.76X12 + 0.003X22 − 0.00001X32 − 0.02X42 − 0.87X1X2 + 0.006X1X3 − 3.94X1X4 + 0.0001X2X3 − 0.0007X2X4 − 0.0006X3X40.9561<0.0001(3)
Table 6. Maximum predicted responses and optimized extraction conditions for the dependent variables.
ResponsesOptimal Conditions
Maximum Predicted ResponseE, kV/cm
(X1)
tpulse, μs
(X2)
T, μs
(X3)
t, min
(X4)
TPC (mg GAE/g)36.17 ± 0.800.67541515
FRAP (μmol AAE/g)579.43 ± 15.480.62355027
DPPH (μmol AAE/g)233.68 ± 5.090.69047026
Table 7. Maximum desirability values for all investigated variables using the partial least squares (PLS) prediction profiler under optimized extraction conditions (X1: 0.6, X2: 55, X3: 355, and X4: 30). A comparison with the control extract (no PEF-treated) was also included.
VariablesPLS Model ValuesExperimental Values
(PEF)
Control
(No PEF)
% Increase
TPC (mg GAE/g)35.0635.55 ± 1.71 a20.08 ± 0.88 b77.0
FRAP (μmol AAE/g)569.29520.05 ± 10.4 a189.71 ± 6.26 b174.1
DPPH (μmol AAE/g)228.8258.64 ± 16.04 a135.54 ± 9.49 b90.8
Statistically significant figures (p < 0.05) are indicated with lowercase letters (e.g., a, b) within each row.
Table 8. Identified polyphenolic compounds under optimized extraction conditions. A comparison with the control extract (no PEF-treated) was also included.
Polyphenolic Compounds (mg/g)Optimal Extract
(PEF)
Control
(No PEF)
% Increase
Neochlorogenic acid0.02 ± 0 a0.02 ± 0 b31.0
Vanillic acid0.61 ± 0.03 a0.28 ± 0.01 b116.8
Rutin0.46 ± 0.03 a0.38 ± 0.02 b21.0
Epicatechin0.12 ± 0.01 a0.05 ± 0 b118.4
Ferulic acid0.44 ± 0.03 a0.29 ± 0.02 b52.7
Quercetin 3-D-galactoside0.91 ± 0.03 a0.69 ± 0.03 b30.7
Luteolin 7-glucoside0.30 ± 0.02 a0.26 ± 0.02 a11.9
Narirutin0.12 ± 0.01 a0.07 ± 0 b70.4
Kaempferol 3-O-β-rutinoside7.40 ± 0.53 a3.69 ± 0.27 b100.3
Kaempferol 3-glucoside0.59 ± 0.01 a0.51 ± 0.03 b14.8
Apigenin 7-glucoside0.21 ± 0.01 a0.06 ± 0 b235.9
Isorhamnetin 3-glucoside0.75 ± 0.02 a0.19 ± 0.01 b288.1
Kaempferol0.19 ± 0.01 a0.15 ± 0 b25.4
Total identified12.12 ± 0.74 a6.67 ± 0.41 b81.7
Statistically significant figures (p < 0.05) are indicated with lowercase letters (e.g., a, b) within each row.
Disclaimer/Publisher’s Note: The statements, opinions and data contained in all publications are solely those of the individual author(s) and contributor(s) and not of MDPI and/or the editor(s). MDPI and/or the editor(s) disclaim responsibility for any injury to people or property resulting from any ideas, methods, instructions or products referred to in the content.

