Article

Profile of the Effectiveness Factor under Optimal Operating Conditions for the Conversion of Ortho-Xylene to Phthalic Anhydride in a Fixed-Bed Tubular Reactor

by
Luis Américo Carrasco-Venegas
1,*,
Elsa Vásquez-Alvarez
2,*,
José Vulfrano González-Fernández
3,
Luz Genara Castañeda-Pérez
4,
Juan Taumaturgo Medina-Collana
5,
Guido Palomino-Hernández
6,
Daril Giovanni Martínez-Hilario
7 and
Salvador Apolinar Trujillo-Pérez
1
1
Centro de Investigación en Bioenergía, Universidad Nacional del Callao, Callao 07011, Peru
2
Departamento de Engenharia de Minas e de Petróleo, Escola Politécnica, Universidade de São Paulo, Sao Paulo 05508-030, Brazil
3
Instituto Tecnológico de San Luis Potosí, Tecnológico Nacional de México, San Luis Potosí 78436, Mexico
4
Facultad de Ciencias Naturales y Matemática, Universidad Nacional Federico Villareal, Lima 15001, Peru
5
Centro de Investigación en Ingeniería de Procesos de Tratamiento de Aguas, Facultad de Ingeniería Química, Universidad Nacional del Callao, Callao 07011, Peru
6
Facultad de Ingeniería Química y Metalurgia, Universidad Nacional de San Cristóbal de Huamanga, Ayacucho 05001, Peru
7
Facultad de Ingeniería Química, Universidad Nacional del Callao, Callao 07011, Peru
*
Authors to whom correspondence should be addressed.
Submission received: 14 December 2023 / Revised: 8 February 2024 / Accepted: 26 February 2024 / Published: 20 March 2024
(This article belongs to the Special Issue Advances in Catalytic Kinetics)

Abstract

:
The objective of this research is to find the effectiveness factor of the catalyst particles for the most favorable conditions of the phthalic anhydride production in a fixed bed reactor, with the aim of achieving the highest rate of phthalic anhydride production compared to other secondary products and analyzing the areas of lower effectiveness for the modification of the reactor design. Initially, the material and the energy balances in the catalytic bed are solved to obtain the concentration and temperature profiles based on the radius and length of the reactor, using polymath software(Polymath® v6.2 Software Minitab 19 Matlab 2019) with the data from literature. Once the profiles reproducibility was verified using the initial data (inlet temperature, pressure in the reactor, reactor wall temperature, reactor radius and mass flow rate) the experimental design 35 carry out, which generates 243 “experiments”, whose response variable (phthalic anhydride concentration) was obtained using Matlab. Subsequently, the variables were analyzed using the Minitab 18® that, through the response surface analysis method, allowed us to obtain the optimal values of the tested variables. Then, Subsequently, material and energy balances coupled with Fourier and Fick’s laws, along with the effectiveness factor equation, were applied, resulting in the generation of 9 coupled differential equations. Upon implementing the finite difference method, this yielded 90 nonlinear algebraic equations, which were solved using the Polymath software. A total of 78 particles were preselected based on their radial and axial positions to determine the effectiveness factor profile, with values ranging from 0.83 to near unity. The lower values correspond to the points with higher temperature, as evidenced by the calculations performed.

1. Introduction

Packed beds of catalyst particles are the most widely used for gas phase reagents in chemical production. Studies about fixed-bed tubular reactors can be found referring to different internal designs, different applications, microreactors, among others. Researchers have been studying the phenomenon that occurs in them, since the last century [1,2,3]. Fixed bed tubular reactors are used preferentially for exothermic catalytic processes [4], mainly bidimensional models with radial diffusion.
The reaction of the organic compound, phthalic anhydride, is carried out in a fixed bed reactor. This product is of industrial interest, as it serves as a raw material in the production of plastics, solvents, resins, cellulose, agricultural fungicides, plastics, amines, among others [5]. One way to obtain this product is by conversion of o-xylene. In the literature, there are different conversion routes for this process. Historically, the raw material for phthalic anhydride production was the oxidation of naphthalene, which has gradually been replaced by o-xylene over the past 50 years. Considering the quantities produced on an industrial scale [6,7], even a 1% increase in selectivity has a substantial economic impact [8]. An important limitation in optimization processes is having experimental reactor data, operating conditions, and physical property information; considering this aspect, as most data related to the partial oxidation of ortho-xylene is available, we proceeded with its optimization, supplementing missing data with typical values of physical properties. Ivanovskaya and Sembayev [9] comment that there are discrepant conversion routes of o-xylene to phthalic anhydride. However, the reaction is still the focus of different research, both theoretical and experimental as shown below.
Chandrasekharan and Calderbank [10] studied the production of phthalic anhydride from the oxidation reaction of o-xylene in a tubular reactor. The results showed that the incorporation of TiO2 into V2O5, alters the kinetic parameters so that the phthalic anhydride precursors are less evident than in the case of V2O5 alone. Gimeno et al. [11] studied the kinetics of the partial oxidation process of ortho-xylene in a fluidized bed reactor using V2O5/SiO2 catalyst, indicating that the reactor allowed obtaining reliable kinetic data despite the strong exothermic nature of the reaction. A tool to predict or estimate parameters is the mathematical model, which with well-founded hypotheses leads to good results, which can be validated experimentally.
Nikolov and Anastasov [12] researched by means of a mathematical model the effect of the inlet temperature both on the temperature regime in the reactor and the selectivity with respect to the desired product, managing to verify the results experimentally. These results were used to validate the vapor phase oxidation process of o-xylene in phthalic anhydride with air.
The experimental study performed by Papageorgiou et al. [13] in an integral isothermal fixed-bed reactor exposed that the selectivity’s of products some of the catalytic oxidations of o-xylene were strongly influenced by the partial pressure of oxygen. The product is o-tolualdehyde, phthalide and phthalic anhydride. Also, the authors developed a kinetic model for analyzed the dependence of the selectivity’s on the composition of the reaction mixture and the results in both are in excellent agreement.
Andrigo et al. [3] carried out an analyze of the phenomena that occur in fixed bed reactors from the reaction with a single pellet, where reaction and diffusion competing, to reactions where dispersion and heat transfer play a role important.
The deactivation in the oxidation process of o-xylene into phthalic anhydride was studied in a fixed bed industrial reactor by Anastasov [14]. The study was carried out experimentally to obtain the temperature profiles along the length of the reactor. And a mathematical model was used to determine the degree of catalyst deactivation along the bed as a function of time.
Castillo-Araiza and López-Isunza [15] analyzed the performance of hydrodynamics in the packed-bed catalytic reactor. In addition, they used the partial oxidation of o-xylene to study the behavior of redox dynamics of the catalyst surface together with the use of a catalyst activity profile. The catalyst used was vanadium oxide. The same authors presented some perceptions of the fundamental role of catalytic and deactivation kinetics to partial oxidation o-xylene on a commercial V2O5/TiO2 catalyst to both in a steady state and in a transient state in an industrial-scale reactor with packed bed single-tube [16].
Sethapokin et al. [17] developed a two-dimensional heterogeneous mathematical model to predict the molar flux rate of the by-subproduct of phthalic anhydride and maleic anhydride in an industrial fixed-bed reactor. They estimated the kinetic parameters of the catalytic bed from a design of experiments. The simulated results were validated with production data from a case study using V2O5/TiO2 catalyst achieving an accuracy of 1.8% deviation from the production data.
Also, some researchers used computational fluid dynamics (CFD) and ANSYS fluent were used to analyze the conversion behavior of o-xylene to phthalic anhydride or other reactions in a fixed-bed catalytic reactor [18,19,20]. Thus, the aim of this study is to determine the effectiveness factor profile of catalyst particles in a fixed-bed tubular reactor, in order to identify the regions of highest catalyst activity based on the radial and axial position within the reactor. To achieve this, operational conditions within the reactor are optimized, using ortho-xylene concentration as the dependent variable and inlet temperature, tube wall temperature, pressure within the reactor bed, reactor diameter, and mass flow rate as independent variables. Carrasco et al. developed a method for calculating the effectiveness factor profile applied to cyclohexanol dehydrogenation, where the model deduction and calculation procedure are illustrated using numerical techniques and statistical tools [21]. This procedure serves to identify regions of highest catalytic activity, which are primarily dependent on temperature, enabling appropriate precautions to be taken before conducting the respective experiment. Additionally, it allows for the indirect determination of the minimum required reactor length for the given conditions. The mathematical modeling considers the oxidation of o-xylene over a vanadium oxide catalytic medium, utilizing the triangular scheme presented in Figure 1.
This scheme was modified from the literature, that it is found in generalized form diagrams or reaction network for o-xylene oxidation [22,23,24,25,26]. The corresponding reaction mechanism is:
C 8 H 10   +   3 O 2 1 C 8 H 4 O 3   +   3 H 2 O C 8 H 4 O 3   +   15 2 O 2 2 8 CO 2   +   2 H 2 O C 8 H 10   +   21 2 O 2 3 8 CO 2   +   5 H 2 O

2. Reactor Operation
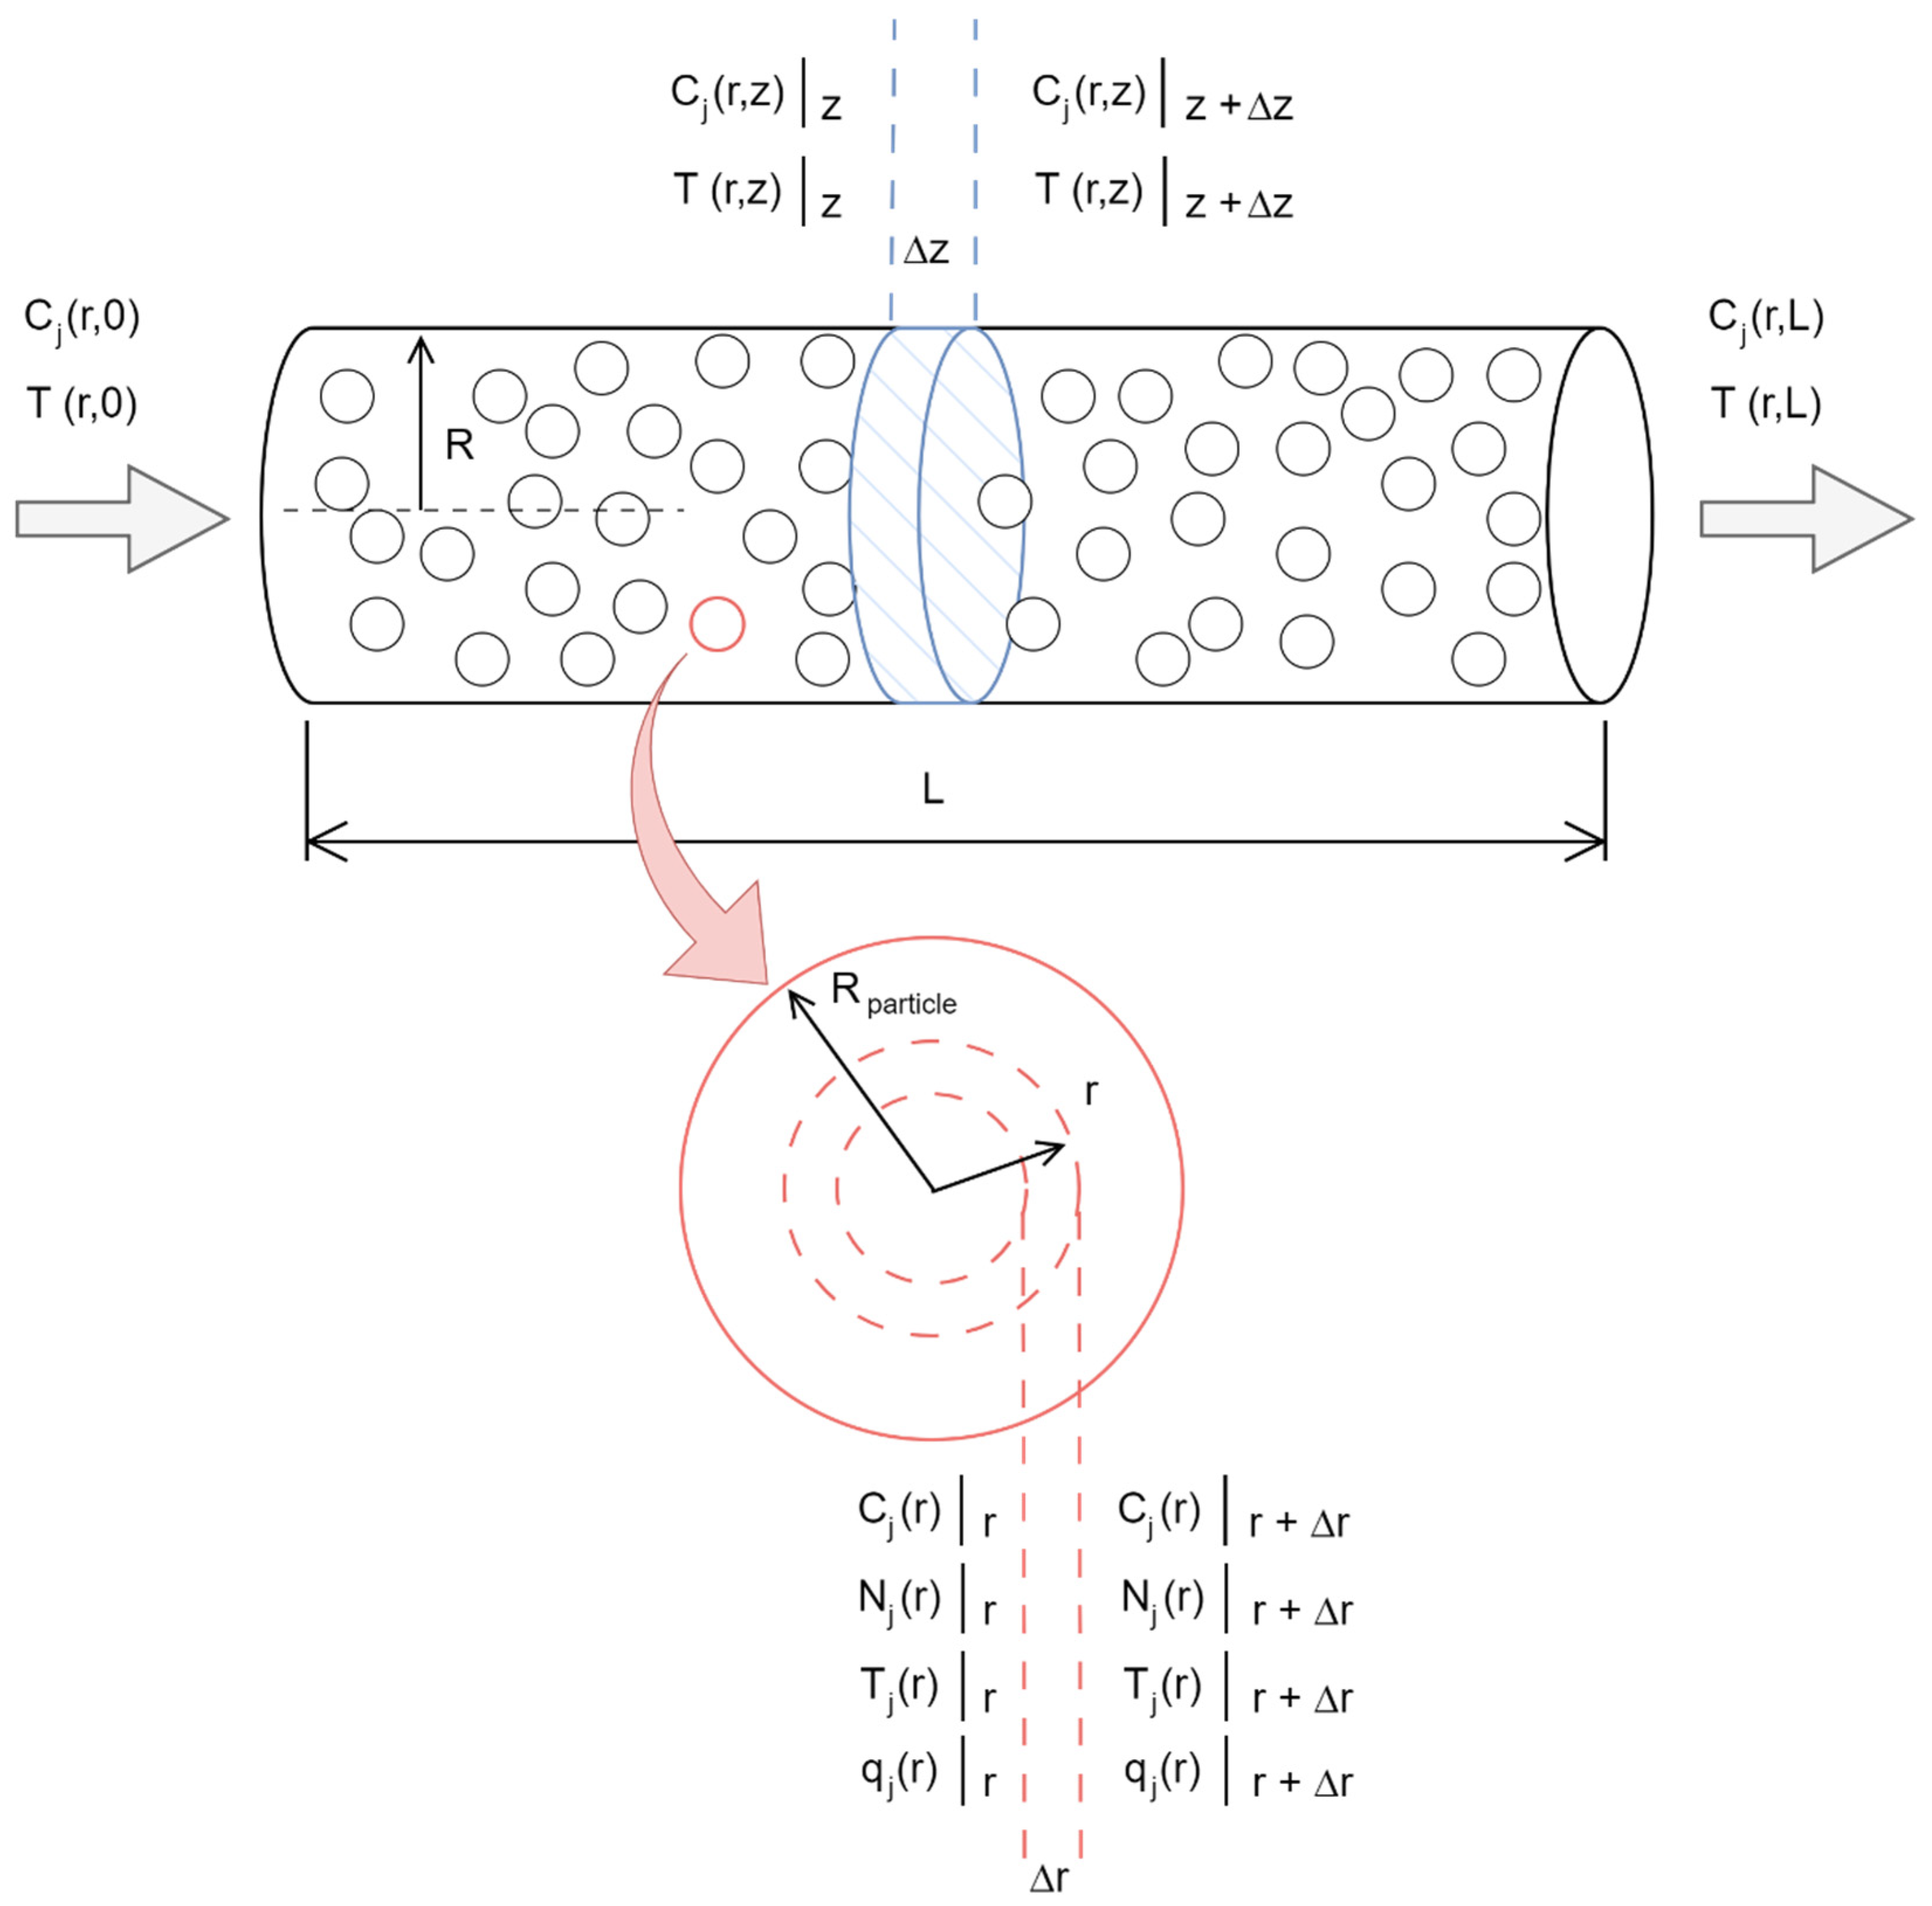
2.1. Reactor Model

In this work, the modeling is based on the scheme presented in Figure 2, where material and energy balances are considered in the reactor bed with radial diffusion. From this, radial and axial profiles of the concentration of each component, denoted as Cj(r, z), and temperature, denoted as T(r, z), are obtained. Subsequently, material balances for each component are performed within the spherical particle of radius r, denoted as Cj(r), and temperature T(r). This must be coupled with Fick’s and Fourier’s laws, resulting in concentration profiles for each component, molar flux density of each component, temperature profile, heat flux density profile, and the effectiveness factor of each particle along the bed using the implicit finite difference method.
It is known that the general equation of mass transport is given by:
C j t   +   V ·   C j   =   ɛ L · N j   +   i N R R i
whose modified form for the equimolar counter-diffusion heterogeneous system is presented as follows:
ɛ L D e r 2 C j r 2   +   1 r C j r V C j z ρ b i   =   1 N R υ i j r i   =   0
the energy balance general form is given by:
ρ C p g T t   +   V   · T   =   · q   +   G e
a suitable simplification of Equation (3) can be written as:
k e r 2 T r 2   +   1 r T r V ρ g C p g T z   +   ρ b i   =   1 N R Δ H R i R i   =   0
when the reaction rate is given by:
R i   =   ρ b ɛ L i   =   1 N R ν i j r i
r i   =   k i p j p O 2
k i   =   exp ( D i W i / T )
The heat generation rate, by chemical reaction, is given by:
G e   =   ρ b i   =   1 N R ( Δ H R i ) r i
the necessary boundary conditions are:
When z = 0, then
C j   =   C j o r           T   =   T 0 r           r   =   ( 0 , R )
When r = 0, then
C j r   =   T r   =   0           z   =   ( 0 , L )
When r = R, then
C j r   =   0           T r   =   h k w T T w           z   =   ( 0 , L )
From Equation (2), is obtained:
C j z   =   ɛ L   D e r V 2 C j r 2   +   1 r   C j r   +   ρ b   ν A   r A ( x , T ) V
The mass transfer equation can be written in terms of the Peclet number for mass transfer given by:
P e M r   =   d p   ×   V D e r
with which, Equation (12) becomes:
C j z   =   ɛ L   d p P e M r   2 C j r 2   +   1 r   C j r   +   ρ b   ν A   r A ( C j , T ) V
The following variable changes are made:
ϕ 1   =   ɛ b   d p P e M r
ϕ 2   =   ρ b   ν A V
and substituting (15) and (16) in (14):
C j z   =   ϕ 1   2 C j r 2   +   1 r   C j r   +   ϕ 2   r A ( C j , T )
Equation (17) is used for all points on the radial position except the center. When r = 0, Equation (17) is indeterminate, therefore, the L’Hôpital’s rule is applied, resulting in:
C j z   =   2 ϕ 1   2 C j r 2   +   ϕ 2   r A ( C j , T )
this equation is valid only in the tube center. Discretizing the Equations (17) and (18) we get:
d C j , k d z   =   ϕ 1   C j , k   +   1 2 C j , k   +   C j , k 1 Δ r 2   +   1 k Δ r   C j , k C j , k 1 Δ r   +   ϕ 2   r A ( C j , k , T k ) ,   j   =   A , B , C     a n d     k     =     1 10 ,
d C j , k d z   =   2 ϕ 1   C j , k   +   1 2 C j , k   +   C j , k 1 Δ r 2   +   ϕ 2   r A ( C j , k , T k ) ,   j   a n d     k     =     0 .
From Equation (4) it is obtained:
T z   =   k e r V   ρ g   C p g   2 T r 2   +   1 r   T r   +   ρ b   Δ H R i   r A ( x , T ) V ρ g   C p g
this equation can be written in terms of the Peclet number for heat transfer shown in:
P e H r   =   d p   G m   C p g k e r
by substituting (22) in (21) we get:
T z   =   d p   G m P e H r   2 T r 2   +   1 r   T r   +   ρ b   Δ H R i   r A ( x , T ) V ρ g   C p g
Following equations indicate variable changes:
ϕ 3   =   d p   G m P e H r
ϕ 4   =   ρ b   ( Δ H R i ) V ρ g   C p g
substituting both equations in (23), is obtained:
T z   =   ϕ 3 2 T r 2   +   1 r T r   +   ϕ 4   r A ( x , T )
L’Hôpital’s rule is applied to solve the previous equation when r = 0, resultant in:
T z   =   2 ϕ 3 2 T r 2   +   ϕ 4   r A ( x , T )
this equation is valid only in the tube center. Discretizing the Equations (26) and (27) we get:
d T k d z   =   ϕ 3   T k   +   1 2 T k   +   T k 1 Δ r 2   +   1 k Δ r   T k T k 1 Δ r   +   ϕ 4   r A ( C j , k , T k ) ,   j   =   A , B , C     a n d     k   =   1 10 ,
d T k d z   =   2 ϕ 3   T k   +   1 2 T k   +   T k 1 Δ r 2   +   ϕ 4   r A ( C j , k , T k ) ,   j   a n d     k   =   0 .
Additionally, it is required the use of the Biot number in the wall as boundary conditions:
B i W   =   R   h k w

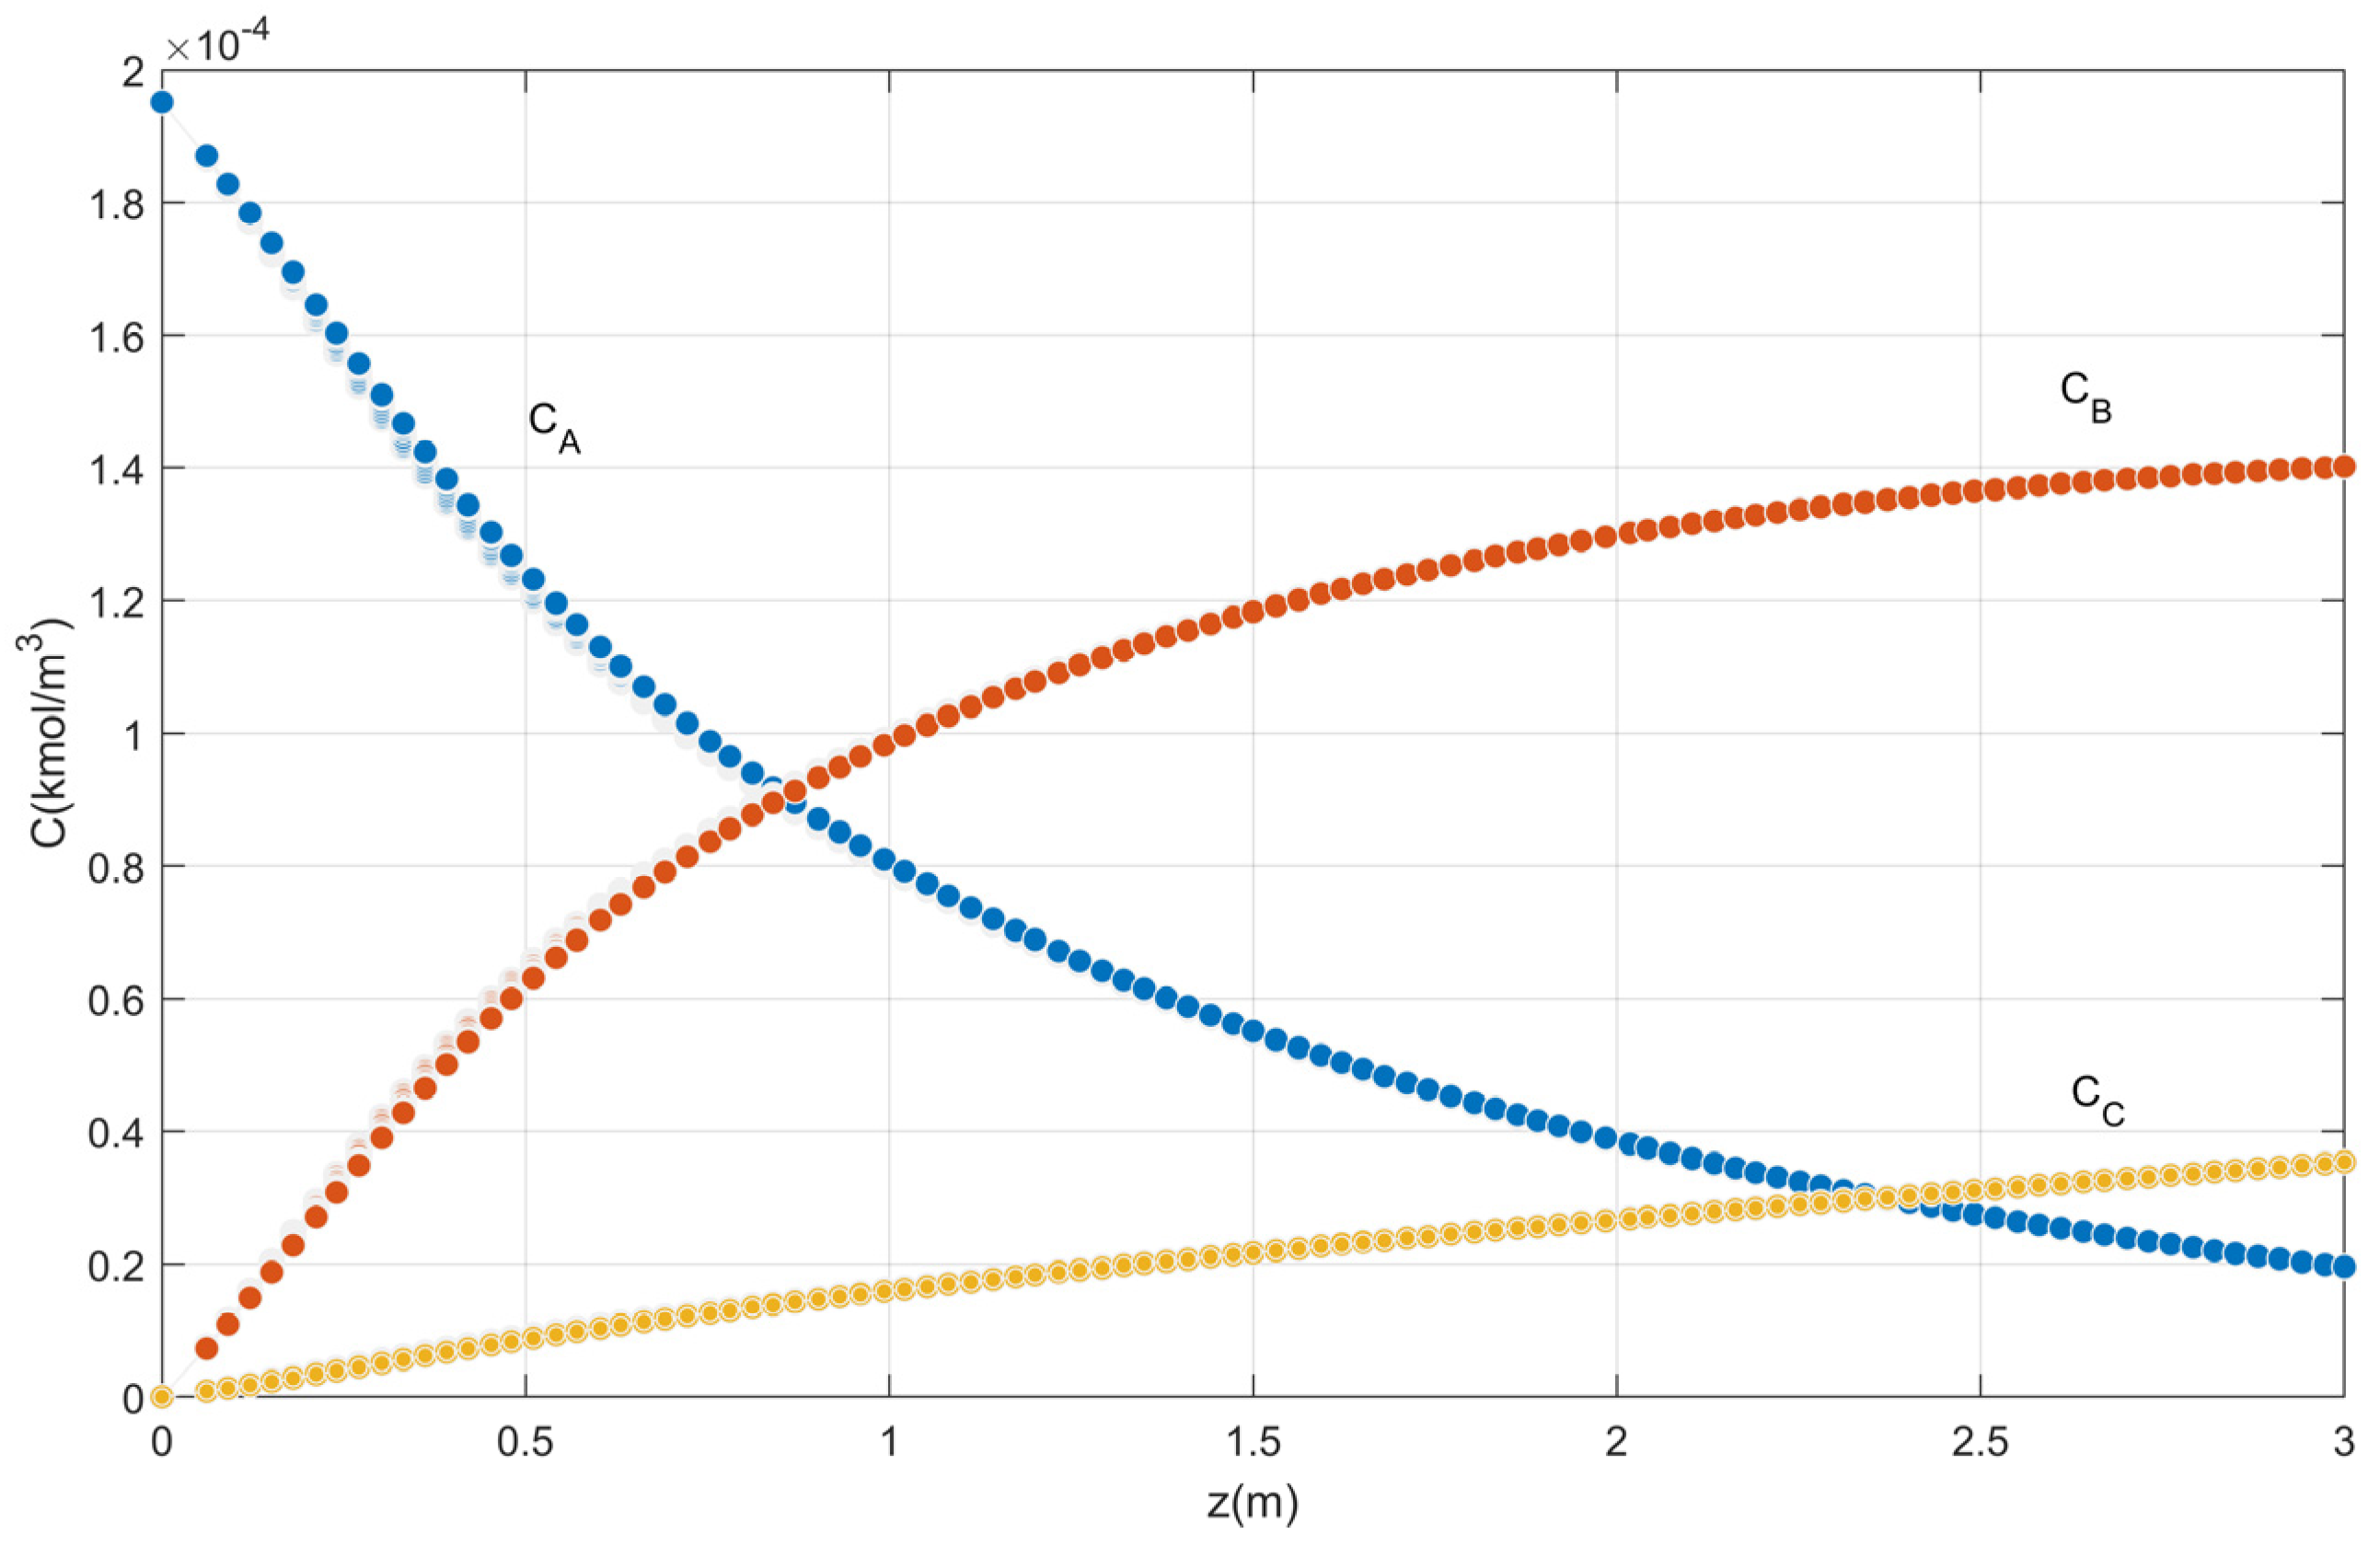
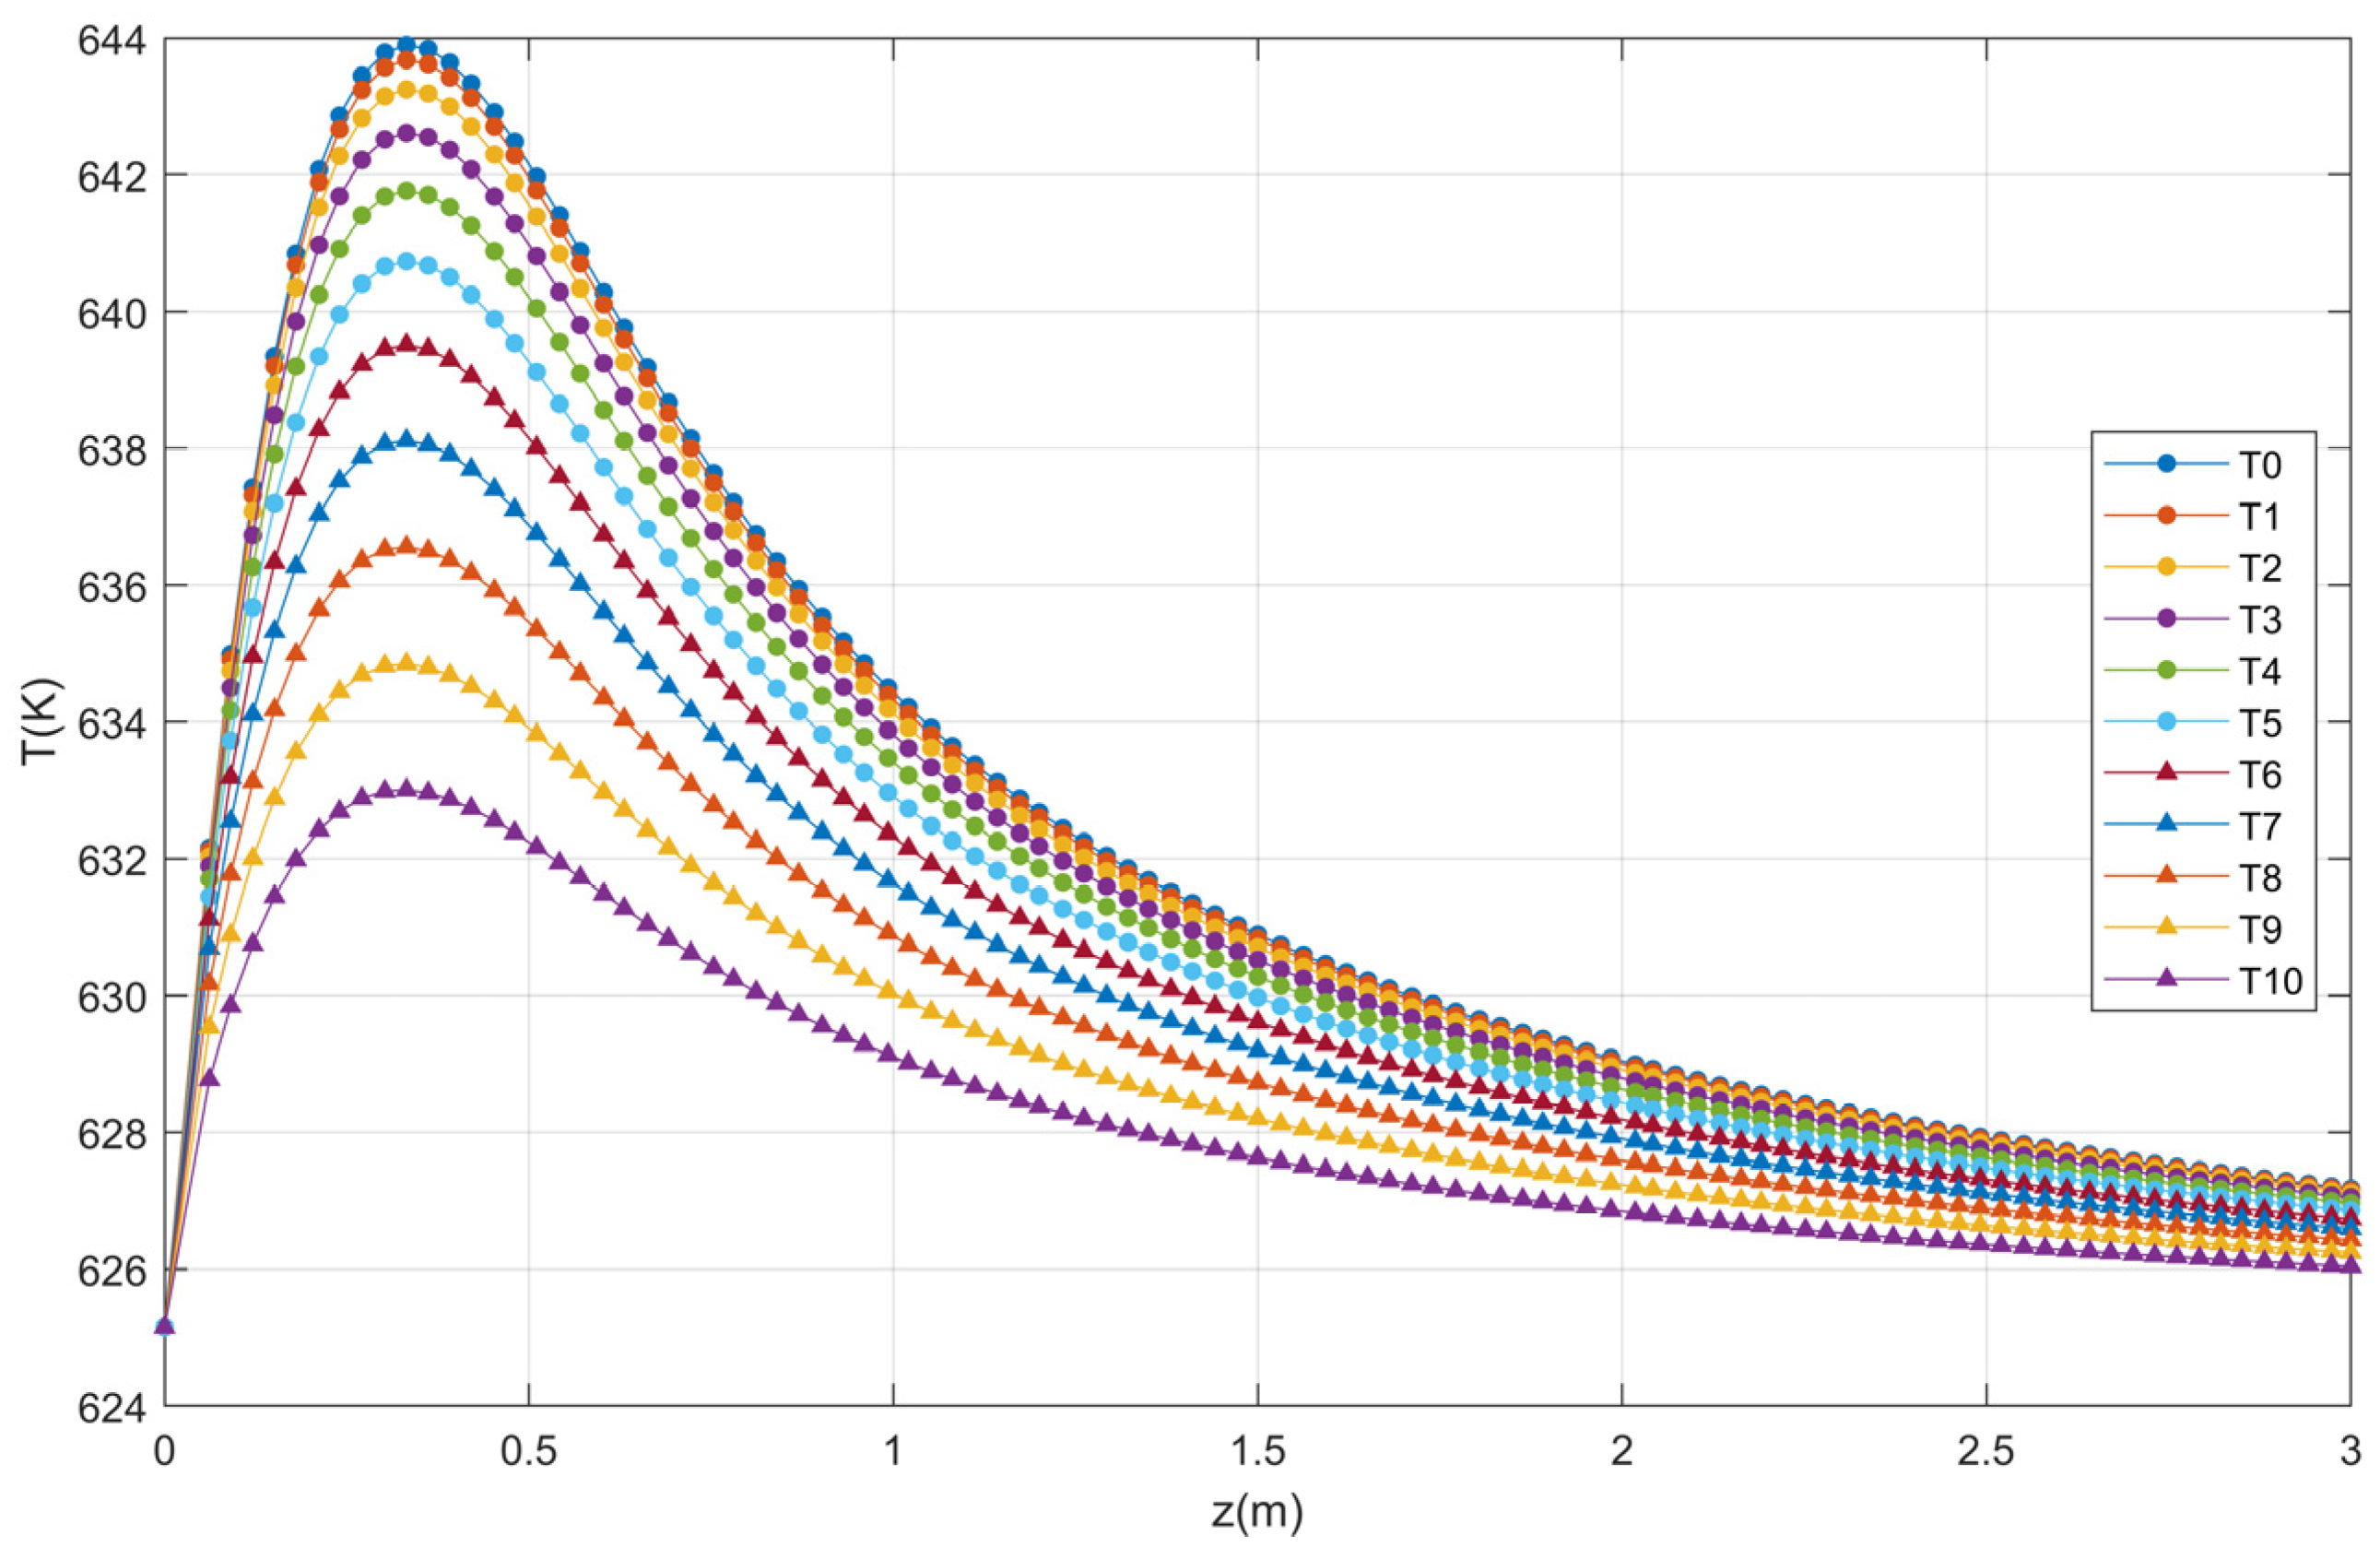
2.2. Reactor Simulation

Garcia-Ochoa et al. [27] used the orthogonal collocation method to solve the material and energy balances. In the present work, the partial differential equations system was solved using the discretization with method of line (MOL) by polymath (v6.2), this with the purpose of validating the model and to identify the factors that influence the optimal conversion of o-xylene to phthalic anhydride. The data used to simulate the process on the catalytic bed and in the catalyst particle are presented in Table 1 and Table 2.
For this work, the following hypotheses was considered: Effective diffusivity of the mixture: this data fluctuates between 10−8 and 10−10 m2/s. In this case, the value of 9 × 10⁻⁹ m2/s has been proposed.
The concentration profiles of o-xylene, phthalic anhydride, and by-products oxidation produced in the catalytic bed for the ten placement points are shown in Figure 3. The phthalic anhydride concentration increases as the reaction progresses through the reactor.
The temperature profiles produced in the catalytic bed as a function of the reactor length are presented in Figure 4. Note that the reaction temperature increases rapidly near the reactor inlet reaching the maximum temperature. This behavior is the same as that reported in literature [27] for the same conditions of T0 = Tw = 625.15 K.
The validation of the fixed bed reactor model was obtained with the reproduction of the profiles (Figure 3 and Figure 4) of Garcia-Ochoa [27]. Note that, after 3 m of length, the temperature variation is minimal. The factors selected for optimization by statistical treatment were the feed temperature, the reactor radius, the temperature of the reactor wall, the total pressure, and the mass flow rate and as a response it is proposed to obtain the highest concentration of phthalic anhydride.

3. Analysis by Design of Experiments

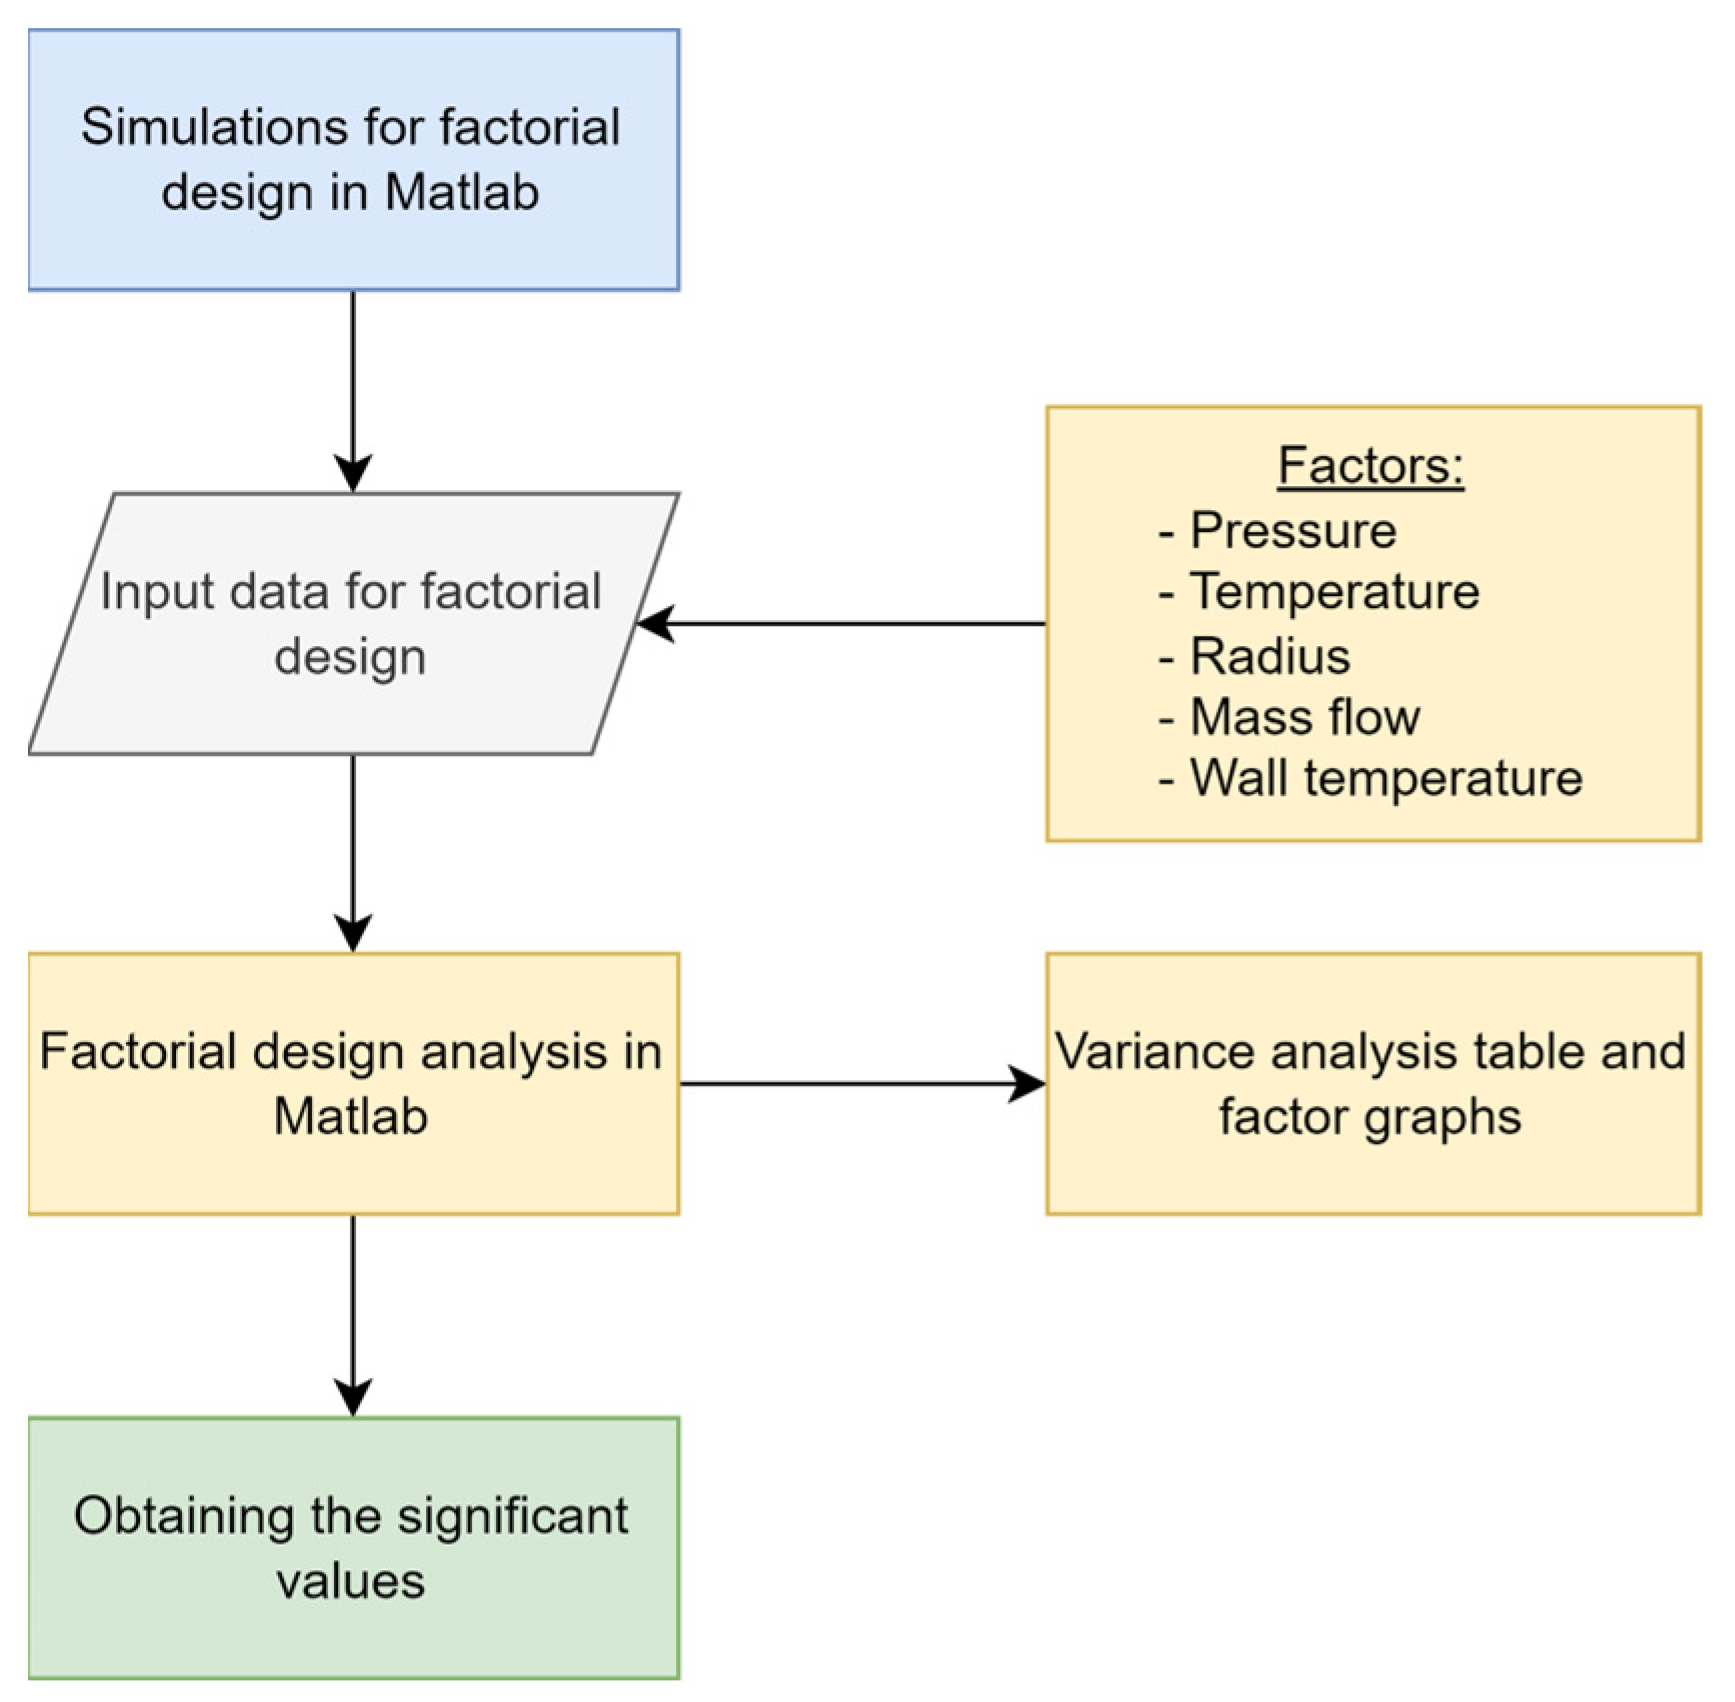
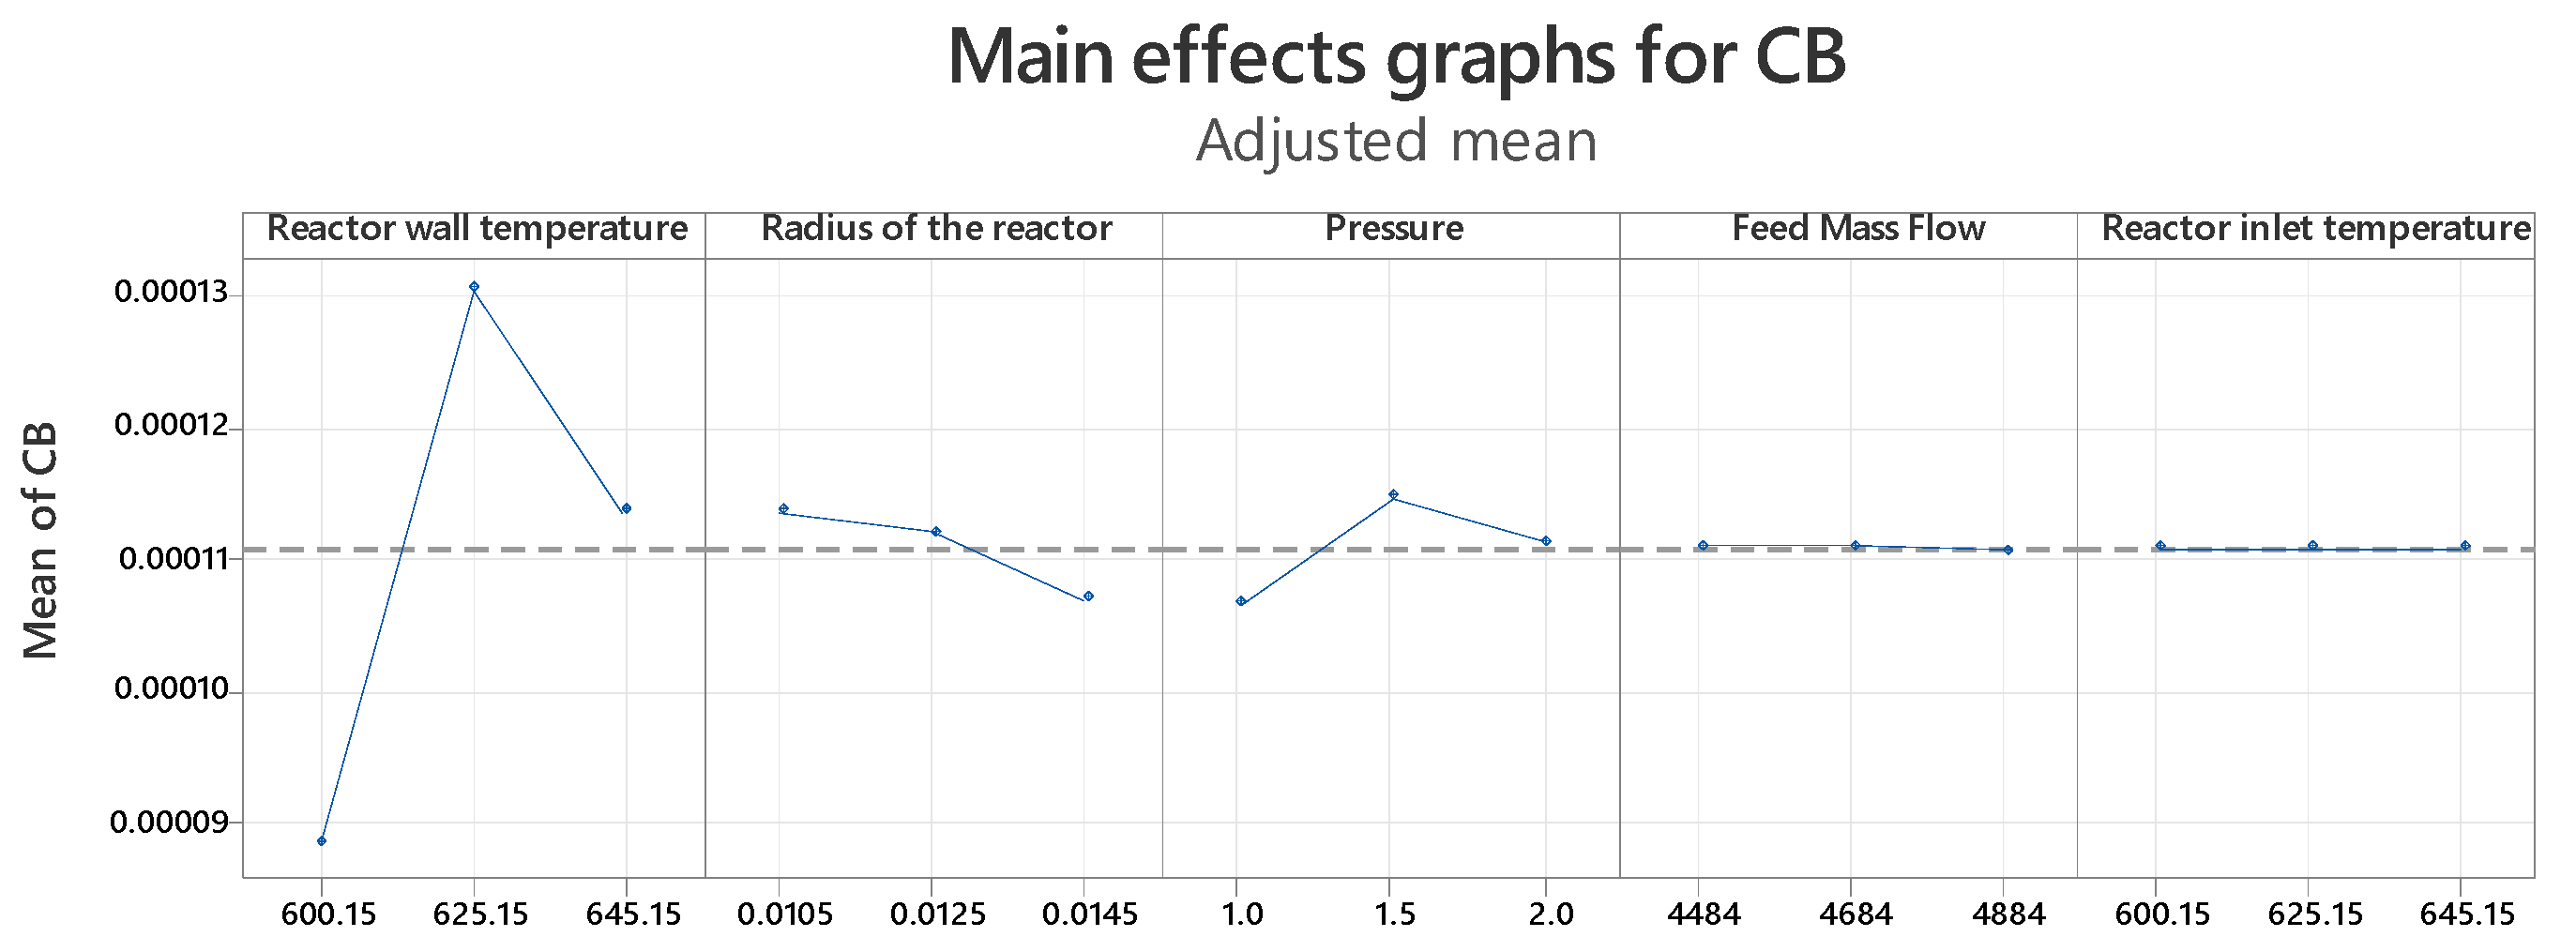
3.1. Factorial Design

The conversion process of o-xylene in phthalic anhydride was analyzed in a fixed-bed tubular reactor in order to find the best concentration at the reactor outlet. The research was carried out using the design of experiments (DOE), which allows studying the relationship between the factors (input variables) and the responses (output variables).
The Matlab® software (R2015a) was used for the data generation through the resolution of the differential equations system, and Minitab was used for optimization. The results of interest were the concentration profiles. In this sense, for an adequate management of the information, the indicator “average value of phthalic anhydride concentration at the reactor outlet” has been defined as a response variable. The flowchart shown in Figure 5 summarizes the process.
The analyses for the experimental design use data involving five input variables and three levels, which are shown in Table 3.
For the experimentation development, the factorial design table has been generated using the Minitab 18® software. The number of experimental runs corresponds to 35 = 243, according to Table 4.
Subsequently, the variance analysis was carried out for the data recorded according to the experimental design according to the Table 5 obtained by Minitab®18.
Thus, Figure 6 shows the graph of main effects for the concentration of phthalic anhydride in the reactor outlet. The three points in each graph represent low, medium, and high values for each factor; the medium values were taken from Table 1 (inlet temperature, external reactor wall temperature, operating pressure, reactor radius, and mass flow rate of ortho-xylene), which likely have the greatest influence on the dependent variable (CB); while the high and low values were assigned with reference to the central point. And it is observed that for the condition Tw = 625.15, radius = 0.0105 and pressure = 1.5, values that maximize the response are obtained.
It is important to note that the mass flow and inlet temperature factors do not represent a significant variation in terms of the values in the response since they have a p value > 0.05 (see Table 5), therefore, it is determined that the flow factors mass and inlet temperature are non-significant variables in the search process for the maximum conversion value. Furthermore, the interactions Tw × Tin, Radius × flow, Pressure × Flow, Pressure × Tin and Flow × Tin are statistically insignificant. The factors Tw, Radius, Pressure and the interactions Tw × Radius, Tw × Pressure, Tw × Pressure and Radius × Pressure are statistically significant.
Since there are non-significant variables in the process, their value can be managed with other criteria, such as the cost of cooling the gases from a highly exothermic process. Taking this premise into account, the assigned values for the non-significant factors are set at Flow = 4684 kg/m2/h and Tin = 625.15 K to continue with the analysis.

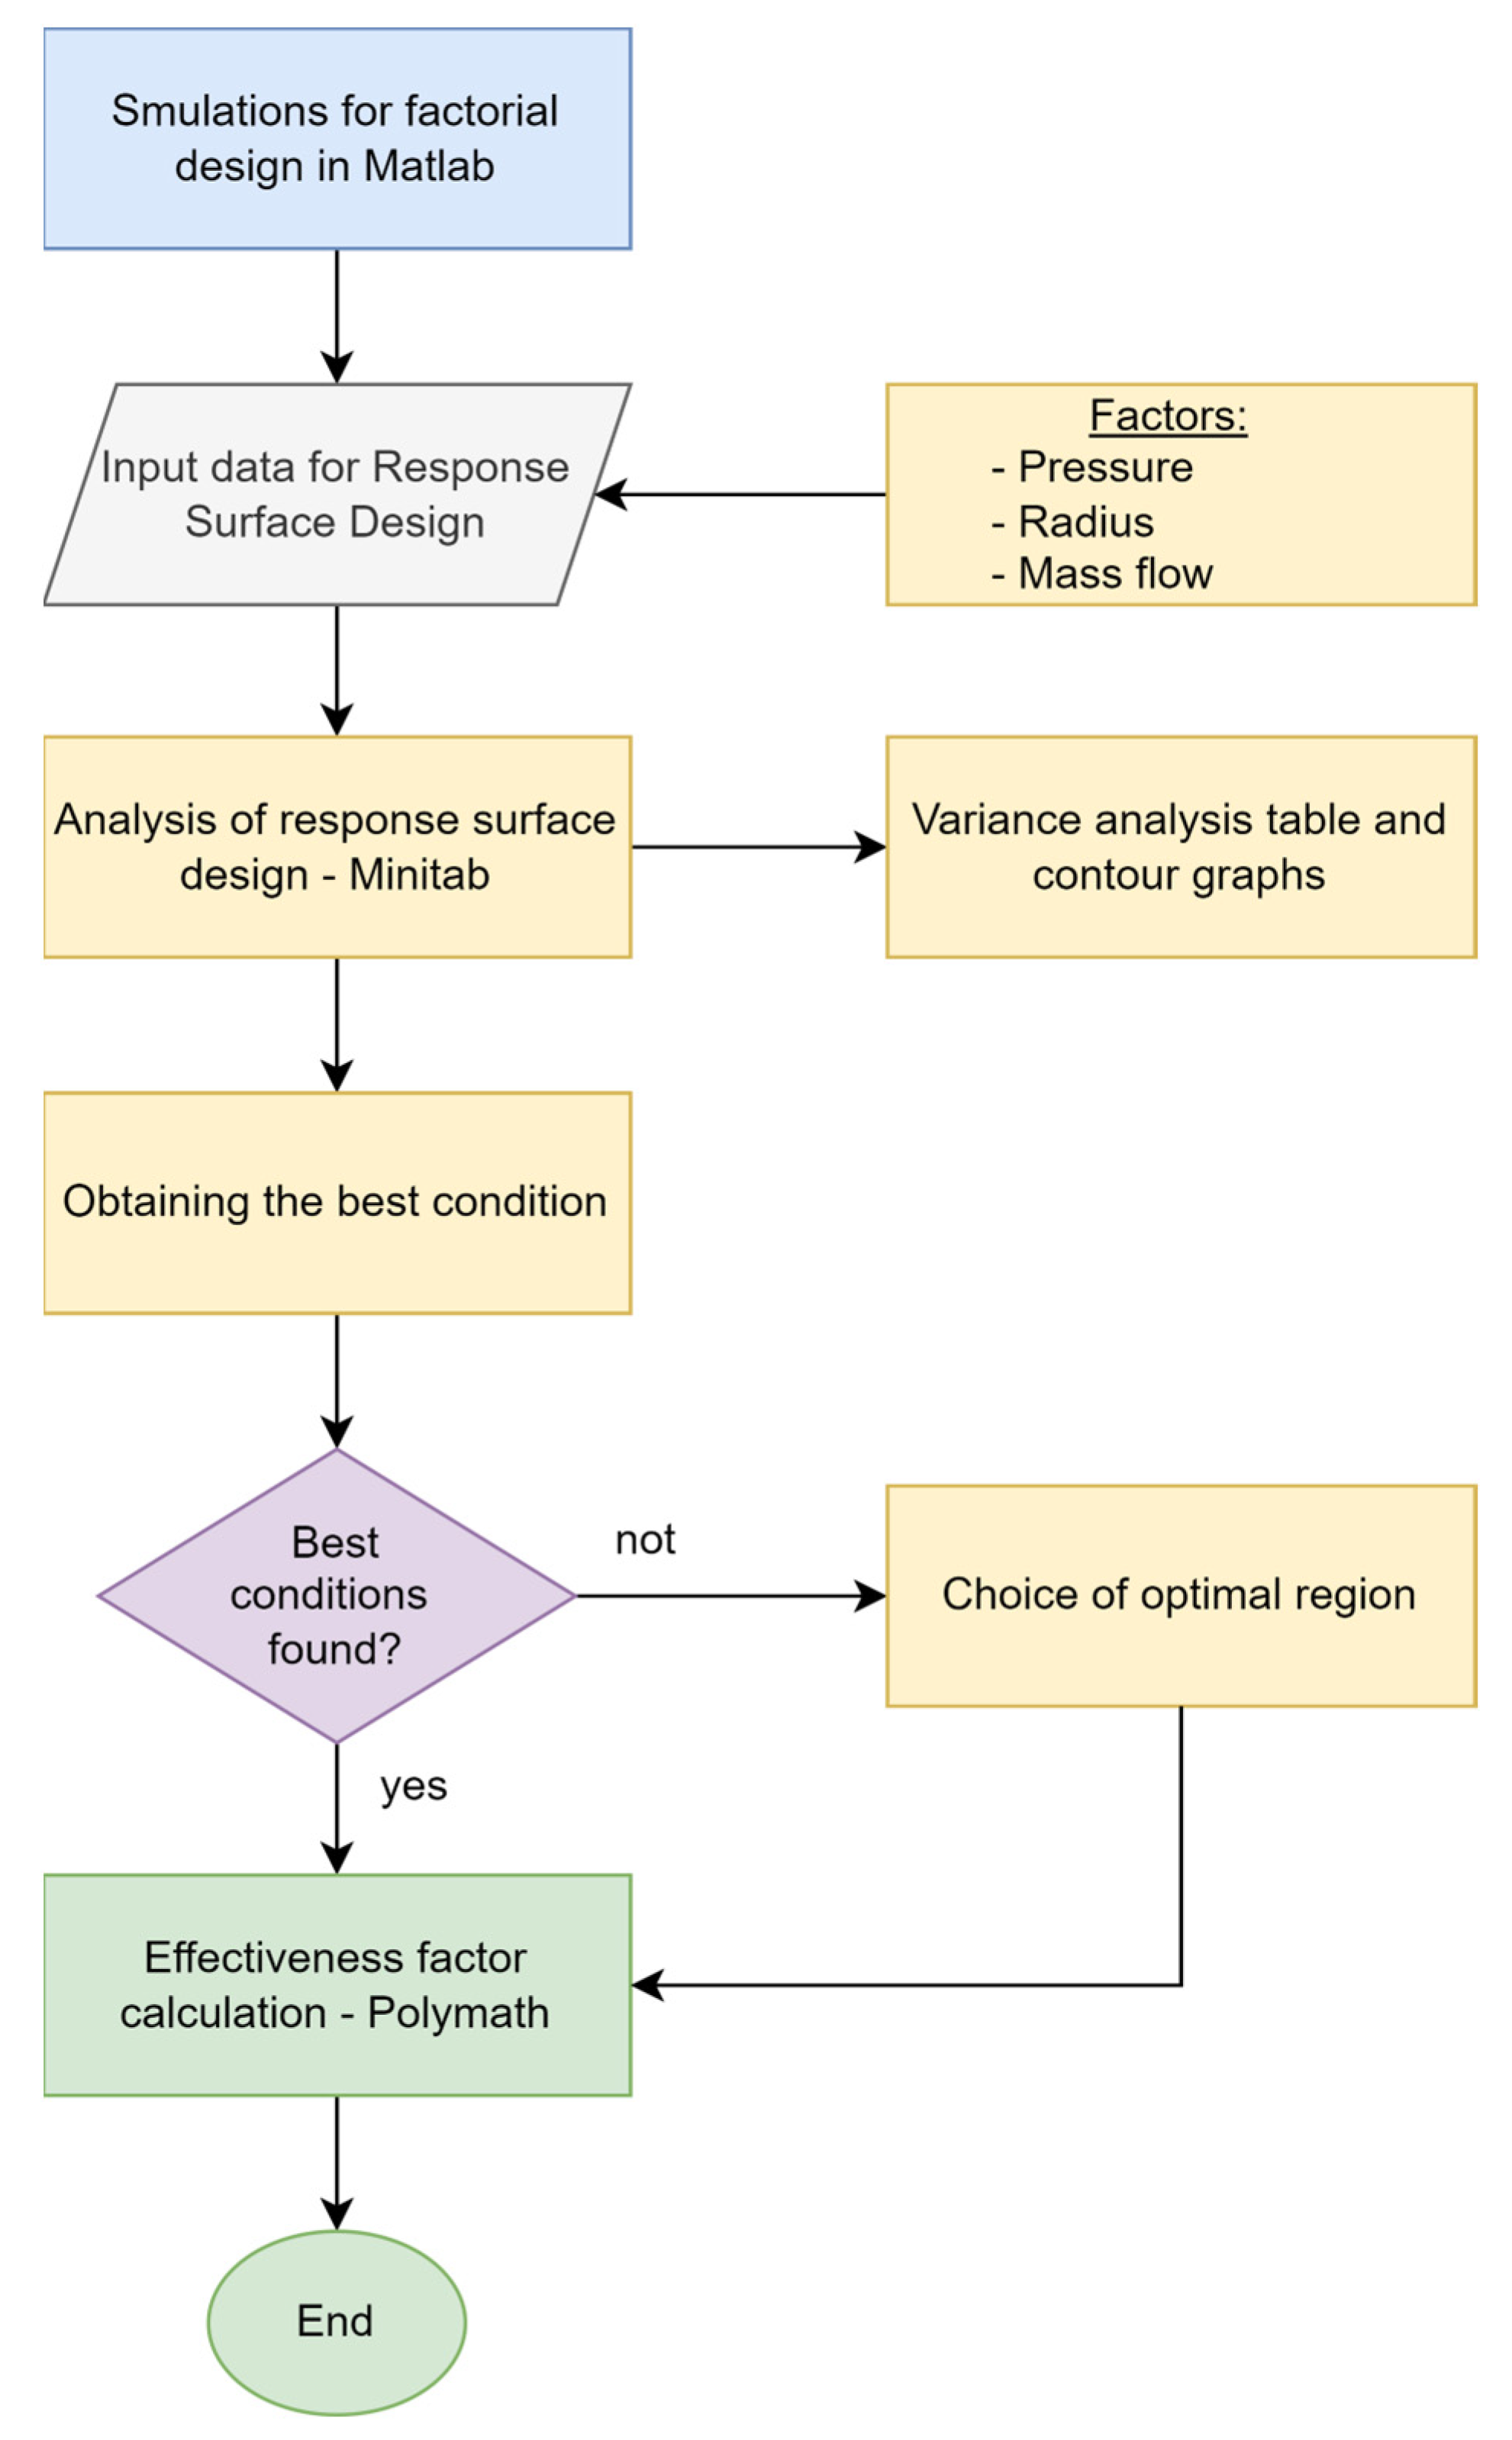
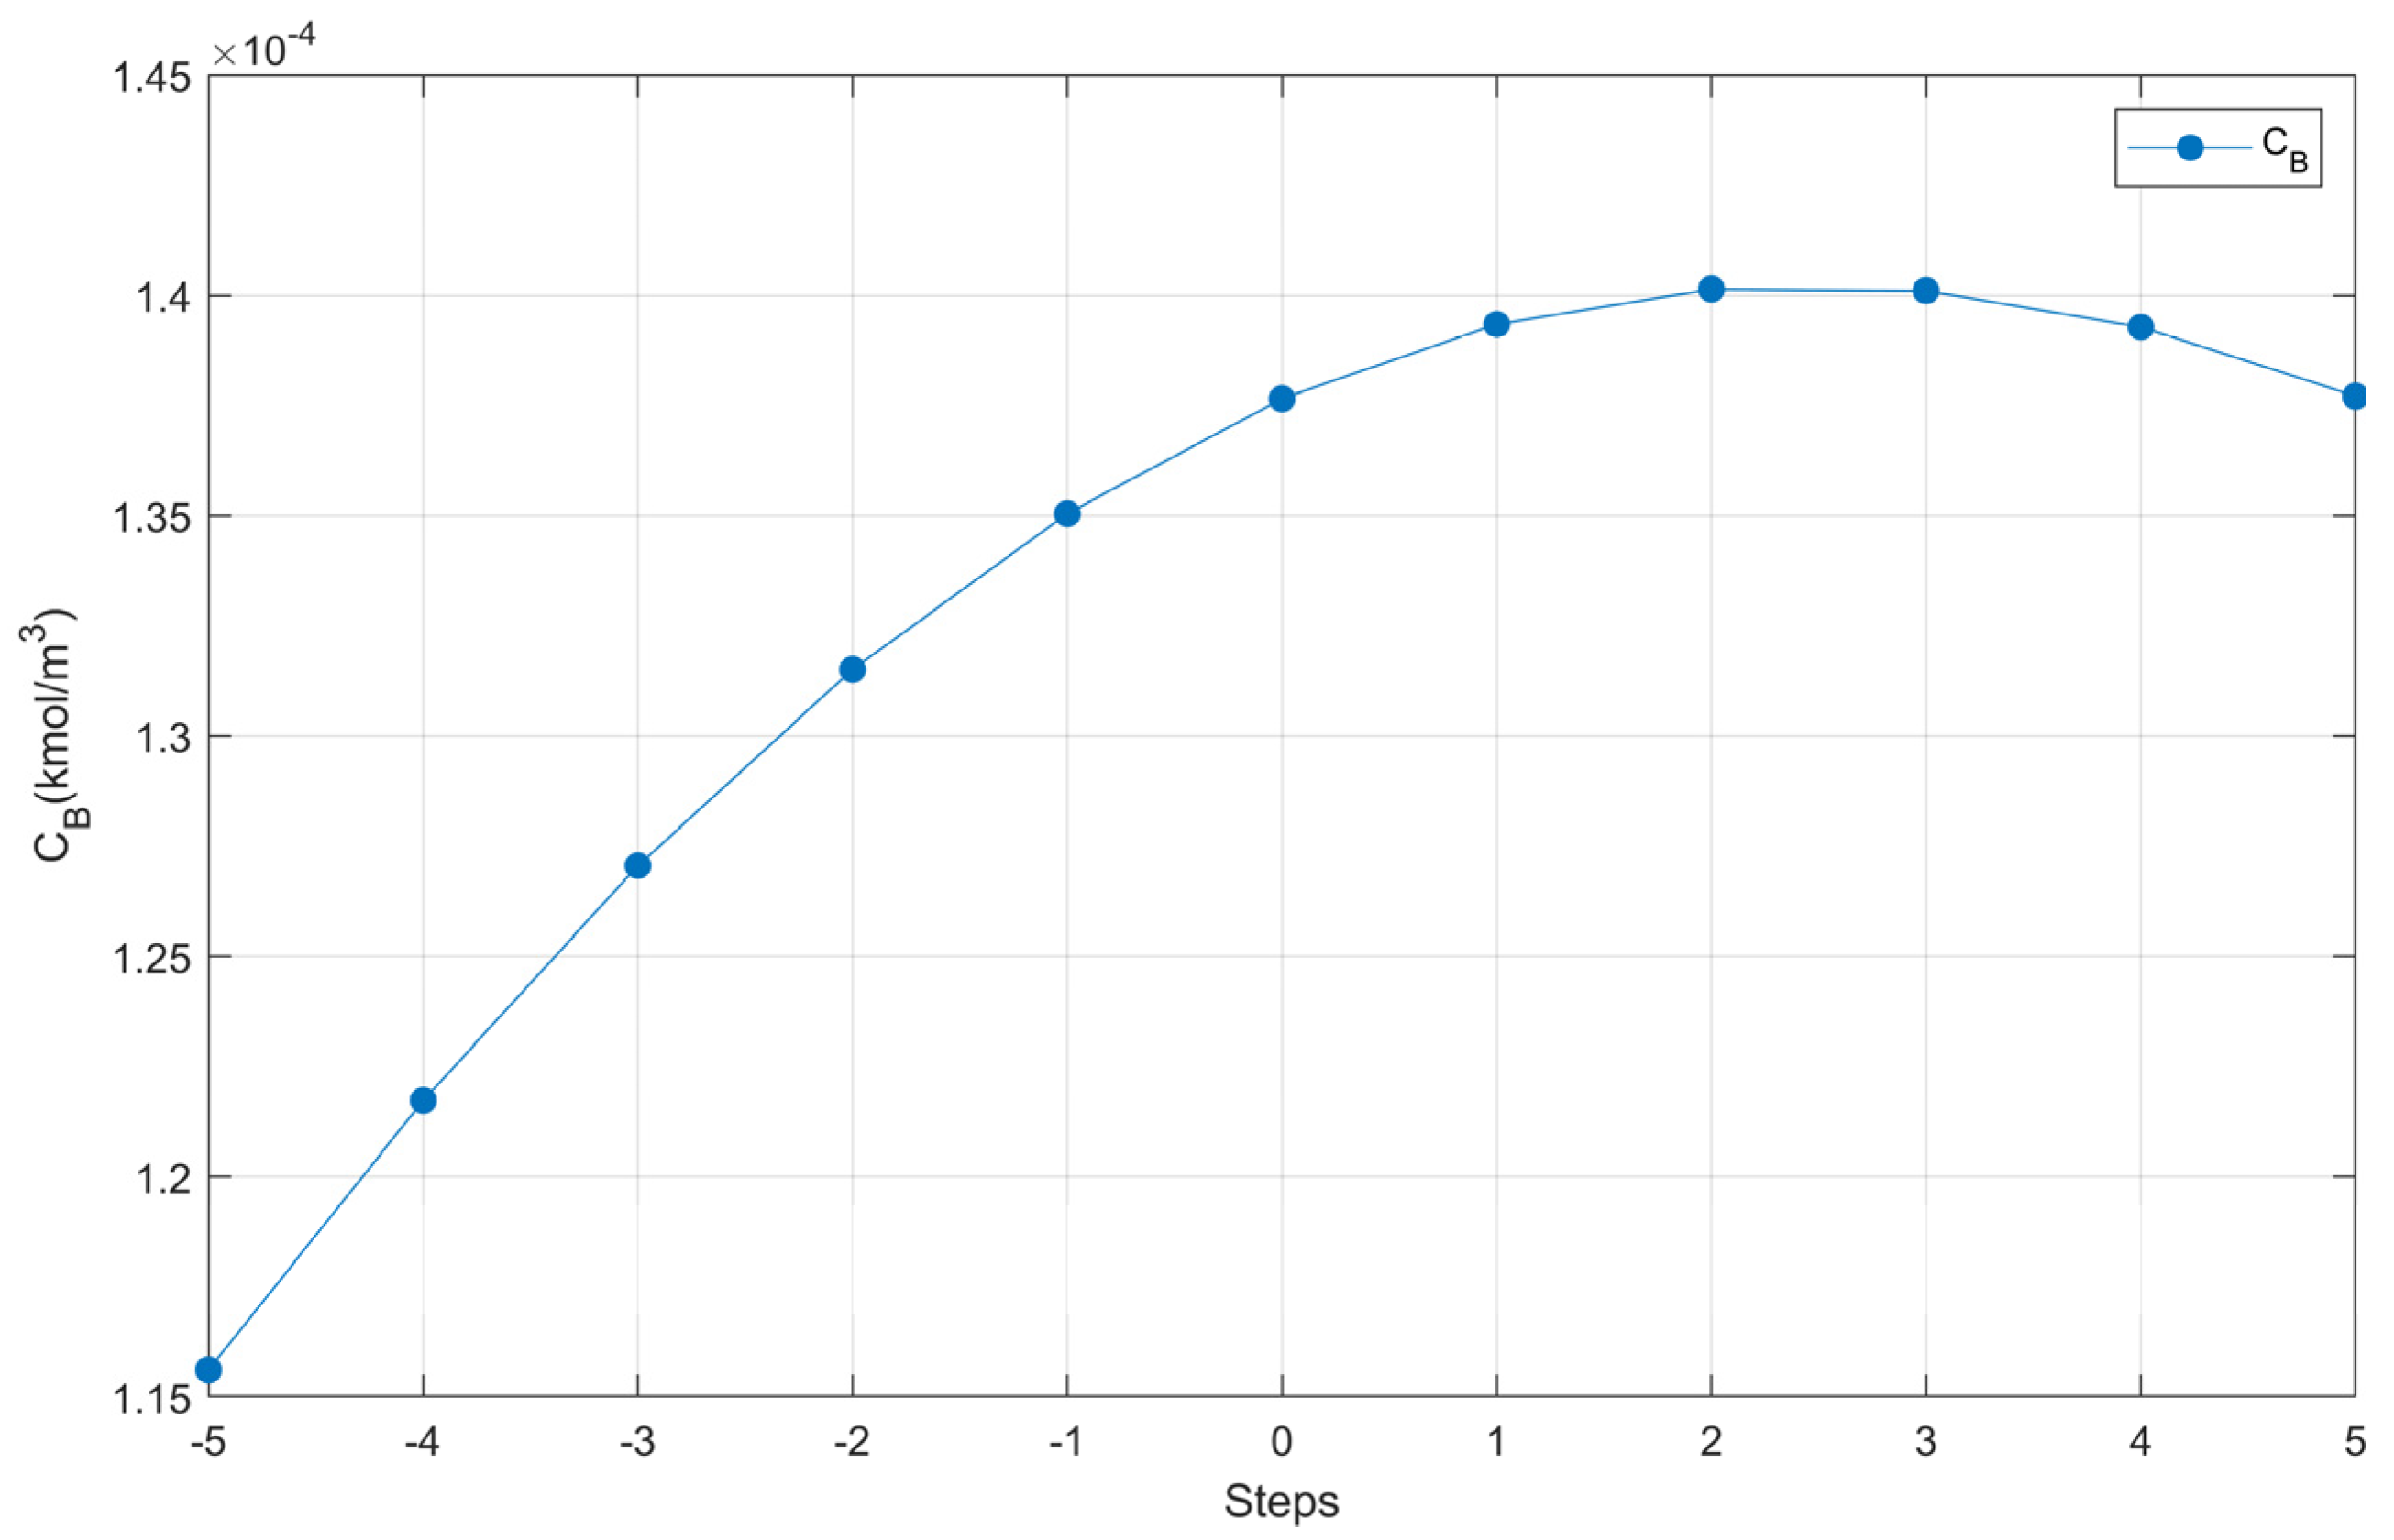
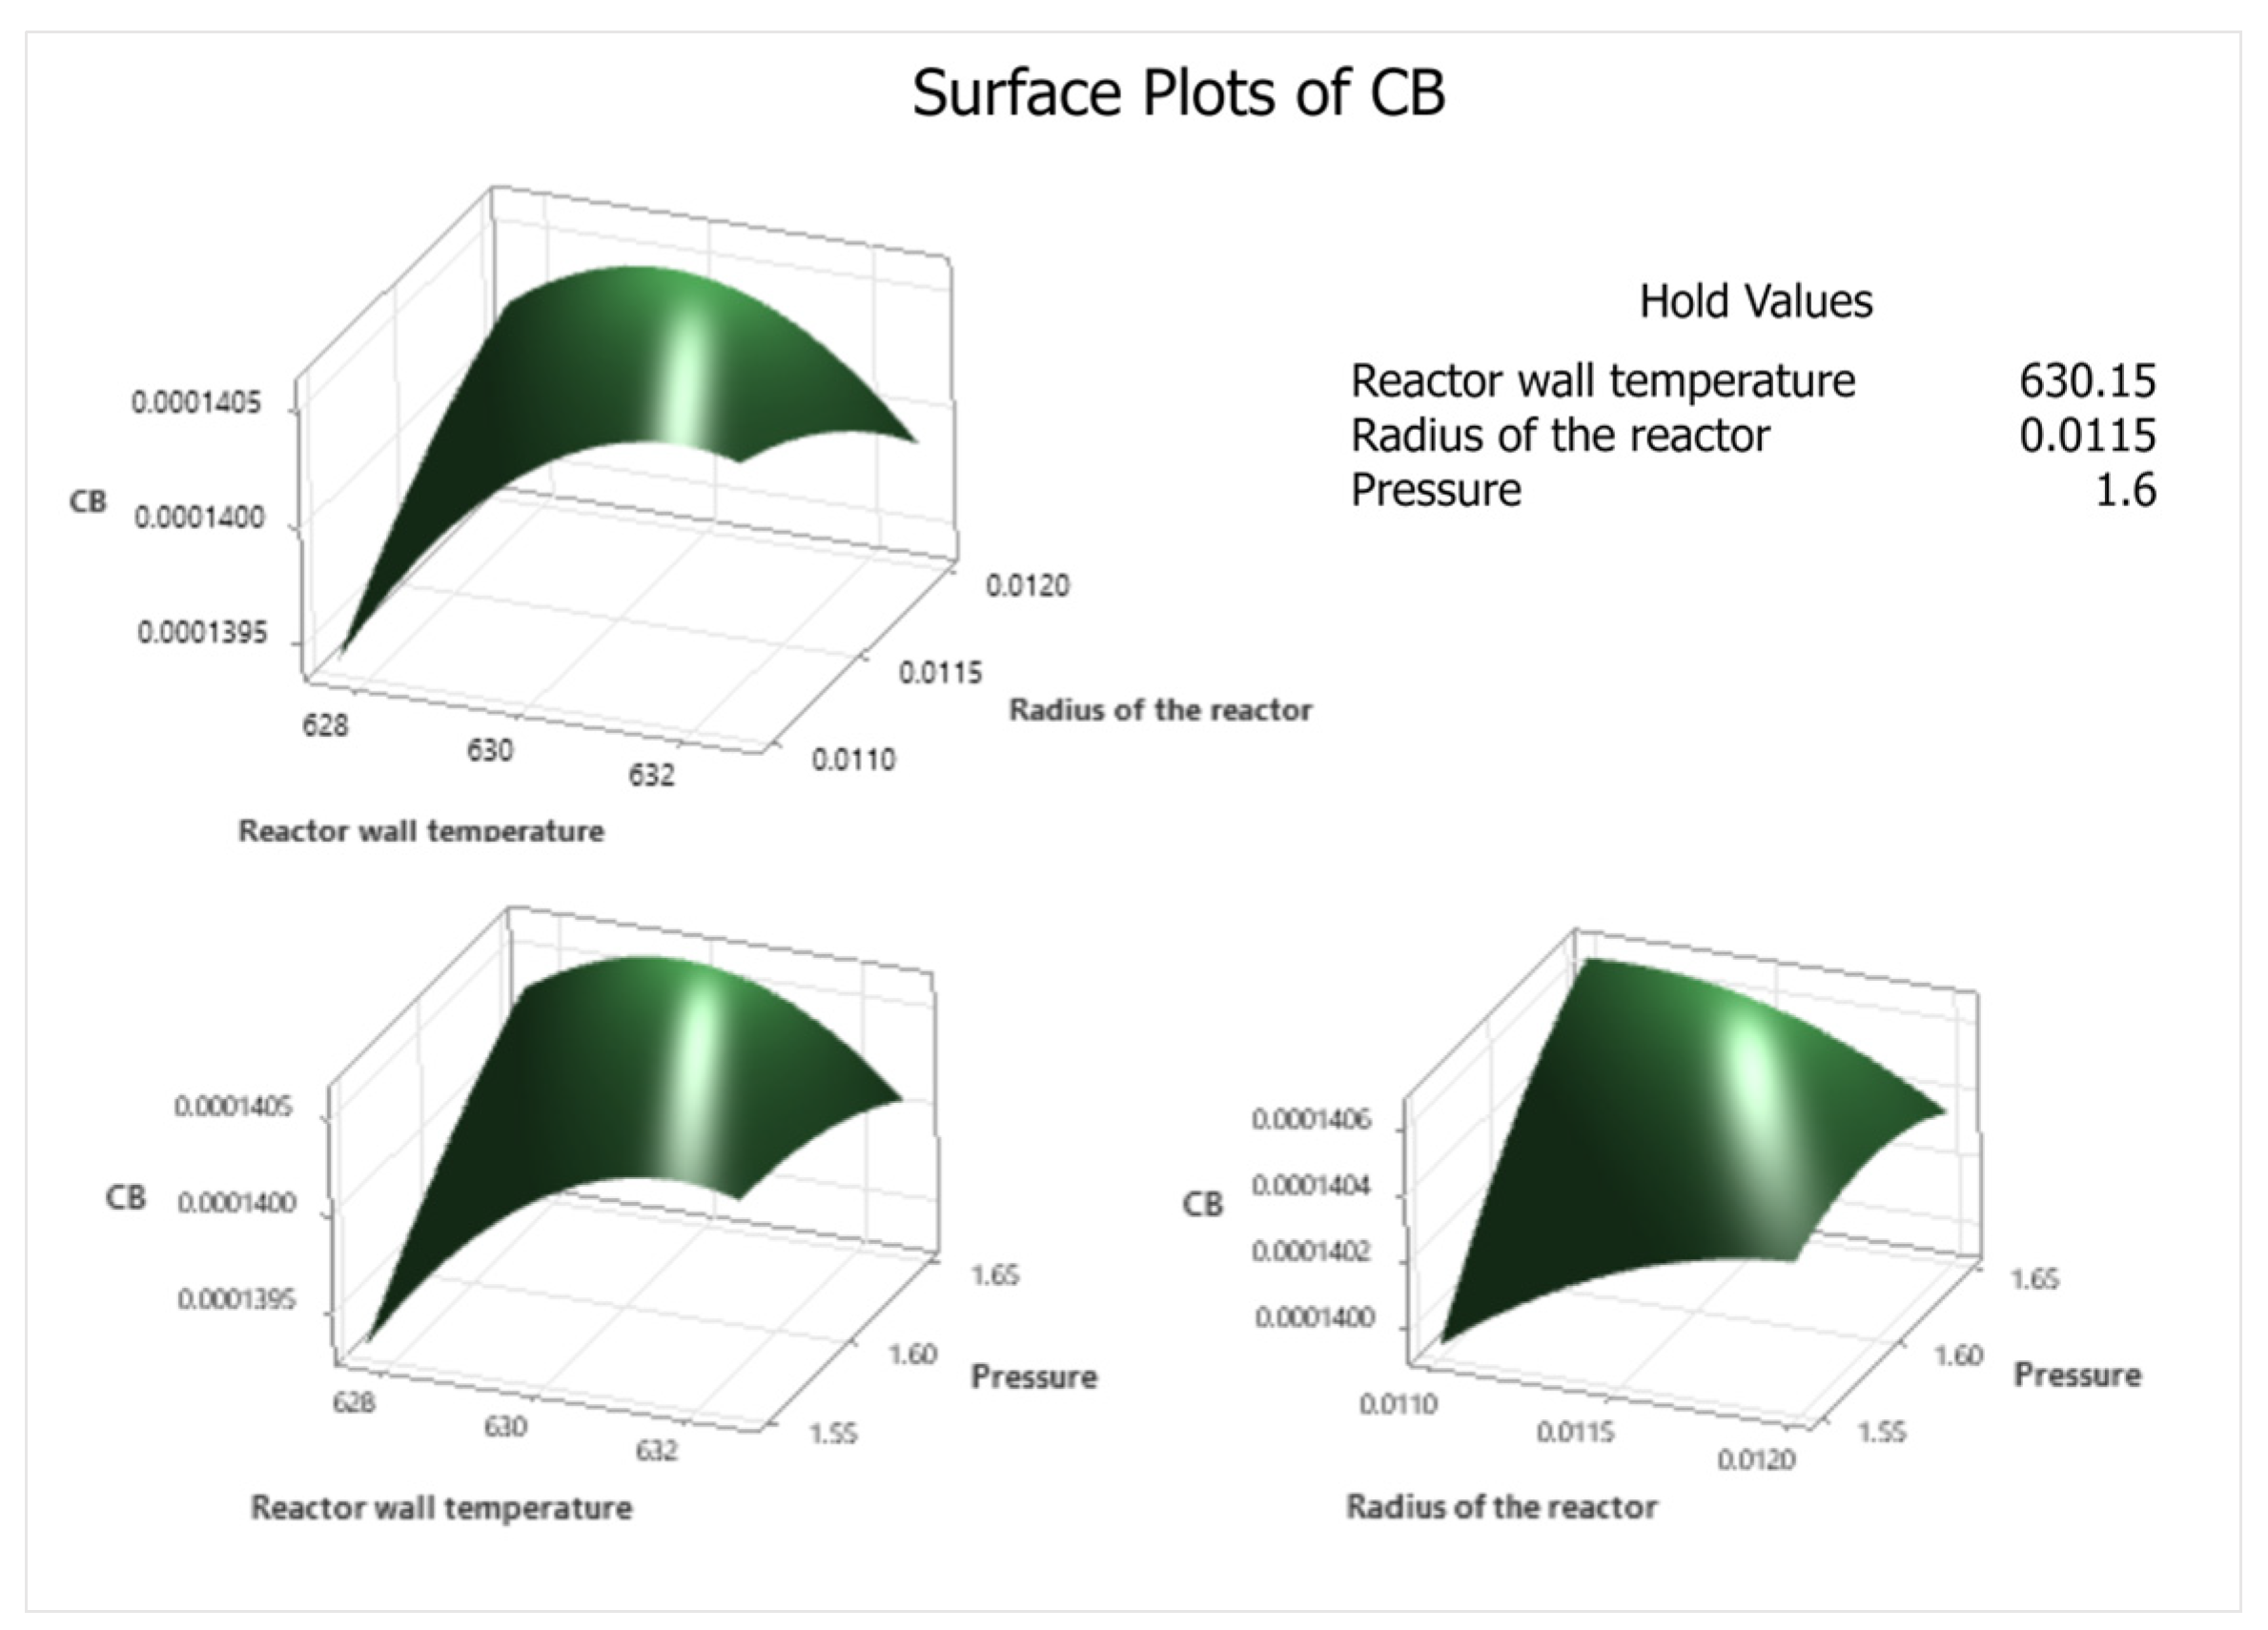
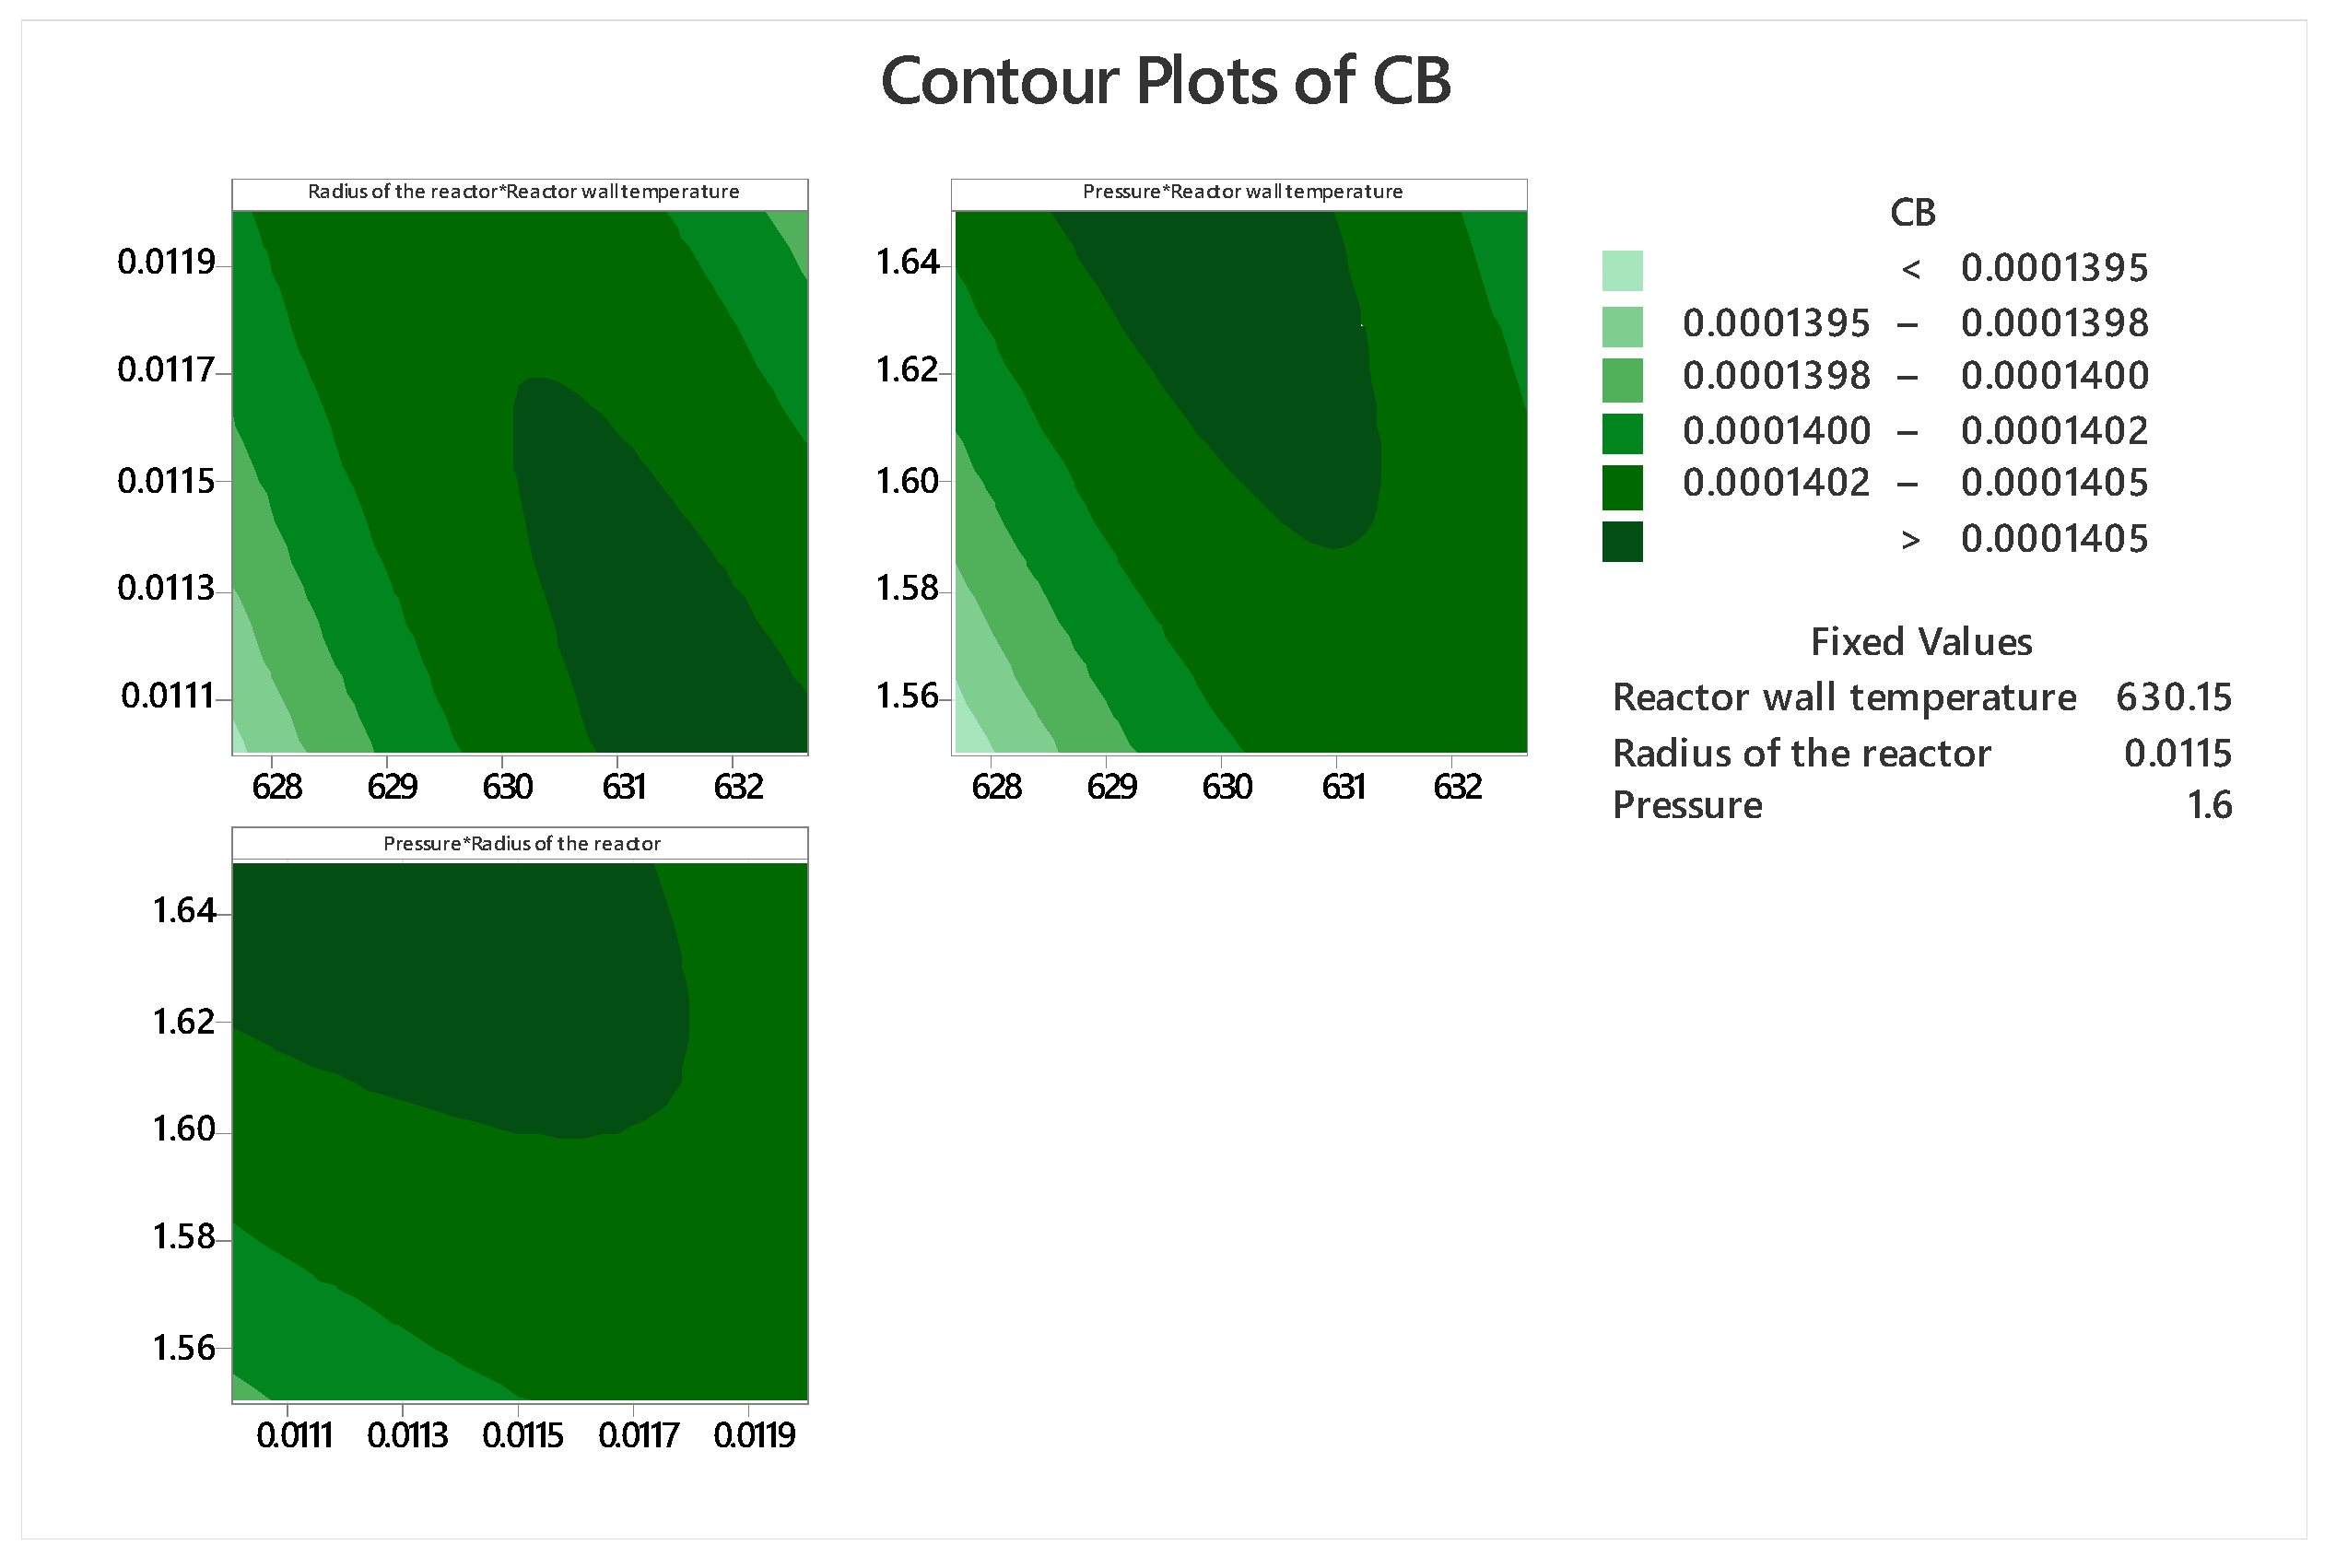
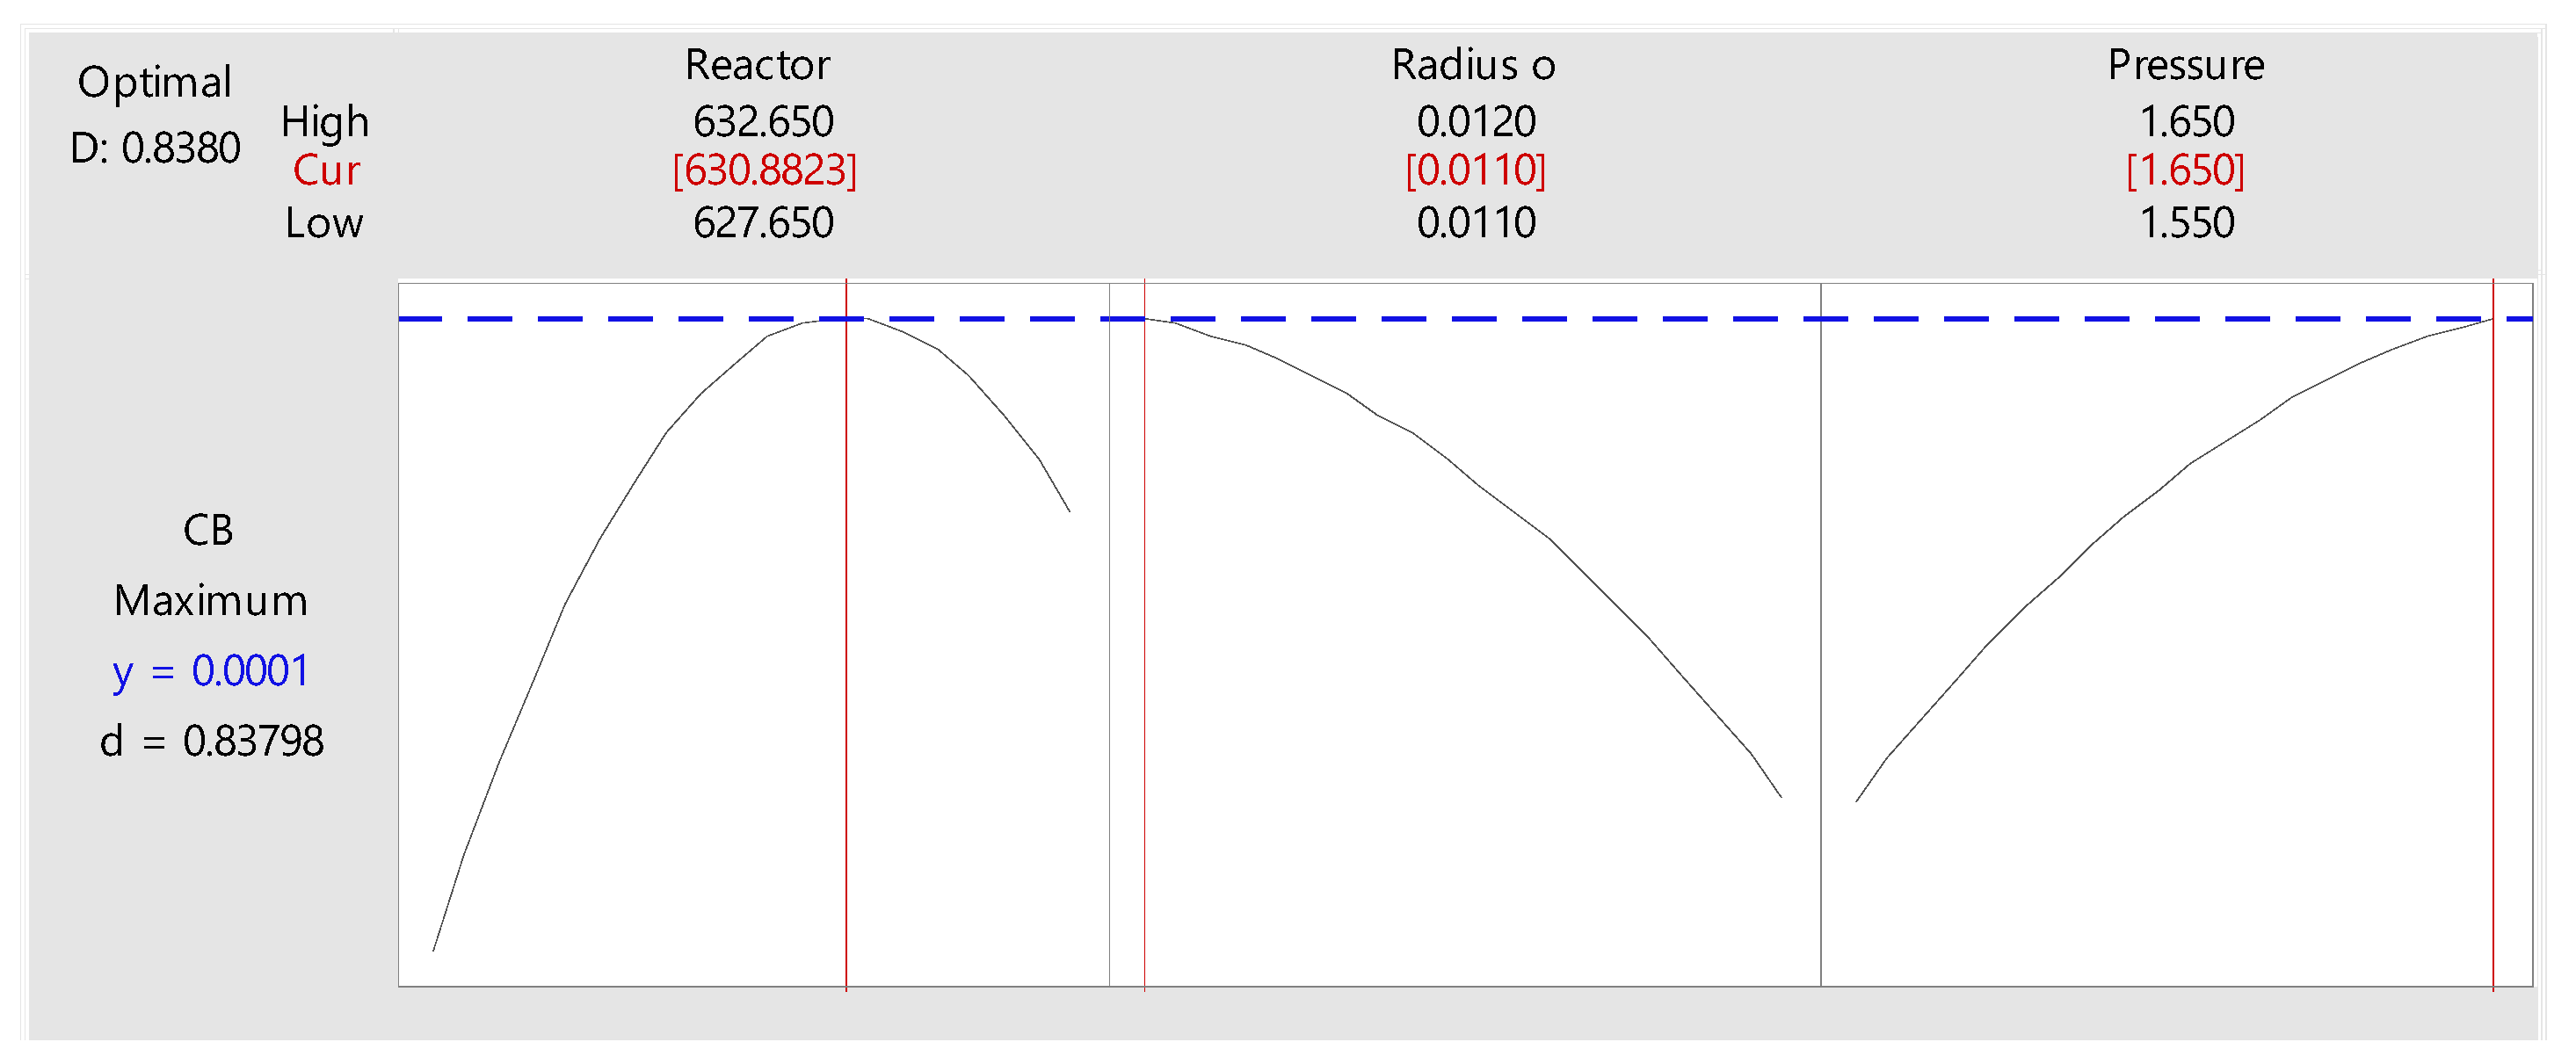
3.2. Response Surface Methodology

After carrying out the factorial design and finding the best configuration of the experimentation levels, the optimal point was search, now applying a response surface design. In Figure 7 is shown for the process.
Firstly, the steepest ascent method was applied to find the optimum region, which was possible with the linear regression equation (LR1, Equation (31)) derived from the factorial design, where only the significant factors are considered, wall temperature, radius, and pressure.
C B   =   2.53   ×   10 4   +   1   ×   10 6   T w 1.697   ×   10 3   ×   R a d i u s   +   5   ×   10 6   ×   P r e s s u r e ,
from this equation, the signs of the coefficients were mainly used and a step size proportional to the magnitude of each factor was set (see Table 6), in order to explore the region before and next to the optimal configuration point.
Then the exploration was carried out with the step size assumed according to Table 7 and considering the fixed mass flow and inlet temperature.
The results presented in Figure 8 show the behavior of CB along the steps.
Note that in Figure 8, in the vicinity of step 2 there is a region of local maximum, so we worked with the coordinates of the points close to step 2 to create the response surface design table, according to the Box-Behnken design, in Minitab 18®, from which 15 runs were obtained, presented in Table 8, which were simulated with the Polymath® program.
The analysis of the response surface design applied to the phthalic anhydride concentration process gave the results show in Table 9: This analysis was made in Minitab 18® to evaluate the significance of the values.
From the analysis of variance, it is inferred that the curvature (with a value p =< 0.05) is significant and the factors involved are significant for the design of the response surface.
With the help of the following regression equation of the response surface (LR2, Equation (32)), considering only the factors that vary, the graphs of Figure 9 and Figure 10 are generated keeping one factor constant at a time, which represent the second order interaction of the factors.
C B   =   0.03091   +   0.00009   T W 0.20323   R a d i u s   +   0.001863   P r e s s u r e 0.3629   R a d i u s 2 0.000036   P r e s s u r e 2 0.000291   T W   R a d i u s 0.000003   T W   P r e s s u r e 0.007129   R a d i u s   P r e s s u r e ,
From the contour and response surface graphs (Figure 9 and Figure 10) it can be inferred that there is no optimal point; but there is an optimal region for the process, where the concentration of phthalic anhydride is greater than 0.0001405 kmol m−3. This means that the experimenter has an optimal operating range provided by the modeling and simulation, which is reflected in the contour graphs. But within this optimal region, the software performs the calculation and suggests the follow optimal point shown in Figure 11.
Then, the optimal results obtained are:
  • Tw = 630.8 K
  • Radius = 0.011 m
  • Pressure =1.65 atm
  • Flow = 4684 kg/m2h
  • Tin = 625.15 K
With these optimal results, the parameters of Table 1 and Table 2 and the differential equations of the reactor presented in Section 2.1, the new concentration profiles of o-xylene, phthalic anhydride and oxidation by-products produced in the catalytic bed are determined for the ten selected points of the reactor, according to Figure 12 and Figure 13.
Note that the optimal phthalic anhydride concentration, both in Equation (32) or LR2 and in the system of differential Equations (19), (20) and (28), (29) is 0.00014033 kmol/m3 and 0.0001405 kmol/m3, respectively, which means an error of 0.12%.

4. Studies on the Catalyst Particle

4.1. Modeling of the Processes

Since the mass transfer process by molecular diffusion in the spherical particle is in the radial direction, and in a steady state; Equation (1) is reduced to:
ε r 2 ( r 2 N j ) r   =   R i
Equation (2) applies to each of the component’s A, B and C respectively, that is:
d N A r d r   +   2 r N A r ρ b ε P i   =   1 N R ν i j r i   =   0
d N B r d r   +   2 r N B r ρ b ε P i   =   1 N R ν i j r i   =   0
d N C r d r   +   2 r N C r ρ b ε P i   =   1 N R ν i j r i   =   0
Then Fick’s Law is applying:
d C A d r   +   N A r D e f   =   0
d C B d r   +   N B r D e f   =   0
d C C d r   +   N C r D e f   =   0
The molecular diffusion heat transfer equation applied to the catalyst particle by simplifying Equation (4) becomes:
1 r 2 ( r 2 q r ) r   =   ρ b i   =   1 N R ( Δ H R i ) r i
d q r d r   +   2 r q r ρ b i   =   1 N R Δ H R i r i   =   0
Now, we use Fourier’s law given by:
d T d r   +   q r k e f   =   0
The effectiveness factor is the ratio between the observed (experimental) reaction rate and the reaction rate without considering diffusional effects (ideal reaction rate); for isothermal systems, its maximum value is 1; however, in non-isothermal systems, its value can exceed 1.
The effectiveness factor expressed in differential form is given by:
d η d r 3 R 3 i   =   1 N R ν i j r i ( C A k , C B k , C C k , T k )   ×   r 2 i   =   1 N R ν i j r i ( C A s , C B s , C C s , T s )   =   0
Substituting Equation (6) in (7) and expressing the pressure in terms of concentration, we have:
r i   =   exp ( D i W i / T )   C j   R g   T   p O 2
Developing the Equations (34)–(36):
d N A r d r   +   2 r N A r ρ b ε P ν 1 A r 1   +   ν 2 A r 2   +   ν 3 A r 3   =   0 ,
d N B r d r   +   2 r N B r ρ b ε P ( ν 1 B r 1   +   ν 2 B r 2   +   ν 3 B r 3 )   =   0 ,
d N C r d r   +   2 r N C r ρ b ε P ( ν 1 C r 1   +   ν 2 C r 2   +   ν 3 C r 3 )   =   0 ,
Based on the proposed reaction scheme, the stoichiometric coefficients are given by:
ν 1 A   =   1   ν 2 A   =   0   ν 3 A   =   1 ,
ν 1 B   =   1   ν 2 B   =   1   ν 3 B   =   0 ,
ν 1 C   =   0   ν 2 C   =   1   ν 3 C   =   1 ,
From Equation (44) we have:
r 1 k   =   exp ( D i W i / T k )   C A k   R g   T k   p O 2 ,
r 2 k   =   exp ( D i W i / T k )   C B k   R g   T k   p O 2 ,
r 3 k   =   exp ( D i W i / T k )   C C k   R g   T k   p O 2 ,
Expanding the Equation (41):
d q r d r   +   2 r q r ρ b ( Δ H R 1 ) r 1   +   ( Δ H R 2 ) r 2   +   ( Δ H R 3 ) r 3   =   0
From the Equation (43):
d η d r 3 R 3 ( v 1 A r 1 C A k , C B k , C C k , T k   +   v 3 A r 3 C A k , C B k , C C k , T k )   ×   r 2 v 1 A r 1 C A s , C B s , C C s , T s   +   v 3 A r 3 C A s , C B s , C C s , T s   =   0
Equations (37)–(39), (42), (45)–(47), (52) and (54) must be solved simultaneously with the help of Equations (48)–(53), with the following boundary conditions:
r   =   0   N A 0   =   0   N B 0   =   0   N C 0   =   0   q 0   =   0 ,
r   =   R   C A 0   =   C A s   C B   =   C B S   C C   =   C C S   T   =   T S .
From the Equations (19)–(21):
N A k N A k 1 Δ r   +   2 N A k k   ×   Δ r ρ b ε P ( ν 1 A r 1 k   +   ν 2 A r 2 k   +   ν 3 A r 3 k ) ,
N B k N B k 1 Δ r   +   2 N B k k   ×   Δ r ρ b ε P ( ν 1 B r 1 k   +   ν 2 B r 2 k   +   ν 3 B r 3 k ) ,
N C k N C k 1 Δ r   +   2 N C k k   ×   Δ r ρ b ε P ( ν 1 C r 1 k   +   ν 2 C r 2 k   +   ν 3 k r 3 k ) .
From the Equations (37)–(39):
C A k C A k 1 Δ r   +   N A k D e f   =   0 ,
C B k C B k 1 Δ r   +   N B k D e f   =   0 ,
C C k C C k 1 Δ r   +   N C k D e f   =   0 .
From the Equation (54):
q k q k 1 Δ r   +   2 q k k Δ r ρ b ( Δ H R 1 ) r 1 , k   +   ( Δ H R 2 ) r 2 , k   +   ( Δ H R 3 ) r 3 , k   =   0 ,
From the Equation (42):
T k T k 1 Δ r   +   q k k e f   =   0 ,
η k η k 1 r 3 R 3 ( v 1 A   r 1 C A k , C B k , C C k , T k   +   v 3 A   r 3 C A k , C B k , C C k , T k )   ( k Δ r ) 2 v 1 A   r 1 C A s , C B s , C C s , T s   +   v 3 A   r 3 C A s , C B s , C C s , T s   =   0 .

4.2. Simulation for Calculating the Effectiveness Factor in Each Particle

To generate the concentration and temperature profile at each point in the reactor, a run was made with the Polymath using the optimized values of the wall temperature, the pressure, and the radius of the reactor; beside the inlet temperature and feed flow and the other data in Table 1. This allows knowing the external conditions of temperature and concentration of each particle located at a point (r,z) of the reactor. A specific point of the reactor had the following conditions used (T = 625.161 K, CA = 1.7486 × 10⁻³ kmol/m3, CB = 0.2809 × 10⁻³ kmol/m3, CC = 1.3606 × 10⁻³ kmol/m3). With these conditions we proceeded to calculate the effectiveness factor of that specific particle. For the other particles, the point (r,z) is again identified, along with their respective concentrations and temperature, and the effectiveness factor is calculated. It is important to highlight that to find the effectiveness factor, the set of Equations (58)–(66) were used for each one of the 78 selected catalyst particles within the reactor bed.
The molar flux density profiles inside the catalyst particle are presented in Figure 14. Note that NA takes negative values since the flow of this component goes in the opposite direction to the reference axis located in the geometric center of the spherical particle. The o-xylene molar flux density is higher at the surface of the particle, compared to what occurs in the center. The NC has a slightly higher value at the surface of the particle, relative to the center.
In Figure 15 is shown the molar concentration of components A, B and C inside the catalyst particle in function radius. In this case, the center of the catalyst particle contains more phthalic anhydride than on the surface. The opposite occurs with o-xylene.
It is observed that there is a very small temperature gradient between the temperature in the center and the surface of the catalytic particle, according to Figure 16. This is due to the very small radius of the particle.
There is an increase in the heat flux density from the center to the particle outside, reaching its maximum value at the end, as observed in Figure 17.
Figure 18 shows the particle effectiveness factor profiles as a function of the reactor radius increment for reactor axial positions different. η has only small variations for Z greater than 1.5, so it is not shown in the figure.
An analysis of the axial profiles of effectiveness factor for the different radial coordinates of the reactor, shows that the factor of effectiveness falls rapidly near the entrance of the reactor and subsequently increases until reaching the maximum point. For example, for the center of the reactor (r0) at the reactor position (z = 0.30), the effectiveness factor is 0.84135 and for the radius of the reactor (r10) for the same position (z = 0.30) η is equal to 0.9342. Already for half of the reactor (z = 1.5) in the center of the reactor (r0) η is equal to 0.97154 and for the radius of the reactor (r10) the effectiveness factor is 0.9763, as shown in Figure 19. Note that the initial drop in the effectiveness factors is due to the increase in temperature (see Figure 4), that is, they are inversely proportional. For a better visualization, only some profiles are shown.

5. Conclusions

With the application of material and energy balances in the catalytic reactor bed, using operating conditions reported in the literature (shown in Table 1), the production rate of phthalic anhydride has been optimized in terms of concentration as the dependent variable, considering the inlet temperature of the reactive mixture, reactor radius, external reactor wall temperature, operating pressure, and mass flow rate of ortho-xylene as independent variables.
This approach also enabled the determination of the length at which the maximum concentration of phthalic anhydride is achieved, surpassing 3 m (see Figure 3). To enhance the conversion of ortho-xylene with a shorter reactor length, the o-xylene oxidation process was analyzed using DOE with five factors and three levels for each factor. The analysis identified significant variables (factors)-wall temperature, reactor radius, and operating pressure, with a p-value < 0.05 (for a 95% confidence level)-crucial for achieving the maximum conversion value in the reactor.
Utilizing the response surface methodology, the optimal region for the ortho-xylene oxidation process was determined. The best configuration included an outer wall temperature of 630.8 K, reactor radius of 0.011 m, operating pressure of 1.65 atm, mass flow rate of 4684 kg/m2/h, and feed temperature of 625.15 K. Under these conditions, the reactor length required to achieve the maximum concentration of phthalic anhydride was found to be 1.5 m (see Figure 12).
The effectiveness factor profiles were obtained for individual catalytic particles at discrete points in the reactor. This allowed establishing a relationship with the temperature profile within the catalytic bed, indicating an inverse correlation between the effectiveness factor and temperature. Given the highly exothermic nature of the reaction, these findings facilitate the appropriate sizing of reactor diameter and length. This, coupled with heat transfer processes, establishes the most favorable conditions for the production of phthalic anhydride from the partial oxidation of ortho-xylene.
The developed method can also be extended to other processes, given the prior knowledge of the kinetic model, operating conditions, physical properties, and geometric dimensions, which must be incorporated into the input data line of the program. Upon execution, it primarily provides the radial and axial profiles of temperature and composition required for calculating the effectiveness factor profile by solving the system of nonlinear algebraic equations.

Author Contributions

Conceptualization, L.A.C.-V. and D.G.M.-H.; methodology, J.T.M.-C. and J.V.G.-F.; software, L.A.C.-V. and D.G.M.-H.; validation, S.A.T.-P. and G.P.-H.; formal analysis, E.V.-A. and J.T.M.-C.; investigation, E.V.-A. and L.G.C.-P.; resources, J.T.M.-C. and G.P.-H.; data curation, S.A.T.-P. and J.T.M.-C.; writing—original draft preparation, L.G.C.-P. and G.P.-H.; writing—review and editing, L.G.C.-P. and J.V.G.-F.; visualization, D.G.M.-H. and E.V.-A.; supervision, J.V.G.-F. and L.A.C.-V.; project administration, J.V.G.-F. and S.A.T.-P.; funding acquisition, L.A.C.-V. and J.T.M.-C. All authors have read and agreed to the published version of the manuscript.

Funding

This work was partially financed by Universidad Nacional del Callao.

Data Availability Statement

Data are contained within the article.

Conflicts of Interest

The authors declare no conflict of interest.

Nomenclature

B i W :Biot number on the reactor wall (dimensionless)
C j :Molar concentration of the component j (kmol m−3)
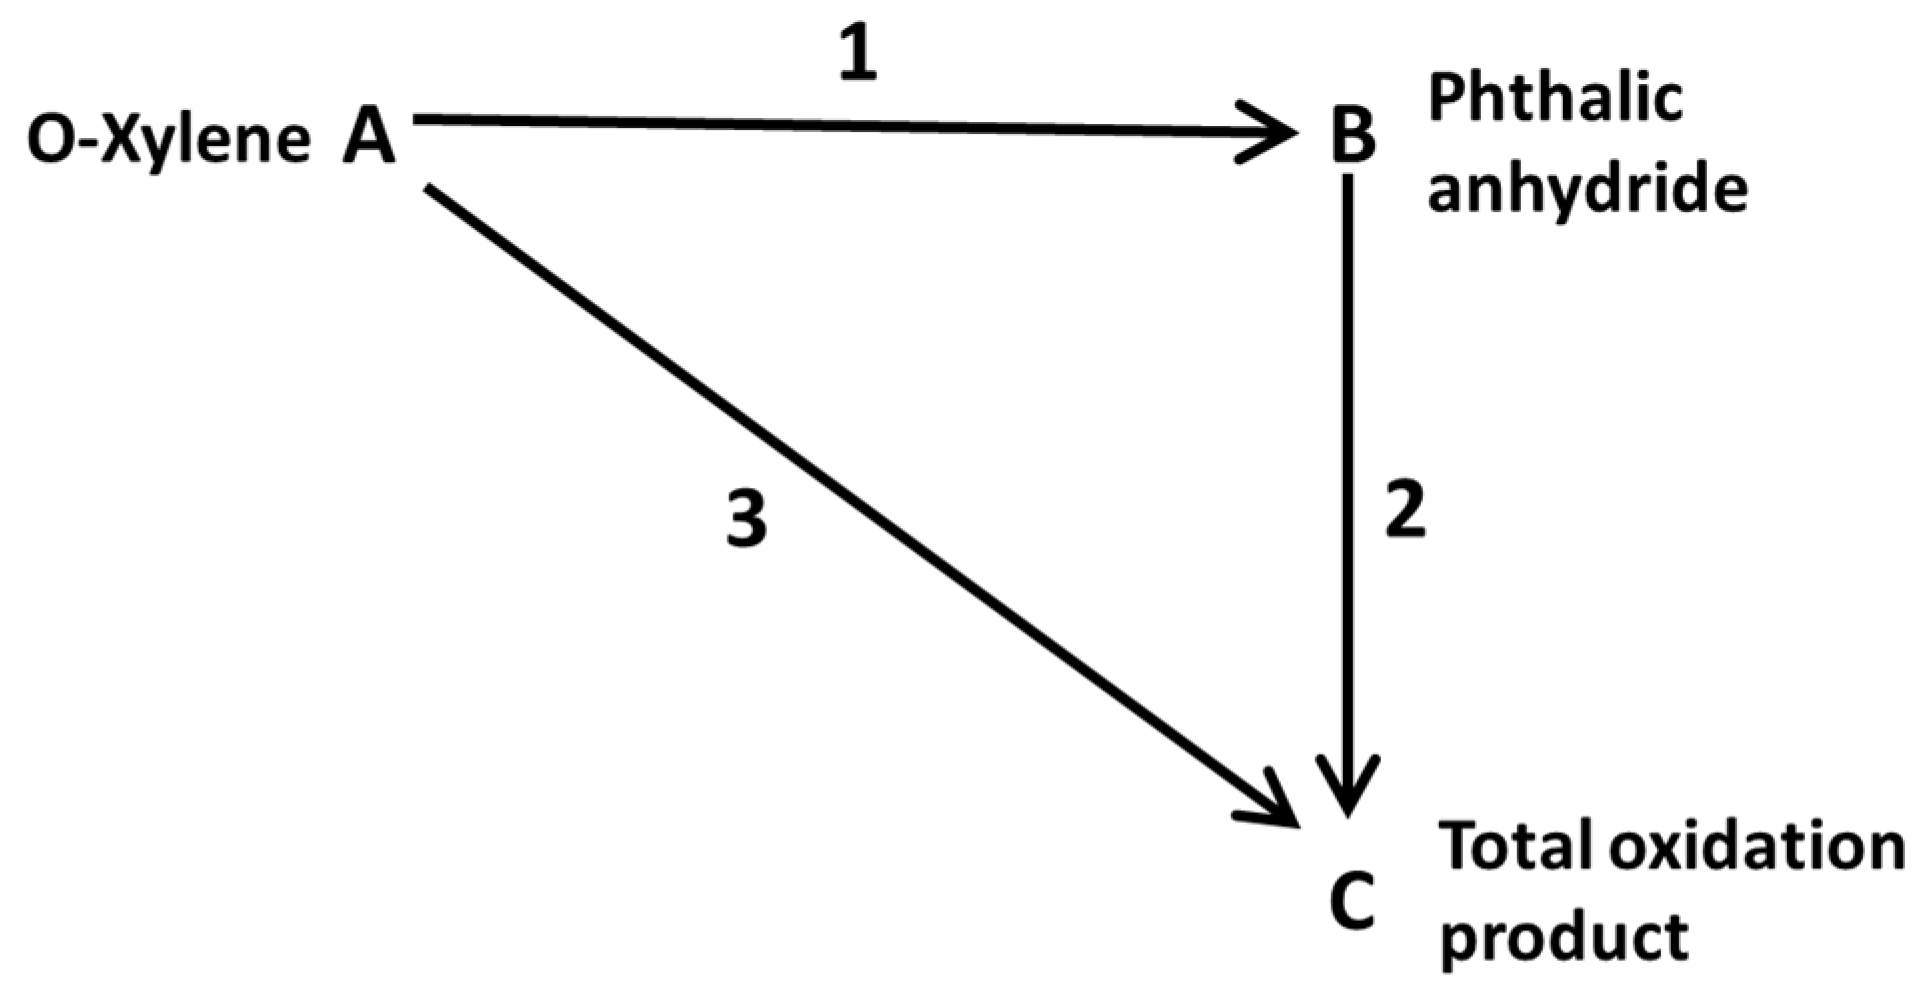
C A :Concentration of ortho-xylene (kmol m−3)
C B :Concentration of phthalic anhydride (kmol m−3)
C C :Concentration of reaction by-products (kmol m−3)
C p g :Specific heat of gas (kJ kg−1 K−1)
D e f :Radial effective diffusion coefficient of the gas mixture in the particle (m2 s−1)
D e r :Radial effective diffusion coefficient of the gas mixture in the reactor (m2 s−1)
D i :Parameter of the Arrhenius equation (dimensionless)
d p :Particle diameter (m)
D T :Reactor diameter (m)
G e :Heat generation rate (kJ m−3 s−1)
G m :Mass flow rate (kg m−2 s−1)
h :Convective heat transfer coefficient (kJ m−2 s−1 K−1)
k e f : Effective thermal conductivity in the catalytic particle (kJ m−2 s−1 K−1)
k e r : Effective radial conductivity in the catalytic bed (kJ m−1 s−1 K−1)
k w : Thermal conductivity in the tube wall (kJ m−1 s−1 K−1)
L : Reactor length (m)
N j : Molar flux density based on stationary component coordinates j (kmol m−2 s−1)
N p : Maximum number of subdivisions in the reactor or maximum number of subdivisions in the particle
N R : Number of reactions
p j : Partial pressure of each component j (atm)
p O 2 : Partial pressure of oxygen (atm)
P e M r :Radial mass transfer Peclet number
P e H r : Radial heat transfer Peclet number
q r : Radial heat flux density (kJ m−2 s−1)
R g : Universal gas constant (0.082 L atm mol−1 K−1)
R : Reactor radius or particle radius (m)
r : Radial coordinate (m)
R i : Reaction velocity per unit volume of catalyst (kmol m−3 cat s−1)
r i : Reaction velocity per unit weight of catalyst (kmol kg−1 cat s−1)
t :Time (s)
T :Temperature (K)
T i :Temperature at each placement point (K)
T W :Reactor wall temperature (K)
V :Gas superficial velocity (m s−1)
W i :Arrhenius equation parameter (K)
Z :Axial coordinate
Δ H R i :Reaction enthalpy of i-reaction (kJ kmol−1)
Greek Letters
ɛ L : Bed porosity
ɛ P : Particle porosity
η : Effectiveness factor
:Gradient vector (1/m)
ρ b : Catalyst bed density (kg m−3)
ρ g : Density of the gas mixture (kg m−3)
ϕ : Auxiliary variable
v i j : Stoichiometric coefficient of component j in reaction i
Subscripts
e f : Effective
i : Number of reactions: i = 1, 2, 3
i n : Inlet
j : Component: A, B and C
k : Number of subdivisions in the reactor or particle: 1, 2, 3, … Np
s : Catalyst Surface
w : Wall

References

  1. Cinar, A. Design of a Control Scheme for a Catalytic Fixed-Bed Reactor. In Computer Aided Design of Multivariable Technological Systems; Elsevier Ltd.: Amsterdam, The Netherlands, 1983; pp. 303–311. [Google Scholar] [CrossRef]
  2. Pellegrini, L.; Biardi, G.; Ranzi, E. Dynamic Model of Packed-Bed Tubular Reactors. Comput. Chem. Eng. 1989, 13, 511–518. [Google Scholar] [CrossRef]
  3. Andrigo, P.; Bagatin, R.; Pagani, G. Fixed Bed Reactors. Catal. Today 1999, 52, 197–221. [Google Scholar] [CrossRef]
  4. Anastasov, A.; Elenkov, D.; Nikolov, V. A Model Study of a Conventional Fixed Bed Tubular Reactor with a Catalyst Layer on the inside Tube Wall. Chem. Eng. Process. Process Intensif. 1988, 23, 203–211. [Google Scholar] [CrossRef]
  5. Giarola, S.; Romain, C.; Williams, C.K.; Hallett, J.P.; Shah, N. Techno-Economic Assessment of the Production of Phthalic Anhydride from Corn Stover. Chem. Eng. Res. Des. 2016, 107, 181–194. [Google Scholar] [CrossRef]
  6. Gütlhuber, F. Reactor for Catalytic Gas-Phase Reactions, Especially Manufacture of Phthalic Acid Anhydride. WO2003022418, 26 August 2002. [Google Scholar]
  7. Takada, M.; Uhara, H.; Sato, T. Method and Reactor for Vapor Phase Oxidation. DE2830765, 13 July 1978. [Google Scholar]
  8. Marx, R. Kinetics of the Selective Oxidation of O-Xylene to Phthalic Anhydride. Ph.D. Thesis, Clausthal University of Technology, Dernbach, Germany, 2012. [Google Scholar]
  9. Ivanovskaya, F.A.; Sembayev, D.K. Routes of Catalytic Oxidation of O-Xylene to Phthalic Anhydride. React. Kinet. Catal. Lett. 1991, 45, 107–110. [Google Scholar] [CrossRef]
  10. Chandrasekharan, K.; Calderbank, P.H. Kinetics of the Catalytic Air-Oxidation of o-Xylene Measured in a Tube-Wall-Catalytic Reactor. Chem. Eng. Sci. 1980, 35, 1523–1535. [Google Scholar] [CrossRef]
  11. Gimeno, M.P.; Gascón, J.; Téllez, C.; Herguido, J.; Menéndez, M. Selective Oxidation of O-Xylene to Phthalic Anhydride over V2O5/TiO2: Kinetic Study in a Fluidized Bed Reactor. Chem. Eng. Process. Process Intensif. 2008, 47, 1844–1852. [Google Scholar] [CrossRef]
  12. Nikolov, V.A.; Anastasov, A.I. Influence of the Inlet Temperature on the Performance of a Fixed-Bed Reactor for Oxidation of o-Xylene into Phthalic Anhydride. Chem. Eng. Sci. 1992, 47, 1291–1298. [Google Scholar] [CrossRef]
  13. Papageorgiou, J.N.; Abello, M.C.; Froment, G.F. Kinetic Modeling of the Catalytic Oxidation of O- Xylene over an Industrial V2O5-TiO2 (Anatase) Catalyst. Appl. Catal. A Gen. 1994, 120, 17–43. [Google Scholar] [CrossRef]
  14. Anastasov, A.I. Deactivation of an Industrial V2O5–TiO2 Catalyst for Oxidation of o-Xylene into Phthalic Anhydride. Chem. Eng. Process. Process Intensif. 2003, 42, 449–460. [Google Scholar] [CrossRef]
  15. Castillo-Araiza, C.O.; López-Isunza, F. Modeling the Partial Oxidation of O-Xylene in an Industrial Packed-Bed Catalytic Reactor: The Role of Hydrodynamics and Catalyst Activity in the Heat Transport. Ind. Eng. Chem. Res. 2010, 49, 6845–6853. [Google Scholar] [CrossRef]
  16. Castillo-Araiza, C.O.; López-Isunza, F. The Role of Catalyst Activity on the Steady State and Transient Behavior of an Industrial-Scale Fixed Bed Catalytic Reactor for the Partial Oxidation of o-Xylene on V2O5/TiO2 Catalysts. Chem. Eng. J. 2011, 176, 26–32. [Google Scholar] [CrossRef]
  17. Sethapokin, P.; Kunatippapong, S.; Lothongkum, A.W. Estimation of Kinetic Parameters for the Reactor Model of the Phthalic Anhydride Production by the Design of Experiments. J. Ind. Eng. Chem. 2015, 24, 51–58. [Google Scholar] [CrossRef]
  18. Wu, Z.; Tran, A.; Ren, Y.M.; Barnes, C.S.; Chen, S.; Christofides, P.D. Model Predictive Control of Phthalic Anhydride Synthesis in a Fixed-Bed Catalytic Reactor via Machine Learning Modeling. Chem. Eng. Res. Des. 2019, 145, 173–183. [Google Scholar] [CrossRef]
  19. Dixon, A.G.; Wu, Y. Partial Oxidation of O-Xylene to Phthalic Anhydride in a Fixed Bed Reactor with Axial Thermowells. Chem. Eng. Res. Des. 2020, 159, 125–137. [Google Scholar] [CrossRef]
  20. Safavi, A.; Richter, C.; Unnthorsson, R. Mathematical Modeling and Experiments on Pyrolysis of Walnut Shells Using a Fixed-Bed Reactor. ChemEngineering 2022, 6, 93. [Google Scholar] [CrossRef]
  21. Carrasco-Venegas, L.A.; González-Fernández, J.V.; Castañeda-Pérez, L.G.; Medina-Collana, J.T.; Palomino-Hernández, G.; Martínez-Hilario, D.G.; Trujillo-Pérez, S.A. Analysis of the Effectiveness Factor in a Fixed-Bed Tubular Reactor System: Catalytic Dehydrogenation of Cyclohexanol. Catalysts 2023, 13, 585. [Google Scholar] [CrossRef]
  22. Herten, J.; Froment, G.F. Kinetics and Product Distribution in the Oxidation of O-Xylene on a Vanadium Pentoxide Catalyst. Ind. Eng. Chem. Process Des. Dev. 1968, 7, 516–526. [Google Scholar] [CrossRef]
  23. Wainwright, M.S.; Foster, N.R. Catalysts, Kinetics and Reactor Design in Phthalic Anhydride Synthesis. Catal. Rev. Sci. Eng. 1979, 19, 211–292. [Google Scholar] [CrossRef]
  24. Saleh, R.Y.; Wachs, I.E. Reaction Network and Kinetics of O-Xylene Oxidation to Phthalic Anhydride over V2O5/TiO2 (Anatase) Catalysts. Appl. Catal. 1987, 31, 87–98. [Google Scholar] [CrossRef]
  25. Nikolov, V.; Anastasov, A.; Klissurski, D. Phthalic Anhydride from O-Xylene Catalysis: Science and Engineering. Catal. Rev. 1991, 33, 319–374. [Google Scholar] [CrossRef]
  26. Ivanov, A.A. O-Xylene Oxidation to Phthalic Anhydride over Unsteady State Catalysts. React. Kinet. Catal. Lett. 1997, 61, 75–82. [Google Scholar] [CrossRef]
  27. García-Ochoa, F.; Borrachero, C.; Molina, G.; Romero, A. Simulación de Reactores de Lecho Fijo Por El Modelo de Dos Dimensiones: I-Reacciones Simples. An. De Química 1991, 88, 180–190. [Google Scholar]
  28. Froment, G.F.; Kenneth, B.B.; De Wilde, J. Chemical Reactor, Analysis and Design, 3rd ed.; John Wiley & Sons, Inc.: Hoboken, NJ, USA, 2011. [Google Scholar]
Figure 1. Reaction triangular scheme.
Chemengineering 08 00035 g001
Figure 2. Scheme of the fixed bed catalytic reactor.
Chemengineering 08 00035 g002
Figure 3. Axial concentration profile for ten points.
Chemengineering 08 00035 g003
Figure 4. Axial profile of temperature for ten points.
Chemengineering 08 00035 g004
Figure 5. Flowchart for factorial design.
Chemengineering 08 00035 g005
Figure 6. Main effects of experimental factors at low, medium, and high levels on phthalic anhydride concentration.
Chemengineering 08 00035 g006
Figure 7. Flowchart for the response surface design.
Chemengineering 08 00035 g007
Figure 8. CB performance.
Chemengineering 08 00035 g008
Figure 9. Response surface plot for phthalic anhydride concentration.
Chemengineering 08 00035 g009
Figure 10. Contour plot for phthalic anhydride concentration.
Chemengineering 08 00035 g010
Figure 11. Optimum point.
Chemengineering 08 00035 g011
Figure 12. Concentrations profile at the optimum point.
Chemengineering 08 00035 g012
Figure 13. Temperature profile at the optimum point.
Chemengineering 08 00035 g013
Figure 14. Molar flux density profiles in a catalyst particle.
Chemengineering 08 00035 g014
Figure 15. Molar concentration profiles in a catalyst particle.
Chemengineering 08 00035 g015
Figure 16. Temperature profiles inside a catalyst particle.
Chemengineering 08 00035 g016
Figure 17. Heat flux density inside a catalyst particle.
Chemengineering 08 00035 g017
Figure 18. Effectiveness factor profiles as a function of radius for each reactor length.
Chemengineering 08 00035 g018
Figure 19. Effectiveness factor profiles as a function of the length for each reactor radio.
Chemengineering 08 00035 g019
Table 1. Catalyst data and operating conditions.
Reactor L   =   3   m *
D T   =   0.25   m *
Catalytic
Bed
ρ b   =   1300   k g   c a t   m 3 *
ε L   =   0.6 *
Feed
composition
1 %   m o l O-xylene *
99 %   m o l of dry air
Total pressure of feed gasesP = 1 atm *
Inlet temperature of reaction gases to the reactor T 0   =   625.15   K *Inner reactor wall
temperature
T W   =   625.15   K *
Flow properties
and gas phase
C p g   =   0.248   k c a / k g   K *
ρ g   =   1.293   k g   m 3 *
G m   =   4684   k g / m 2 h *
Dimensionless
numbers
B i W   =   2.5 *
P e M r   =   10 *
P e H r   =   5.25 *
Catalyst V 2 O 5 / S i O 2
d p   =   0.003   m **
Catalyst particle
properties
D e f   =   0.9   ×   10 8   m 2   s 1  *
K e f   =   0.78   W m 1 K 1 **
* Typical value for a porous catalyst and reactor operating conditions, and ** Average value for vanadium pentoxide. Adapted from [27,28].
Table 2. Kinetic and thermodynamic data.
r i D i W i Δ H R i k c a l k m o l
119.83713,595307,000
220.86015,8111,090,000
318.97014,4011,090,000
r i   =   k i   P j   P O 2 kmol kg   cat   h
k i   =   exp D i W i T , i   =   1 ,   2 ,   3
Adapted from [27,28].
Table 3. Factors and levels of experimentation.
FactorNameLevel Values
123
AReactor wall temperature600.15625.15645.15
BRadius of the reactor0.01050.01250.0145
CPressure11.52
DFeed Mass Flow448446844884
EReactor inlet temperature600.15625.15645.15
Table 4. Experimentation block.
RunFactorsResponse Variable
ABCDECB
1600.150.010514484600.150.00000626
2600.150.010514484625.150.00000626
3600.150.010514484645.140.00000626
4600.150.010514684600.150.00000634
243645.150.014524884645.150.00000634
Table 5. Variance analysis.
SourceDegrees of FreedomF-Valuep-Value
Model50128.600.000
Linear10307.430.000
Tw21443.620.000
Radius240.390.000
Pressure253.050.000
Flow20.090.917
Tin20.001.000
2-term interactions4083.890.000
Tw × Radius4151.060.000
Tw × Pressure4638.800.000
Tw × Flow49.200.000
Tw × Tinlet40.001.000
Radius × Pressure437.460.000
Radius × Flow40.570.685
Radius × Tin40.001.000
Pressure × Flow41.820.127
Pressure × Tin40.001.000
Flow × Tin40.001.000
Error192
Total242
Table 6. Optimum setting point and step size.
Tw (K)Radius (m)Pressure (atm)Flow (kg m−2 h−1)Tin (K)
625.150.01251.54684625.15
step size
2.5−0.00050.0500
Table 7. Steep ascent exploration.
StepsFactors
Tw
(K)
Radius
(m)
Pressure
(atm)
Flow
(kg m−2 h−1)
Tin
(K)
−5612.650.0151.254684625.15
−4615.150.01451.34684625.15
−3617.650.0141.354684625.15
−2620.150.01351.44684625.15
−1622.650.0131.454684625.15
0625.150.01251.54684625.15
1627.650.0121.554684625.15
2630.150.01151.64684625.15
3632.650.0111.654684625.15
4635.150.01051.74684625.15
5637.650.011.754684625.15
Table 8. Box-Behnken surface design.
RunsFactorsResponse
Tw (K)Radius (m)Pressure (atm)CB (kmol/m3)
1627.650.01101.600.00013941
2632.650.01101.600.00014052
3627.650.01201.600.00014022
4632.650.01201.600.00013987
5627.650.01151.550.00013928
6632.650.01151.550.00014035
7627.650.01151.650.00014033
8632.650.01151.650.00014008
9630.150.01101.550.00013997
10630.150.01201.550.00014037
11630.150.01101.650.00014063
12630.150.01201.650.00014032
13630.150.01151.600.00014050
14630.150.01151.600.00014050
15630.150.01151.600.00014050
Table 9. Variance analysis of response surface design.
SourceDFF-Valuep-Value
Model9242.470.000
Linear3177.100.000
Tw1294.620.000
Radius17.160.044
Pressure1229.520.000
Square3203.460.000
Tw × Tw1587.520.000
Radius * Radius128.960.003
Pressure * Pressure128.370.003
Interaction of 2 factors3346.860.000
Tw × Radius1504.750.000
Tw × Pressure1414.690.000
Radius × Pressure1121.130.000
Error5
Lack of fit3**
Pure mistake2
Total14
DF = Degrees of freedom. * = Values that could not be calculated.
Disclaimer/Publisher’s Note: The statements, opinions and data contained in all publications are solely those of the individual author(s) and contributor(s) and not of MDPI and/or the editor(s). MDPI and/or the editor(s) disclaim responsibility for any injury to people or property resulting from any ideas, methods, instructions or products referred to in the content.

