
Using CMIP6 Models to Assess Future Climate Change Effects on Mine Sites in Kazakhstan

1
SRK Consulting (Kazakhstan) Ltd., 77 Kunayev St., Park View Office Tower, 14th Floor, Almaty 050010, Kazakhstan
2
SRK Consulting (Kazakhstan) Ltd., Head Office, 5th Floor, Churchill House, 17 Churchill Way, Cardiff CF10 2HH, Wales
3
SRK Consulting (UK) Ltd., Head Office, 5th Floor, Churchill House, 17 Churchill Way, Cardiff CF10 2HH, Wales
*
Author to whom correspondence should be addressed.
Hydrology 2023, 10(7), 150; https://0-doi-org.brum.beds.ac.uk/10.3390/hydrology10070150
Submission received: 3 July 2023
/
Revised: 11 July 2023
/
Accepted: 16 July 2023
/
Published: 17 July 2023
(This article belongs to the Special Issue Climate Change Effects on Hydrology and Water Resources)
Abstract
:Climate change is a threat to mining and other industries, especially those involving water supply and management, by inducing or amplifying some climatic parameters such as changes in precipitation regimes and temperature extremes. Using the latest NASA NEX-GDDP-CMIP6 datasets, this study quantifies the level of climate change that may affect the development of two mine sites (site 1 and site 2) in north–east Kazakhstan. The study analyses the daily precipitation and maximum and minimum temperature a of a number of global circulation models (GCM) over three future time periods, the 2040s, 2060s, and 2080s, under two shared socioeconomic pathway (SSP) scenarios, SSP245 and SSP585, against the baseline period 1981–2014. The analyses reveal that: (1) both maximum and minimum temperature will increase under both SSP in those time periods, with the rate of change for minimum temperature being higher than maximum temperature. Minimum temperature, for example, will increase by 2.2 and 2.7 °C under SSP245 and SSP585, respectively, over the 2040s period at both sites; (2) the mean annual precipitation will increase by an average rate of 7% and 10.5% in the 2040s for SSP245 and 17.5% and 7.5% for SSP585 in the 2080s at site 1 and site 2, respectively. It is also observed that summer months will experience drier condition whilst all other months will increase in precipitation; (3) the values of 24 h precipitation with a 10 year return period will also increase under both SSP scenarios and future time periods for most of the studied GCM and at both mine sites. For instance, over the near future period, a 6.9% and 2.8% increase in 10 year 24 h precipitation is expected to happen over site 1 and site 2, respectively, under SSP245. These predicted changes should be considered as design criteria adjustments for projected water supply and water management structures.
1. Introduction
With the growing threat of climate change in the past few decades exacerbated by worsening scenarios in the areas of energy, water, and desertification, the pressures on natural resource management as a result of poverty has also been intensified [1]. It is believed that the risk associated with climate change is one of the most prominent threats to human societies [2], manifested by increasing intensity, frequency, and impacts of extreme weather events such as hurricanes, floods, droughts, and heatwaves. In response to these pressures, Global Industry Standard on Tailings Management (GISTM) suggests that adjusting design standards is required as a result of evolving climate change impacts [3].
It is widely recognised that available mining deposits are increasingly deeper and of declining ore grade. This will lead to growing demands for water as well as greater mine waste [4], with climate change expected to increase pressure on the mining industry as more frequent droughts and floods are predicted, leading to an alteration in water supply and disruption of mining operations. Climate change studies should be adopted as a consistent approach to help mining companies identify the risks and opportunities related to the management of water resources in all stages of mine development and in the closure of their mining projects [5].
It is essential for mining companies to consider climate change and its impact on sustainability and cost of water and energy supplies and use decision-making tools that help them optimise available water resources. Odell et al. (2018) demonstrated the importance of including climate change assessment in all mining activities. They proposed a framework for interaction between climate change, the mining industry, and the way public and private sectors respond to them [6]. Climate change analysis coupled with stochastic project water balance models can provide good predictions of water surplus or deficit over mine life (and closure), enabling solutions/measures to be prepared and costed for at the early stage of project development. To address climate change, coupled model intercomparison project (CMIP) models provide a feasible tool to predict future climate conditions under the changing conditions [7]. CMIP6 is the latest version of the CMIP that is featured in the IPCC’s sixth assessment report (AR6). It has been used in many recent studies on climate change; Moradian et al. (2023) used outputs of 12 CMIP6 models over northern Europe and evaluated the performance of a multi-model ensemble method. They showed the effectiveness of the multi-model approach compared to individual models on projected precipitation for the study region [8]. In another recent study, CMIP6 datasets were evaluated in daily and monthly precipitation projections in Brunei using two multi-model ensemble methods and a significant decrease in future precipitation was found using both methods [9].
In very limited research conducted in the central Asia region using CMIP6 models, Dike et al. used the outputs of these models to project future conditions of extreme precipitation in the central Asia region under four SSP scenarios. They found that summer precipitation will increase in south central Asia and decrease in the north central Asia region [10].
Due to climate models’ structural uncertainties, complexity in the earth–atmosphere systems and coarse resolution of the global circulation models (GCM), the application of their outputs is limited to some extent [11]. NASA implemented the NASA Earth Exchange Global Daily Downscaled Projections 6 (NEX-GDDP-CMIP6) project to provide downscaled historical and future projections for the period 1950 to 2100, based on CMIP6 models [12].
Since its release, NEX-GDDP-CMIP6 has been used for studies around the world; for example, Wu et al. used 16 GCM in NEX-GDDP-CMIP6 to evaluate the performance of these models in capturing drought characteristics over China. They found the acceptable performance of the models in producing the spatial distribution pattern of drought in China [13]. In another study, Murali et al. [14] applied NEX-GDDP-CMIP6 to project future extreme thermal events on a global scale. They found that, for example, under the high emission scenario of SSP585 and intermediate SSP245 scenario, 41% and 15.1%, respectively, of all land vertebrate will be exposed to extreme thermal events beyond their historic level. In a more recent study, NEX-GDDP-CMIP6 was used to project future drought condition at Lake Urmia Basin in Iran, using an average of eight GCMs. Studies such as this can provide useful insights on drought management and alleviating the negative effects caused by this natural phenomenon [15].
While the outputs of global models provide an appropriate tool for understanding future climate conditions, very little research has been reported using the latest NASA NEX-GDDP-CMIP6 product in central Asia countries. This study, for the first time, applies NEX-GDDP-CMIP6 models to evaluate the future climate conditions at two mine sites located in two distinctive climate conditions in Kazakhstan. Consequently, for the first time in Kazakhstan, the changes in projected average and extreme precipitation and temperature conditions in future are evaluated based on the latest CMIP6 models, using a multi-model approach to provide more in-depth information on potential future climate conditions in the region.
2. Materials and Methods
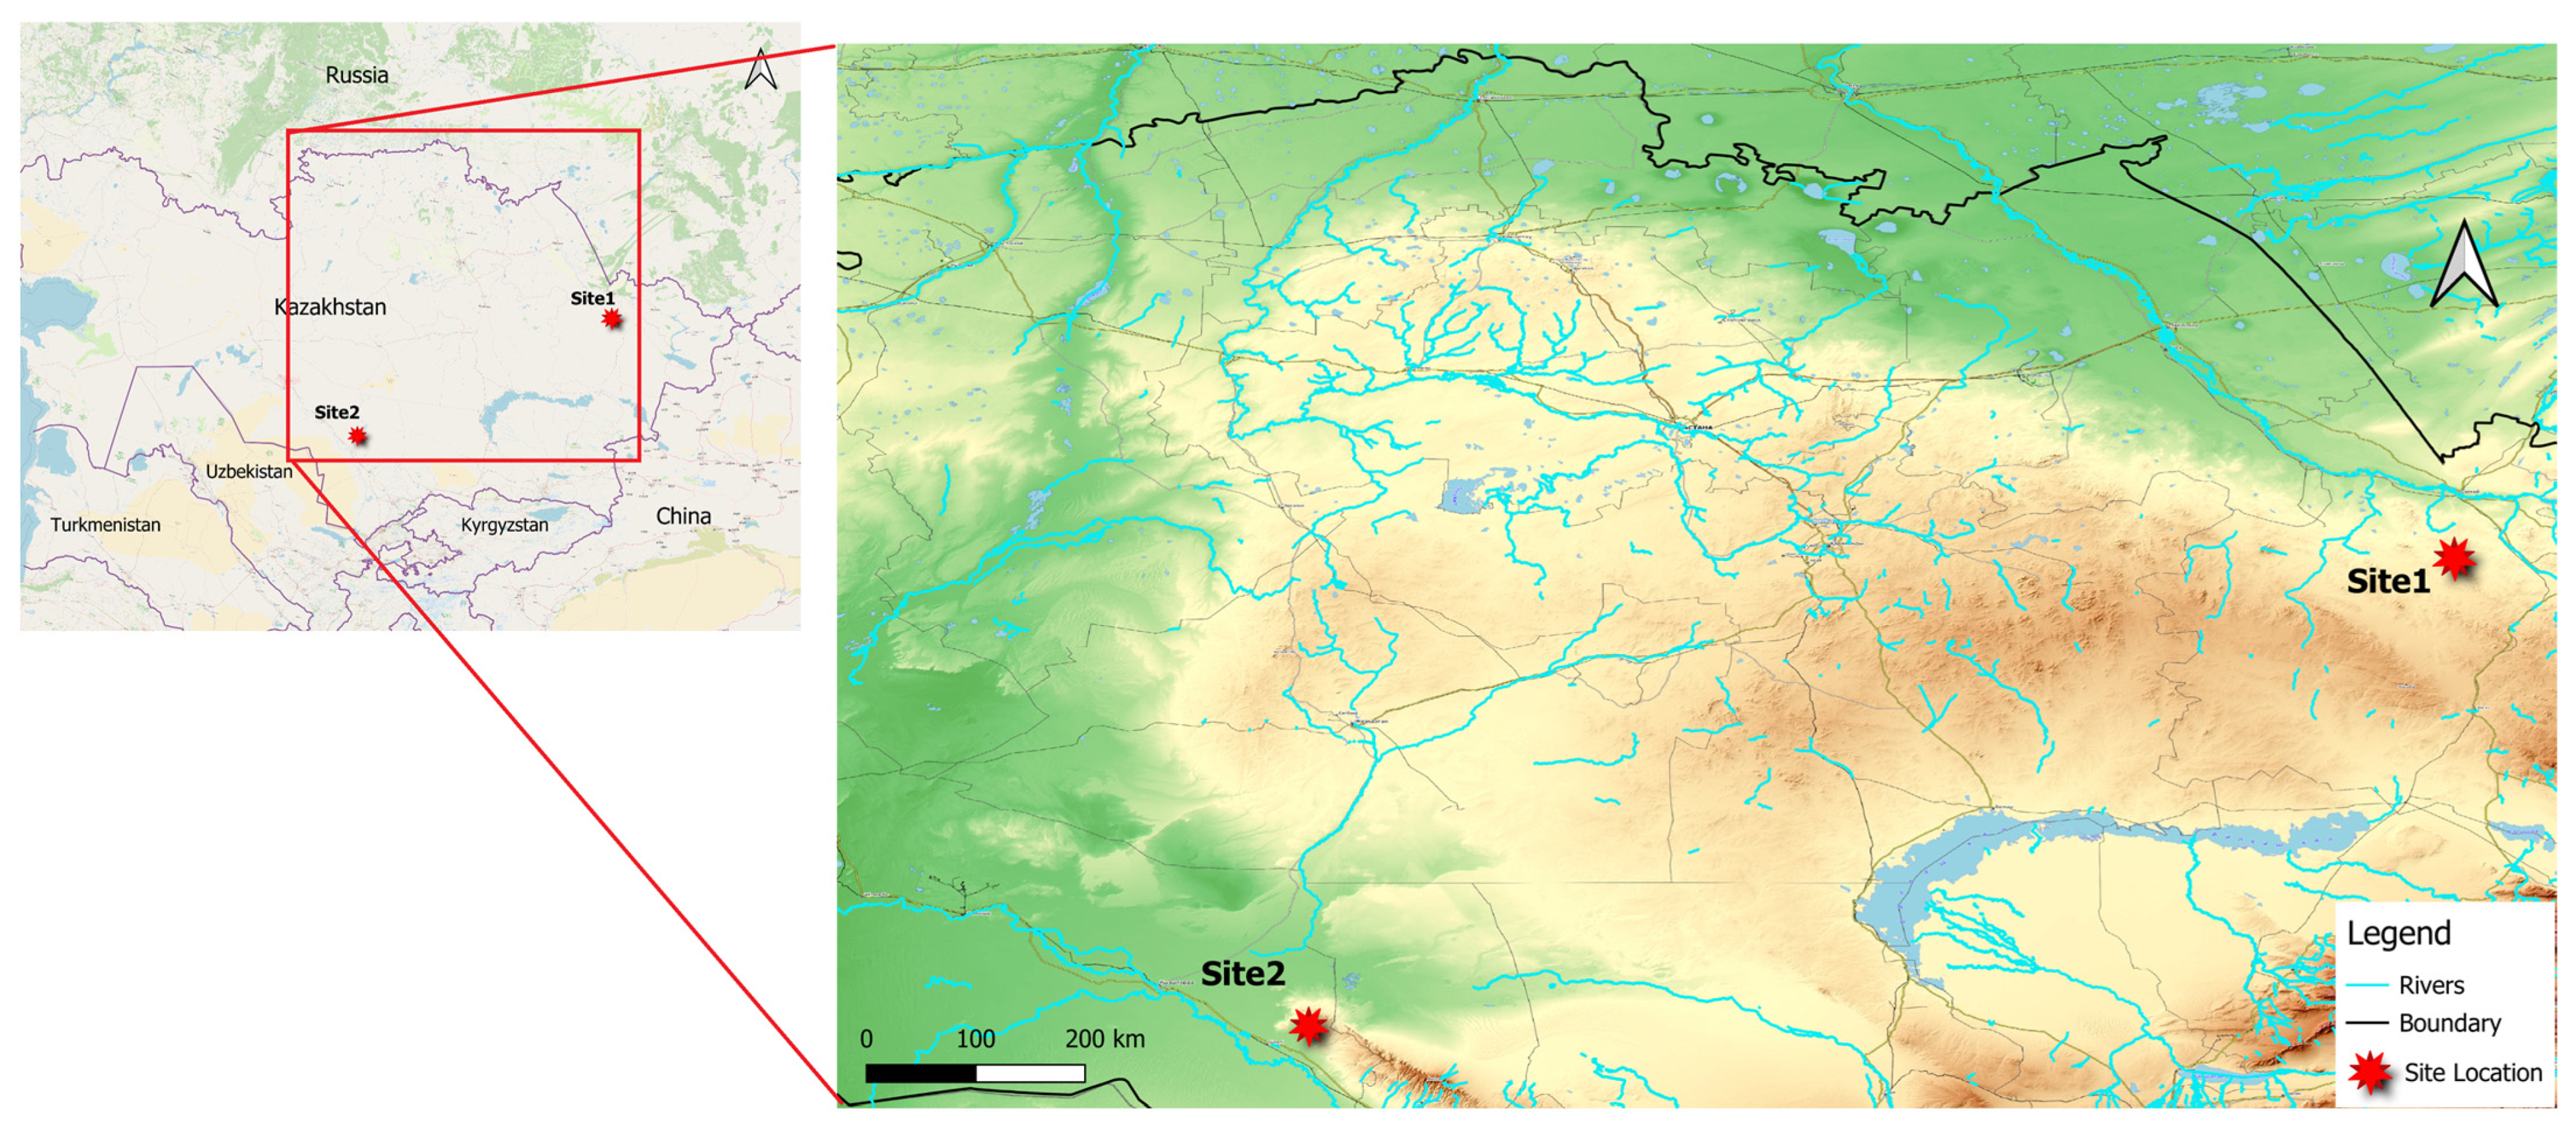
Two case study sites were selected to assess the future climate condition based on different emission scenarios in Kazakhstan (Figure 1). According to Köppen–Geiger classification [16], site 1 is located in a region with a cold semi-arid climate (BSk), while site 2 falls at the edge of two climate classes, BWk with cold desert climate and BSk with a cold semi-arid climate. Besides having different climate condition, another reason for selecting these two sites is the issues they have in terms of water supply for mining activities.
Based on historical data, the air temperature variability in the region is high, ranging from −14.9 °C and −8.1 °C in winter (December–January–February) and +22.3 °C and 27.7°C in the summer (June–July–August) for site 1 and site 2, respectively. The average annual air temperature is 4.1 °C and 10 °C with a mean annual precipitation of about 270 mm/year and 150 mm/year for site 1 and site 2, respectively.
In this study, climate change for each site is assessed based on different GCMs from NASA’s NEX-GDDP dataset, which is compatible with the latest IPCC assessment report (AR6), i.e., phase 6 of the coupled model intercomparison project (CMIP6). Besides being based on latest AR6 emission scenarios, another reason for using this dataset is that NASA’s NEX-GDDP provides statistically downscaled GCMs’ outputs to a finer resolution, which have been approved through many studies [17,18]. The statistical downscaling algorithm used is a daily bias correction–spatial disaggregation (BCSD) method [12]. The NEX-GDDP-CMIP6 dataset spans the entire globe, with a 0.25° (≈25 km) spatial resolution for the period from 1950 through to 2014 (historical) and from 2015 to 2100 (climate projections). Under the latest IPCC assessment report, AR6, two scenarios following the shared socioeconomic pathway (SSP) framework were defined, SSP2-4.5 and SSP5-8.5, and are included in the analysis. Scenarios SSP245 and SSP585 show additional radiative forcing of 4.5 and 8.5 W/m2 representing the intermediate and high limits of the climate change projections, respectively. To reduce uncertainty in climate projections, an ensemble of GCM outputs is used to obtain a spectrum of possible future outcomes. Table 1 shows the 18 GCM used in this study. At least one model from different institutes/research centres involved in the developing GCMs was selected, which included projected precipitation and temperature under both SSP245 and SSP585 scenarios.
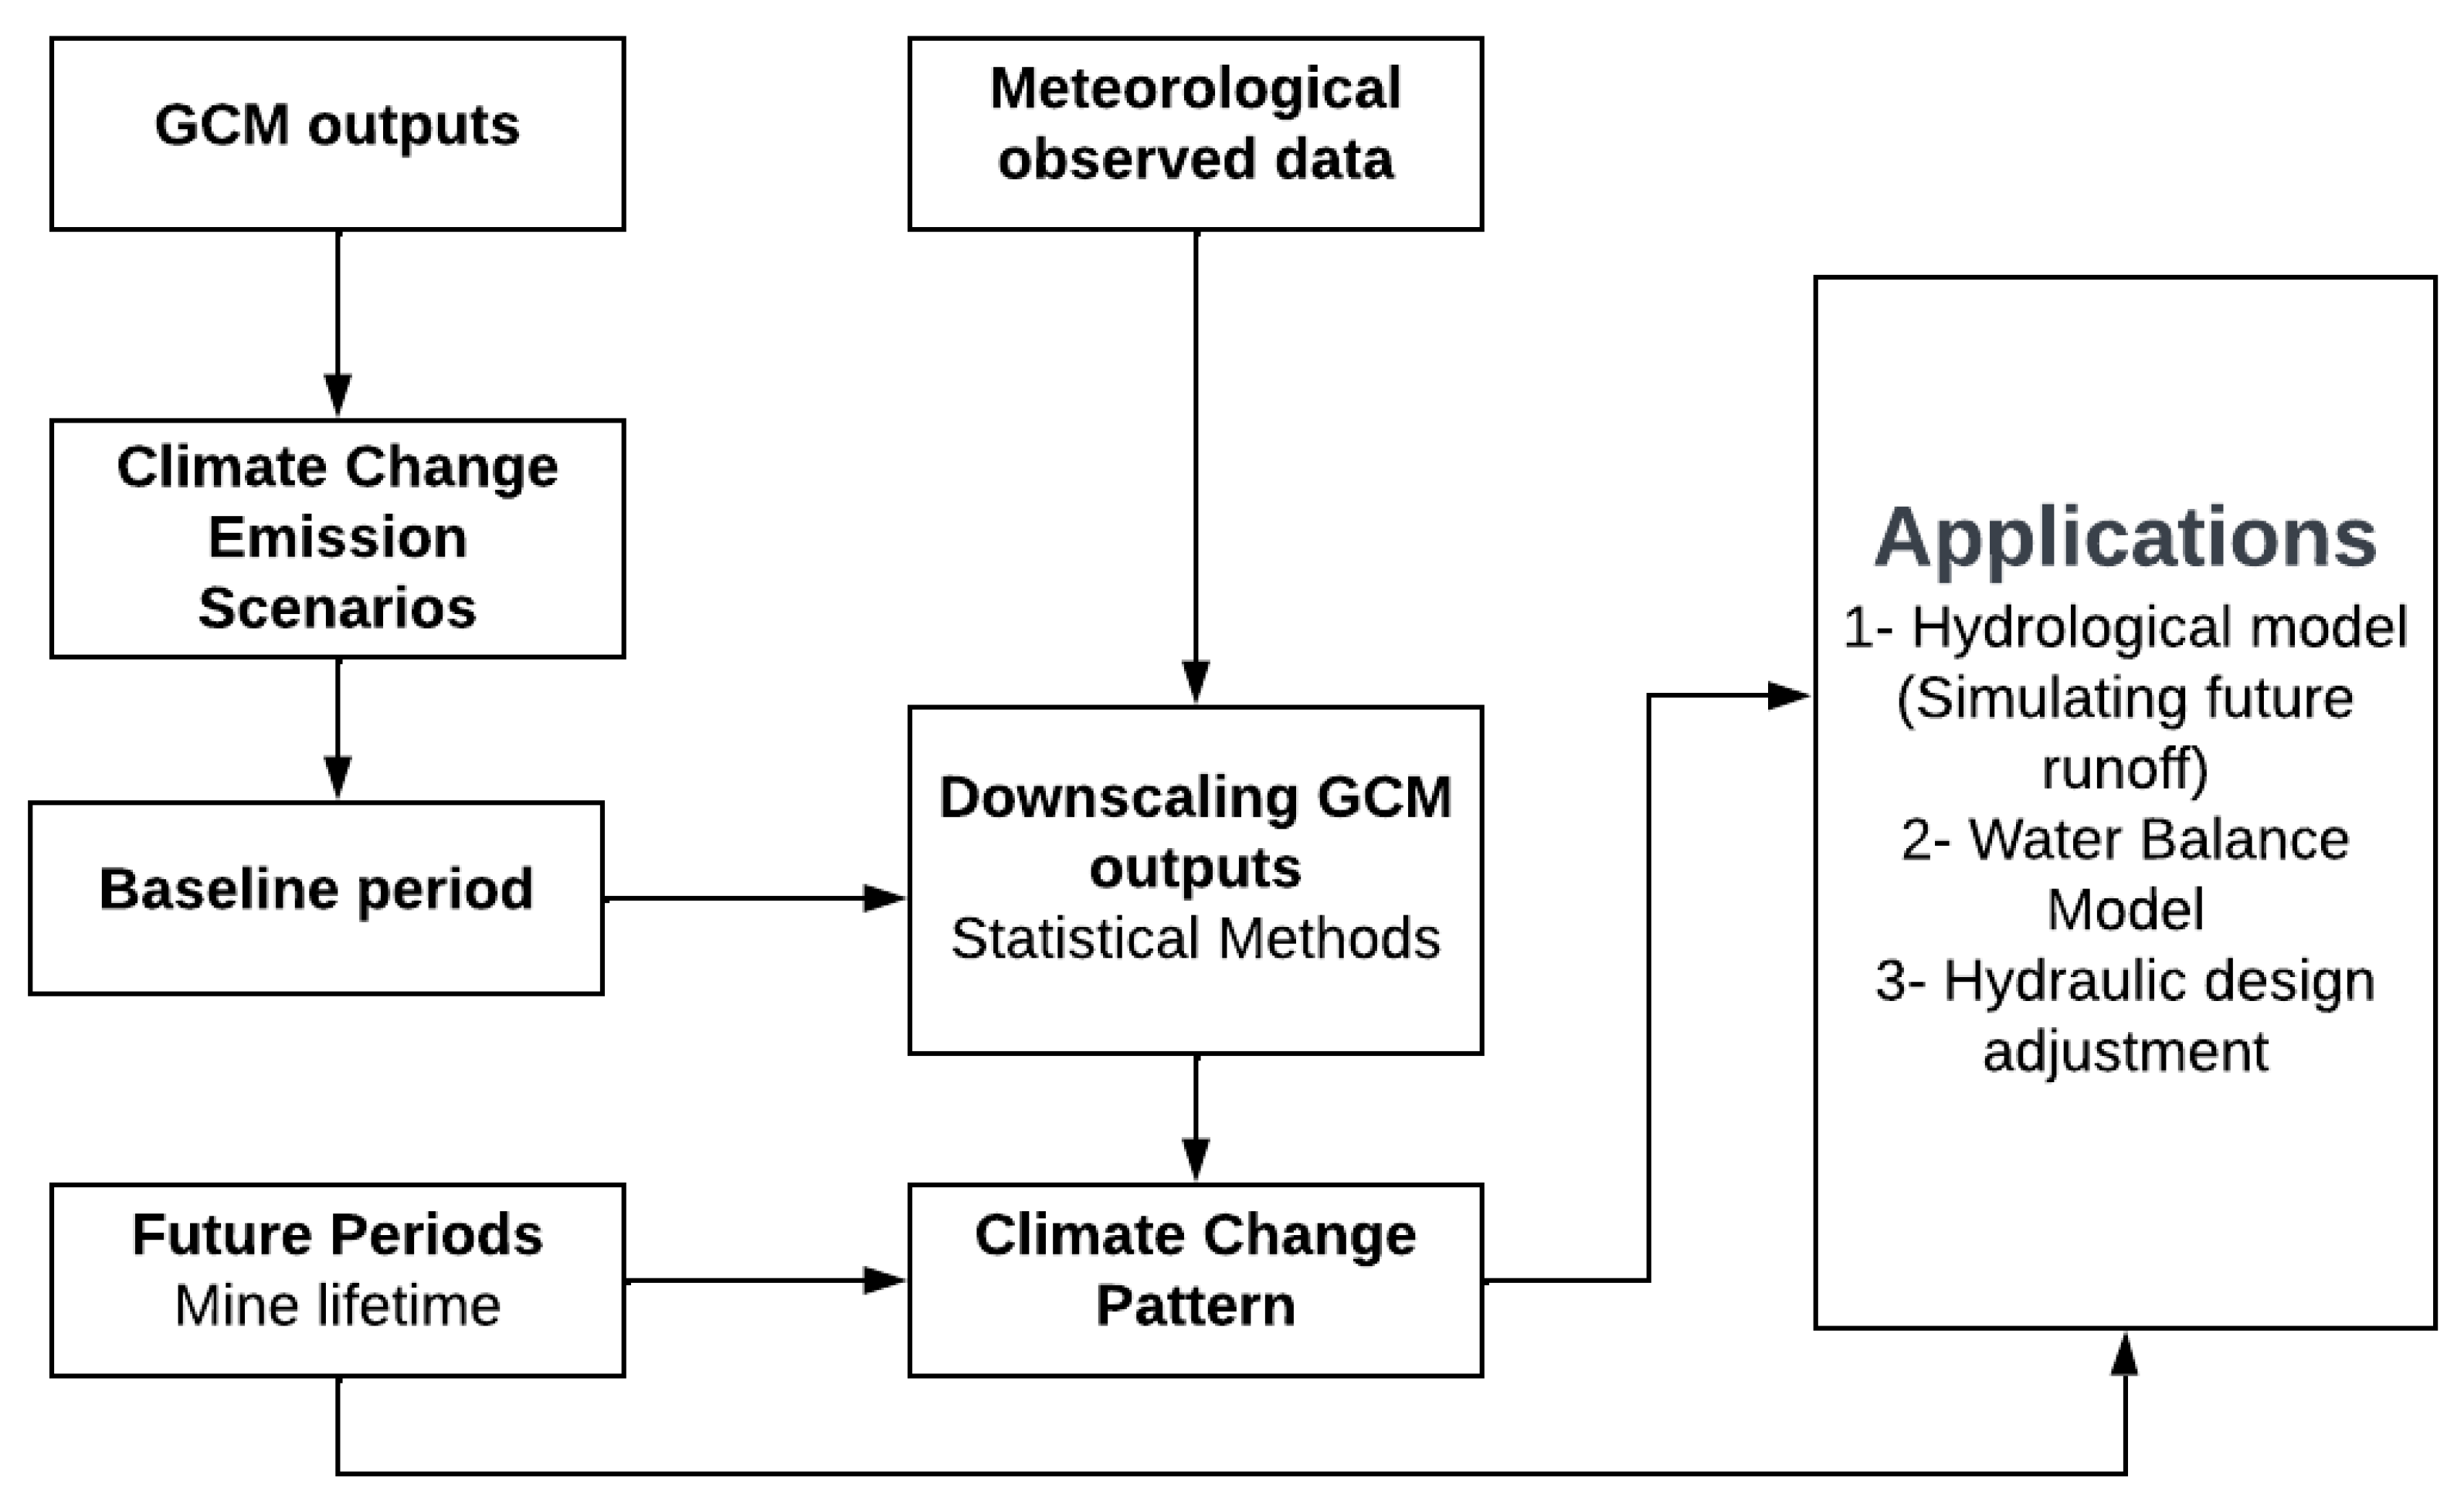
The climate change studies usually take the following steps: (1) historical data review to obtain a more transparent picture of the climate condition at the study site; (2) downloading downscaled outputs of available GCM at the site location from NEX-GDDP-CMIP6 datasets and comparing the outputs of GCM with observed values for the baseline period. If required, bias correction of the GCM outputs should be carried out; (3) analysing time series of variables for time horizons of interest in the future under different climate change scenarios and assessing the rate of change compared to the baseline period. Figure 2 shows the different stages that should be implemented for climate change studies. In this study, besides the baseline period (1981–2014), three future horizons, the 2040s, 2060s, and 2080s, covering the period 2030 to 2100, were considered.
To have a better projection of future climate conditions, the observed data at the mine site and the quantile delta mapping (QDM) method were used to bias-correct the outputs of GCM. Finally, the effect of climate change on (1) mean annual precipitation (MAP) as well as monthly precipitation, (2) maximum and minimum temperature at monthly time scale, and (3) 24 h precipitation with 10 year return period were evaluated.
3. Results and Discussion
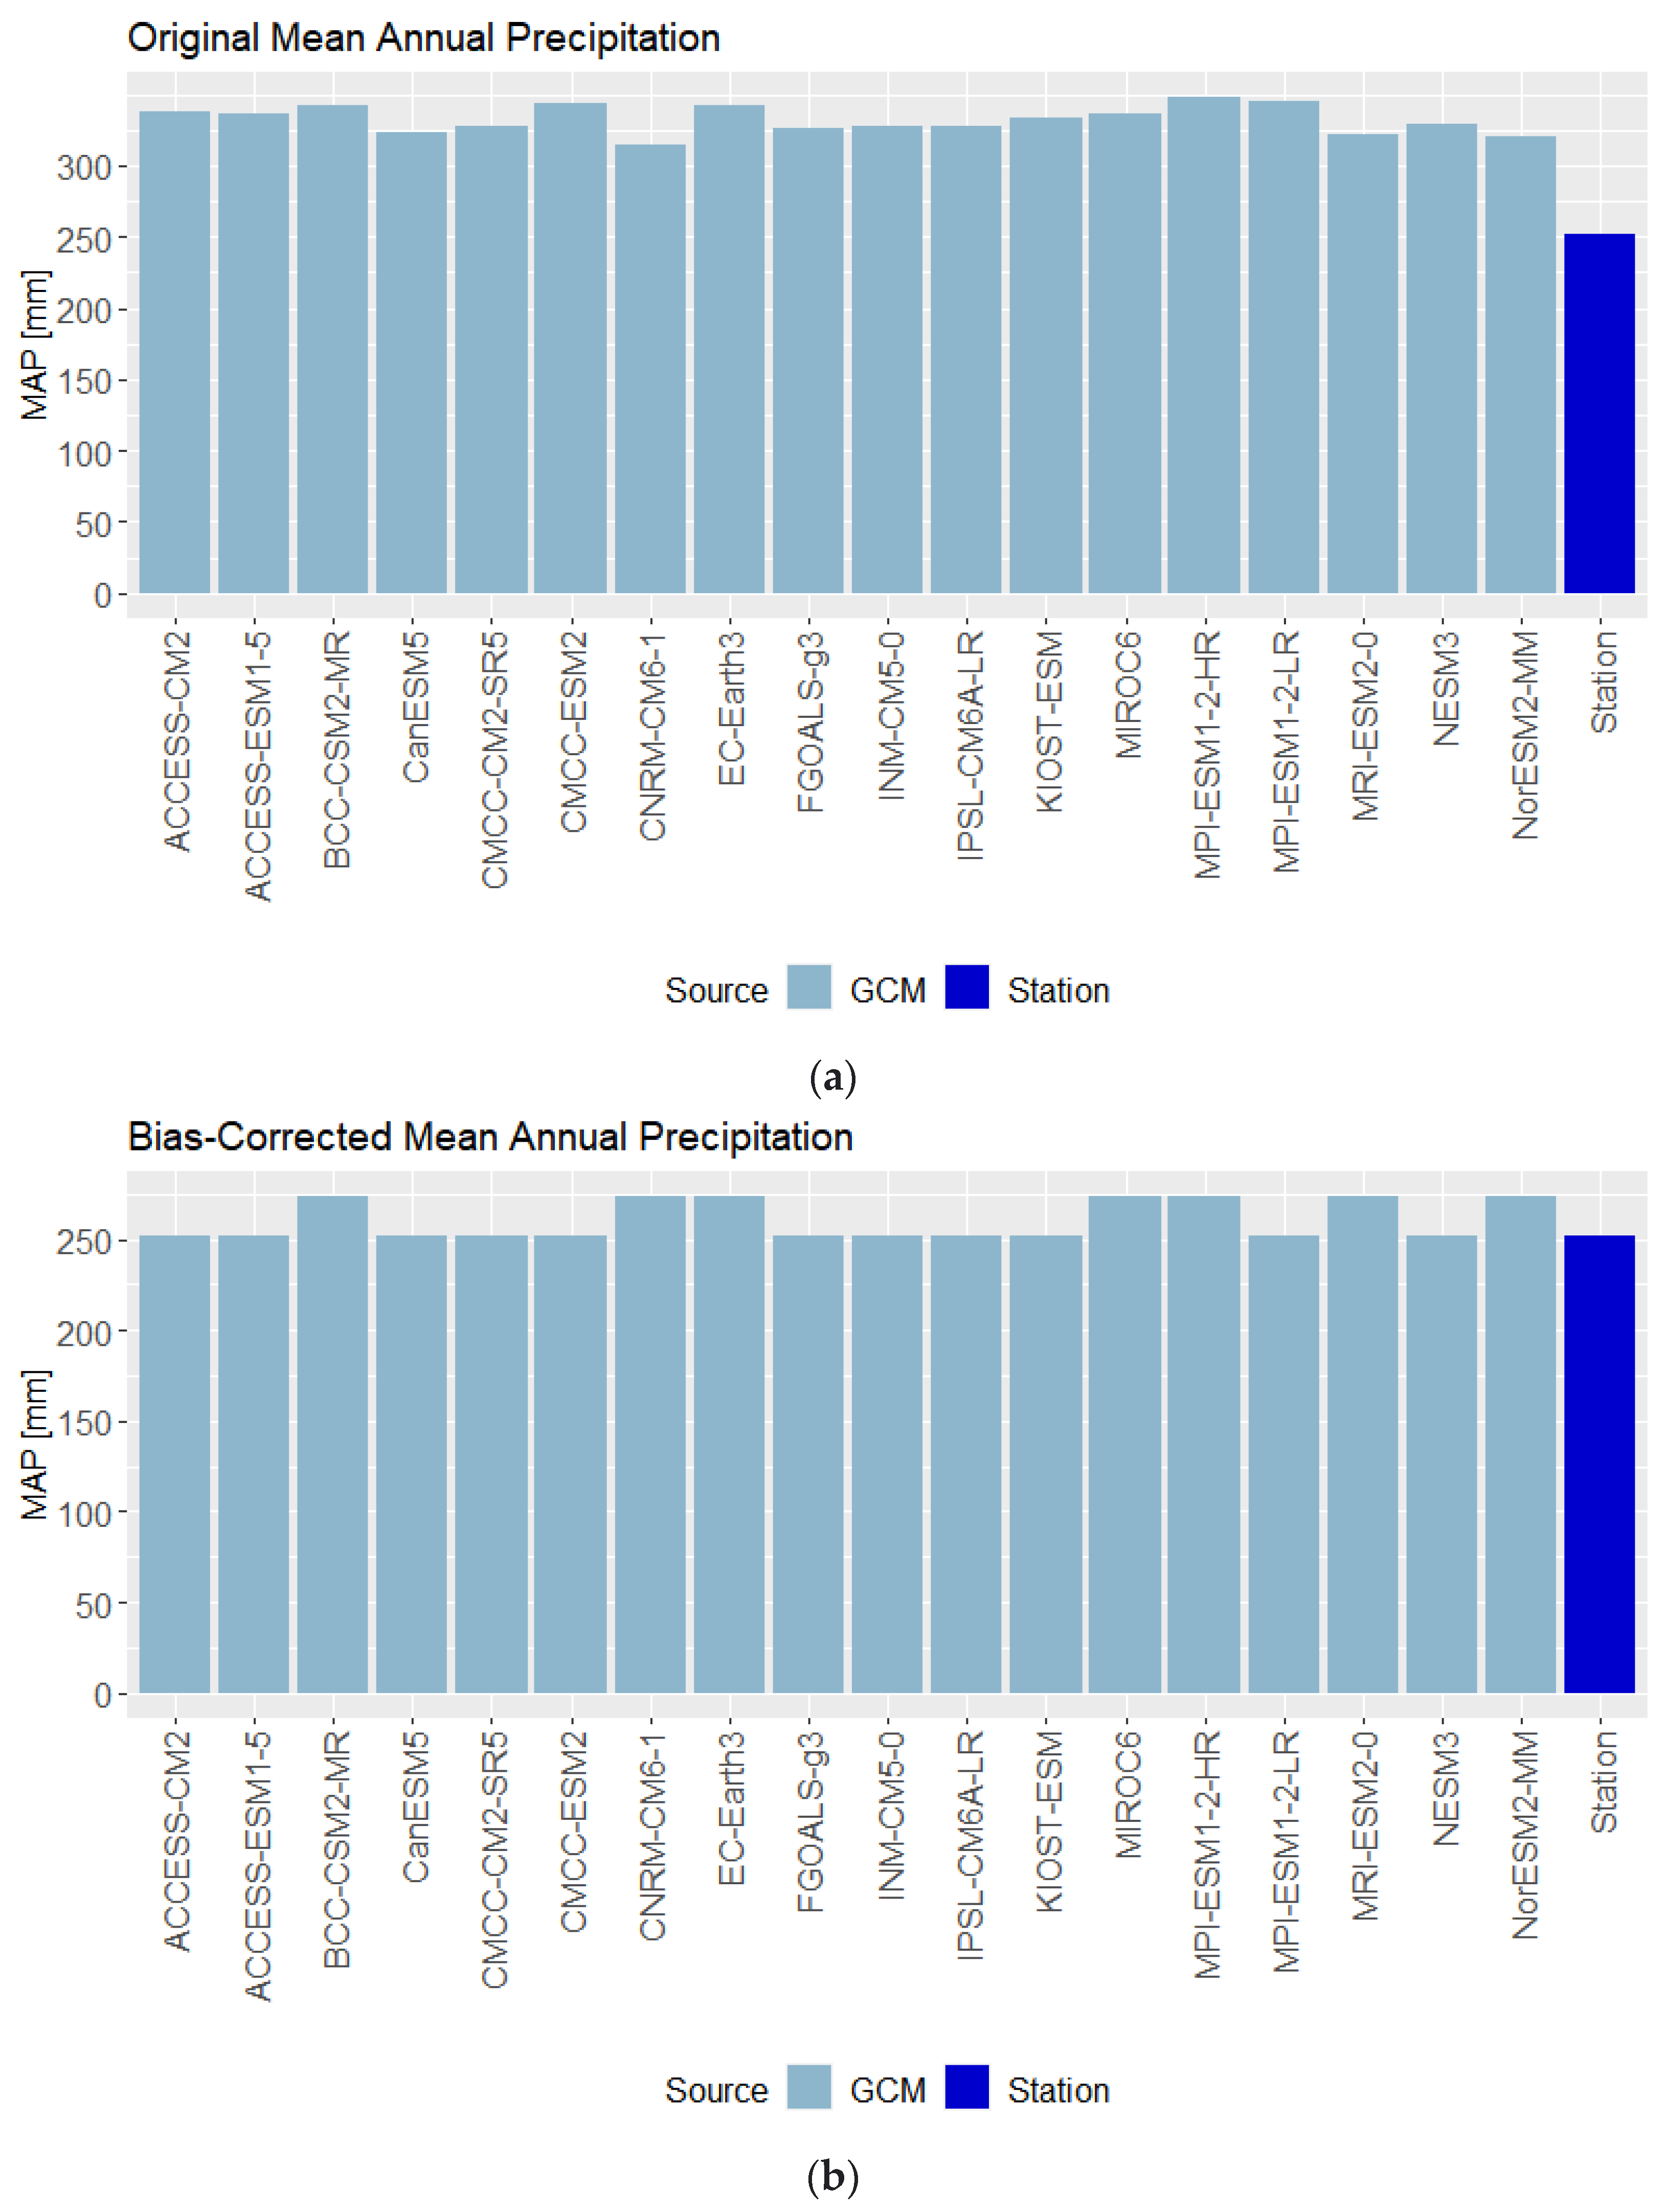
The effects of climate change on precipitation, as well as minimum and maximum temperature at monthly and annual time scale, were assessed to determine the rate of change compared to the baseline period. To have a better projection of future climate conditions, the observed data at the mine sites were compared to outputs of GCM over the baseline period to evaluate if any further bias correction was required. Figure 3 shows the mean annual precipitation derived based on different GCM for the period 1981–2014, as well as observed values estimated at site 1 as an example. It can be seen in Figure 3a that all climate models tend to overestimate precipitation at the mine site (Figure 3b). Consequently, for both precipitation and temperature data (minimum and maximum temperature) at both site 1 and site 2, the QDM method was applied to the outputs of the GCMs to have a more realistic projection of the future climate condition at the site locations.
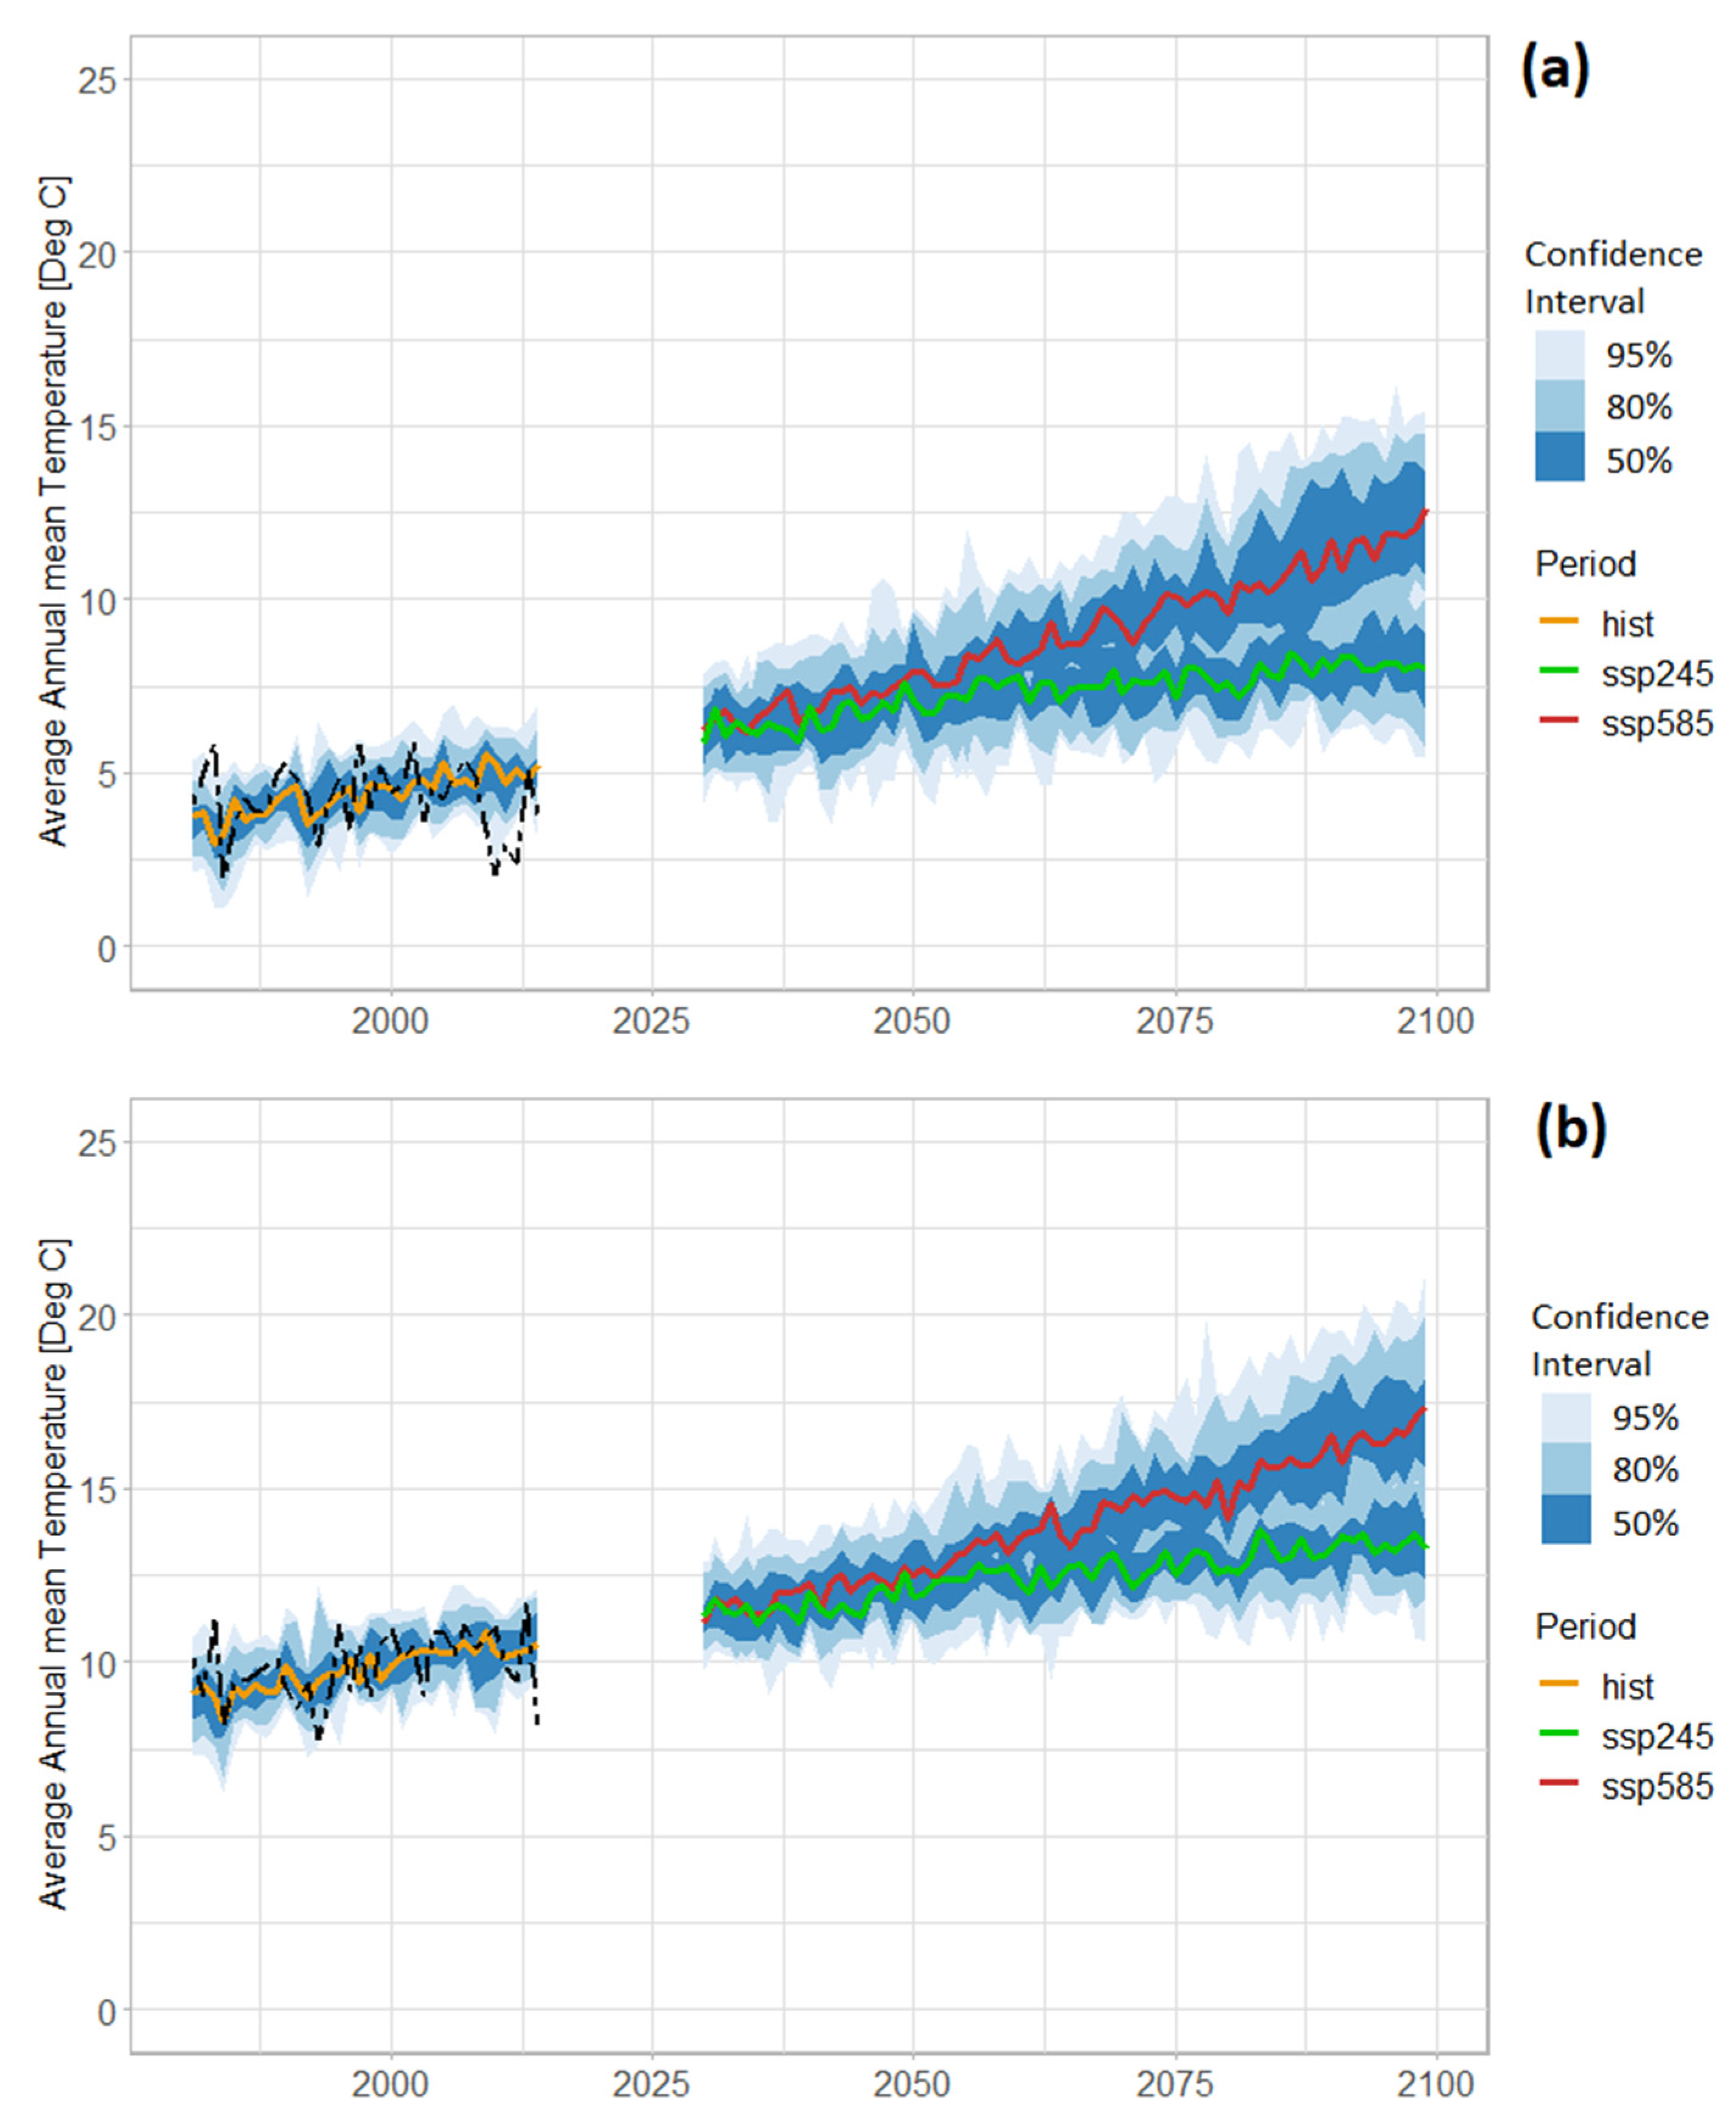
Figure 4 shows the time series of average annual temperature at both sites for the historical (1981–2014) and future periods based on the outputs of all GCM used in this study. In this figure, 50%, 80%, and 95% uncertainty bands are shown. It can be seen that over the historical period, most of the observed average annual temperature are bracketed inside the 95% uncertainty interval with a few exceptions, such as year 2010 at site 1, where all GCM overestimate the mean annual temperature. Only MPI-ESM1-2-HR has a smaller temperature than the observed value in this year. It can also be seen from Figure 4 that the uncertainty (the confidence interval around the median values) increases with time; more uncertainty in the far future (2080s) and then in the mid-future (2060s, i.e., 2051–2080) compared to the near future (2040s, i.e., 2031 to 2060) and the baseline period (i.e., 1981–2014). Also, the uncertainty associated with SSP585 is higher than that of SSP245.
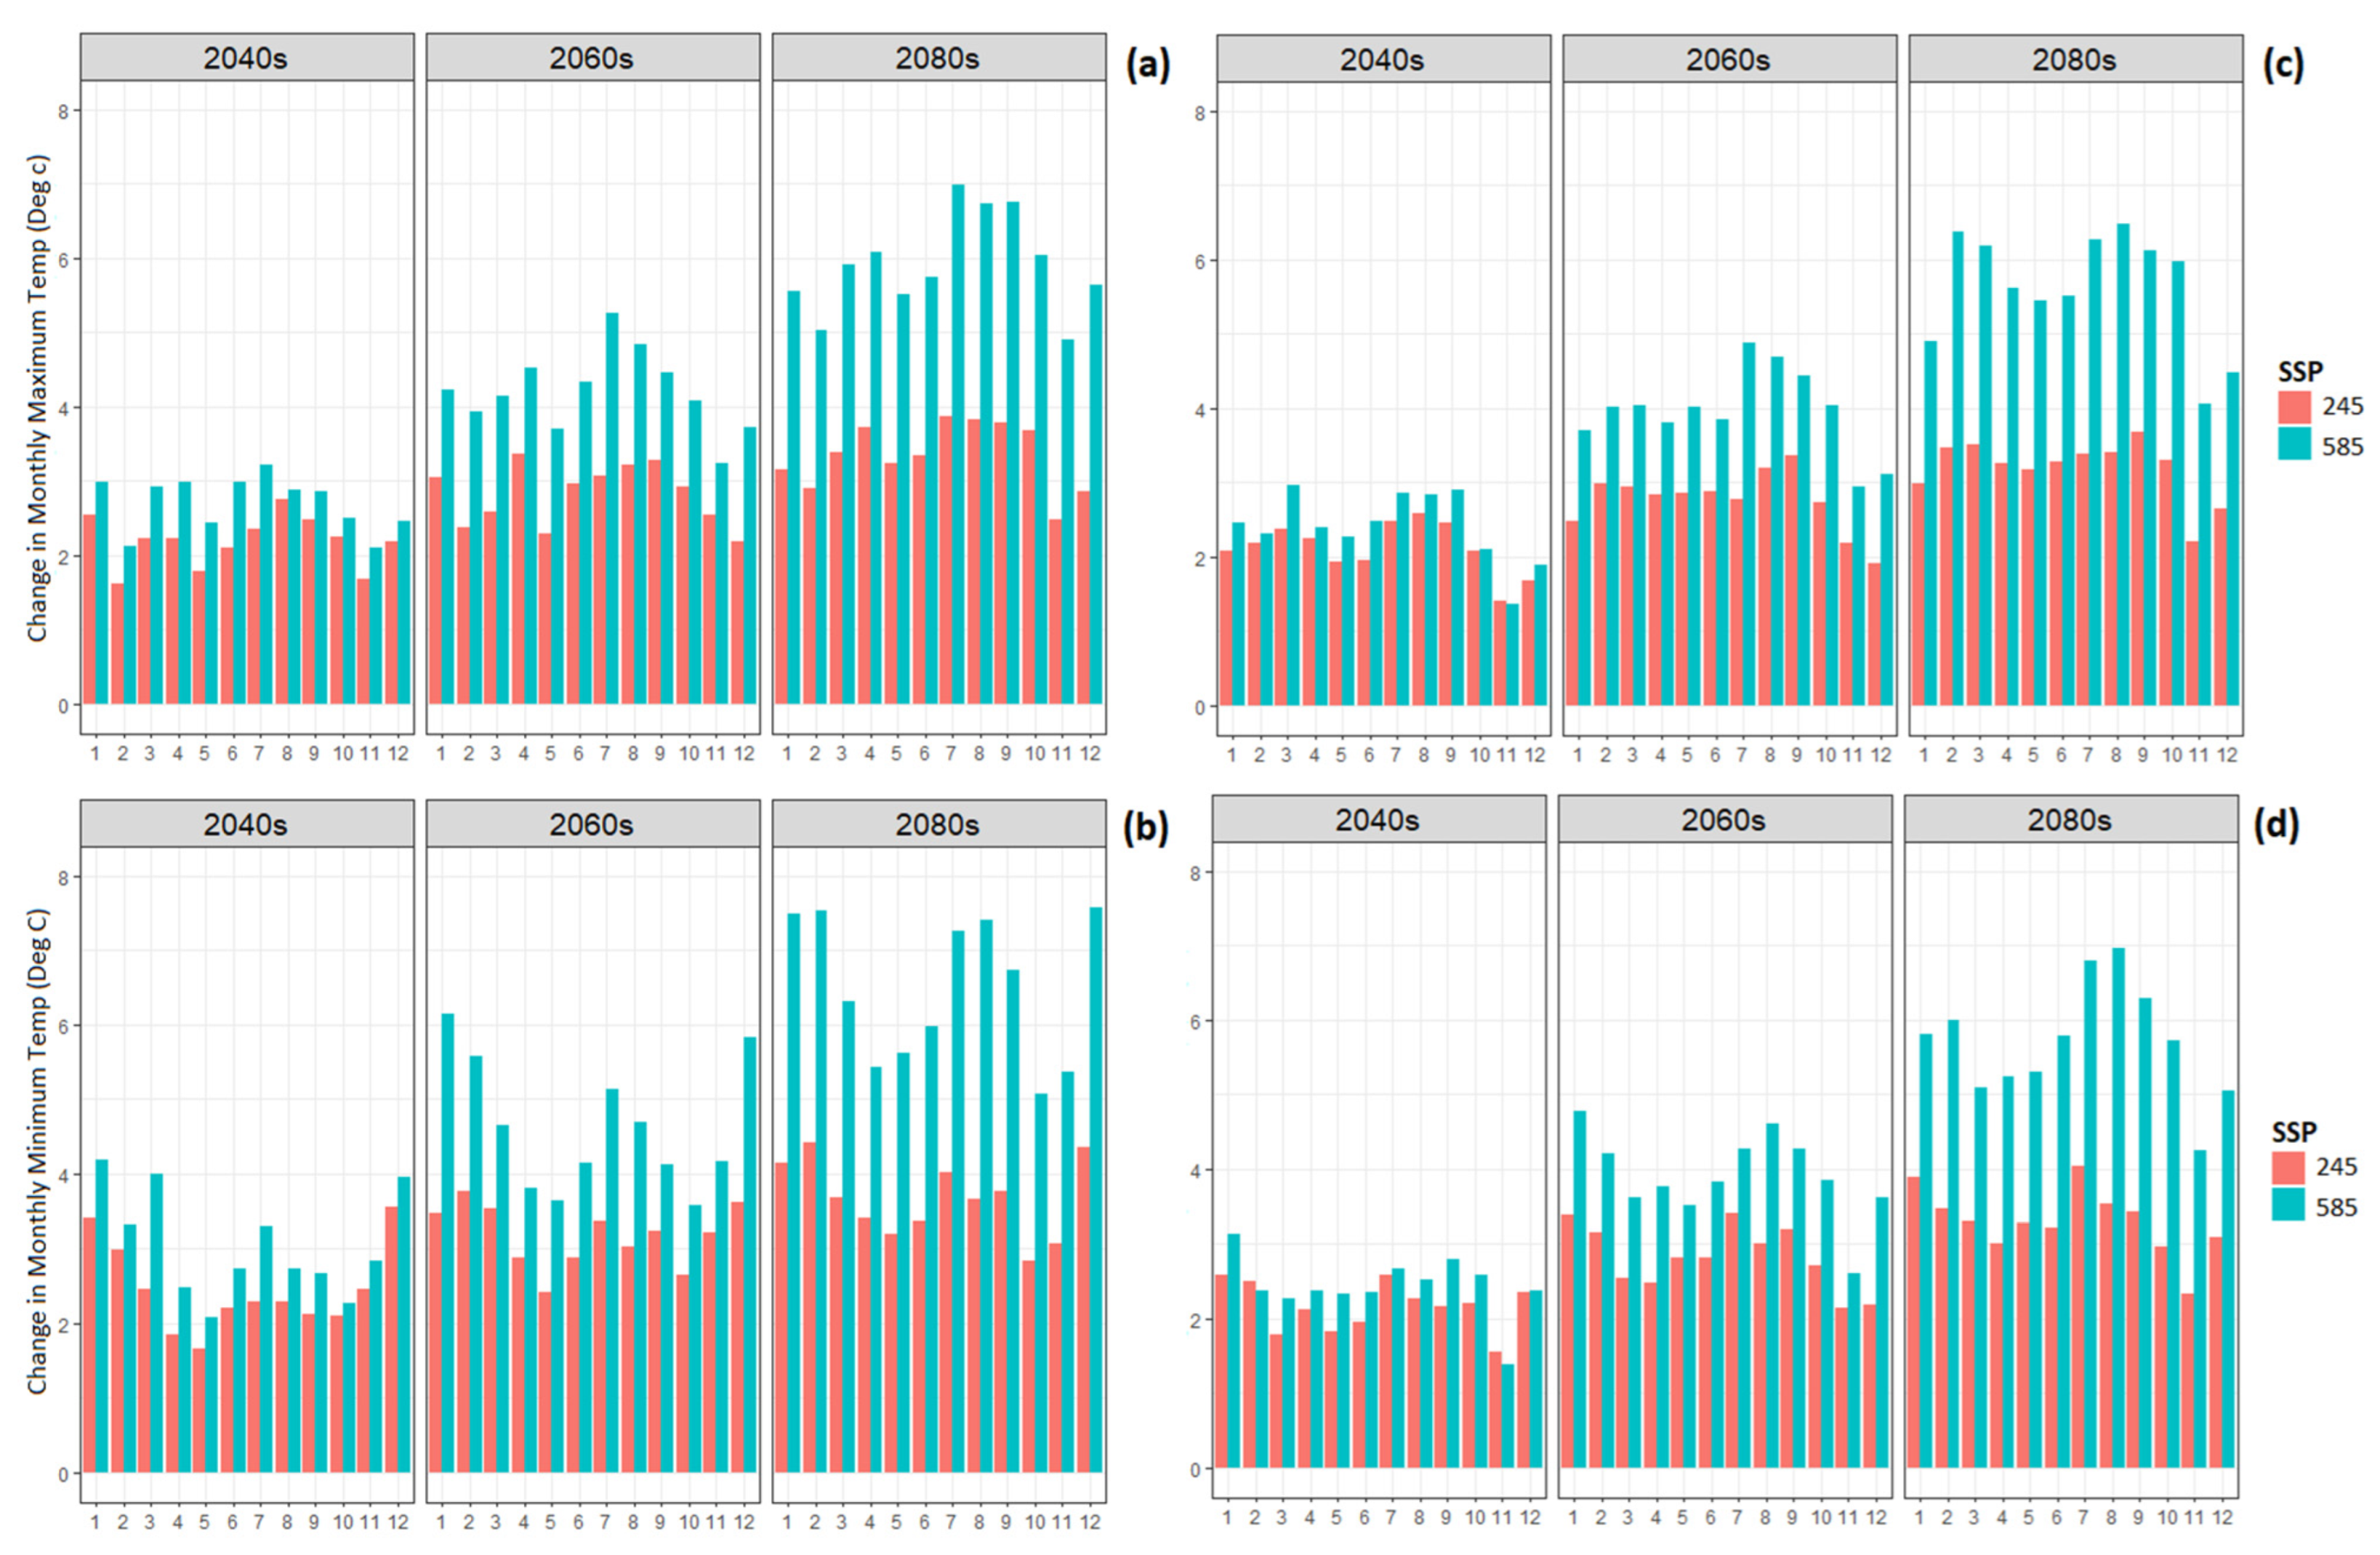
The change in minimum and maximum temperature at monthly scale has been calculated based on median temperature from all 18 models used in this study and the results are presented in Figure 5.
The results suggest that whilst both maximum and minimum temperatures will increase over the future periods, the rate of increase is higher based on the pessimistic SSP585 scenario compared to the moderate scenario of SSP245. Also, the increase in temperature is higher in the far future period, i.e., 2080s, compared to the middle (2060s) and near (2040s) periods. It is also interesting to see that site 1 is likely to experience a slightly higher increase in temperature compared to site 2. For example, under SSP585 and over the 2040s period, site 1 and site 2 would have a 2.7 °C and 2.5 °C increase in their annual maximum temperature, respectively. Using the CMIP5 models outputs dataset at similar locations to the selected sites of this study, Russel et al. (2018) also showed that temperature would consistently increase for both locations in Kazakhstan [19].
The number of freezing days (days with average temperature below zero) will also decrease, especially in March and then April and November at site 1 and February, March, November, and December at site 2, with site 2 experiencing a slightly greater decrease in freezing day conditions compared to site 1. Overall, it means fewer freezing conditions are expected to happen during these months at site 2 (results not shown). A significant change in freezing periods and air temperature can have defining consequences on the development of projects that would rely on water sources such as glaciers or groundwater baseflows that feed streams/rivers/lakes.
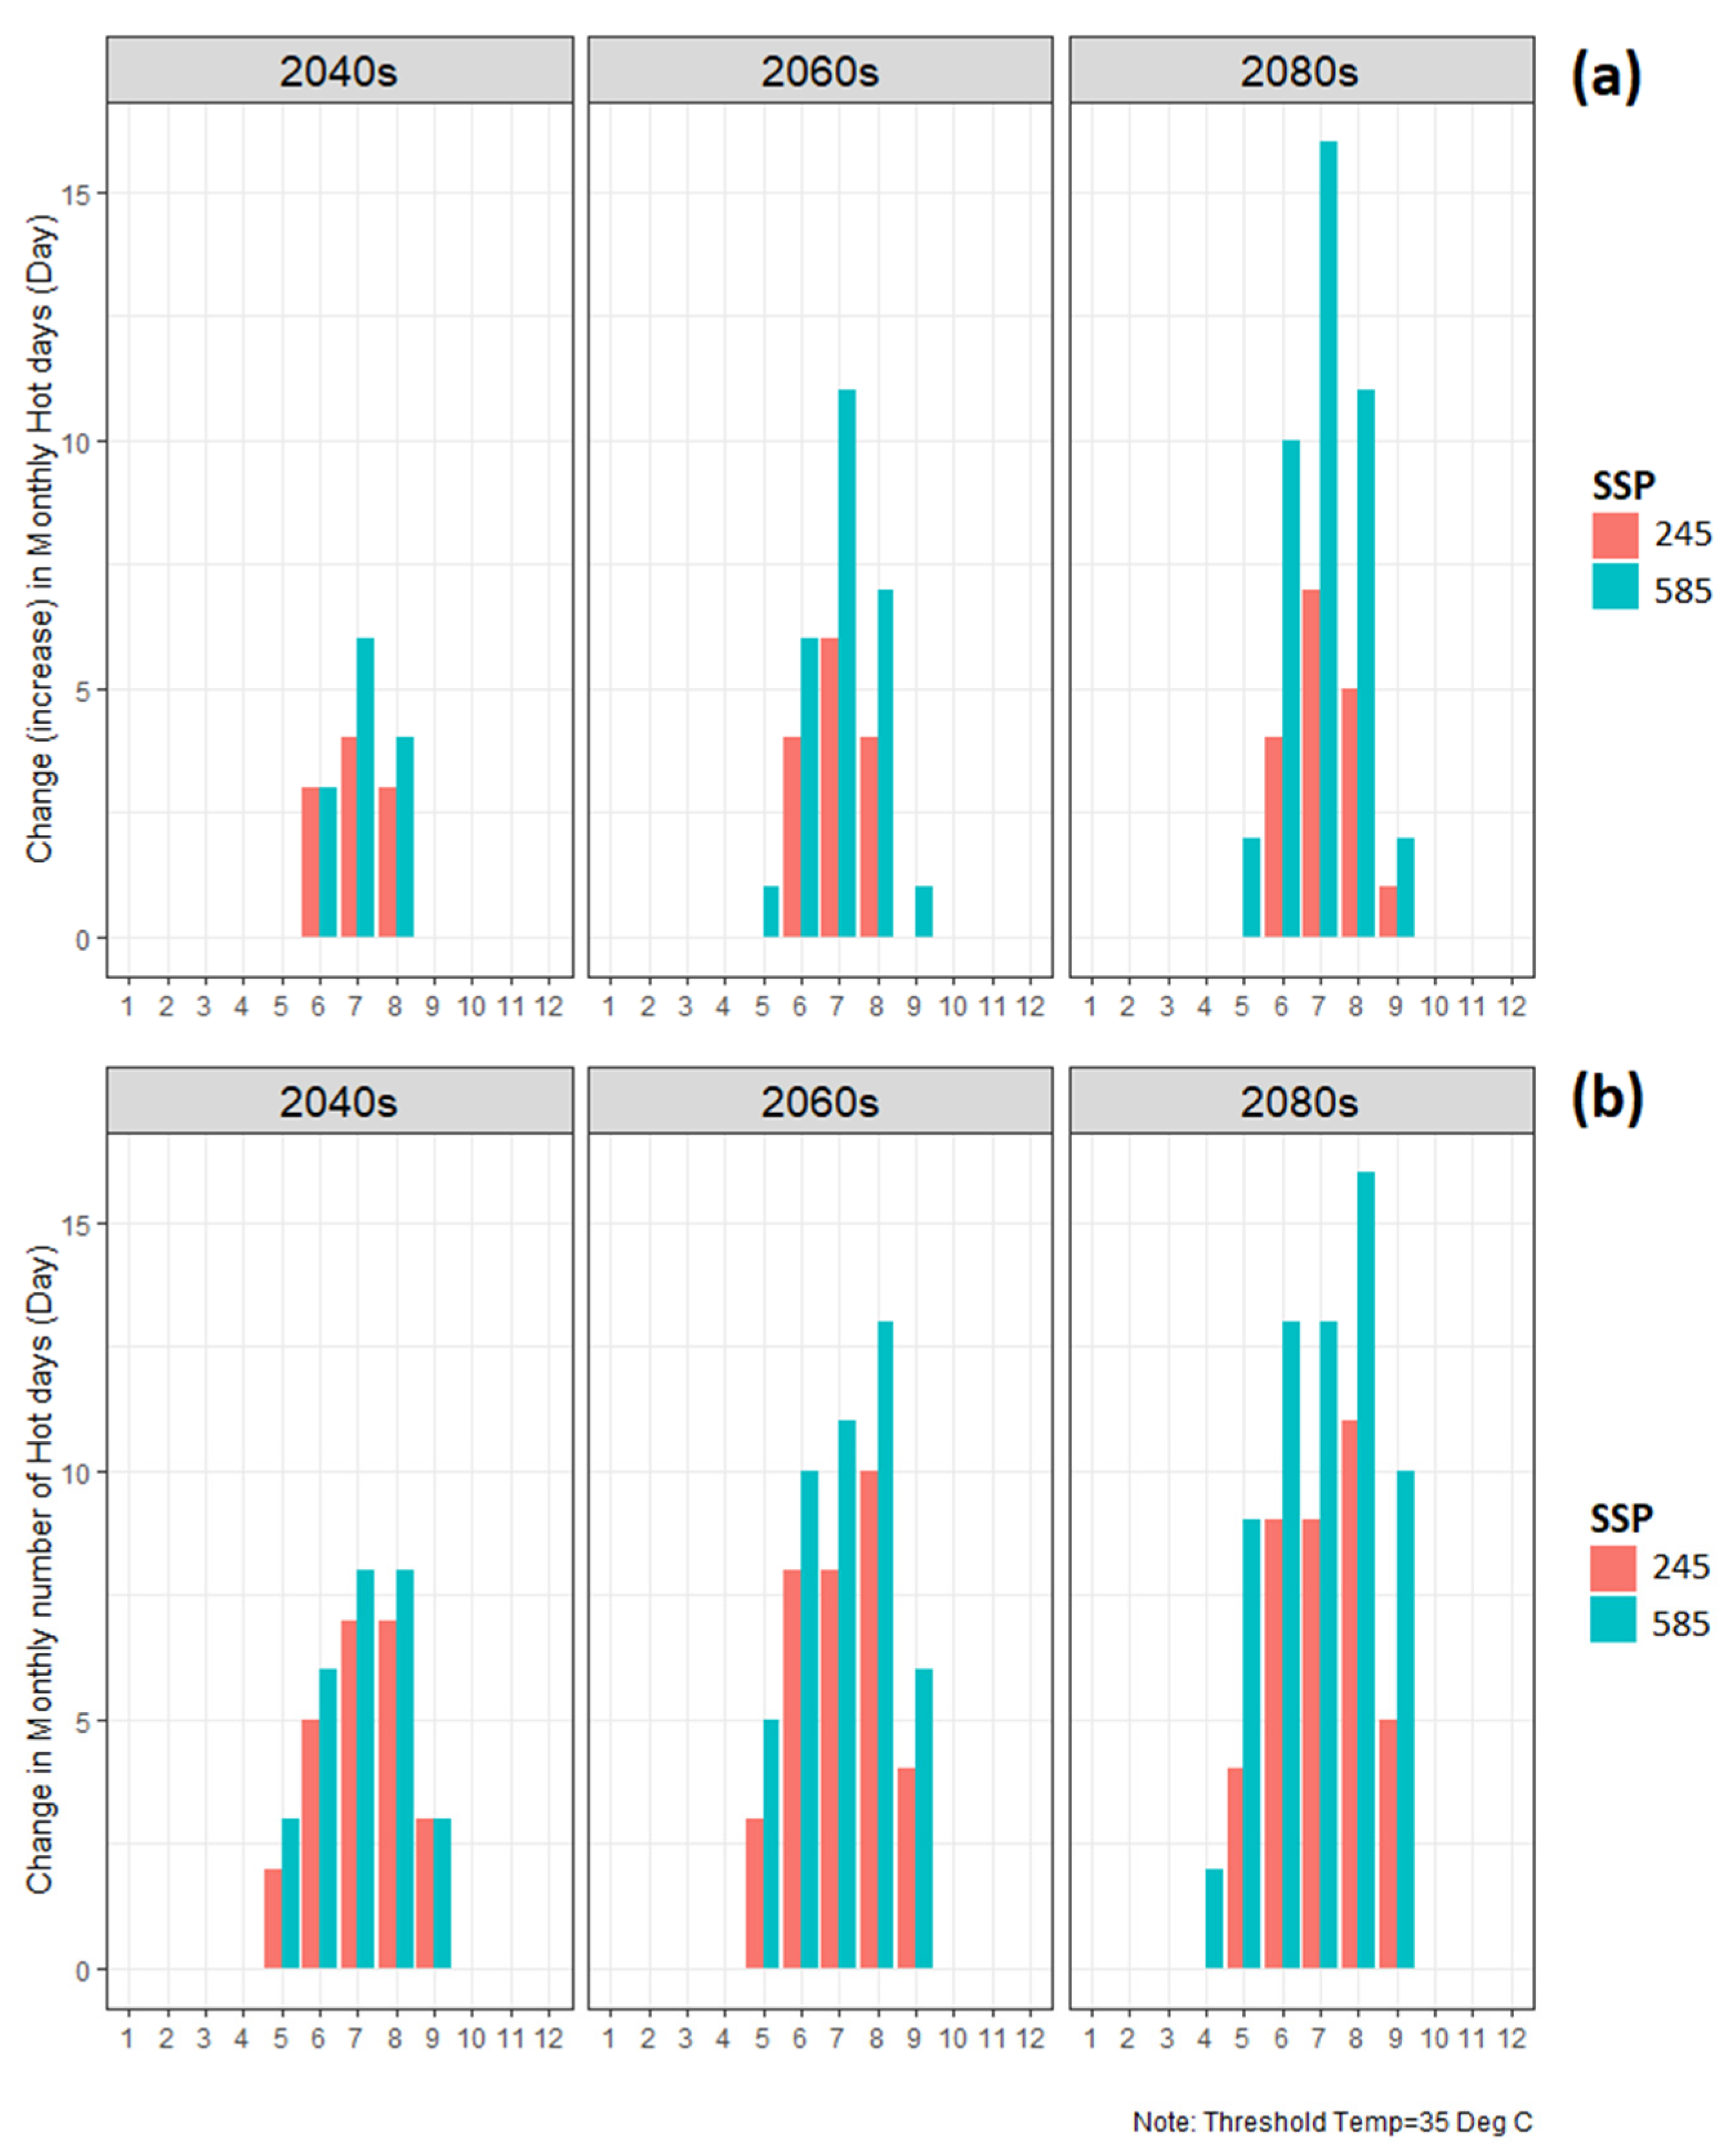
While air temperature alone is not an accurate indicator showing a bearable/comfortable workplace temperature, in this study 35 °C is considered as a threshold for heat stress. Analysis of hot days (number of days with temperature above 35 °C as a threshold) also shows that both sites would experience more frequent hot days, especially in summer months. Site 2 will have more harsh summer months with maximum daily temperatures above 35 °C compared to site 1. For example, in July and over the 2040s, site 2 will have 7 and 8 more days with temperatures above 35 °C, while site 1 will have 4 and 6 more days with hot temperature based on SSP245 and SSP585, respectively (Figure 6). This can lead to more heat stress among the workforce, especially in hot months, which can reduce their efficiency [20]. This might even lead to temporary interruption to mine activities during hot months. This analysis is essential to evaluate the potential impacts of climate change on human health.
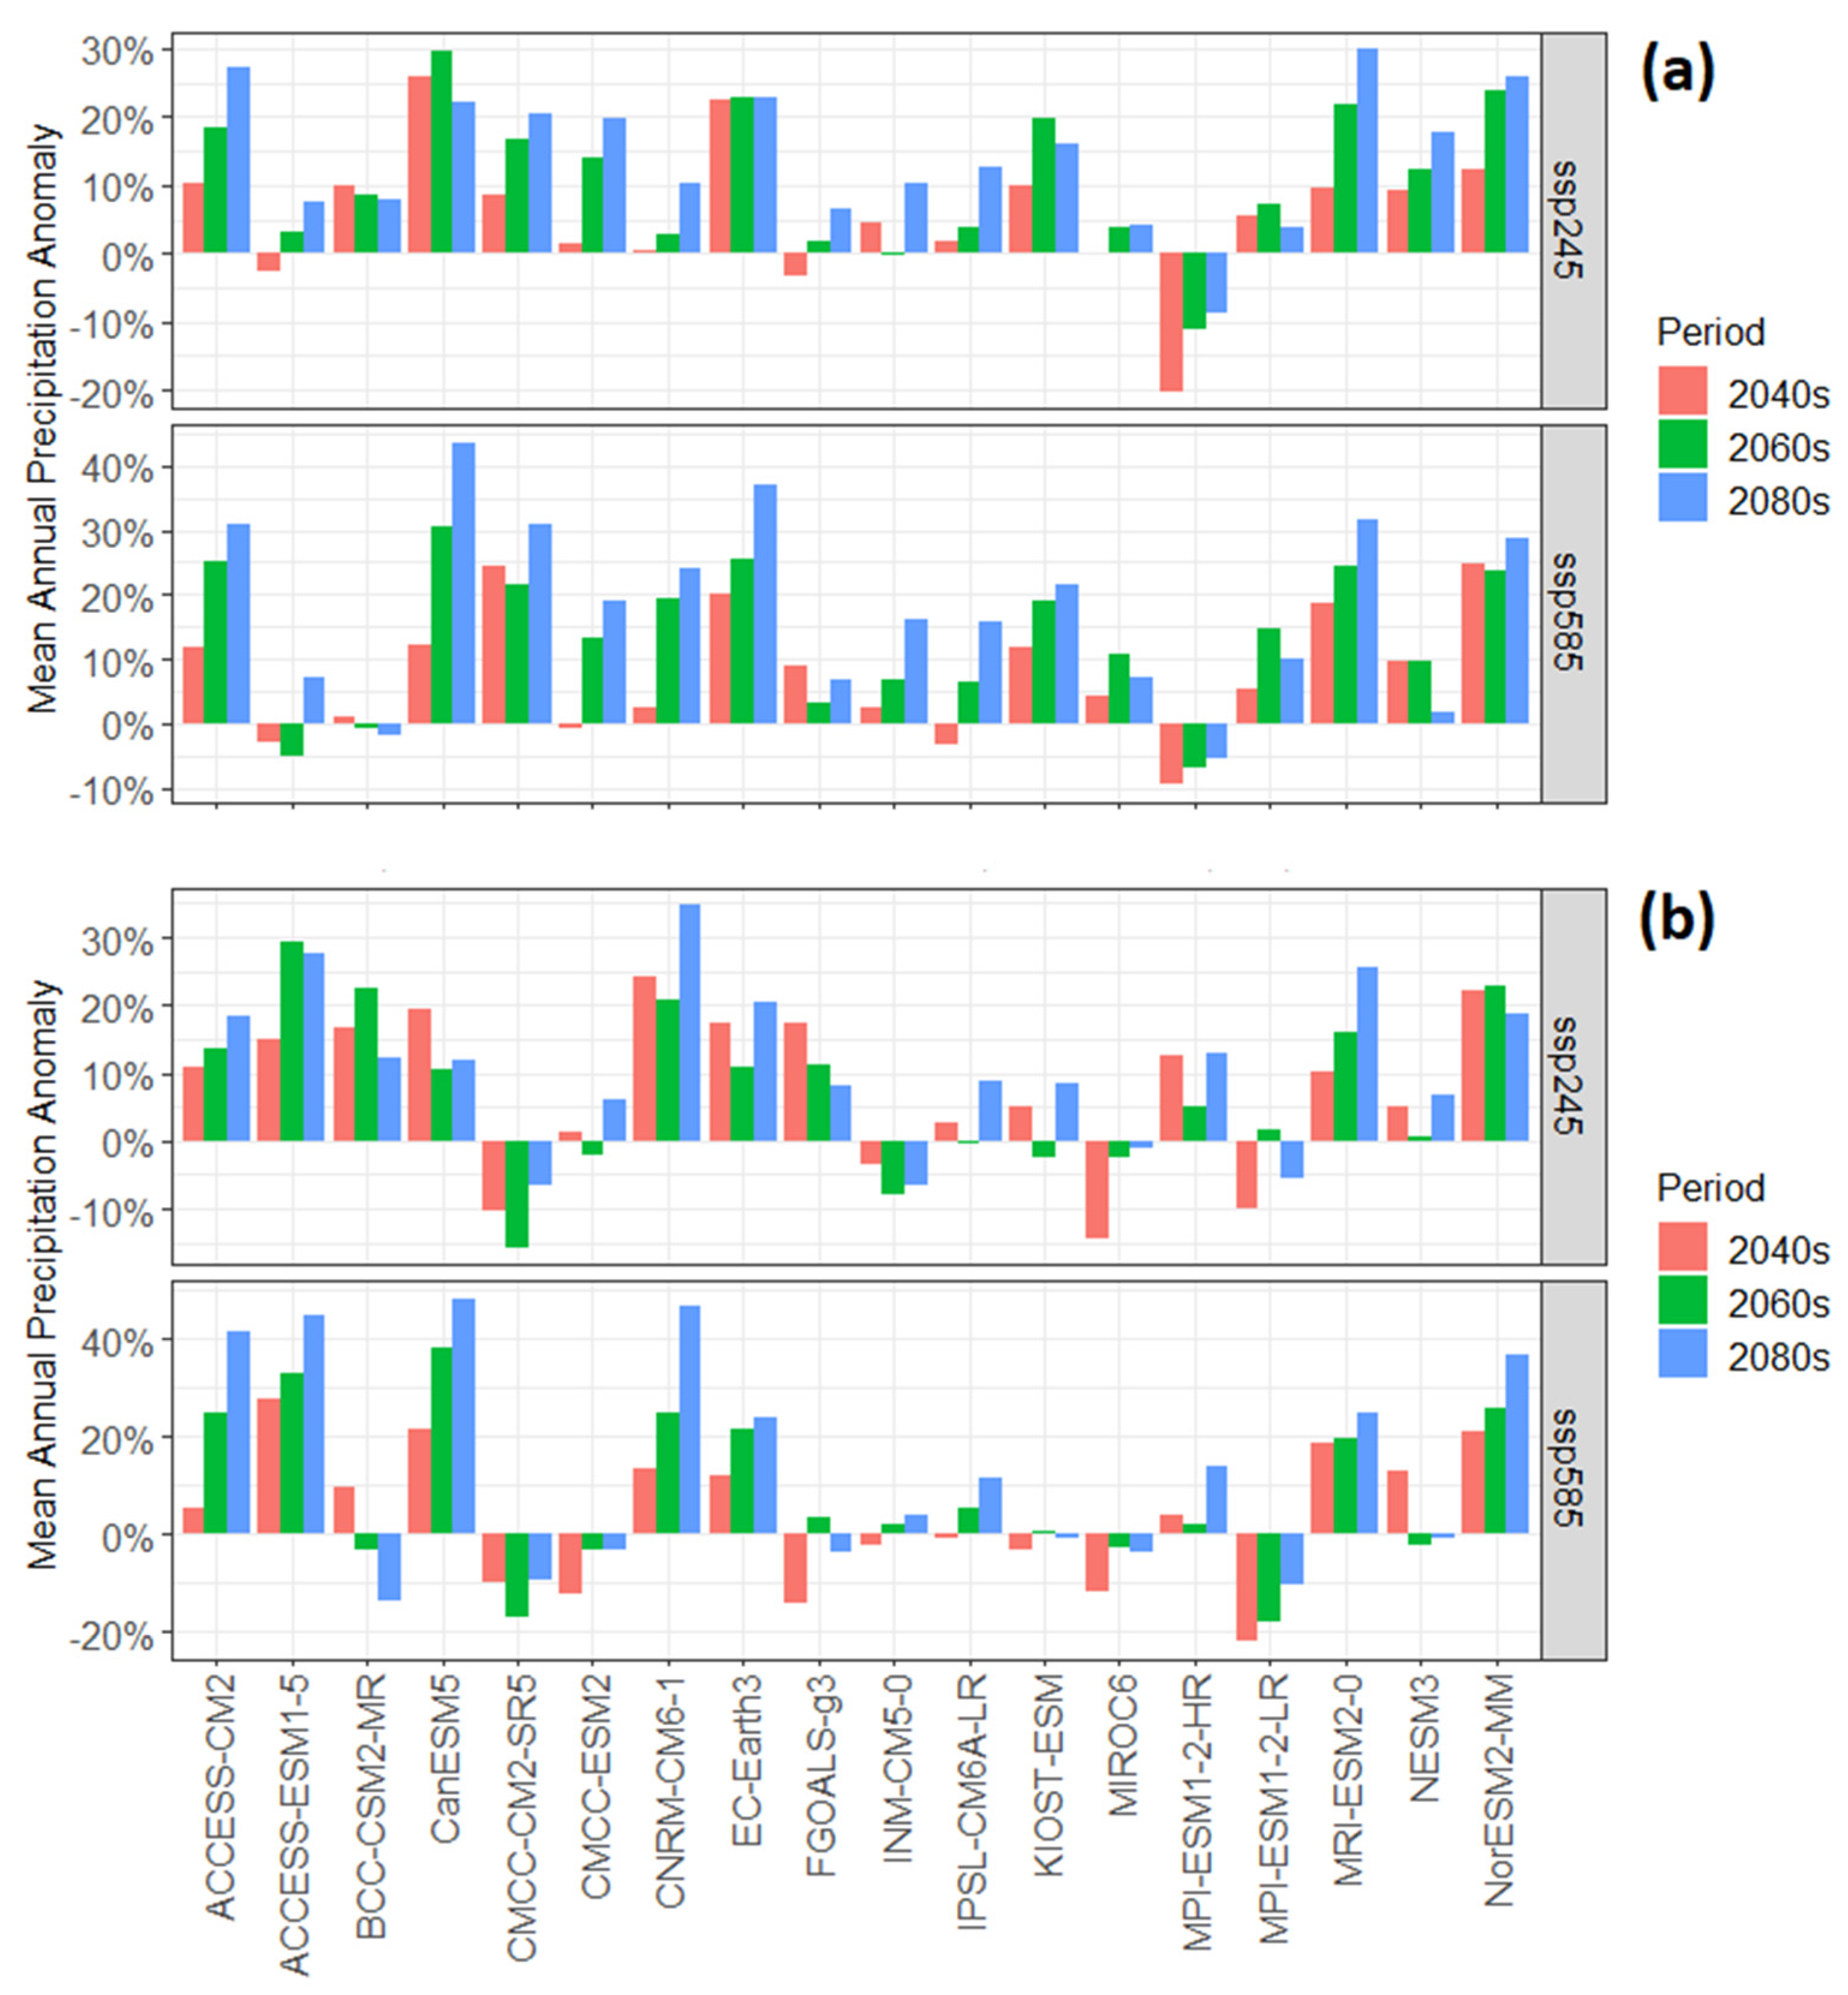
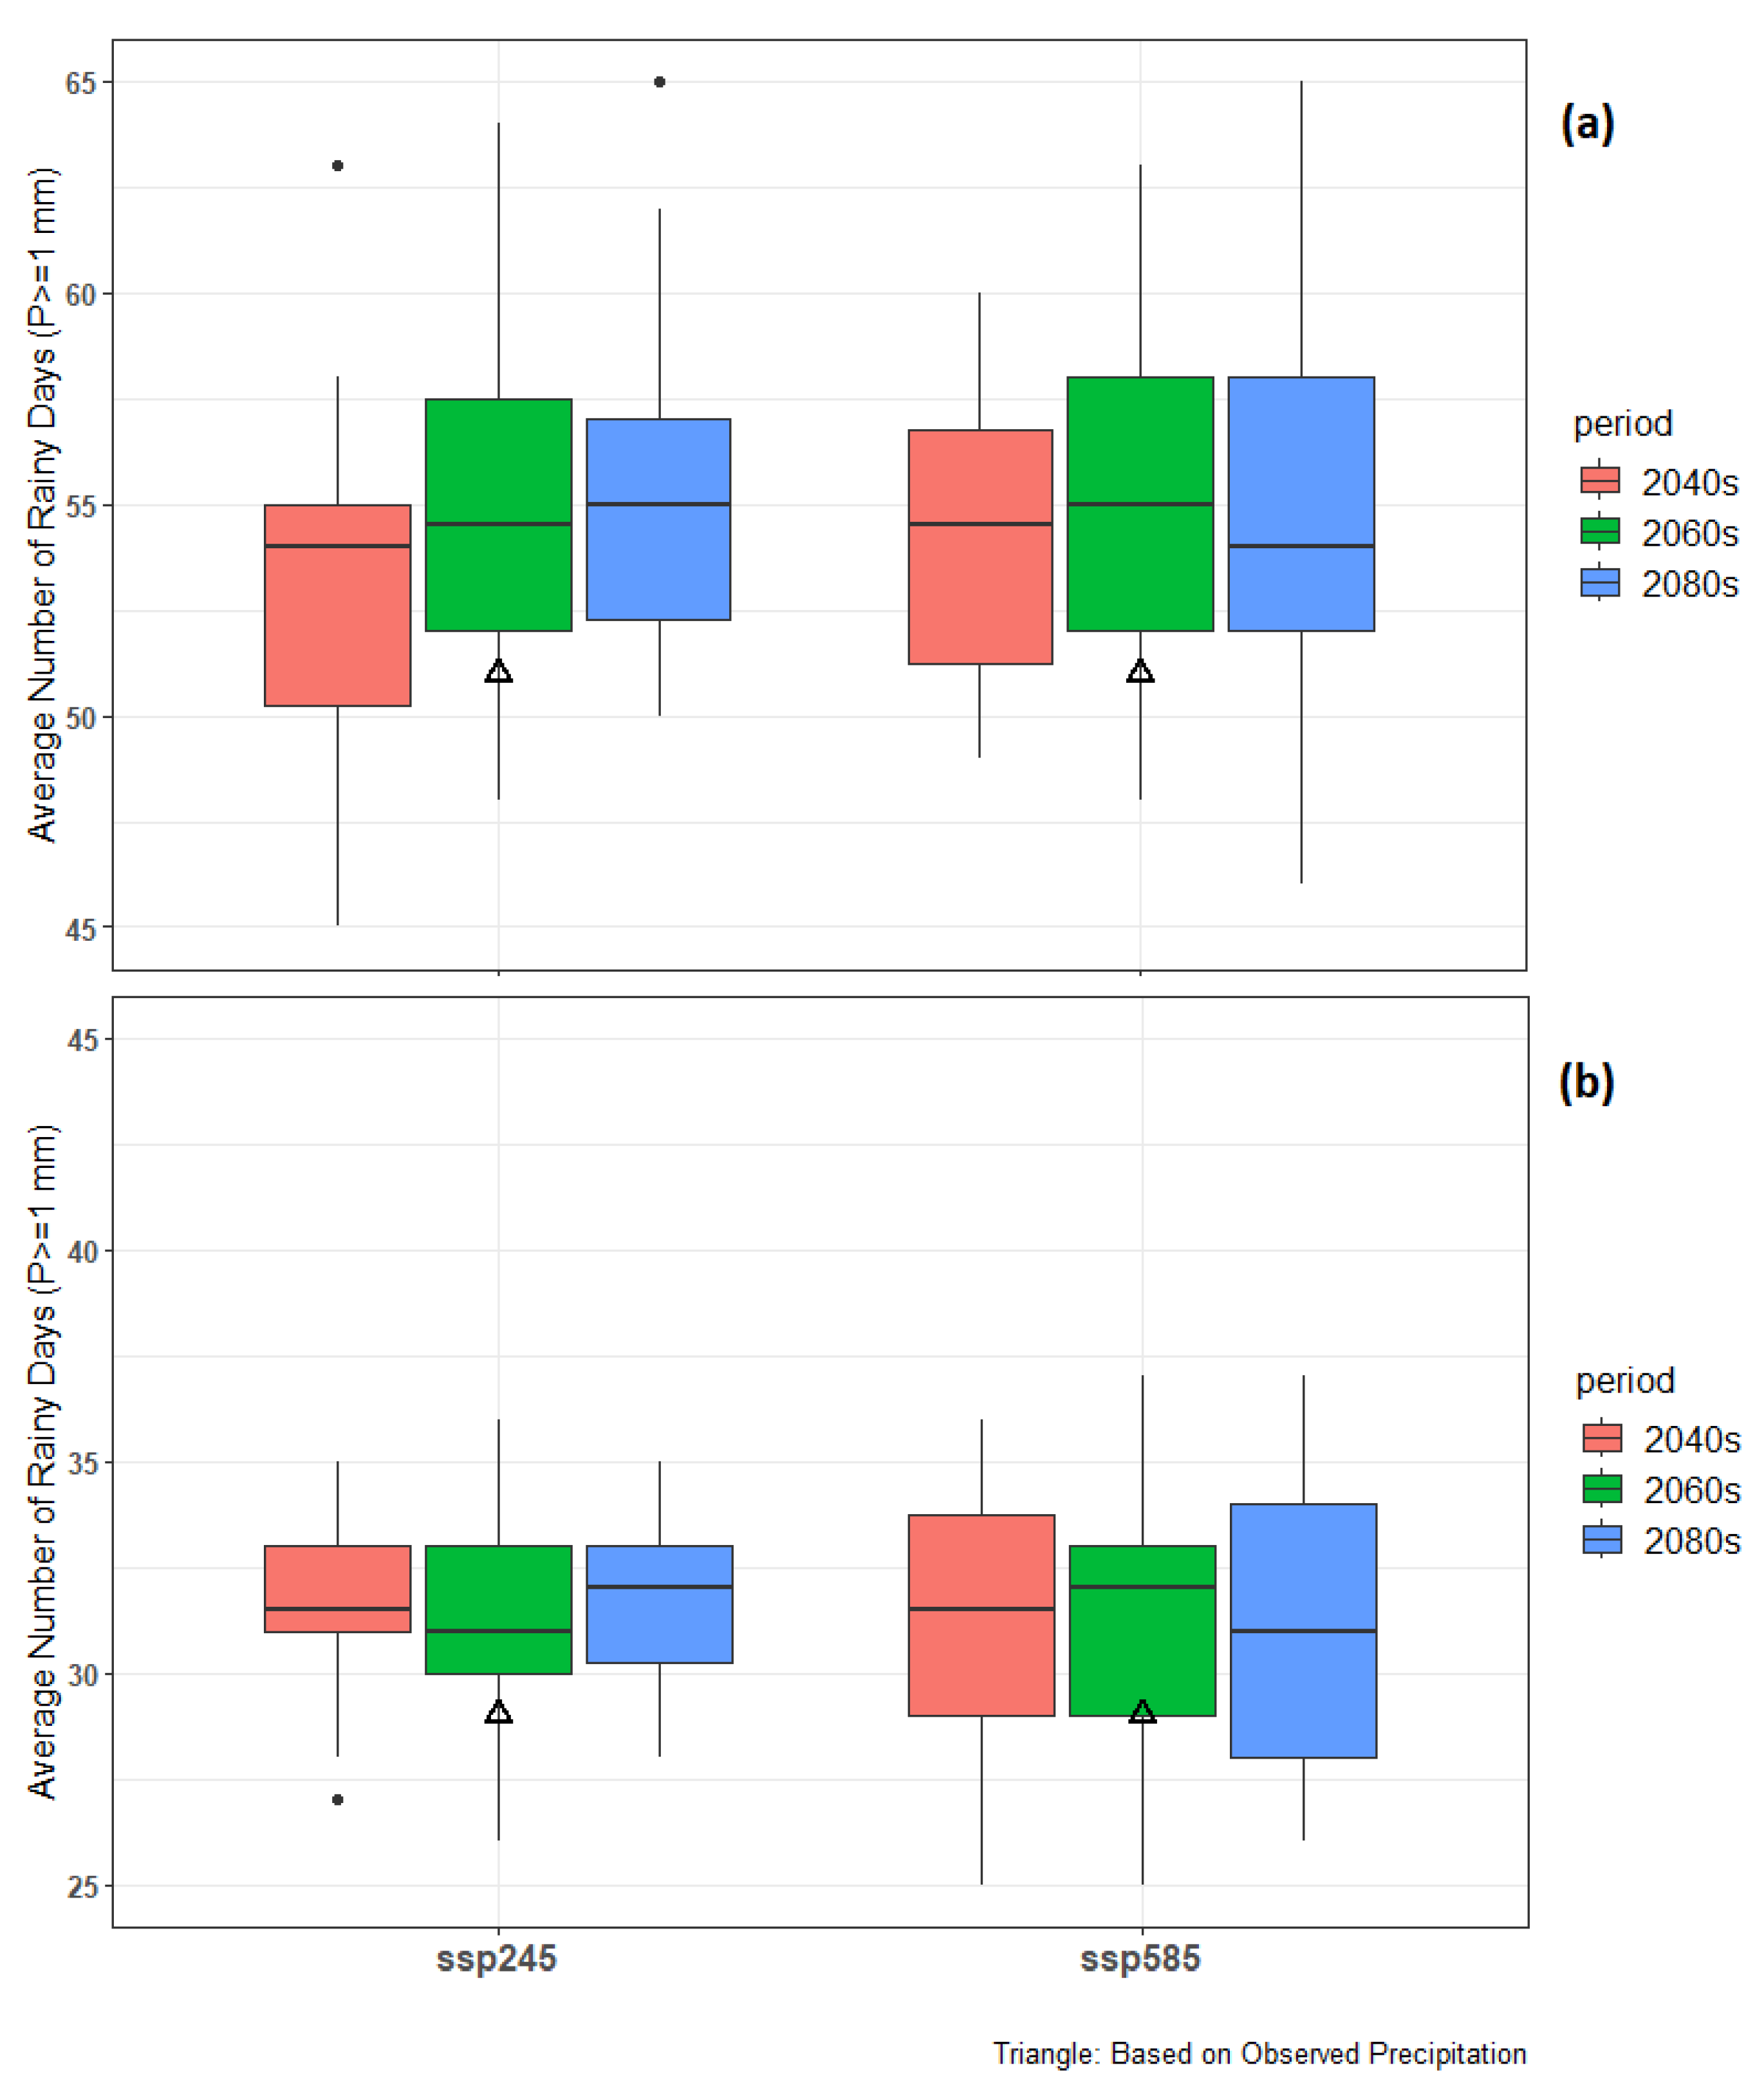
For precipitation, almost all climate models for both SSP scenarios and all future time periods predict an increase in annual precipitation at site 1. The only exceptions are MPI-ESM1-2-HR (all cases) and ACCESS-ESM1 over the 2040s for SSP245, and the 2040s and 2060s for SSP585 scenarios, which show less precipitation in future compared to the baseline period (Figure 7a). Using CMIP5 models in their research, the increase in precipitation is consistent with Huang et al.’s (2014) research considering the sites’ location [21]. On the other hand, at site 2, while the majority of GCM reveal increases in annual precipitation, more models show no change or even show a decrease in mean annual precipitation compared to site 1 (Figure 7b). Based on RCP245 and RCP585, the increase in MAP in the 2040s will be approximately 5.9% and 7.9% at site 1, and 7.9% and 3.8% at site 2, respectively. Conversely, based on SSP245 and SSP585, over the 2080s, the precipitation will increase by 14% and 18% at site 1 and 11% and 13% at site 2, respectively. This means over the near future, site 2 would experience an increase in precipitation compared to site 2, while both sites would experience a decrease over the middle and far future periods. These results are in agreement with previous studies showing an increase in annual mean precipitation of 10.5% and 14.4% under SSP245 and SSP585, respectively, by the end of 21st century in the central Asia region [22]. The number of rainy days (days with precipitation ≥ 1 mm) is very likely to increase based on most of the GCMs under both SSP245 and SSP585 and future periods (Figure 8).
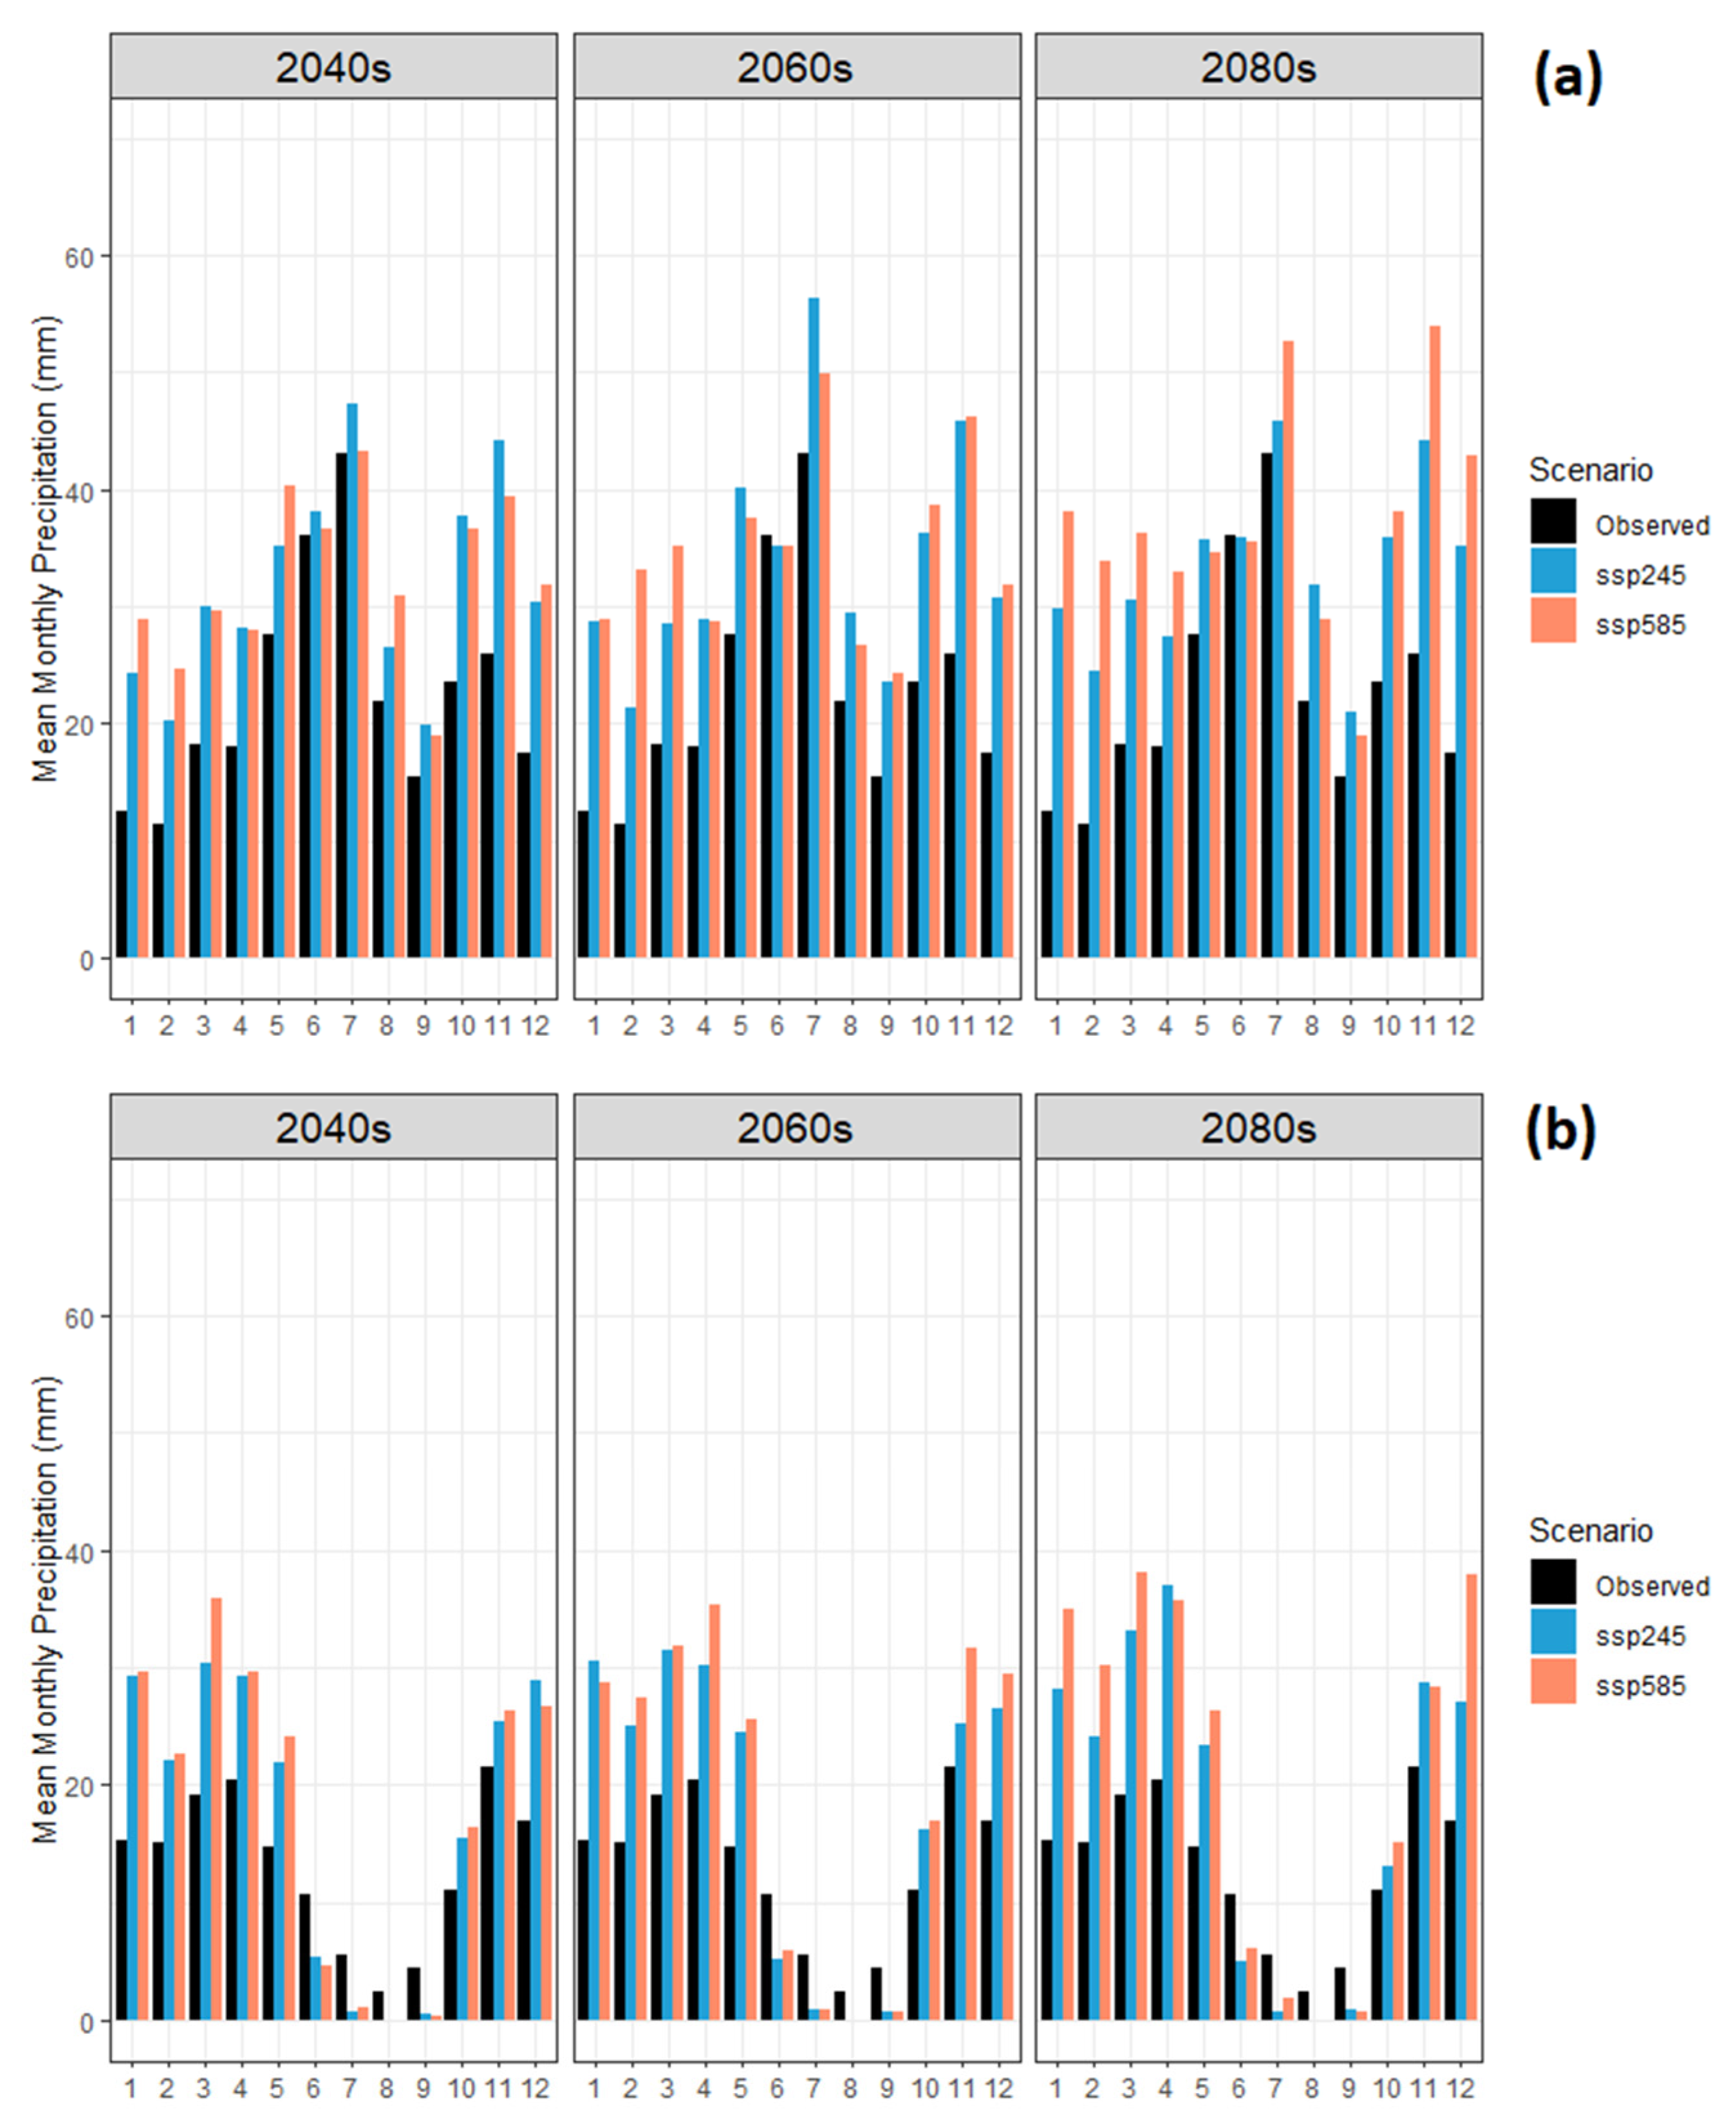
At monthly time scales, the results suggest that while in almost all months and under both SSP245 and SSP585, precipitation would increase over all future periods at site 1, at site 2 and in summer months, July, August, and September, precipitation would decrease in almost all time periods and SSP. All other months at both sites will experience an increase in precipitation, with SSP585 causing a greater increase compared to SSP245 in those months (Figure 9).
Finally, the change in 24 h precipitations with 10% annual exceedance probability (10 year return period) was also assessed, as illustrated in Table 2. Again, it can be seen that except for a few GCM, SSP, and time horizons (e.g., CMCC-CM2-SR5 in most combination of SSP and time horizons at site 2 and FGOALS-g3 for both SSP245 and SSP585 in the 2080s at site 1), in most of the cases, the 24 h precipitation with a 10 year return period is predicted to increase at each site. Over the near future, i.e., 2040, site 1 would experience an average of 6.9% and 4.8% increase in 10 year precipitation events with 24 h duration, while site 2 will expect an increase of 2.8% and 5.9% under SSP245 and SSP585, respectively.
4. Conclusions
Kazakhstan is ranked sixth in the world in terms of estimated mineral resources, and mining and metallurgy are key industries that make a considerable contribution to the GDP of Kazakhstan. On the other hand, most of Kazakhstan has an arid or semi-arid climate with limited water resources, and the origin of the rivers used for water supply are in neighbouring countries. Despite the risk of water supply shortage in the near future, from SRK’s experience, only a few mining projects have conducted studies to evaluate the future climate condition as a result of global warming and climate change.
In this research, the climate change effects on precipitation and temperature at two mine sites in the north–east part of Kazakhstan were evaluated using the latest IPCC assessment report, AR6 socioeconomic pathway–representative concentration scenarios, namely, SSP245 and SSP585.
The downscaled outputs of 18 GCM were bias-corrected using observed historical values, then used to evaluate how maximum and minimum temperature as well as precipitation would likely change in three future periods, namely, the 2040s, 2060s, and 2080s.
The results show that the maximum and minimum temperature is very likely to increase in future periods based on all climate models and both SSP245 and SSP585 scenarios. Greater increase in temperature is expected based on SSP585 in all future time periods and even greater increases are expected in the far future period, i.e., the 2080s, compared to the other two periods under both SSP scenarios. For minimum temperature, the increase will be more in winter months, i.e., in January, February, and December, which means fewer freezing hours/days are expected in the light of climate change. Such predicted change is significant considering the fact that aquifer recharge and highest river flows in Kazakhstan are mainly due to snowmelt. Furthermore, this warmer climate means freeze–thaw cycles will increase, leading to more freeze–thaw-induced landslides, which are one of the major geohazards, especially on grasslands [23].
For precipitation, the average annual increase will be around 7% under both SSP245 and SSP585 at site 1, and 10.5% and 4.5% under SSP245 and SSP585, respectively, at site 2 in the 2040s. In the 2080s, an increase of up to 14% and 17% at site 1 and 10% and 7% at site 2 is expected under SSP245 and SSP585, respectively. On a seasonal time scale, winter, spring, and autumn months show increases in precipitation under most SSP and future time period combinations, whereas it is expected there will be drier summer months, i.e., July and August at site 1 and July, August, and September at site 2. This could have significant consequences as, under current conditions, summer is the wettest season in this region with high temperatures. Therefore, the analysis results suggest that climate change will alter the precipitation regime in the area, and this should be considered in the mine design and cost implications, especially in relation to water supply and management.
Finally, the results of the analysis of 24 h precipitation with a 10 year return period suggest an average increase in precipitation ranging from 4% to 10% for SSP585/2040s and SSP585/2080s, respectively, at site 1 and 1.4% to 13% for SSP245/2040s and SSP585/2080s, respectively, scenario/future period combination at site 2. This predicted increase in precipitation and resulting runoff should be considered in the design of infrastructures such as tailing facilities and diversion channels.
Based on this research and similar studies, it can be seen that using a single GCM model has much uncertainty in terms of model structure and generated outputs; in similar studies, the application of multi-model approaches is strongly suggested to tackle individual model’s uncertainty and produce more robust results with a range of possible outcomes in future periods, as shown in Figure 4 [24]. More efforts can be made in future research on using more advanced multi-model and post-processing approaches to deal with models’ uncertainty and increase the accuracy of predictions. These climate change assessments can provide an opportunity for mine owners and managers to incorporate these assessments for improved management of climate-change-related liability and risks, and also to demonstrate to investors and insurance companies how climate-related risks will be coped with in the future. By undertaking climate risk assessments, managers are able to identify potential adaption measures to address relevant risks/opportunities.
Author Contributions
Conceptualization, S.G. and H.E.-I.; methodology, S.G. and D.S.; analysis in R, S.G.; results validation, S.G., H.E.-I. and D.S.; writing—original draft preparation, S.G.; writing—review and editing, S.G., H.E.-I. and D.S.; visualization, S.G. All authors have read and agreed to the published version of the manuscript.
Funding
This research received no external funding.
Data Availability Statement
Downscaled climate projection for all GCMs used in this study can be downloaded from NASA website at www.nasa.gov/nex/gddp, accessed on 5–11 April 2023.
Conflicts of Interest
The authors declare no conflict of interest.
References
- Deere-Birkbeck, C. Global governance in the context of climate change: The challenges of increasingly complex risk parameters. Int. Aff. 2009, 85, 1173–1194. [Google Scholar] [CrossRef]
- Li, H.-M.; Wang, X.-C.; Zhao, X.-F.; Qi, Y. Understanding systemic risk induced by climate change. Adv. Clim. Change Res. 2021, 12, 384–394. [Google Scholar] [CrossRef]
- Global Industry Standard on Tailings Management. 2020. Available online: https://globaltailingsreview.org/global-industry-standard (accessed on 11 April 2023).
- Rüttinger, L.; Sharma, V. Climate Change and Mining: A Foreign Policy Perspective; Adelphi: Berlin, Germany, 2016. [Google Scholar]
- Krogerus, K.; Pasanen, A. Management of Water Balance in Mining Areas–WaterSmart; Reports of Finnish Environment Institute 39. 2016. Available online: https://core.ac.uk/download/pdf/78562616.pdf (accessed on 11 April 2023).
- Odell, S.D.; Bebbington, A.; Frey, K.E. Mining and climate change: A review and framework for analysis. Extr. Ind. Soc. 2018, 5, 201–214. [Google Scholar] [CrossRef]
- Farjad, B.; Gupta, A.; Sartipizadeh, H.; Cannon, A.J. A novel approach for selecting extreme climate change scenarios for climate change impact studies. Sci. Total Environ. 2019, 678, 476–485. [Google Scholar] [CrossRef] [PubMed]
- Moradian, S.; Torabi Haghighi, A.; Asadi, M.; Mirbagheri, S.A. Future changes in precipitation over northern urope based on a multi-model ensemble from CMIP6: Focus on Tana River Basin. Water Resour. Manag. 2023, 37, 2447–2463. [Google Scholar] [CrossRef]
- Rhymee, H.; Shams, S.; Ratnayake, U.; Rahman, E.K.A. Comparing Statistical Downscaling and Arithmetic Mean in Simulating CMIP6 Multi-Model Ensemble over Brunei. Hydrology 2022, 9, 161. [Google Scholar] [CrossRef]
- Dike, V.N.; Lin, Z.; Fei, K.; Langendijk, G.S.; Nath, D. Evaluation and multimodel projection of seasonal precipitation extremes over central Asia based on CMIP6 simulations. Int. J. Climatol. 2022, 42, 7228–7251. [Google Scholar] [CrossRef]
- Chen, S.; Yuan, X. CMIP6 projects less frequent seasonal soil moisture droughts over China in response to different warming levels. Environ. Res. Lett. 2021, 16, 044053. [Google Scholar] [CrossRef]
- Thrasher, B.; Wang, W.; Michaelis, A.; Melton, F.; Lee, T.; Nemani, R. NASA global daily downscaled projections, CMIP6. Sci. Data 2022, 9, 262. [Google Scholar] [CrossRef]
- Wu, F.; Jiao, D.; Yang, X.; Cui, Z.; Zhang, H.; Wang, Y. Evaluation of NEX-GDDP-CMIP6 in simulation performance and drought capture utility over China–based on DISO. Hydrol. Res. 2023, 54, 703–721. [Google Scholar] [CrossRef]
- Murali, G.; Iwamura, T.; Meiri, S.; Roll, U. Future temperature extremes threaten land vertebrates. Nature 2023, 615, 461–467. [Google Scholar] [CrossRef] [PubMed]
- Ghazi, B.; Dutt, S.; Haghighi, A.T. Projection of Future Meteorological Droughts in Lake Urmia Basin, Iran. Water 2023, 15, 1558. [Google Scholar] [CrossRef]
- Beck, H.E.; Zimmermann, N.E.; McVicar, T.R.; Vergopolan, N.; Berg, A.; Wood, E.F. Present and future Köppen-Geiger climate classification maps at 1-km resolution. Sci. Data 2018, 5, 180214. [Google Scholar] [CrossRef] [PubMed] [Green Version]
- Zheng, X.; Ma, Q.; Wang, Y.; Wang, X.; Zhang, X.; Luan, Q. Assessing Impact of Temperature Variability of Climate Change on Mortality Based on Multiple GCM Projections in China. Atmosphere 2022, 13, 1775. [Google Scholar] [CrossRef]
- Guga, S.; Ma, Y.; Riao, D.; Zhi, F.; Xu, J.; Zhang, J. Drought monitoring of sugarcane and dynamic variation characteristics under global warming: A case study of Guangxi, China. Agric. Water Manag. 2023, 275, 108035. [Google Scholar] [CrossRef]
- Russell, A.; Ghalaieny, M.; Gazdiyeva, B.; Zhumabayeva, S.; Kurmanbayeva, A.; Akhmetov, K.K.; Mukanov, Y.; McCann, M.; Ali, M.; Tucker, A.; et al. A spatial survey of environmental indicators for Kazakhstan: An examination of current conditions and future needs. Int. J. Environ. Res. 2018, 12, 735–748. [Google Scholar] [CrossRef] [Green Version]
- Maurya, T.; Karena, K.; Vardhan, H.; Aruna, M.; Raj, M.G. Effect of heat on underground mine workers. Procedia Earth Planet. Sci. 2015, 11, 491–498. [Google Scholar] [CrossRef] [Green Version]
- Huang, A.; Zhou, Y.; Zhang, Y.; Huang, D.; Zhao, Y.; Wu, H. Changes of the annual precipitation over central Asia in the twenty-first century projected by multimodels of CMIP5. J. Clim. 2014, 27, 6627–6646. [Google Scholar] [CrossRef]
- Jiang, J.; Zhou, T.; Chen, X.; Zhang, L. Future changes in precipitation over Central Asia based on CMIP6 projections. Environ. Res. Lett. 2020, 15, 054009. [Google Scholar] [CrossRef]
- Yang, J.; Wu, G.; Jiao, J.; Dyck, M.; He, H. Freeze-thaw induced landslides on grasslands in cold regions. Catena 2022, 219, 106650. [Google Scholar] [CrossRef]
- Juneng, L.; Tangang, F.T.; Kang, H.; Lee, W.J.; Seng, Y.K. Statistical downscaling forecasts for winter monsoon precipitation in Malaysia using multimodel output variables. J. Clim. 2010, 23, 17–27. [Google Scholar] [CrossRef]
Figure 1.
Location of selected mine sites in Kazakhstan.

Figure 2.
Flowchart of different phases for climate change studies.

Figure 3.
Average annual precipitation before bias correction (a) and after bias corrections (b) at site 1.
Figure 3.
Average annual precipitation before bias correction (a) and after bias corrections (b) at site 1.

Figure 4.
Time series of average annual temperature at (a) site 1 and (b) site 2. Coloured solid lines show the median of GCMs outputs. Black dashed line shows the observed values at each site.
Figure 4.
Time series of average annual temperature at (a) site 1 and (b) site 2. Coloured solid lines show the median of GCMs outputs. Black dashed line shows the observed values at each site.

Figure 5.
Change in monthly maximum (a,c) and minimum (b,d) temperature (in °C) over future periods for site 1 (a,b) and site 2 (c,d).
Figure 5.
Change in monthly maximum (a,c) and minimum (b,d) temperature (in °C) over future periods for site 1 (a,b) and site 2 (c,d).

Figure 6.
Change in number of hot days (days with temperatures above 35 °C) over future periods for site 1 (a) and site 2 (b). Only months with days above threshold temperature are shown.
Figure 6.
Change in number of hot days (days with temperatures above 35 °C) over future periods for site 1 (a) and site 2 (b). Only months with days above threshold temperature are shown.

Figure 7.
Rate of change (%) in MAP over future time periods and two climate change scenarios at (a) site 1 and (b) site 2.
Figure 7.
Rate of change (%) in MAP over future time periods and two climate change scenarios at (a) site 1 and (b) site 2.

Figure 8.
Boxplot of number of rainy days at (a) site 1 and (b) site 2. Triangles show the observed values over the baseline period.
Figure 8.
Boxplot of number of rainy days at (a) site 1 and (b) site 2. Triangles show the observed values over the baseline period.

Figure 9.
Monthly precipitation over future time periods and different SSPs based on median of 18 GCM used in this study at (a) site 1 and (b) site 2. Black bars show the historical observed precipitation.
Figure 9.
Monthly precipitation over future time periods and different SSPs based on median of 18 GCM used in this study at (a) site 1 and (b) site 2. Black bars show the historical observed precipitation.


Table 1.
Global climate models (GCM) considered within coupled model intercomparison project phase 6 (CMIP6) and downscaled by NASA as a part of the NEX-GDDP project.
Table 1.
Global climate models (GCM) considered within coupled model intercomparison project phase 6 (CMIP6) and downscaled by NASA as a part of the NEX-GDDP project.
| Climate Institute/Centre | Country | GCM Model Name |
|---|---|---|
| Beijing Climate Centre | China | BCC-CSM2-MR |
| Canadian Centre for Climate Modelling and Analysis | Canada | CanESM2 |
| Centre National de Recherches Météorologiques, Centre Européen de Recherche et de Formation Avancée en Calcul Scientifique | France | CNRM-CM6 |
| Commonwealth Scientific and Industrial Research Organization/Bureau of Meteorology | Australia | ACCESS-ESM1 |
| ACCESS-CM2 | ||
| Russian Academy of Sciences, Institute of Numerical Mathematics | Russia | INMCM5.0 |
| Institute Pierre Simon Laplace | France | IPSL-CM6A-LR |
| IPSL-CM6A-LR | ||
| Atmosphere and Ocean Research Institute (The University of Tokyo), National Institute for Environmental Studies, and Japan Agency for Marine–Earth Science and Technology | Japan | MIROC6 |
| Max Planck Institute for Meteorology | Germany | MPI-ESM-LR |
| MPI-ESM-MR | ||
| Meteorological Research Institute | Japan | MRI-ESM2 |
| Bjerknes Centre for Climate Research, Norwegian Meteorological Institute | Norway | NorESM2 |
| Geophysical Fluid Dynamics Laboratory | USA | GFDL-CM4 |
| Euro-Mediterranean Centre on Climate Change | Italy | CMCC-ESM2 |
| European consortium of national meteorological services and research institutes | European community | EC-Earth3 |
| Chinese Academy of Sciences | China | FGOALS-g3 |
| Nanjing University of Information Science and Technology | China | NESM3 |
Table 2.
Percent change in 24 h precipitation with 10 year return period based on different GCM.
| Mine Location | Site 1 | Site 2 | ||||||||||
|---|---|---|---|---|---|---|---|---|---|---|---|---|
| Period | 2040s | 2040s | 2060s | 2060s | 2080s | 2080s | 2040s | 2040s | 2060s | 2060s | 2080s | 2080s |
| RCP | SSP245 | SSP585 | SSP245 | SSP585 | SSP245 | SSP585 | SSP245 | SSP585 | SSP245 | SSP585 | SSP245 | SSP585 |
| ACCESS-CM2 | 17.3 | 13.2 | 17.9 | 16.5 | 13.7 | 20.6 | 8 | 1.9 | 19.3 | 28.1 | 19.6 | 25.4 |
| ACCESS-ESM1-5 | 13.5 | 10.8 | 23.2 | 10.7 | 20.9 | 19.2 | 7.4 | 12.8 | 15.4 | 13.1 | 14.2 | 13 |
| BCC-CSM2-MR | 19.2 | 11.6 | 17.9 | 9.6 | 13.7 | 4.5 | 1.6 | 2.7 | 6.9 | 1.9 | 2 | 0.4 |
| CanESM5 | 4.8 | 3.9 | 7.5 | 13.2 | 8.5 | 19.8 | 3.7 | 13.9 | 12.7 | 15.7 | 17.5 | 26.1 |
| CMCC-CM2-SR5 | 1.7 | 1.4 | 1.6 | −2.6 | 6.9 | 15 | −4.1 | −6.2 | 5 | 1.3 | −1 | −0.7 |
| CMCC-ESM2 | −3.6 | −9.1 | −4.2 | −5.6 | −2.4 | 4.1 | 1.2 | 6.7 | 12.1 | 6.1 | 8.5 | 13.4 |
| CNRM-CM6-1 | −3.3 | −3.9 | 8.4 | 6.3 | 17.7 | 5.7 | 5.1 | 19.2 | −1.4 | 15.8 | 21.6 | 34.5 |
| EC-Earth3 | 17.9 | 20.3 | 18.2 | 17.3 | 24.7 | 13.2 | 26.3 | 18.9 | 19.8 | 17.7 | 9.9 | 12.8 |
| FGOALS-g3 | 7.4 | −4.9 | 6.4 | −8.7 | −8.7 | −8.3 | 9.3 | 0 | 11 | 10.4 | 1.8 | 13.7 |
| INM-CM5-0 | −1.1 | 1.9 | 0 | 7.1 | 9.6 | 9.5 | 0.1 | 13.8 | 6.2 | 7.2 | −5.6 | 8.5 |
| IPSL-CM6A-LR | 9.8 | −0.3 | 0.7 | 5.8 | 13.9 | 22.7 | −4.4 | 15 | −4.6 | 17.5 | 6.8 | 6.4 |
| KIOST-ESM | 15.9 | 4.6 | 21.3 | 5.7 | 8.7 | 10.7 | 7.7 | 0.7 | −0.3 | 11.3 | 0.1 | 15.8 |
| MIROC6 | −3.2 | −1.6 | −6.4 | 1.8 | 2.1 | −0.8 | −10.5 | −10.4 | −0.8 | −5.7 | 2.3 | −4.4 |
| MPI-ESM1-2-HR | 8.5 | 9.1 | 14.8 | 11.1 | 6.2 | 9.9 | −2.8 | 8.7 | −9.9 | 2 | 6.8 | 7 |
| MPI-ESM1-2-LR | 6.5 | 6.8 | 3.1 | 6 | 6.5 | 10.6 | −2.4 | −1.5 | 3.2 | −2.1 | 9.7 | 8.6 |
| MRI-ESM2-0 | 11.4 | 7.3 | 8.9 | 14.5 | 12.8 | 24.8 | −1.2 | 2.7 | −1.1 | 12.5 | −1.8 | 18.1 |
| NESM3 | −1.5 | 1.9 | −0.4 | 2.6 | −0.5 | −5.2 | −5.4 | −2.9 | −6.2 | −10.3 | 3.4 | 0.7 |
| NorESM2-MM | 2.6 | 14.5 | 5.2 | 3.4 | 5.6 | 8.8 | 10.6 | 9.8 | 15.9 | 7.5 | 12.6 | 13.9 |
Disclaimer/Publisher’s Note: The statements, opinions and data contained in all publications are solely those of the individual author(s) and contributor(s) and not of MDPI and/or the editor(s). MDPI and/or the editor(s) disclaim responsibility for any injury to people or property resulting from any ideas, methods, instructions or products referred to in the content. |
© 2023 by the authors. Licensee MDPI, Basel, Switzerland. This article is an open access article distributed under the terms and conditions of the Creative Commons Attribution (CC BY) license (https://creativecommons.org/licenses/by/4.0/).
Share and Cite
MDPI and ACS Style
Golian, S.; El-Idrysy, H.; Stambuk, D. Using CMIP6 Models to Assess Future Climate Change Effects on Mine Sites in Kazakhstan. Hydrology 2023, 10, 150. https://0-doi-org.brum.beds.ac.uk/10.3390/hydrology10070150
AMA Style
Golian S, El-Idrysy H, Stambuk D. Using CMIP6 Models to Assess Future Climate Change Effects on Mine Sites in Kazakhstan. Hydrology. 2023; 10(7):150. https://0-doi-org.brum.beds.ac.uk/10.3390/hydrology10070150
Chicago/Turabian StyleGolian, Saeed, Houcyne El-Idrysy, and Desana Stambuk. 2023. "Using CMIP6 Models to Assess Future Climate Change Effects on Mine Sites in Kazakhstan" Hydrology 10, no. 7: 150. https://0-doi-org.brum.beds.ac.uk/10.3390/hydrology10070150
Note that from the first issue of 2016, this journal uses article numbers instead of page numbers. See further details here.