
Application of Biofilm Carrier in Aerobic Reactors as a Method to Improve Quality of Wastewater Treatment


Department of Water Supply and Wastewater Treatment, Moscow State University of Civil Engineering, 129337 Moscow, Russia
Hydrology 2021, 8(2), 77; https://0-doi-org.brum.beds.ac.uk/10.3390/hydrology8020077
Submission received: 5 April 2021
/
Revised: 3 May 2021
/
Accepted: 6 May 2021
/
Published: 10 May 2021
Abstract
:The research revealed in the paper considers the improvement of secondary treatment of wastewater in the aerobic reactor to provide removal of organics and nutrients. There were five types of polymer biofilm carriers taken into account initially; however, two of them were decided not to apply due to technological reasons. The main part of the research was divided into three substages to investigate each type of biofilm carrier. According to the literature review, the optimal efficiency may be reached if the carrier filling ratio is 10 to 30% of reactor volume. On this basis, there were three benches launched at each sub-stage with a corresponding filling ratio of 10, 20, and 30%. The fourth reactor at each sub-stage had no floating carrier to control the experiment. The research of all three types of carriers showed the effect of BOD removal in the range of 95–96% for benches equipped with a floating carrier, which can be considered similar to the control bench with the efficiency of 92%. In the case of ammonia nitrogen, the removal control bench showed only 55% of efficiency, while floating carriers helped to increase the efficiency up to 70–86%. Despite obtaining relatively positive results, the research has to be continued to achieve regulation requirements in treatment quality.
1. Introduction
All methods of secondary wastewater treatment to provide nitrogen removal are based on nitrification and denitrification (N/D) processes that occur with the participation of certain microorganisms, because of which nitrogen compounds are oxidized to nitrites and nitrates, and then reduced to nitrogen gas. One of the main advantages of these treatment methods is the possibility of their implementation in conventional activated sludge treatment facilities—in aerobic reactors. Nitrification processes require aerobic conditions with a dissolved oxygen content of 2–7 mg/L in water; denitrification processes require anoxic conditions (the presence of dissolved oxygen in an amount of 0.5 mg/L and/or chemically bound) and/or anaerobic conditions in which oxygen is absent. The implementation of N/D processes is possible not only in biological reactors, but also in trickling filters, respectively, both the attached biofilm and suspended form of activated sludge are involved in treatment. In this paper, the possibilities of their simultaneous application will be considered, while the attached biomass on the floating carrier (FC) in the aerobic reactor.
The study of the processes of nitrification and denitrification began quite a long time ago and these processes are now well studied [1,2]. Scientists worldwide have identified the main dependencies of these processes [3]. Numerous studies have paved the way to the improvement of nitrification and denitrification efficiency in the operating conditions of existing treatment facilities. [4]. In addition, it was important to establish and evaluate the impact of various factors on the implementation of nitrification and denitrification, including the concentration of the substrate, temperature, dissolved oxygen concentration (DO), pH, concentration, and nature of toxic substances. [5,6].
Like all other types of bacteria, nitrifying bacteria are particularly sensitive to sudden changes in temperature. If the temperature increases quickly (in a few hours), then the increase in the growth rate is slower. With a sharp decrease in temperature, activity, on the contrary, falls more strongly. In thermophilic conditions (at 50–60 °C), nitrification does not occur. The temperature dependence of denitrification is generally similar, but it should be noted that the process can take place under thermophilic conditions (at 50–60 °C), but there is little information about this. The rates of thermophilic denitrification are on average 50% higher than those of similar reactions at 35 °C [7,8].
Nitrifying bacteria are more sensitive to oxygen deficiency than heterotrophic microorganisms. The kinetics of oxygen consumption can be described by the Mono equation. Nitrification can take place at very high oxygen concentrations, even when using pure oxygen. The process is not inhibited even by such an oxygen concentration as 60 g/m3 [9]. For denitrification, oxygen is an inhibitor. At the same time, the concentration of oxygen, which directly affects the microorganisms, is of fundamental importance [10].
The optimal pH value for nitrification processes is in the range 8–9. Since nitrification, in turn, affects the pH of the medium, the pH values in floccules and biofilms are lower than in the liquid phase. For the denitrification process, the pH dependence is generally similar; the optimal pH value is usually in the range from 7 to 9 but may shift depending on the conditions. pH values below seven strongly affect the yield of the final denitrification product: when the pH decreases, the yield of nitrogen oxides increases, especially N2O (which is a toxic reagent), although its concentrations are not so noticeable [11,12].
Nitrification in a reactor with activated sludge can be inhibited by several substances. Since nitrification reactors are designed in such a way that only this process takes place in them at a given sufficiently low temperature, even a very small inhibition can completely stop it. However, such a stop does not occur instantly, but only after several weeks of leaching of bacteria. In other words, the stop of nitrification is not the result of 100% inhibition by toxic substances but is due to the leaching of nitrifying bacteria from the reactor [13,14]. As a rule, nitrifying bacteria are not more sensitive to the action of toxic substances than other microorganisms of activated sludge. If microorganisms are simultaneously exposed to several inhibitors, the effect of each of them is usually enhanced. [15,16]. To date, various variants of technological purification schemes have been developed using the principles of nitrification and denitrification [17,18].
One of the promising ways to intensify the process of advanced secondary treatment of wastewater is the use of immobilized microflora, which may improve the effect of removing both organic substances and nitrogen compounds from wastewater [13,15].
Scientists have proposed various methods of treatment using immobilized microflora [4,8,19]. Scientists have also developed various versions of floating-load filters [20] both for the needs of water treatment and for various stages of wastewater treatment [21]. Positive results in the processes of removal of biogenic elements were observed in systems operating without the return of activated sludge. The work of Zaletova [1,2] describes the flexibility of systems with immobilized microflora. In particular, the effect of wastewater influent stop to a reactor with a floating carrier is considered. This fact leads to a reduction in the area of biomass per load, but not to its complete removal. Moreover, it was noted that the qualitative composition is preserved; thus, when the influent flow is resumed, the biomass on the carrier can quickly restore its properties. The properties of biomass can also be restored after exposure to temperatures below zero Celsius.
German scientists have made a considerable contribution to the study of this field [22]. So, in particular, a system of wastewater treatment using biofilm is proposed. The advantages of treatment systems using immobilized microflora and methods of implementing the method using rotary conducting reactor, in which the biofilm is formed on the surfaces of disks of rotary devices, on the surface of sand particles in systems with a fluidized bed, etc., are considered [23]. German scientists have also patented a biorotor-type device for wastewater treatment using attached microflora. The device has a drum divided into separate segments, which are filled with some kind of loading [24]. Such drums or biodisks can be installed inside the aerobic tanks, but this method creates additional loads on the structure and complicates its operation. Scientists investigated the possibility of simultaneous removal of nitrogen and phosphorus in SBR technology using immobilized microflora. The removal of phosphates in anoxic/aerobic conditions occurs with the participation of heterogeneous microorganisms, and the oxidation of ammonium nitrogen is carried out by nitrifying bacteria. It is reported that the use of attached microflora stimulates the formation of a biocenosis to provide effective removal of nitrogen and phosphorus. Furthermore, in Germany, reactors with a fluidized bed loading with a loading rate of 60% were used in municipal wastewater treatment facilities. The FC was made of polyethylene, the outer diameter of one element is 9.7 mm and the length is 8.1 mm, the specific surface area is 633 m2/m3. Kleinert and Ante [25] discuss the advantages of systems with attached microflora. In the pilot plant based on trickling filters, sand and expanded clay were used as a biofilm carrier, and the removal efficiency was up to 98%. According to the results of the research, treatment facilities with an estimated capacity of 200,000 PE were reconstructed, and the operation parameters were found to be in satisfactory agreement with the data of the pilot tests. Application of moving beds may also be considered as one of the ways to mitigate membrane fouling in membrane bioreactors.
Based on the above, the possibility of using floating carriers for the intensification of biological wastewater treatment was carried out in lab-scale conditions at Moscow State University of Civil Engineering. The studies were carried out on laboratory models operating in the flow-through mode.
2. Materials and Methods
At the beginning of the lab-scale research there were several goals established to follow:
- Study of the possibility of intensifying the processes of biological wastewater treatment using FC of various modifications.
- Study of the processes of advanced biological removal of ammonia nitrogen and organic pollutants with the use of FC when using it in aerobic reactors.
- Selection of the modification and optimal filling ratio of the FC for use in the biological treatment reactor.
To this end, there was a research sequence suggested (Figure 1).
A treatment sequence was established in a model of the cylindrical aerobic reactor (AR) (made of organic glass) with a volume of 8 L, an internal diameter of 100 mm, and a settling tank with a volume of 2 L and an internal diameter of 100 mm. The aerobic reactor and the secondary clarifier were equipped with height-distributed pipes with a diameter of 10 mm with rubber hoses and clamps to supply influent wastewater and to discharge mixed liquor into the secondary clarifier, as well as for sampling. The air was supplied to the aerobic reactor using a compressor through a ceramic filter. Recirculation of activated sludge was air-driven. The influent wastewater was supplied from a 60 L tank. The effluent was diverted from the clarifier to the sewer. The scheme of the lab-scale bench is shown in Figure 2.
The studies were carried out using synthetic wastewater based on peptone. The composition of peptone per 1 L of medium is:
- −
- Peptone enzymatic—110 g;
- −
- Sodium chloride—68.8 g;
- −
- Potassium nitric acid—1.2 g;
- −
- Soda ash—16.2 g.
A separate solution was prepared for calcium acetic acid Ca(CH3COO)2 and potassium phosphoric acid substituted K2HPO4.
Currently, there is a typical situation in Russia that pollutants concentration values in wastewater drop due to dilution by groundwater, which may infiltrate into pipes. Following the above, the concentrations of pollutants in the wastewater were chosen to meet the actual concentrations of urban wastewater. The BOD values in influent were in the range of 140–160 mg/L, ammonium nitrogen values were 20–30 mgN/L.
Following the requirements, the sampling was carried out manually. The wastewater flow rate was measured by the volumetric method. Chemical analyses of wastewater samples were performed according to the following parameters: biological oxygen demand (BOD5), total suspended solids (TSS), ammonium nitrogen (NH4), nitrites (NO2), nitrates (NO3), and dissolved oxygen (DO). The activated sludge was evaluated by mixed liquor suspended solids (MLSS) and sludge index. The analyses were carried out according to the regulations applied in Russian Federation.
At the preliminary stage of research, it was necessary to determine the possibility of intensification using various floating carriers in the biological facilities of the secondary wastewater treatment system. The following types of the floating carriers were examined:
- 1.
- Floating carrier Polystyrene (hereinafter “PS”, Figure 3); appearance: porous material made in the form of strips 30 mm long, 6 mm wide, and 4 mm thick, volume weight 22 kg/m3, specific surface area 420 m2/m3.
- 2.
- Material Polyvinyl chloride (hereinafter “PVC”, Figure 4); appearance: porous material, made in the form of D-shaped strips with a length of 30 mm, density 40 kg/m3.
- 3.
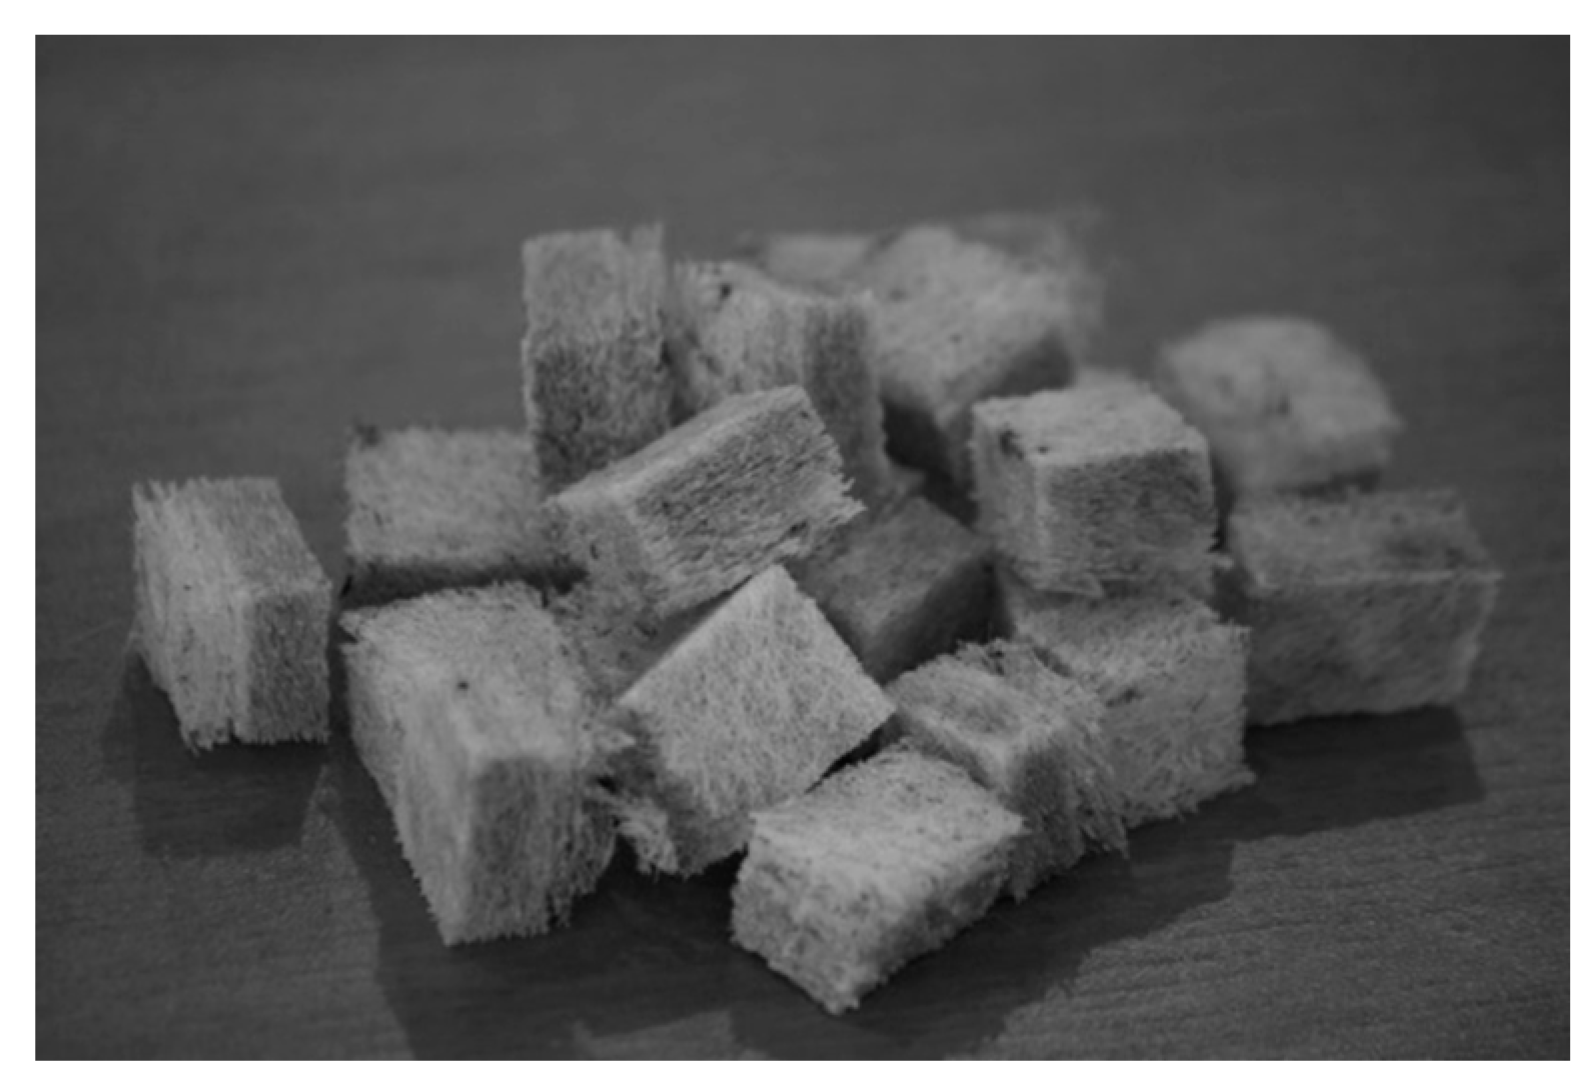
- Floating carrier “Polyvom”, manufactured by “Etek” (hereinafter “PV”, Figure 5); appearance: cubes in the form of fibers intertwined with each other. Feedstock LDPE 158 (GOST 16337-77), element size is 10 × 15 × 15 mm, volume weight 25 kg/m3, specific surface area 600 m2/m3.
- 4.
- Floating carrier BB 1200 (bioballs) manufactured by Tetratec (hereinafter “BB”, Figure 6); appearance: Spheres with a diameter of 12 mm, made of polypropylene, with a developed inner surface. Volume weight 50 kg/m3, specific surface area 620 m2/m3.
- 5.
- Loading material Polyurethane foam (hereinafter PUF, Figure 7); appearance: soft, porous polymer loading material, volume weight 28 kg/m3.
All the selected carriers were initially examined for secondary contamination—the chemical resistance or the dissolution of chemicals in the water. Studies were conducted on the COD index by immersing the FC samples in clean water. The presented results (Table 1) show that PVC-carrier may be considered as a source of background contamination, so it was decided not to use this material in further studies. It was also noted that the PUF-carrier after being in the water for some time is saturated with moisture and begins to sink. Presumably, this is due to the large number of open pores that quickly absorb water.
Consequently, there are three types of floating carriers left for the main part of the research—PS, PV, and BB. When preparing the research, the question arose of the optimal filling ratio or the amount of the floating carrier related to the volume of the reactor. According to the data from the literature sources [9,14], the minimum filling ratio, which may prove the efficiency of its application, is 10%, while the maximum concentration is 30%. Based on this, for the most complete study of the work of the samples of the floating carriers, their work in the aerobic reactor was considered under filling ratios of 10%, 20%, and 30%, respectively. According to the number of the studied floating carriers, the research was divided into 3 stages, each was devoted to the examination of the certain floating carrier in the selected filling ratios. There was also a control bench at each stage of the research with no floating carrier (blank filling ratio) to compare performance.
3. Results
The operating mode in all benches was also identical. The wastewater flow rate was 0.025 m3/day; flow rate of return activated sludge—0.06 m3/day (recirculation rate—250%); hydraulic retention time (HRT) was 8 h. After settling the mixed liquor in the sedimentation tank, the effluent was diverted to the sewer, and the activated sludge from the sedimentary cone was returned to the aerobic reactor using an airlift. The volume of the clarifier corresponded to the settling time of the mixed liquor of 2.5 h. The studies were carried out for 2 months, 2 weeks of which are normally needed to bring the treatment plants to the required technological mode.
During the entire research, regular sampling of wastewater was carried out, which was necessary for chemical analyses. The results of the sample analysis are shown in Figure 8 and Figure 9. Table 2 summarizes these results and reveals average efficiency of treatment in all four benches—three with the floating carriers and the control bench.
Figure 8 gives an overview of the removal of organic pollution, which was estimated by BOD5. It can be seen that treatment efficiency is mostly similar for all four benches and reaches 92–96%. However, it is not enough to meet the requirements for treated water to be discharged in water bodies of fishery significance (BOD5 = 2.1 mgBOD/L or less).
When comparing the results for ammonium nitrogen removal (Figure 9; Table 2), the difference in efficiency is more obvious. For benches with a floating carrier with filling ratios of 10% and 20%, the effect is generally similar (86%). When filling ratio is 30%, the effect for ammonia nitrogen removal tends to deteriorate (78%). This may indicate, for instance, possible secondary contamination inside the floating carrier because of clogging and further rotting. The control bench showed significantly worse efficiency of 55%, which is by half lower than in benches with the floating carrier. This may signal that nitrifying bacteria showed more intensive development in the case of attached microflora.
It can be generally said that a positive impact of floating carrier on treatment efficiency was established. Since these results are similar, the minimum filling ratio of the floating carrier—10%—can be considered as optimal, however, even in this case the absolute value of NH4 concentration in the effluent is quite far from the required value (3 mgN/L vs. 0.4 mgN/L)
After research for PS-carrier, the PV-carrier was investigated. Results of the research are shown in Figure 10 and Figure 11, and Table 3.
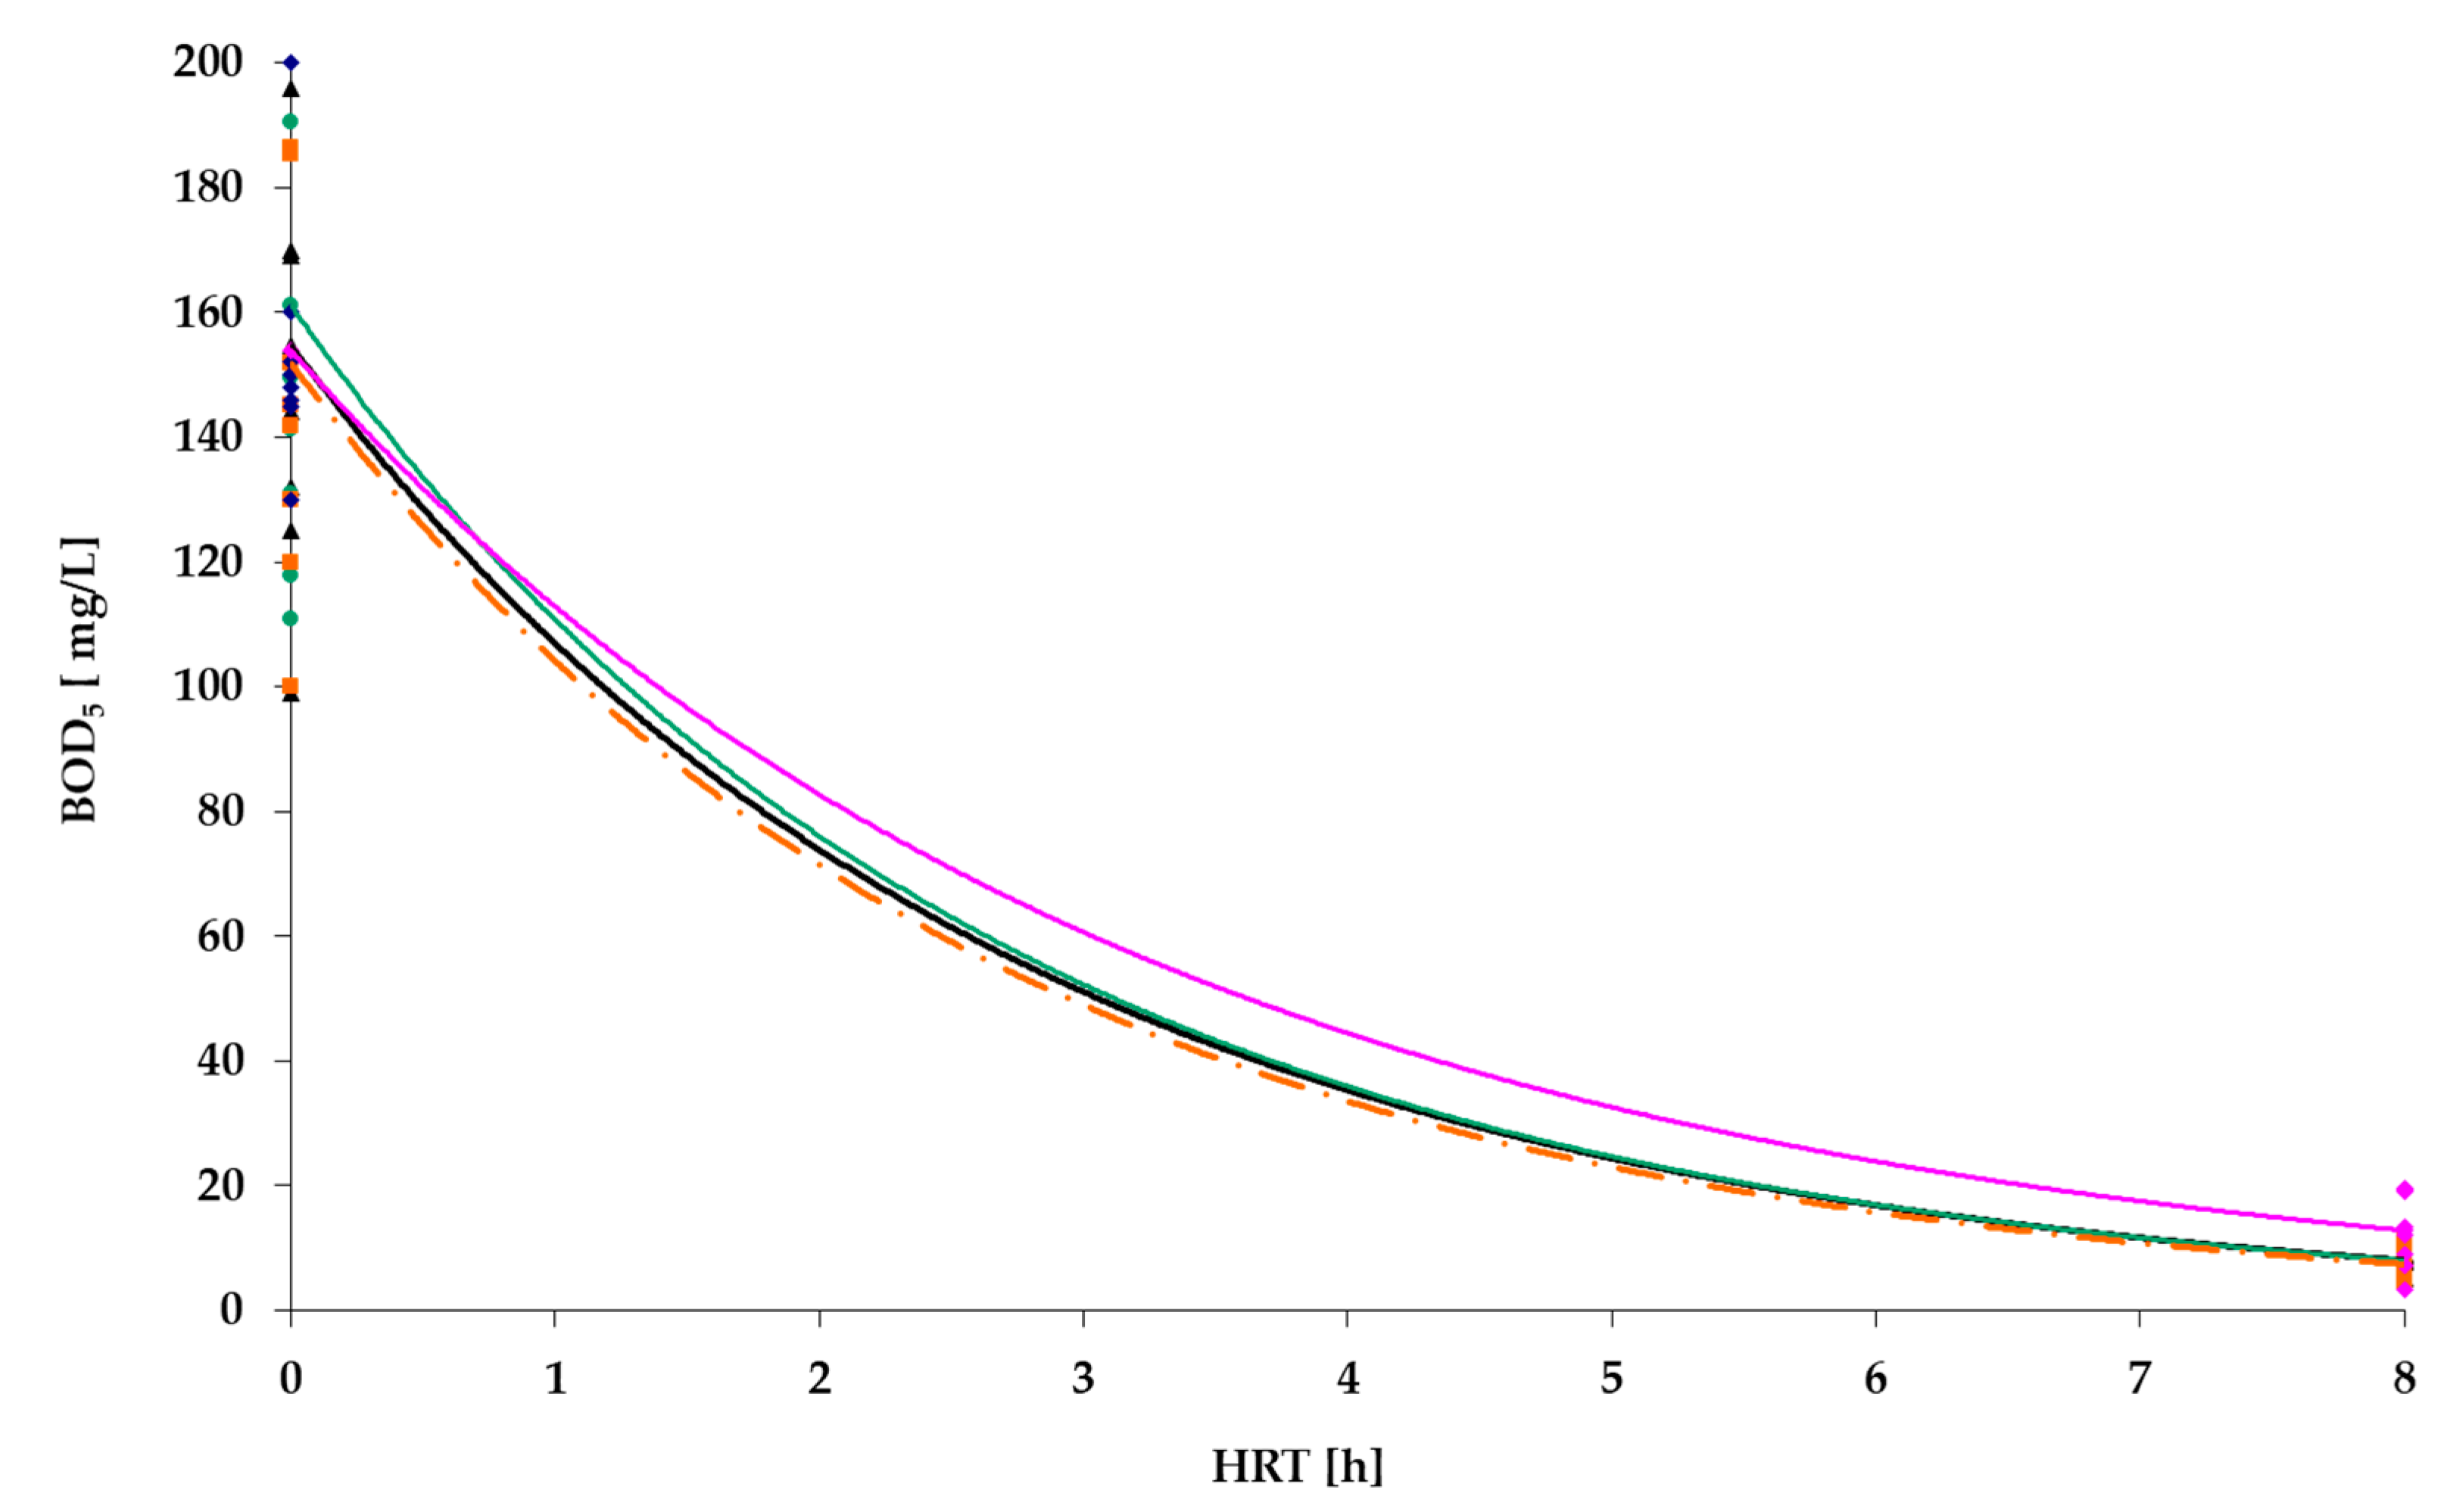
At this stage of the research (Figure 10), the effect of organic pollutants removal for all four benches was again at a comparable level: treatment effect for all three benches was quite high for BOD—on average 96%, while the absolute values of the contamination concentration for BOD5 in the installation with carrier filling ratio of 20% was slightly higher than in the others. However, the required values (2.1 mgBOD/L or less) were still not achieved.
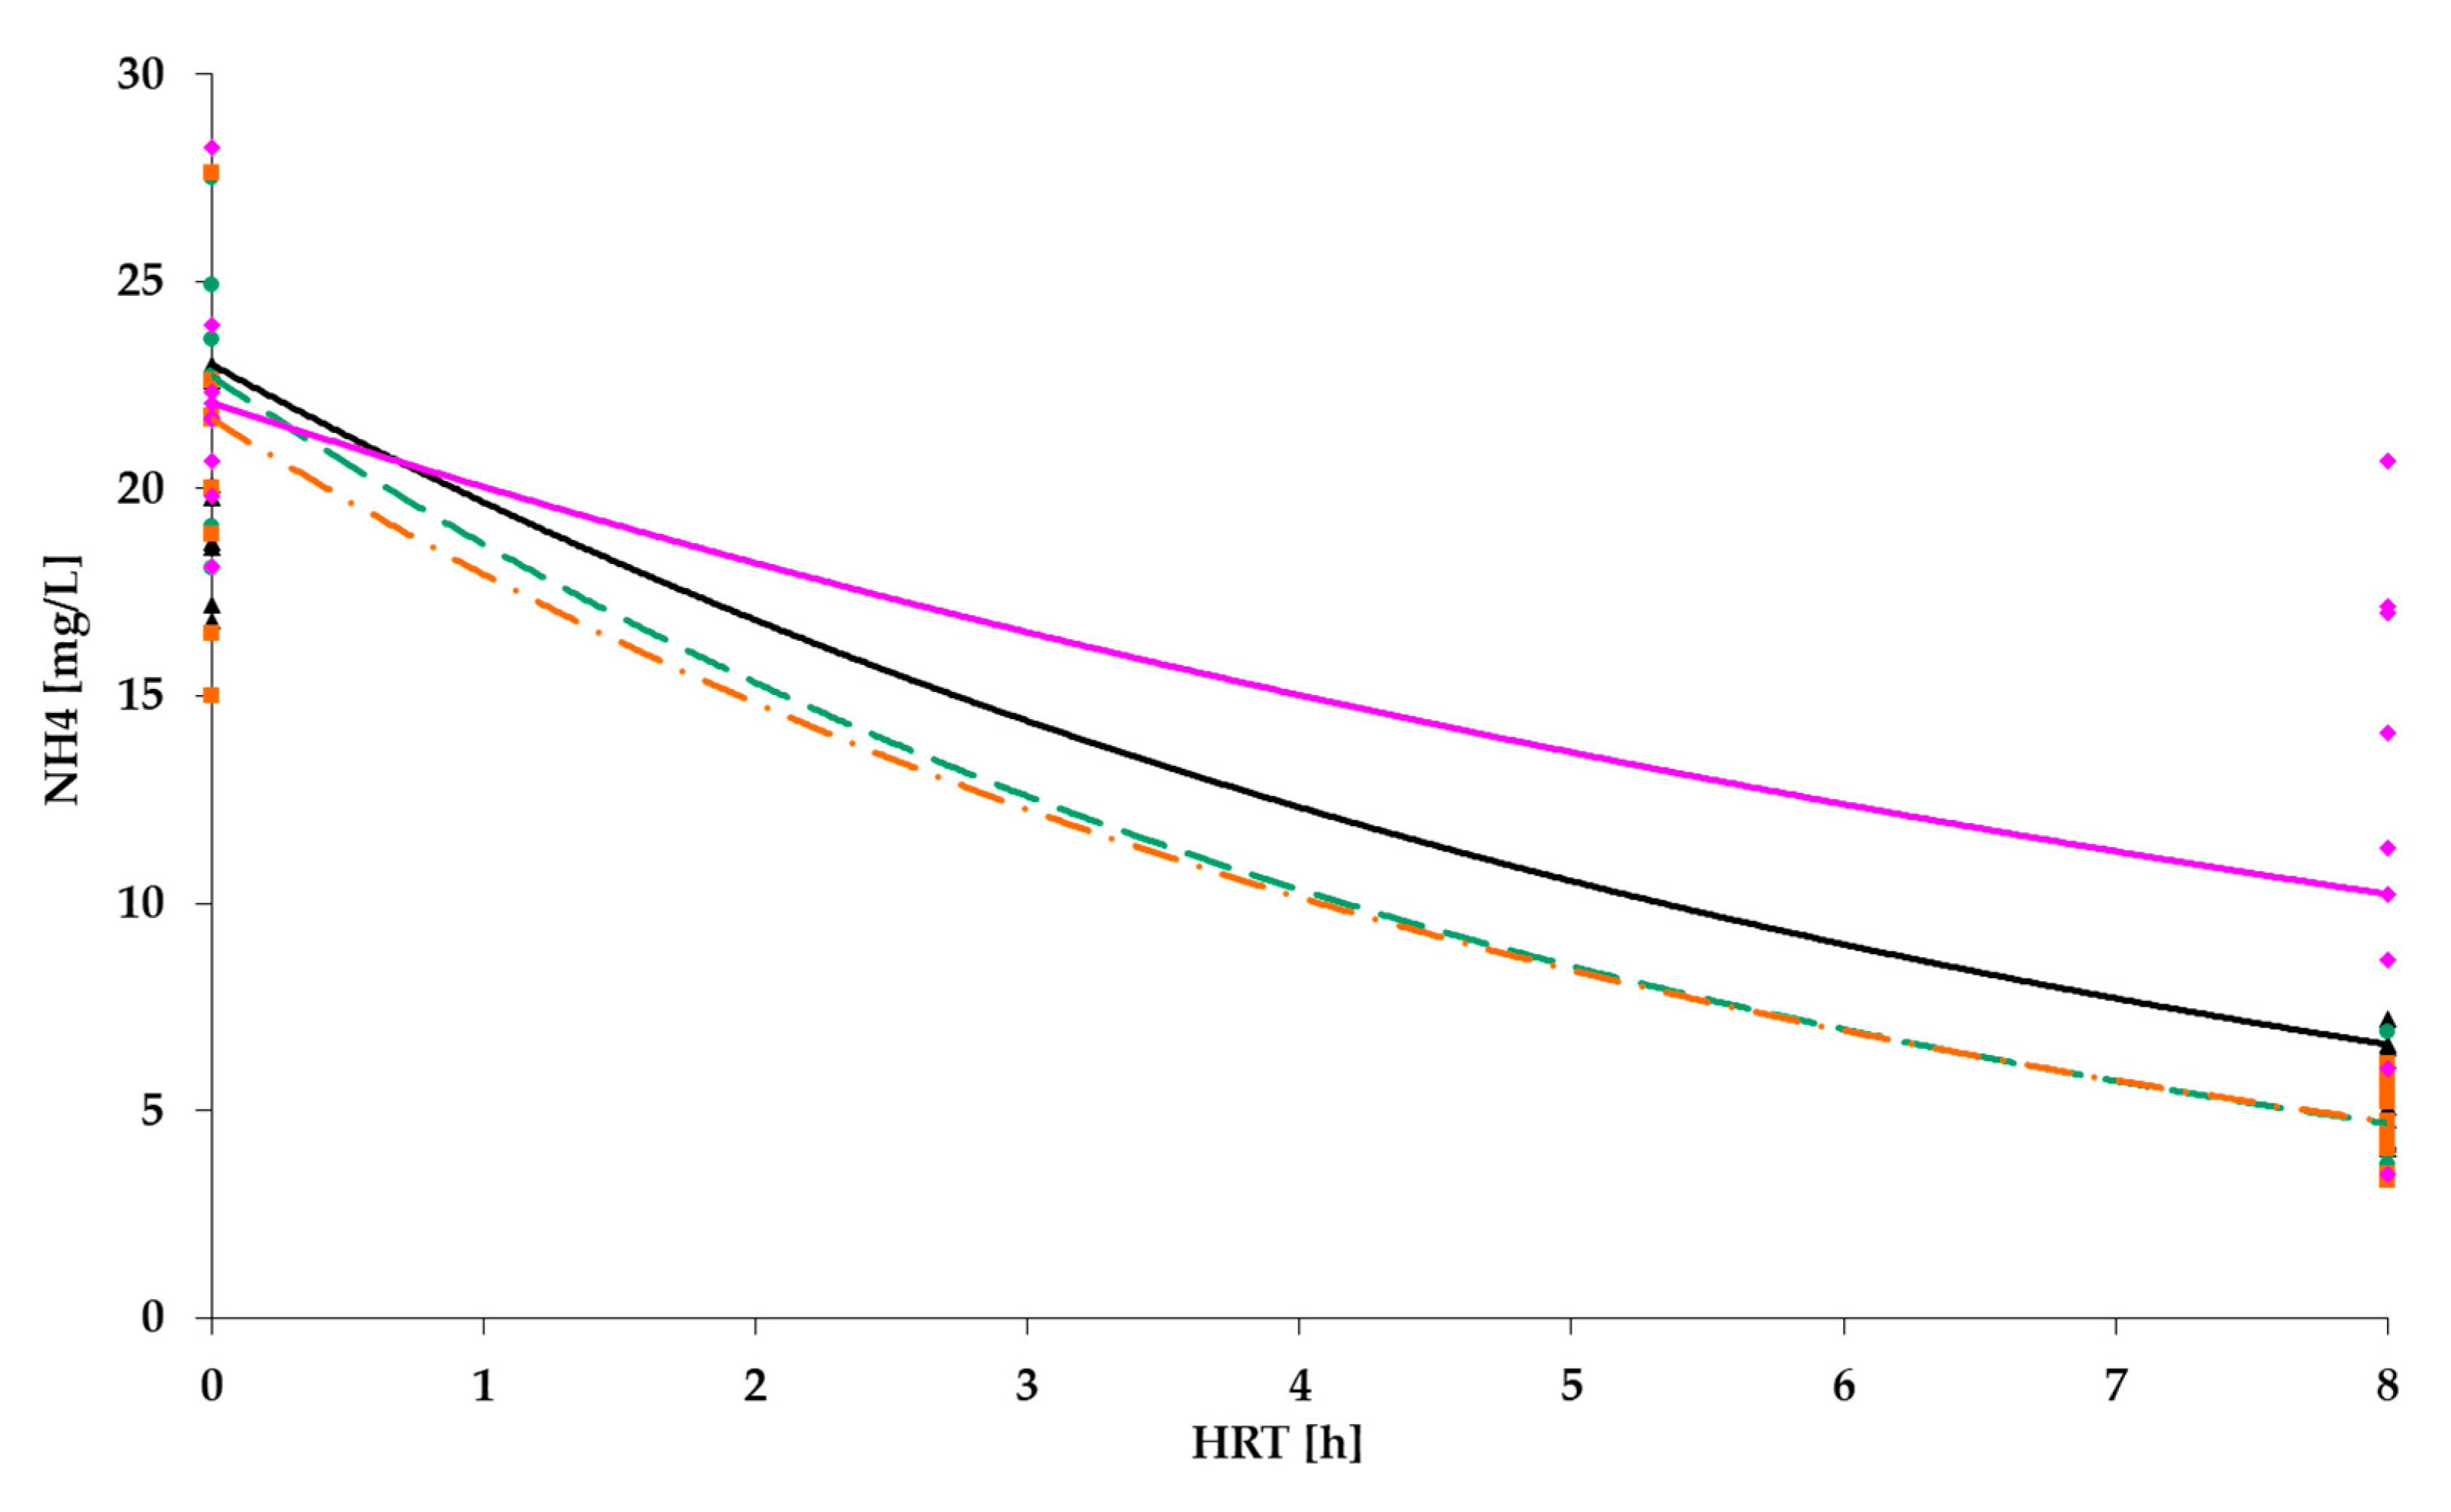
Removal of ammonia nitrogen had the efficiency of 70–75% for the bench with a 10% carrier filling ratio; for benches with the FC filling ratio of 20% and 30%, the treatment efficiency was approximately similar and laid in the range of 78–85%. However, it is slightly lower than previously for PS-carrier. The absolute values of effluent concentration were on contrary higher than on the previous stage (5 mgN/L vs. 3 mgN/L), and 12–13 times higher than required value of 0.4 mgN/L.
According to above-said, filling ratio of the 20% in the aerobic reactor may be recognized as the most optimal for PV carrier due to technological (if compared to 10%) and economic (if compared to 30%) reasons.
At the third stage, the benches were equipped with the BB floating carrier, which was examined in the same operation conditions and which was applied in the same filling ratios. Results of the experiment are shown in Figure 12 and Figure 13 and summarized in the Table 4.
For the BB carrier, the obtained results in the case of BOD removal (Figure 12) are in the same range as the other type of carriers. The efficiency of 95–96% is witnessed; however, it is still not enough to reach the required absolute values (6–7 mgBOD/L vs. 2.1 mgBOD/L). The control bench showed slightly lower relative efficiency (92%); while the absolute values of BOD concentration in effluent were approximately two times higher (12.3 mgBOD/L).
Using the third type of floating carrier confirmed previous results in a way that floating carrier application mostly contributes to the removal of ammonia, while BOD removal efficiency remains in the similar range. The effect of ammonia removal treatment for a bench with filling ratio of 10% was in the range of 67–72%; for a bench with filling ratio of 20% the efficiency was in the range of 80–85%; for 30% the removal effect was 75–80%. The absolute values in the effluent were mostly in the range of 4 to 5 mgN/L for next two benches that also corresponds to the results obtained earlier. Treatment effect in the control bench was significantly lower (55%) than in three benches with floating carrier.
According to the above-said, for the floating carrier BB filling ratio of 20% may be considered as the optimal, however, the required values were still not achieved.
4. Discussion
The research showed that using of floating carrier could improve low-concentrated wastewater treatment in aerobic reactors. The carried out studies allowed identifying for each type of floating carrier their amount in the bioreactor, under which the higher efficiency of BOD and ammonia nitrogen removal may be provided. In addition, application of floating carriers has a major impact on nitrogen removal. However, none of the floating carriers ensured the required values of pollutants concentration in effluent if to be applied within the investigated treatment sequence.
If BOD removal is considered (Figure 14), the effect grew from 92 to 96%. For ammonia nitrogen, the effect were even more obvious as it raised from 55% (in control bench) to 81–86% in aerobic reactor with floating carriers (Figure 15). The average MLSS value was about 1 g/L throughout the entire research.
Within the research, there were three filling ratios of 10, 20, and 30% considered. Gu et al. [26] their study concluded that the filling ratio of 50% may ensure the optimal efficiency, however, they dealt with highly concentrated wastewater. In our case, the influent had much lower concentrations of pollutants, which, perhaps, did not require a high filling ratio. Zhao et al. [27] in their study stated that growth of filling ratio from 20 to 30% resulted in significant efficiency growth; however, in our case, the filling ratio of 30% gave no significant improvement of treatment efficiency. In the case of BB and PV carriers, the efficiency even slightly decreased for a filling ratio of 30%. Barwal and Chaudhary [28] achieved the most efficiency under the filling ratio of 40%; meanwhile, biomass concentration in their study has a maximum value of only 0.4 g/L. Lopez-Lopez et al. [29] performed their study with filling ratios of 20, 35, and 50%; however, the efficiency of only 65–80% both for BOD and ammonia nitrogen was achieved.
5. Conclusions
After finishing the part of the research, which was described in the paper, the following summary can be made:
- Polystyrene carrier showed the most efficient removal of BOD from 155 to 8 mg/L and NH4 removal from 22.1 to 3.1 mgN/L with filling ratio 10%; polyvom carrier ensured the best performance with filling ratio of 20% to provide removal of BOD from 161 to 6.7 mg/L and NH4 removal from 26.6 to 4.9 mgN/L; bioballs carrier optimum filling ratio was also 20% that allowed removing of BOD from 144 to 6.4 mgBOD/L and NH4 from 22.7 to 4.3 mgN/L.
- The chosen three types of floating carriers provided an evident positive effect for BOD removal efficiency—96% vs. 92% (in case of blank carrier filling ratio) and 78–86% vs. 55% for ammonia nitrogen.
- Despite, the obtained results can be cautiously called positive, the research has to be continued because the actual concentrations of effluent were far from required values.
- The research has several directions for further investigation. Greater attention should be paid to the influence of HRT, DO, and MLSS. The treatment sequence may also be improved and/or extended with several stages of conventional activated sludge (CAS) bioreactors or for instance with trickling filters. Another possible option may be a combination of membrane bioreactors (MBRs) and floating carriers, which may be efficient for both treatment quality and membrane fouling mitigation. Moreover, application of CAS or MBR systems may considered as one of the way to ensure sustainability for wastewater treatment. For instance, Kanchanamala Delanka-Pedige et al. [30] provide a comparison of different treatment techniques in viewpoint on UN goals of sustainable development. It was concluded that sustainable wastewater treatment and sustainable cities in general linked within at least 12 of 17 Sustainable Development Goals (SDGs).
Funding
This research received no external funding.
Institutional Review Board Statement
Not applicable.
Informed Consent Statement
Not applicable.
Data Availability Statement
Not applicable.
Conflicts of Interest
The author declares no conflict of interest.
References
- Zaletova, N.A.; Bashkatova, L.V.; Pyatachkova, E.V.; Brishten, L.K. Nutrients removal in municipal wastewater. Water Supply Sanit. Tech. 1992, 3, 16–17. [Google Scholar]
- Zaletova, N.A. Integrated removal of nutrients from wastewater. Domest. Hous. Facil. 1993, 7, 38–39. [Google Scholar]
- Lyubchenko, O.A.; Mogilevich, N.F.; Gvozdyak, P.I. Microbial nitrification and water treatment. Chem. Water Technol. 1996, 18, 98–112. [Google Scholar]
- Santos, A.D.; Martins, R.C.; Quinta-Ferreira, R.M.; Castro, L.M. Moving bed biofilm reactor (MBBR) for dairy wastewater treatment. Energy Rep. 2020, 6, 340–344. [Google Scholar] [CrossRef]
- Hohl, J. Reinigungsleistung einer vollbiologischen Klaranlage mit vorgeschalteter Denitrifikation. Wasser Luft Betrieb. 1988, 34, 37–38. [Google Scholar]
- McCutcheon, S. Laboratory and instream nitrification rate for selected stream. J. Environ. Eng. 1987, 113, 628–646. [Google Scholar] [CrossRef]
- Morawe, B. Vergleich der kontinuierlichen Denitrifikation von nitrat- und nitrithaltigen Abwassern. Chemieingenieurtechnik 1992, 64, 433–434. [Google Scholar] [CrossRef]
- Osmani, S.A.; Rajpal, A.; Kazmi, A.A. Upgradation of conventional MBBR into Aerobic/Anoxic/Aerobic configuration: A case study of carbon and nitrogen removal based sewage treatment plant. J. Water Process Eng. 2021, 40, 101921. [Google Scholar] [CrossRef]
- Abu Bakar, S.N.H.; Hasan, H.A.; Mohammada, A.W.; Abdullahah, S.R.S.; Ngteni, R.; Yuosuf, K.M.M. Performance of a laboratory-scale moving bed biofilm reactor (MBBR) and its microbial diversity in palm oil mill effluent (POME) treatment. Process Saf. Environ. Prot. 2020, 142, 325–335. [Google Scholar] [CrossRef]
- Siegrist, H.; Gujer, W. Nitrigen remival in activated sludge systems including denitrification in secondary clarifiers. Water Sci. Technol. 1994, 30, 101–111. [Google Scholar] [CrossRef]
- Henze, M.; Harremoes, P. Anaerobic Treatment of Wastewater in Fixed Film Reactors—A Literature Review. Water Sci. Technol. 1983, 15, 1–101. [Google Scholar] [CrossRef]
- Xie, Y.; Wan, A.; Wu, Y. Numerical simulation and experimental investigation on the effect of a new suspended carrier filler on mass transfer in MBBR. Chem. Eng. Process. Process Intensif. 2020, 156, 108104. [Google Scholar] [CrossRef]
- Antoniou, P.; Hamilton, J.; Koopman, B. Effect of temperature and pH on effective maximum specific growth rate of nitrifying bacteria. Water Res. 1990, 24, 97–101. [Google Scholar] [CrossRef]
- Vyrides, I.; Drakou, E.-M.; Ioannou, S.; Michael, F.; Gatidou, G.; Stasinakis, A.S. Biodegradation of bilge water: Batch test under anaerobic and aerobic conditions and performance of three pilot aerobic Moving Bed Biofilm Reactors (MBBRs) at different filling fractions. J. Environ. Manag. 2018, 217, 356–362. [Google Scholar] [CrossRef]
- Brink, A.; Sheridan, M.; Harding, G. A kinetic study of a mesophilic aerobic moving bed biofilm reactor (MBBR) treating paper and pulp mill effluents: The impact of phenols on biodegradation rates. J. Water Process Eng. 2017, 19, 35–41. [Google Scholar] [CrossRef]
- Ashkanani, A.; Almomani, F.; Khraisheha, M.; Bhosale, R.; Tawalbeh, M.; AlJamla, K. Bio-carrier and operating temperature effect on ammonia removal from secondary wastewater effluents using moving bed biofilm reactor (MBBR). Sci. Total Environ. 2019, 693, 133425. [Google Scholar] [CrossRef]
- Ferrentino, R.; Ferraro, A.; Mattei, M.R.; Esposito, G.; Andreottola, G. Process performance optimization and mathematical modelling of a SBR-MBBR treatment at low oxygen concentration. Process Biochem. 2018, 75, 230–239. [Google Scholar] [CrossRef]
- Xiong, J.; Zheng, Z.; Yang, X.; He, J.; Luo, X.; Gao, B. Mature landfill leachate treatment by the MBBR inoculated with biocarriers from a municipal wastewater treatment plant. Process Saf. Environ. Prot. 2018, 119, 304–310. [Google Scholar] [CrossRef]
- Kruszelnicka, I.; Kramarczyk, D.G.; Poszwa, P.; Stręk, T. Influence of MBBR carriers’ geometry on its flow characteristics. Chem. Eng. Proc.-Proc. Intensif. 2018, 130, 134–139. [Google Scholar] [CrossRef]
- Gujer, W. Design of a Nitrifying Activated Sludge Process with the Aid of Dynamic Simulation. Prog. Water Technol. 1977, 9, 323–336. [Google Scholar]
- Bohm, B. A test method to determine inhibition of nitrification by industrial wastewaters. Water Sci. Technol. 1994, 30, 169–172. [Google Scholar] [CrossRef]
- Li, L.; Yan, G.; Wang, H.; Chu, Z.; Li, Z.; Ling, Y.; Wu, T. Denitrification and microbial community in MBBR using A. donax as carbon source and biofilm carriers for reverse osmosis concentrate treatment. J. Environ. Sci. 2019, 84, 133–143. [Google Scholar] [CrossRef]
- Torresi, E.; Tang, K.; Deng, J.; Sund, C.; Smets, B.F.; Christensson, M.; Andersen, H.R. Removal of micropollutants during biological phosphorus removal: Impact of redox conditions in MBBR. Sci. Total Environ. 2019, 663, 496–506. [Google Scholar] [CrossRef] [PubMed]
- Nowak, O.; Schweighofer, P.; Svardal, K. Nitrifucation inhibotion-method for the estimation of actual maximum growth rates in activated sludge systems. Water Sci. Technol. 1994, 30, 9–19. [Google Scholar] [CrossRef]
- Ante, A.; Kleinert, P. Ubertragung Von reaktionstechnischen Erkenntnissen an Pilotanlagen zur Nitrifikation auf grolkechnische Bio-festbettanlagen. KA-Wasserwirtsch. Abwasser Abfall 2002, 49, 662–672. [Google Scholar]
- Gu, Q.; Sun, T.; Wu, G.; Li, M.; Qiu, W. Influence of carrier filling ratio on the performance of moving bed biofilm reactor in treating coking wastewater. Biores. Technol. 2014, 166, 72–78. [Google Scholar] [CrossRef]
- Zhao, Y.; Yuan, Q.; He, Z.; Yan, G.; Chang, Y.; Chu, Z.; Ling, Y.; Wang, H. Influence of carrier filling ratio on the advanced nitrogen removal from wastewater treatment plant effluent by denitrifying MBBR. Int. J. Environ. Res. Public Health 2019, 16, 3244. [Google Scholar] [CrossRef] [PubMed] [Green Version]
- Barwal, A.; Chaudhary, R. Impact of carrier filling ratio on oxygen uptake & transfer rate, volumetric oxygen transfer coefficient and energy saving potential in a lab-scale MBBR. J. Water Proc. Eng. 2015, 8, 202–208. [Google Scholar]
- Lopez-Lopez, C.; Martín-Pascual, J.; González-Martínez, A.; Calderón, K.; González-López, J.; Hontoria, E.; Poyatos, J.M. Influence of filling ratio and carrier type on organic matter removal in a moving bed biofilm reactor with pretreatment of electrocoagulation in wastewater treatment. J. Environ. Sci. Health Part A Toxic/Hazard. Subst. Environ. Eng. 2012, 47, 1759–1767. [Google Scholar] [CrossRef]
- Kanchanamala Delanka-Pedige, H.M.; Munasinghe-Arachchige, S.P.; Abeysiriwardana-Arachchige, I.S.A.; Nirmalakhandan, N. Evaluating wastewater treatment infrastructure systems based on UN Sustainable Development Goals and targets. J. Clean. Prod. 2021, 298, 126795. [Google Scholar] [CrossRef]
Figure 1.
Research sequence.

Figure 2.
Scheme of the lab-scale bench: 1—wastewater influent; 2—aerobic reactor; 3—aeration device; 4—floating carrier; 5—air supply; 6—compressor; 7—effluent from reactor; 8—sedimentation tank; 9—reverse activated sludge; 10—effluent.
Figure 2.
Scheme of the lab-scale bench: 1—wastewater influent; 2—aerobic reactor; 3—aeration device; 4—floating carrier; 5—air supply; 6—compressor; 7—effluent from reactor; 8—sedimentation tank; 9—reverse activated sludge; 10—effluent.

Figure 3.
Floating carrier Polystyrene.

Figure 4.
Floating carrier Polyvinyl chloride.

Figure 5.
Floating carrier “Polyvom”.

Figure 6.
Floating carrier Bioballs.

Figure 7.
Floating carrier “Polyurethane foam”.

Figure 8.
Ammonium removal dynamics if: floating carrier is 10% of reactor volume (black); 20% of tank volume (green); 30% of tank volume (orange); no carrier in the reactor (magenta).
Figure 8.
Ammonium removal dynamics if: floating carrier is 10% of reactor volume (black); 20% of tank volume (green); 30% of tank volume (orange); no carrier in the reactor (magenta).

Figure 9.
Ammonium removal dynamics if: floating carrier is 10% of reactor volume (black); 20% of tank volume (green); 30% of tank volume (orange); no carrier in the reactor (magenta).
Figure 9.
Ammonium removal dynamics if: floating carrier is 10% of reactor volume (black); 20% of tank volume (green); 30% of tank volume (orange); no carrier in the reactor (magenta).

Figure 10.
BOD removal dynamics if: floating carrier PV is 10% of reactor volume (black); 20% of tank volume (green); 30% of tank volume (orange); no carrier in the reactor (magenta).
Figure 10.
BOD removal dynamics if: floating carrier PV is 10% of reactor volume (black); 20% of tank volume (green); 30% of tank volume (orange); no carrier in the reactor (magenta).

Figure 11.
Ammonium removal dynamics if: floating carrier PV is 10% of reactor volume (black); 20% of tank volume (green); 30% of tank volume (orange); no carrier in the reactor (magenta).
Figure 11.
Ammonium removal dynamics if: floating carrier PV is 10% of reactor volume (black); 20% of tank volume (green); 30% of tank volume (orange); no carrier in the reactor (magenta).

Figure 12.
BOD removal dynamics if: floating carrier BB is 10% of reactor volume (black); 20% of tank volume (green); 30% of tank volume (orange); no carrier in the reactor (magenta).
Figure 12.
BOD removal dynamics if: floating carrier BB is 10% of reactor volume (black); 20% of tank volume (green); 30% of tank volume (orange); no carrier in the reactor (magenta).

Figure 13.
Ammonium removal dynamics if: floating carrier BB is 10% of reactor volume (black); 20% of tank volume (green); 30% of tank volume (orange); no carrier in the reactor (magenta).
Figure 13.
Ammonium removal dynamics if: floating carrier BB is 10% of reactor volume (black); 20% of tank volume (green); 30% of tank volume (orange); no carrier in the reactor (magenta).

Figure 14.
BOD removal dynamics if: floating carrier is PS (10% of reactor volume (black)); floating carrier is PV (20% of tank volume (green)); floating carrier is BB (20% of tank volume (orange)); no carrier in the reactor (magenta).
Figure 14.
BOD removal dynamics if: floating carrier is PS (10% of reactor volume (black)); floating carrier is PV (20% of tank volume (green)); floating carrier is BB (20% of tank volume (orange)); no carrier in the reactor (magenta).

Figure 15.
Ammonium removal dynamics if: floating carrier is PS (10% of reactor volume (black)); floating carrier is PV (20% of tank volume (green)); floating carrier is BB (20% of tank volume (orange)); no carrier in the reactor (magenta).
Figure 15.
Ammonium removal dynamics if: floating carrier is PS (10% of reactor volume (black)); floating carrier is PV (20% of tank volume (green)); floating carrier is BB (20% of tank volume (orange)); no carrier in the reactor (magenta).


Table 1.
COD values for examined type of floating carrier.
| Floating Carrier | COD (mg/L) |
|---|---|
| PS | 5.1 |
| PVC | 31 |
| PV | 2.4 |
| BB | 3.3 |
| PUF | 7.6 |
Table 2.
Average values of treatment for PS-carrier.
| Filling Ratio | BOD5 | NH4 | ||||
|---|---|---|---|---|---|---|
| Influent (mg/L) | Effluent (mg/L) | Efficiency (%) | Influent (mg/L) | Effluent (mg/L) | Efficiency (%) | |
| 10% | 155 | 8 | 95 | 22.1 | 3.1 | 86 |
| 20% | 161 | 8 | 96 | 21.2 | 3 | 86 |
| 30% | 152 | 7.4 | 95 | 21.9 | 4.9 | 78 |
| 0% (Control) | 154 | 12.9 | 92 | 22.7 | 10.1 | 55 |
Table 3.
Average values of treatment for PV-carrier.
| Filling Ratio | BOD5 | NH4 | ||||
|---|---|---|---|---|---|---|
| Influent (mg/L) | Effluent (mg/L) | Efficiency (%) | Influent (mg/L) | Effluent (mg/L) | Efficiency (%) | |
| 10% | 147 | 8.6 | 96 | 25.7 | 7 | 73 |
| 20% | 161 | 6.7 | 96 | 26.6 | 4.9 | 82 |
| 30% | 144 | 6.2 | 96 | 24.2 | 5 | 79 |
| 0% (Control) | 155 | 12.8 | 92 | 24 | 10.5 | 56 |
Table 4.
Average values of treatment for BB-carrier.
| Amount of Carrier in the Reactor | BOD5 | NH4 | ||||
|---|---|---|---|---|---|---|
| Influent (mg/L) | Effluent (mg/L) | Efficiency (%) | Influent (mg/L) | Effluent (mg/L) | Efficiency (%) | |
| 10% | 135 | 7 | 95 | 23 | 6.6 | 71 |
| 20% | 144 | 6.4 | 96 | 22.7 | 4.3 | 81 |
| 30% | 143 | 6.4 | 96 | 21.7 | 4.7 | 78 |
| 0% (Control) | 147 | 12.3 | 92 | 22.1 | 10.2 | 54 |
Publisher’s Note: MDPI stays neutral with regard to jurisdictional claims in published maps and institutional affiliations. |
© 2021 by the author. Licensee MDPI, Basel, Switzerland. This article is an open access article distributed under the terms and conditions of the Creative Commons Attribution (CC BY) license (https://creativecommons.org/licenses/by/4.0/).
Share and Cite
MDPI and ACS Style
Makisha, N. Application of Biofilm Carrier in Aerobic Reactors as a Method to Improve Quality of Wastewater Treatment. Hydrology 2021, 8, 77. https://0-doi-org.brum.beds.ac.uk/10.3390/hydrology8020077
AMA Style
Makisha N. Application of Biofilm Carrier in Aerobic Reactors as a Method to Improve Quality of Wastewater Treatment. Hydrology. 2021; 8(2):77. https://0-doi-org.brum.beds.ac.uk/10.3390/hydrology8020077
Chicago/Turabian StyleMakisha, Nikolay. 2021. "Application of Biofilm Carrier in Aerobic Reactors as a Method to Improve Quality of Wastewater Treatment" Hydrology 8, no. 2: 77. https://0-doi-org.brum.beds.ac.uk/10.3390/hydrology8020077
Note that from the first issue of 2016, this journal uses article numbers instead of page numbers. See further details here.