
Multi-Objective Model-Based Assessment of Green-Grey Infrastructures for Urban Flood Mitigation


1
Program of Civil Engineering, Faculty of Engineering, Universidad del Magdalena, Carrera 32 No. 22-08, Santa Marta 470004, Colombia
2
Environmental Engineering and Water Technology Department, IHE Delft Institute for Water Education, Westvest 7, 2611 AX Delft, The Netherlands
*
Author to whom correspondence should be addressed.
Hydrology 2021, 8(3), 110; https://0-doi-org.brum.beds.ac.uk/10.3390/hydrology8030110
Submission received: 13 June 2021
/
Revised: 12 July 2021
/
Accepted: 15 July 2021
/
Published: 27 July 2021
(This article belongs to the Special Issue Advances and Perspectives in Flood Risk Modeling, Assessment and Communication)
Abstract
:This paper presents the performance quantification of different green-grey infrastructures, including rainfall-runoff and infiltration processes, on the overland flow and its connection with a sewer system. The present study suggests three main components to form the structure of the proposed model-based assessment. The first two components provide the optimal number of green infrastructure (GI) practices allocated in an urban catchment and optimal grey infrastructures, such as pipe and storage tank sizing. The third component evaluates selected combined green-grey infrastructures based on rainfall-runoff and infiltration computation in a 2D model domain. This framework was applied in an urban catchment in Dhaka City (Bangladesh) where different green-grey infrastructures were evaluated in relation to flood damage and investment costs. These practices implemented separately have an impact on the reduction of damage and investment costs. However, their combination has been shown to be the best action to follow. Finally, it was proved that including rainfall-runoff and infiltration processes, along with the representation of GI within a 2D model domain, enhances the analysis of the optimal combination of infrastructures, which in turn allows the drainage system to be assessed holistically.
1. Introduction
Retrofit solutions for the management of urban infrastructure have been successfully applied in cities worldwide [1]. They have been proven to be a cost-effective solution to manage flood risk, whilst also delivering a range of other benefits [2,3,4]. These solutions include constructed structures such as treatment facilities, sewer systems, stormwater systems, and storage basins, which are known as grey infrastructure. A strategically planned network has also been used as an approach that projects, restores, or mimics the natural water cycle, also known as green infrastructure (GI). Previous implementation of these practices suggests that the combined green-grey measures turned out to be more effective than the grey-only option [5,6].
Projects attempting to enhance the performance of retrofit solutions in urban catchments have discovered significant improvements, focusing on: (i) overcoming uncertainty and barriers using blue-green infrastructures for risk management [7,8]; (ii) proposed frameworks to assess green infrastructure to mitigate urban flood hazards [9,10]; (iii) modelling the interference of underground structures by groundwater flow and potential remedial solutions for this [11]; and (iv) integrating strategies to improve the microclimate regulation of green-blue-grey infrastructures in specific urban forms [12]. The results of these studies have produced, among others, a comprehensive evaluation of the integration of green-grey practices.
The use of numerical models has proved to be invaluable for dealing with urban water management issues [13,14]. A fast assessment framework to generate evidence for comparing strategies at low resource cost during the initial design has been carried out by the authors of [15]. This provides evidence to identify performance trends and consider resilience to extreme events at an early stage of planning. The impact of mitigation measures and infiltration on flash floods has been investigated in [16]. A 2D robust shallow-water model including infiltration with the Green-Ampt model was used for this purpose. This model can help to define appropriate locations and dimensions of these mitigation measures.
It is possible to explore the performance of urban infrastructure with the inclusion of optimization techniques. Previous research has implemented a multi-objective evolutionary algorithm optimization to evaluate the effectiveness of different intervention measures [17,18,19,20], investigate the likelihood of green infrastructure enhancement using hybrid models and machine learning techniques [21,22,23], and explore multiple benefits and increase the impact of green-blue-grey infrastructures [24,25,26]. Similarly, assessment using the 1D/2D modelling approach has also shown some significant advantages [27,28,29,30,31]. The results obtained demonstrate their potential for solving some of the biggest challenges that water/wastewater utilities are currently facing [32,33].
In addition to the abovementioned studies, green-grey approaches for current and future urban flood mitigation have been addressed [34,35,36,37]. However, a green-grey approach assessment which includes the rainfall-runoff and infiltration process on the overland flow and its interaction with a sewer network have not been taken into consideration. Further to this, there is a lack of information on the impact of representing green infrastructure in a 2D model domain when computing flood damage and investment costs. The remaining challenge is still the performance quantification of optimal green-grey infrastructures with the mentioned considerations.
The objective of the present work is to develop a multi-objective model-based assessment of green-grey infrastructure for urban flood mitigation. To achieve this, three modelling components have been developed to form the structure of the framework. The first component provides the optimal number of green infrastructures allocated in the catchment. The second component produces the optimal grey infrastructures such as pipe and storage sizing. The third component evaluates the selected optimal green-grey practices based on rainfall-runoff and infiltration computation that are included in a 2D model domain. The main contributions or novelties of the present work are that the proposed method can be significantly closer to real-world physics than traditional model-based approaches for urban flood mitigation, and as such it is likely to produce better results, and that the proposed assessment identifies flood depth maps, including rainfall-runoff and infiltration computation in a 2D model domain, more reliably than conventional approaches. The details of the proposed model-based assessment are presented below. A drainage system in a real-life case study in Dhaka City (Bangladesh) is used to demonstrate its feasibility and application procedures.
2. Case Study
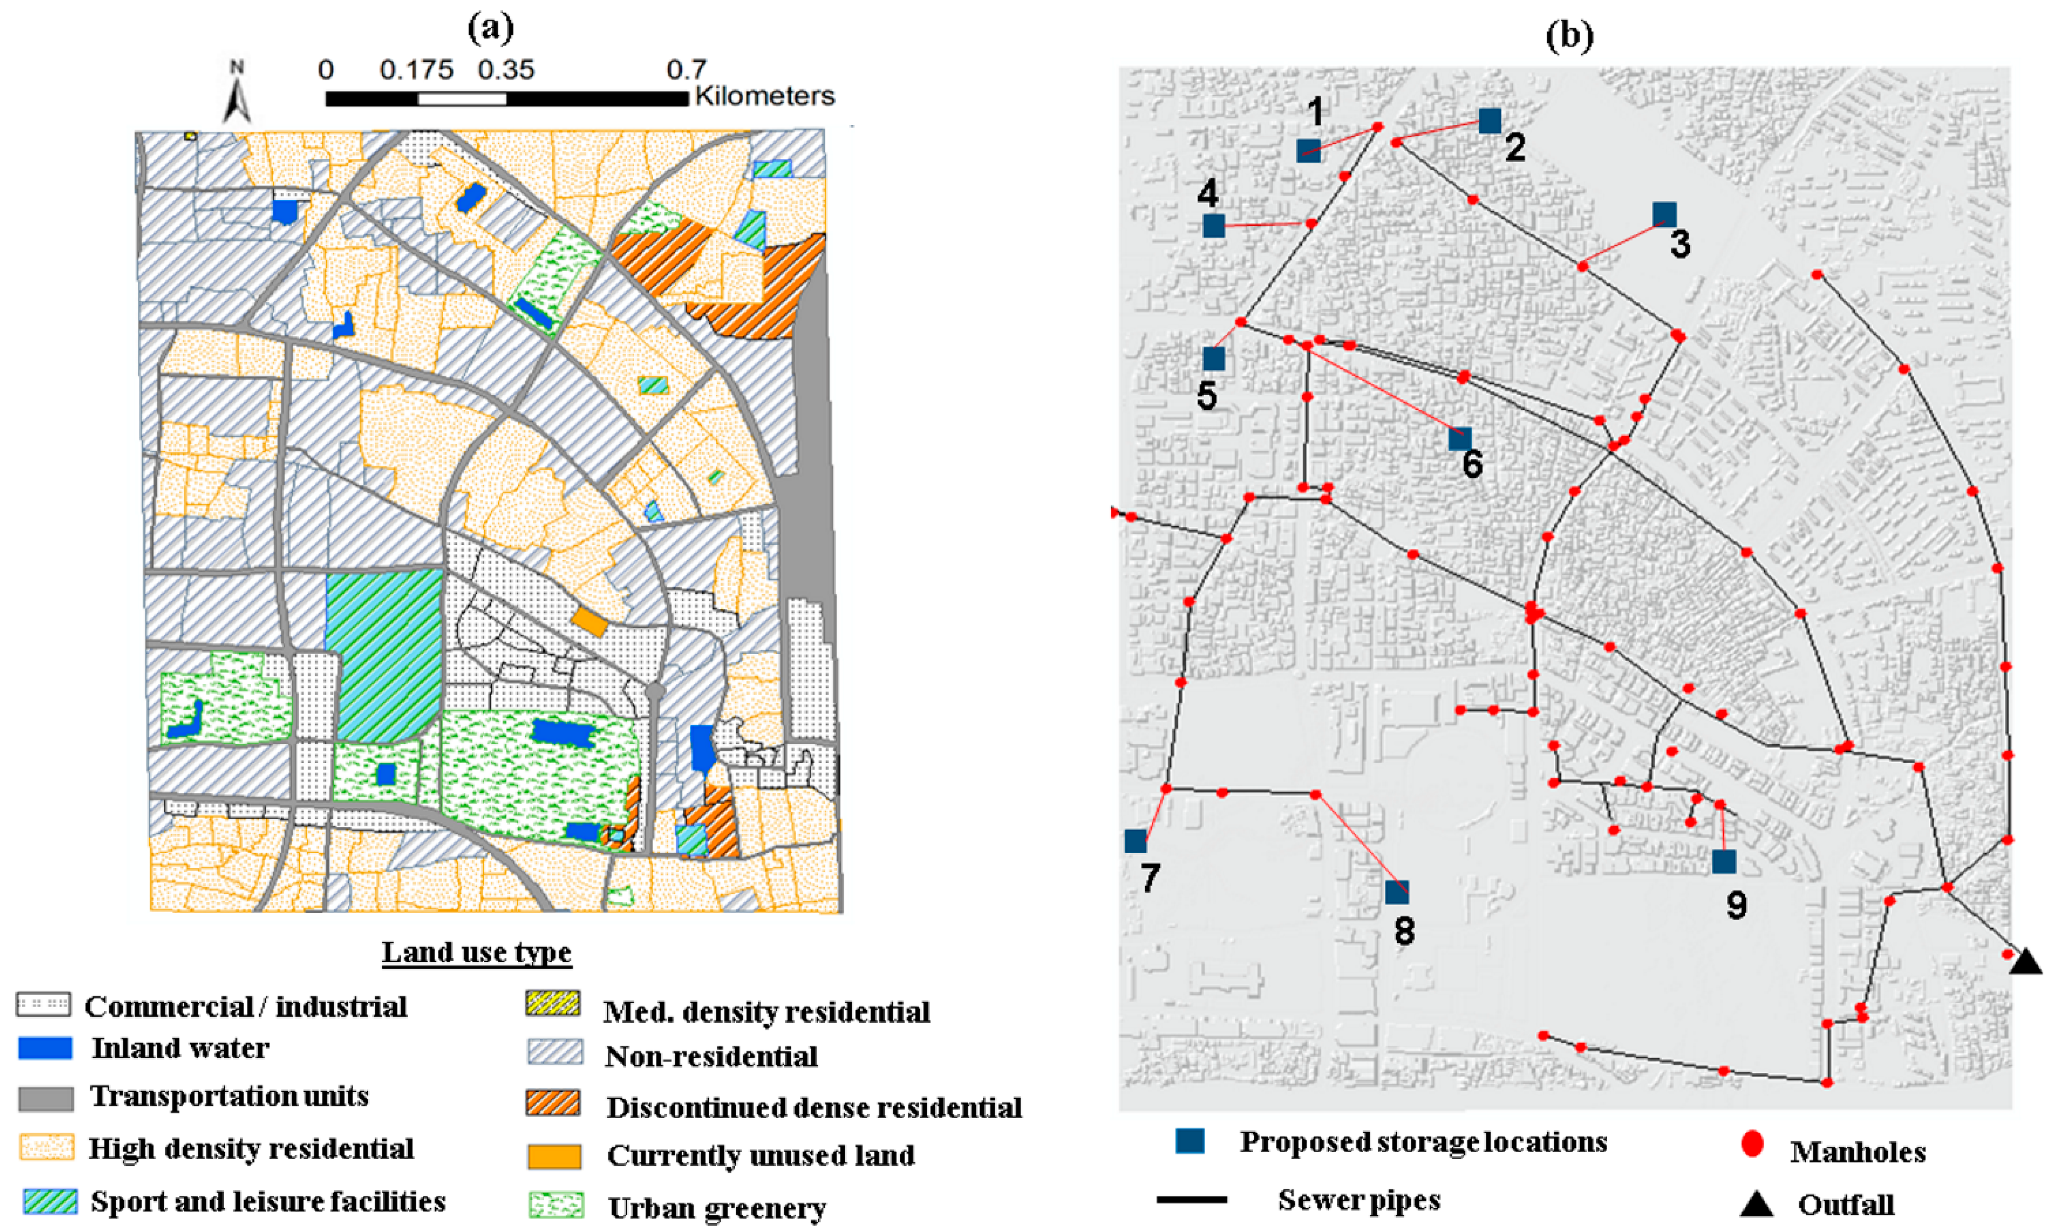
The urban catchment of Segunbagicha, Dhaka (Bangladesh) has a drainage area of 8.3 Km2. It contains 74 subcatchments, 88 conduits (75 circular pipes and 13 box culverts), 88 nodes (junctions), 2 pump stations, and 1 outfall. The time of concentration is 20 min. Figure 1 depicts the study area. The Digital Terrain Model (DTM) has a 10 m resolution. The 1D sewer model was previously calibrated in the work described in [38].
Nine possible sites for storage tanks were selected based on the availability of space and the performance of the system. Their locations are illustrated in Figure 1b. Storage tanks are defined through an elevation-storage curve with a maximum depth of 5 m. The depth is governed by a weir and a control rule.
3. Methodology
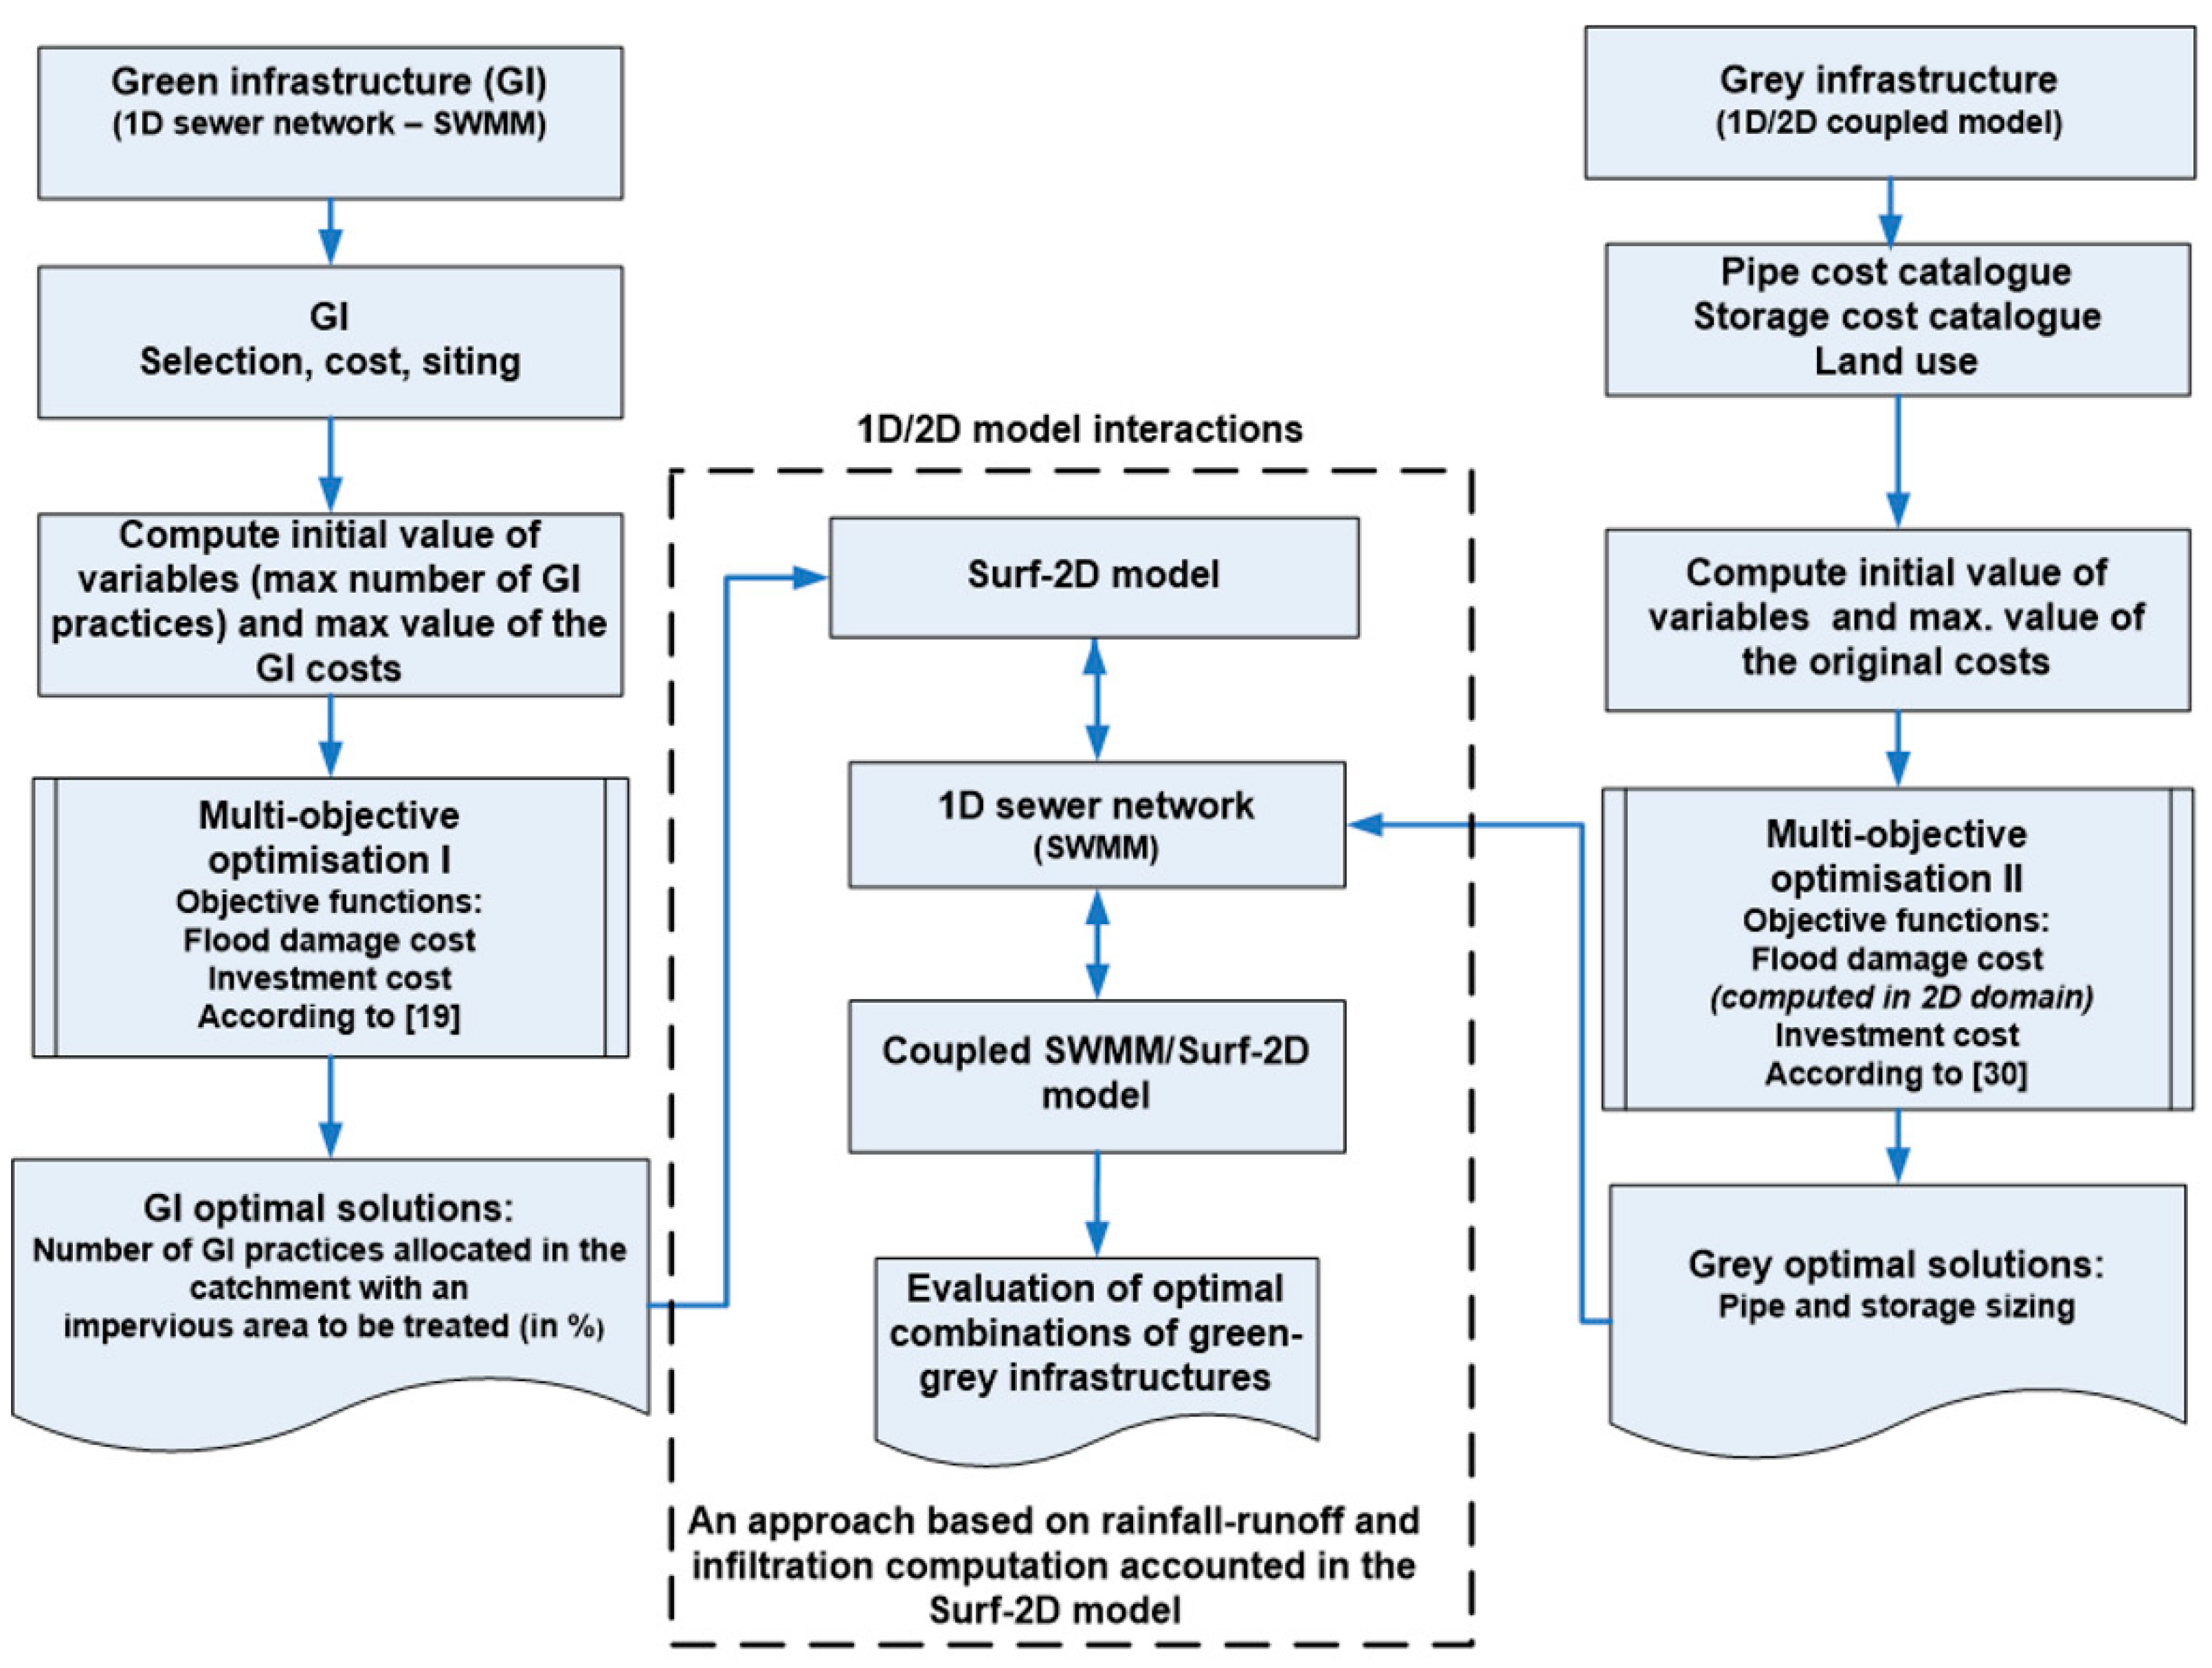
The present work aims to develop a multi-objective model-based evaluation of green-grey infrastructure for urban flood mitigation. To this purpose, three modelling components have been developed to form the structure of the assessment. Figure 2 presents the proposed framework.
The first component is a 1D sewer model with implemented green infrastructure (GI). This takes advantage of using the LID control module of the Storm Water Management Model SWMM 5.1. The sewer model was then coupled with an optimization algorithm NSGA-II [39] with the purpose of obtaining the optimal number of GI practices allocated in the catchment using the percentage of impervious area. Different GI practices were evaluated for their minimization of flood damage and investment costs.
The second component simulates the hydrological rainfall-runoff process and routing of flows in drainage pipes using a 1D sewer network built in SWMM 5.0. The 1D/2D model determines the interacting discharge between the manholes and the overland flow. Grey infrastructure such as the sizing of pipes and storage was implemented within the sewer model. This second component was set as a multi-objective optimization problem by coupling the 1D/2D model with the optimization algorithm NSGA-II, and also has the aim of minimising flood damage and investment costs.
The third component evaluates the optimal combination of green-grey infrastructures obtained from components 1 and 2. It simulates the rainfall-runoff and infiltration process on the overland flow along with the connection of the sewer system. The purpose of this component is to reproduce the real-world physics (i.e., the rainfall-runoff and infiltration computation in the 2D model). The details of this component are presented in Section 3.3. A detailed description of each of these three components is given below.
3.1. Green Infrastructure
The first component continues the work presented by the same authors in [19]. Its objective is to allocate the optimal number of environmental practices (green infrastructure—GI) to each subcatchment, taking into account the percentage of impervious area. The optimal number of GI practices was addressed as a multi-objective optimization problem by minimizing the cost of its placement (i.e., the number of GI practices to be installed by their cost) and flood damage cost (i.e., flooding of each node).
This component is a 1D sewer network built in SWMM 5.1 software [40] and coupled with the optimization algorithm NSGA-II (see [19] for more details). The subcatchment parameters of imperviousness percentage, width, and slope were modified according to the original calibrated 1D sewer network of Dhaka created by the authors of [38] The GI were implemented in its LID control module. The result of this process is a Pareto front with non-dominated solutions (i.e., the optimal number of GI practices that minimize flood damage and investment costs).
Appropriate sites for GI placement were acquired from the best management practices tool–siting tool [41]. This tool identifies suitable locations for different GI. It finds potential fitting areas considering the urban land use, classification of soil, streams, impervious regions, and land ownership to allocate the proposed GI. A free space was then computed by deducing the land use area coverage from the total area of each subcatchment. The GI placement was accomplished by identifying the available space for GI implementation in each subcatchment. The ArcGIS tool was used to define the available area. Subcatchment parameters such as width and imperviousness were modified by using Equations (1) and (2) [40]:
where Impnew is the new impervious percentage and Wnew is the new width of the subcatchments after GI placement. The subcatchment area after GI was defined by the difference of the total area of each subcatchment, minus the total area taken by the GI [40]. As a result, 130 GI types were located along the catchment area and used as decision variables within the optimization method.
Flood damage cost function for this component has been computed based on the flooding of each particular node, as follows:
where FD(v) is the flood damage with the function of volume, Si is the flood volume at each node (m3), N is the number of nodes analyzed in the network, β is a penalty factor (100,000 in this case), this value will depend on the value of property.
The investment cost of each GI is connected to the total number of GI units that were implemented in each subcatchment multiplied by their implementation cost. The implementation cost is calculated from a catalogue that contains unit costs for different GI. The number of GI results from the following equation:
where f2 (xi) is the fitness function 2 of solution i, GI.costj is the cost (US $/m2) of GI type j. GI.numberj is the number of GI type j and costmax is the maximum implementation cost.
3.2. Grey Infrastructure
The second component continues the work presented by the same authors in [30]. The grey infrastructure evaluated in this work combines the sizing of both pipes and storage tanks as a multi-objective problem. This minimizes investment and flood damage costs. Damage is computed based on the maximum flood depth at the overland surface. This component uses a 1D sewer network built in SWMM software and then coupled with a non-inertia 2D model (see [42]). In this coupled model the entire catchment hydrology is computed in the 1D model; when the stormwater volume of the network is surpassed and the manholes are surcharged, flow runs out into the 2D model domain from manholes and is then routed. Non-dominated solutions (sizing of pipes and storage tanks) visualized through a Pareto front are obtained from this step (flood damage vs. investment costs) as the 1D/2D model has also been coupled with the optimization algorithm NSGA-II (see [30] for more details). Equation (5) presents the investment cost function for pipes sizing as a function of pipe length:
where RCost is the pipe rehabilitation cost (US $), n is the number of pipes to be upgraded, i is the index of pipes ith, C(P)i is the cost of the pipe ith (US $/m) based on the catalogue of commercially available sizes and Li is the length of the pipe ith (m). For storage tanks, the costs depend on the cost/area of storage from the catalogue. For the combination of pipes and storage sizing, the investment cost was computed including the construction cost of the storage plus a summation of each pipe length multiplied by the cost of that particular pipe based on its diameter.
In this component, the flood damage cost estimation was carried out based on the maximum flood depth at the overland surface. Nine depth-damage curves were built from five water depth ranges (0.3 m, 0.61 m, 0.91 m, 1.22 m, 1.52 m) based on the average damage/loss dataset developed for Dhaka city by [43]. Land use categories (e.g., residential, commercial, governmental, and educational sectors) were also built by fitting a linear equation [44]. The nine land-use damage curves and five water-depth ranges led to 45 damage-cost functions to estimate tangible direct damages. Damage costs in each grid cell of the 2D model were computed using Equation (6), given by:
where MaxWdpth [i, j] is the maximum water depth at the cells [i, j], α is the slope and β is the intercept of each linear regression.
3.3. Multi-Objective Model-Based Assessment
As presented in Figure 2, the third component of the model-based assessment includes the computation of rainfall-runoff and infiltration losses on the overland flow. In this study, the overland flow simulation builds on the work started in [42]. The 2D model solves the 2D Saint-Venant shallow water equations. The continuity equation is given as follows:
where h is the water depth, u and v are the velocities in the directions of the x and y directions. The momentum equations without considering eddy losses, Coriolis force, variations in atmospheric pressure, the wind shear effect, or lateral inflow are given in Equations (8) and (9):
where g is the acceleration due to gravity and the coefficient f is represented in the friction terms of Chézy roughness (taking an average value of 45). The conservation of mass and momentum equations (the Saint Venant equations) given in discretized form were written as a computational engine in C++ language applying the alternating direction implicit scheme (ADI algorithm).
The main features of the Surf-2D model include a two-point forward spatial and temporal difference scheme adopted on the basis of a uniform time step Δt = tn+1 − tn, in which n is the time step counter. For the wetting and drying procedure, the water depth of a grid cell is calculated as the average depth over the whole cell [45]. When the cell first receives water, the wetting front edge usually lies within the cell. In most cases, only part of the cell will be wetted at that time step. When the flow volume leaving a cell is more than that entering the cell, the cell dries and there is the possibility that the water depth may be reduced to zero or a negative value [42].
In order to avoid negative depth values, the wetting process is controlled by a wetting parameter. When the cell is wetting, the water should not be allowed to flow out of the cell until the wetting front has crossed the cell by a property called percentage wet, as given in Equation (10):
where v is the velocity computed from the discharge crossing the cell boundary divided by the cell width and the cell flow depth; Δx is the cell width and Δt is the current time step. Water is not allowed to flow out of the cell until the wetting parameter reaches unity. The wetting parameter is updated in each time step to describe the water travelling across a cell. The whole surface of the cell is used as an active infiltration surface, even if rainfall intensity is zero and the cell is only partially wet. In terms of the numerical scheme, the model has the ability to halve or double the time step; halving to meet the convergence criterion, and doubling after a certain number of time steps without halving.
Previous 1D/2D coupled models in which the hydrological and hydrodynamic flood processes are modelled entirely in a 2D model domain have been proposed, see for instance [31,32,33]. In this study, in order to obtain surface runoff coming from a rainfall hyetograph, the unit hydrograph method proposed by the US Soil Conservation Service [46] was implemented as a surrogate model. The unit hydrograph is convoluted with the effective rainfall hyetograph to acquire the composite flood hydrograph. It is estimated from a synthetic dimensionless hydrograph by considering the ratios of q/qp (flow/peak flow) on the ordinate axis and t/tp (time/time to peak) on the abscissa. The shape of the unit hydrograph, as identified with its peak and time lag, is the quantification of the amount of runoff diffusion predominant in the catchment.
The corresponding hydrograph was used as an inflow upstream boundary condition in the 2D model domain. In this way, water flows into the model area as a sink or source in a grid with the flow having no horizontal momentum addition, or at a cell boundary so that the contribution of the momentum of the inflow is involved. The basic geometry for the model domain consists of a square grid of point values of the ground level across the urban area being modelled.
Initial losses (rainfall interception from roofs, urban trees, and depression storage) were included in the unit hydrograph at the start of the design storm. The initial loss value follows the observations presented for urban areas in [47]. Infiltration contributes to runoff losses during and after the rainfall event, and has thus been described as follows.
An infiltration module algorithm based on the Green and Ampt method was coded into the 2D model and called hereafter Surf-2D. The Green-Ampt equations are given as:
where is the infiltration rate (mm/h), F(t) is the cumulative infiltration depth (mm), ke is the effective saturated conductivity (mm/h), is the moisture deficit (mm/mm), t = time and Ψ is the suction head at the wetting front (mm). The ponded water depth (ho) calculated at the surface of the grid cell as described previously is considered insignificant in comparison to Ψ as it becomes surface runoff. Nevertheless, in cases when the ponded depth is not insignificant, the value of Ψ − ho is substituted for Ψ for infiltration computation at time in Equations (11) and (12) (see [48,49]). In this study, Equations (11) and (12) have been solved for infiltrated depth within the Surf-2D model using a Taylor-series expansion, a method proposed and validated in [50].
Infiltration was calculated by taking into account the computed velocity at which water enters into the soil (infiltration rate) in the corresponding grid cell (area of the grid) per unit of time [51,52]. It is treated as a discharge point sink within the same time interval. The water infiltration was assumed to be one-dimensional, and thus there is no lateral drainage. To avoid an infinite infiltration rate initially (when the infiltrated volume is still equal to zero), a threshold was added to obtain the infiltration rate f = min(inf capacity, imax). Because the infiltrated volume cannot exceed the water depth (h) at the surface of the cell that is available for infiltration at time tn, the volume was updated as shown in Equation (13). Finally, the water depth was updated.
The Surf-2D model was then coupled with SWMM 5.1 software. Originally, SWMM code is separated into functions inside a dynamic link library file which enables an easier handling and linkage to other models. The linking methodology includes three extra functions that were written into the code for exchanging information (i.e., Node ID, water levels, discharges) between the two models during every simulation time. Full details of the linking methodology can be found in [53]. As stated above, direct surface runoff resulting from a given excess rainfall hyetograph was added directly into the Surf-2D model and thus for this component SWMM computes the dynamic sewer network flow and its hydrological runoff module was not used.
Selected optimal combinations of green-grey infrastructures obtained from corresponding components 1 and 2 have been evaluated. Optimal green infrastructure was represented in the Surf-2D model. For this purpose, the optimal percentage of impervious area to be treated obtained from the model component 1 (see Section 3.1) was used to assign a specific hydraulic conductivity (ke) of the soil (i.e., ke value assigned for each grid cell). The ke values were selected from the corresponding land use type (Figure 1a) and fieldwork infiltration data from the study presented in [54]. Optimal grey infrastructure was simulated in the 1D sewer model, taking into account the optimal sizing of pipes and storage tanks obtained from the model component 2 (see Section 3.2). The 1D model does not initially have water to simulate the overland flow draining back to the system.
4. Results
4.1. Green Infrastructure
In order to test the initial performance of the drainage system, the 1D sewer model built in SWMM was run for a 2-year rainfall event with the purpose of analyzing the green-grey infrastructure for a small, frequent rainfall event. The simulation results without implementing any infrastructure indicate a total flood volume of 6040 m3. The estimated damage cost computed based on the flooding of each node were found to be $5.2 million. The overall project investment cost using this maximum number of green infrastructures (GI practices) was found to be $10 million dollars. This value was obtained according to the maximum number of practices of each GI and its equivalent cost.
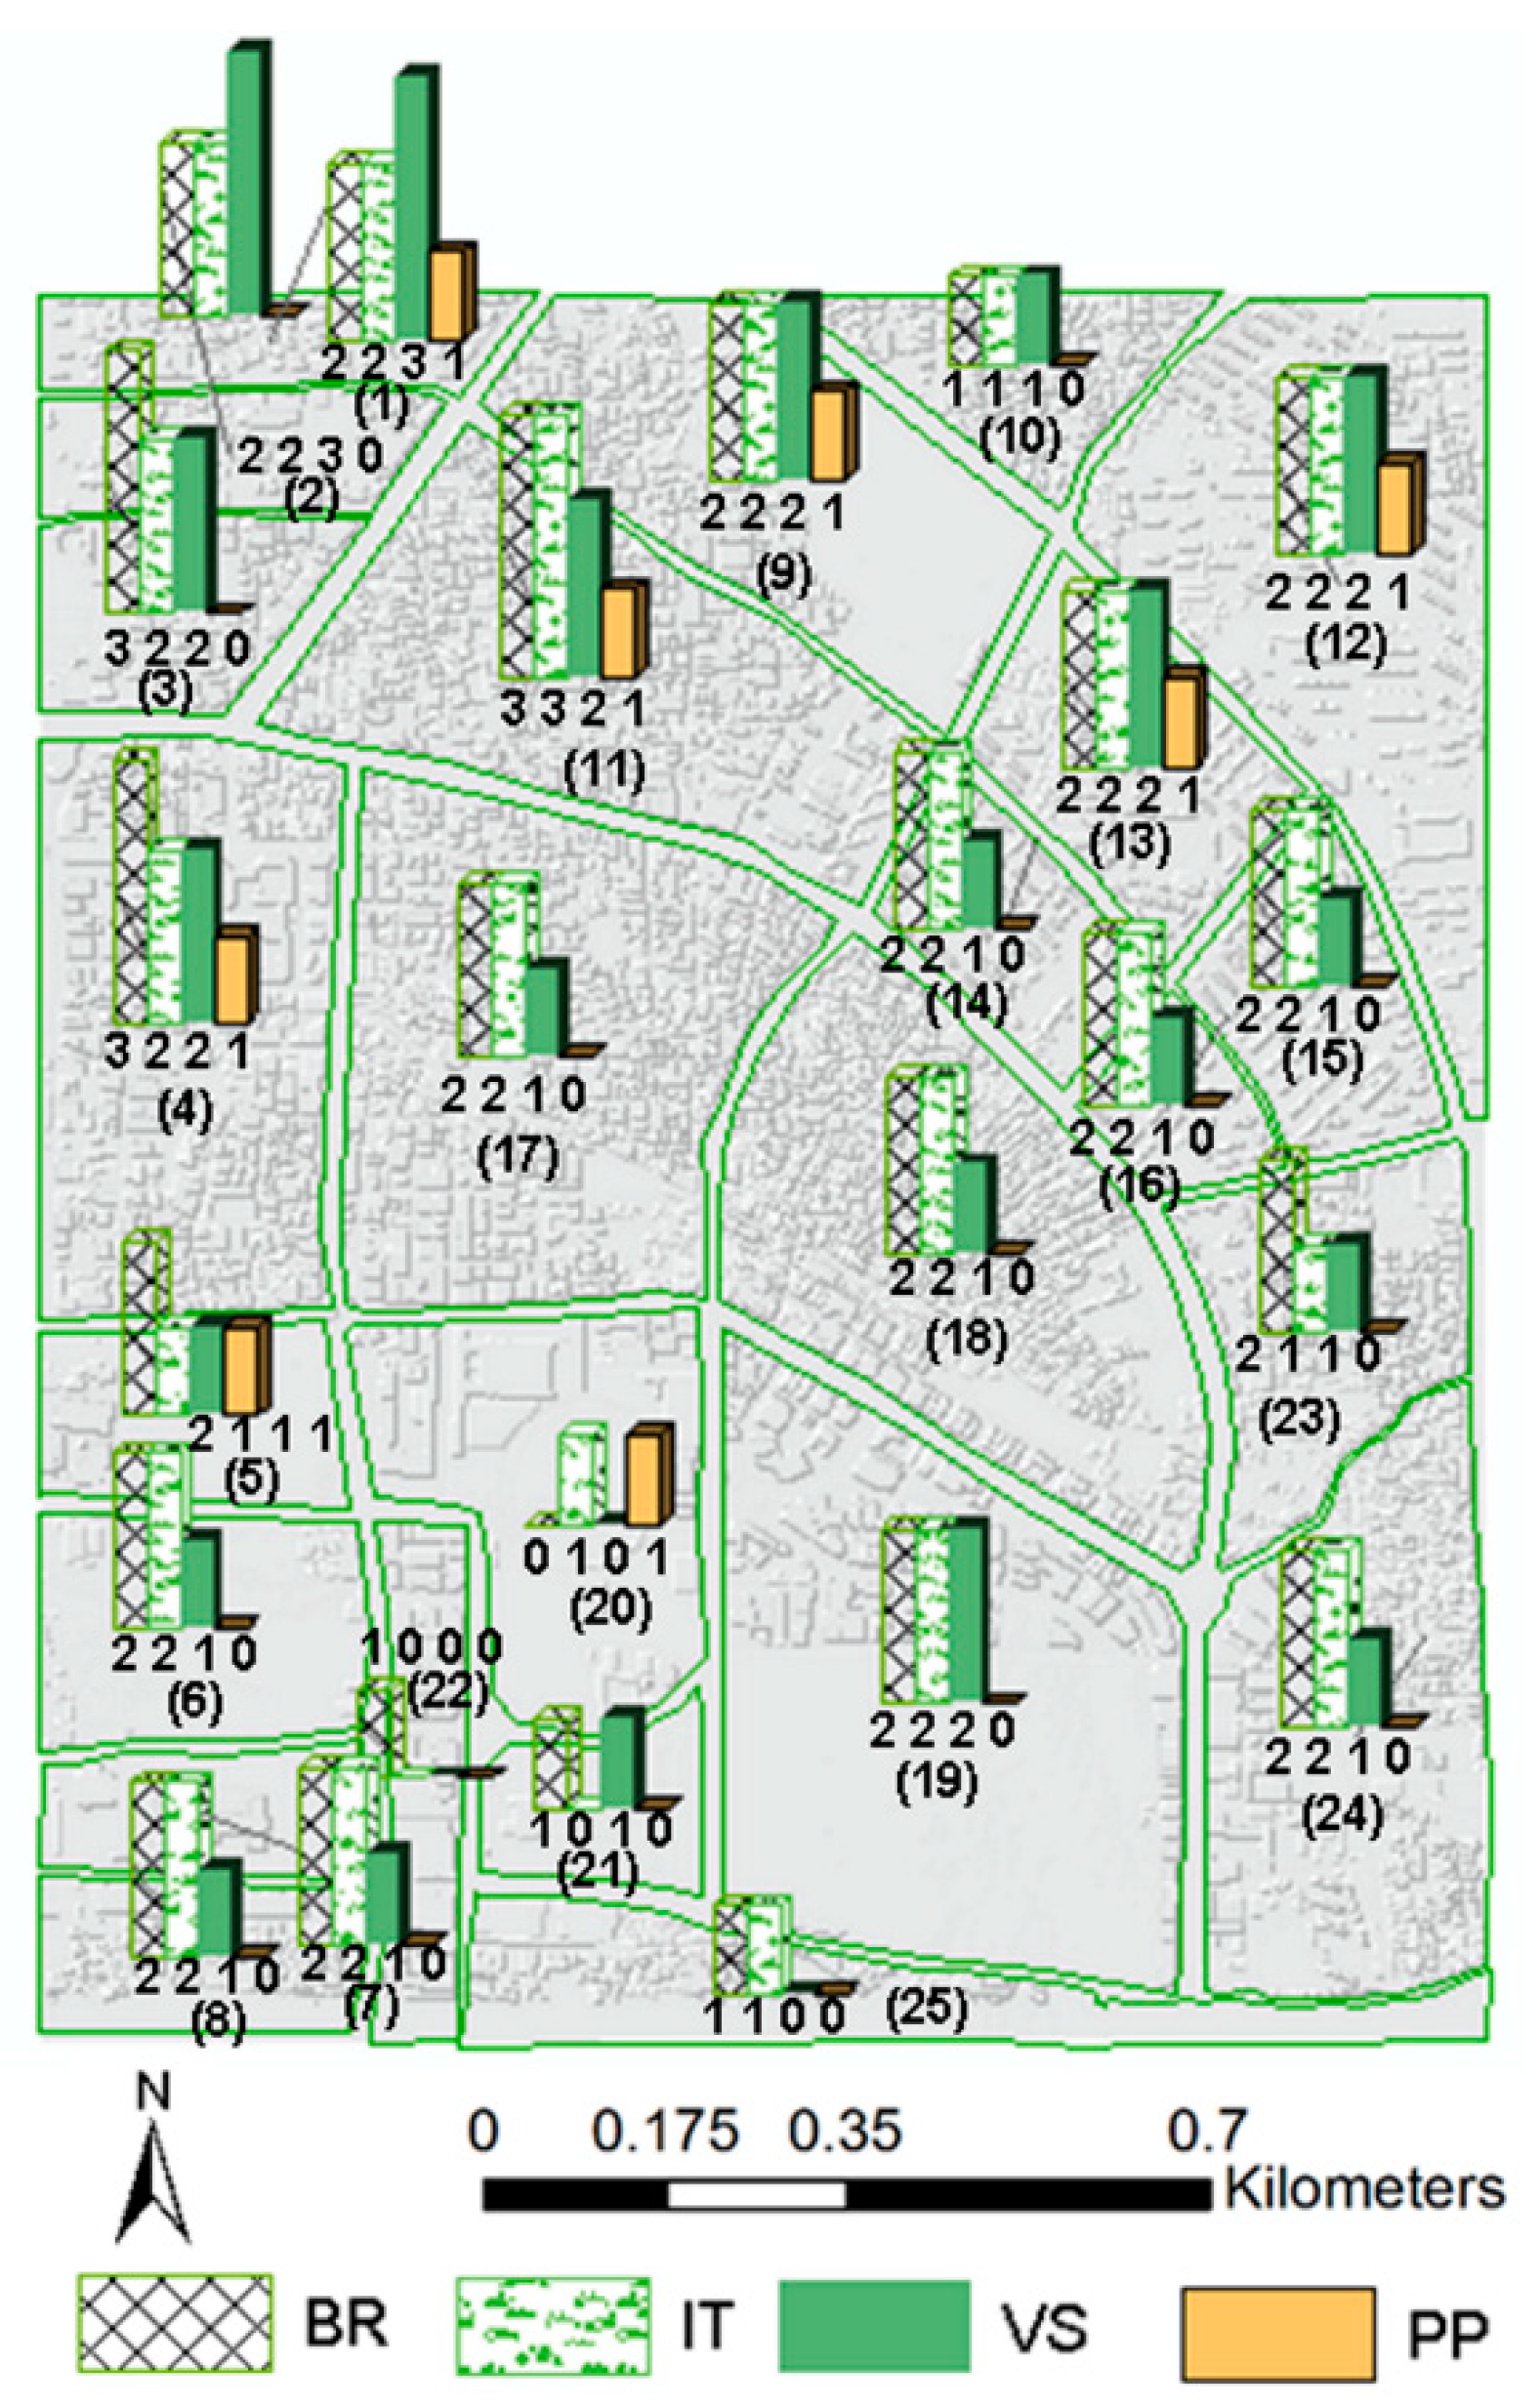
Promising relevant location/areas for different GI practices were identified from the analysis of urban land use, soil classification, land ownership, and impervious layers. The distribution of GI was carried out by calculating the available space in each sub-catchment. The minimum percentage of available area (ha) was found to be 5% and the maximum 80%. Figure 3 shows the maximum number of GI practices obtained for each subcatchment.
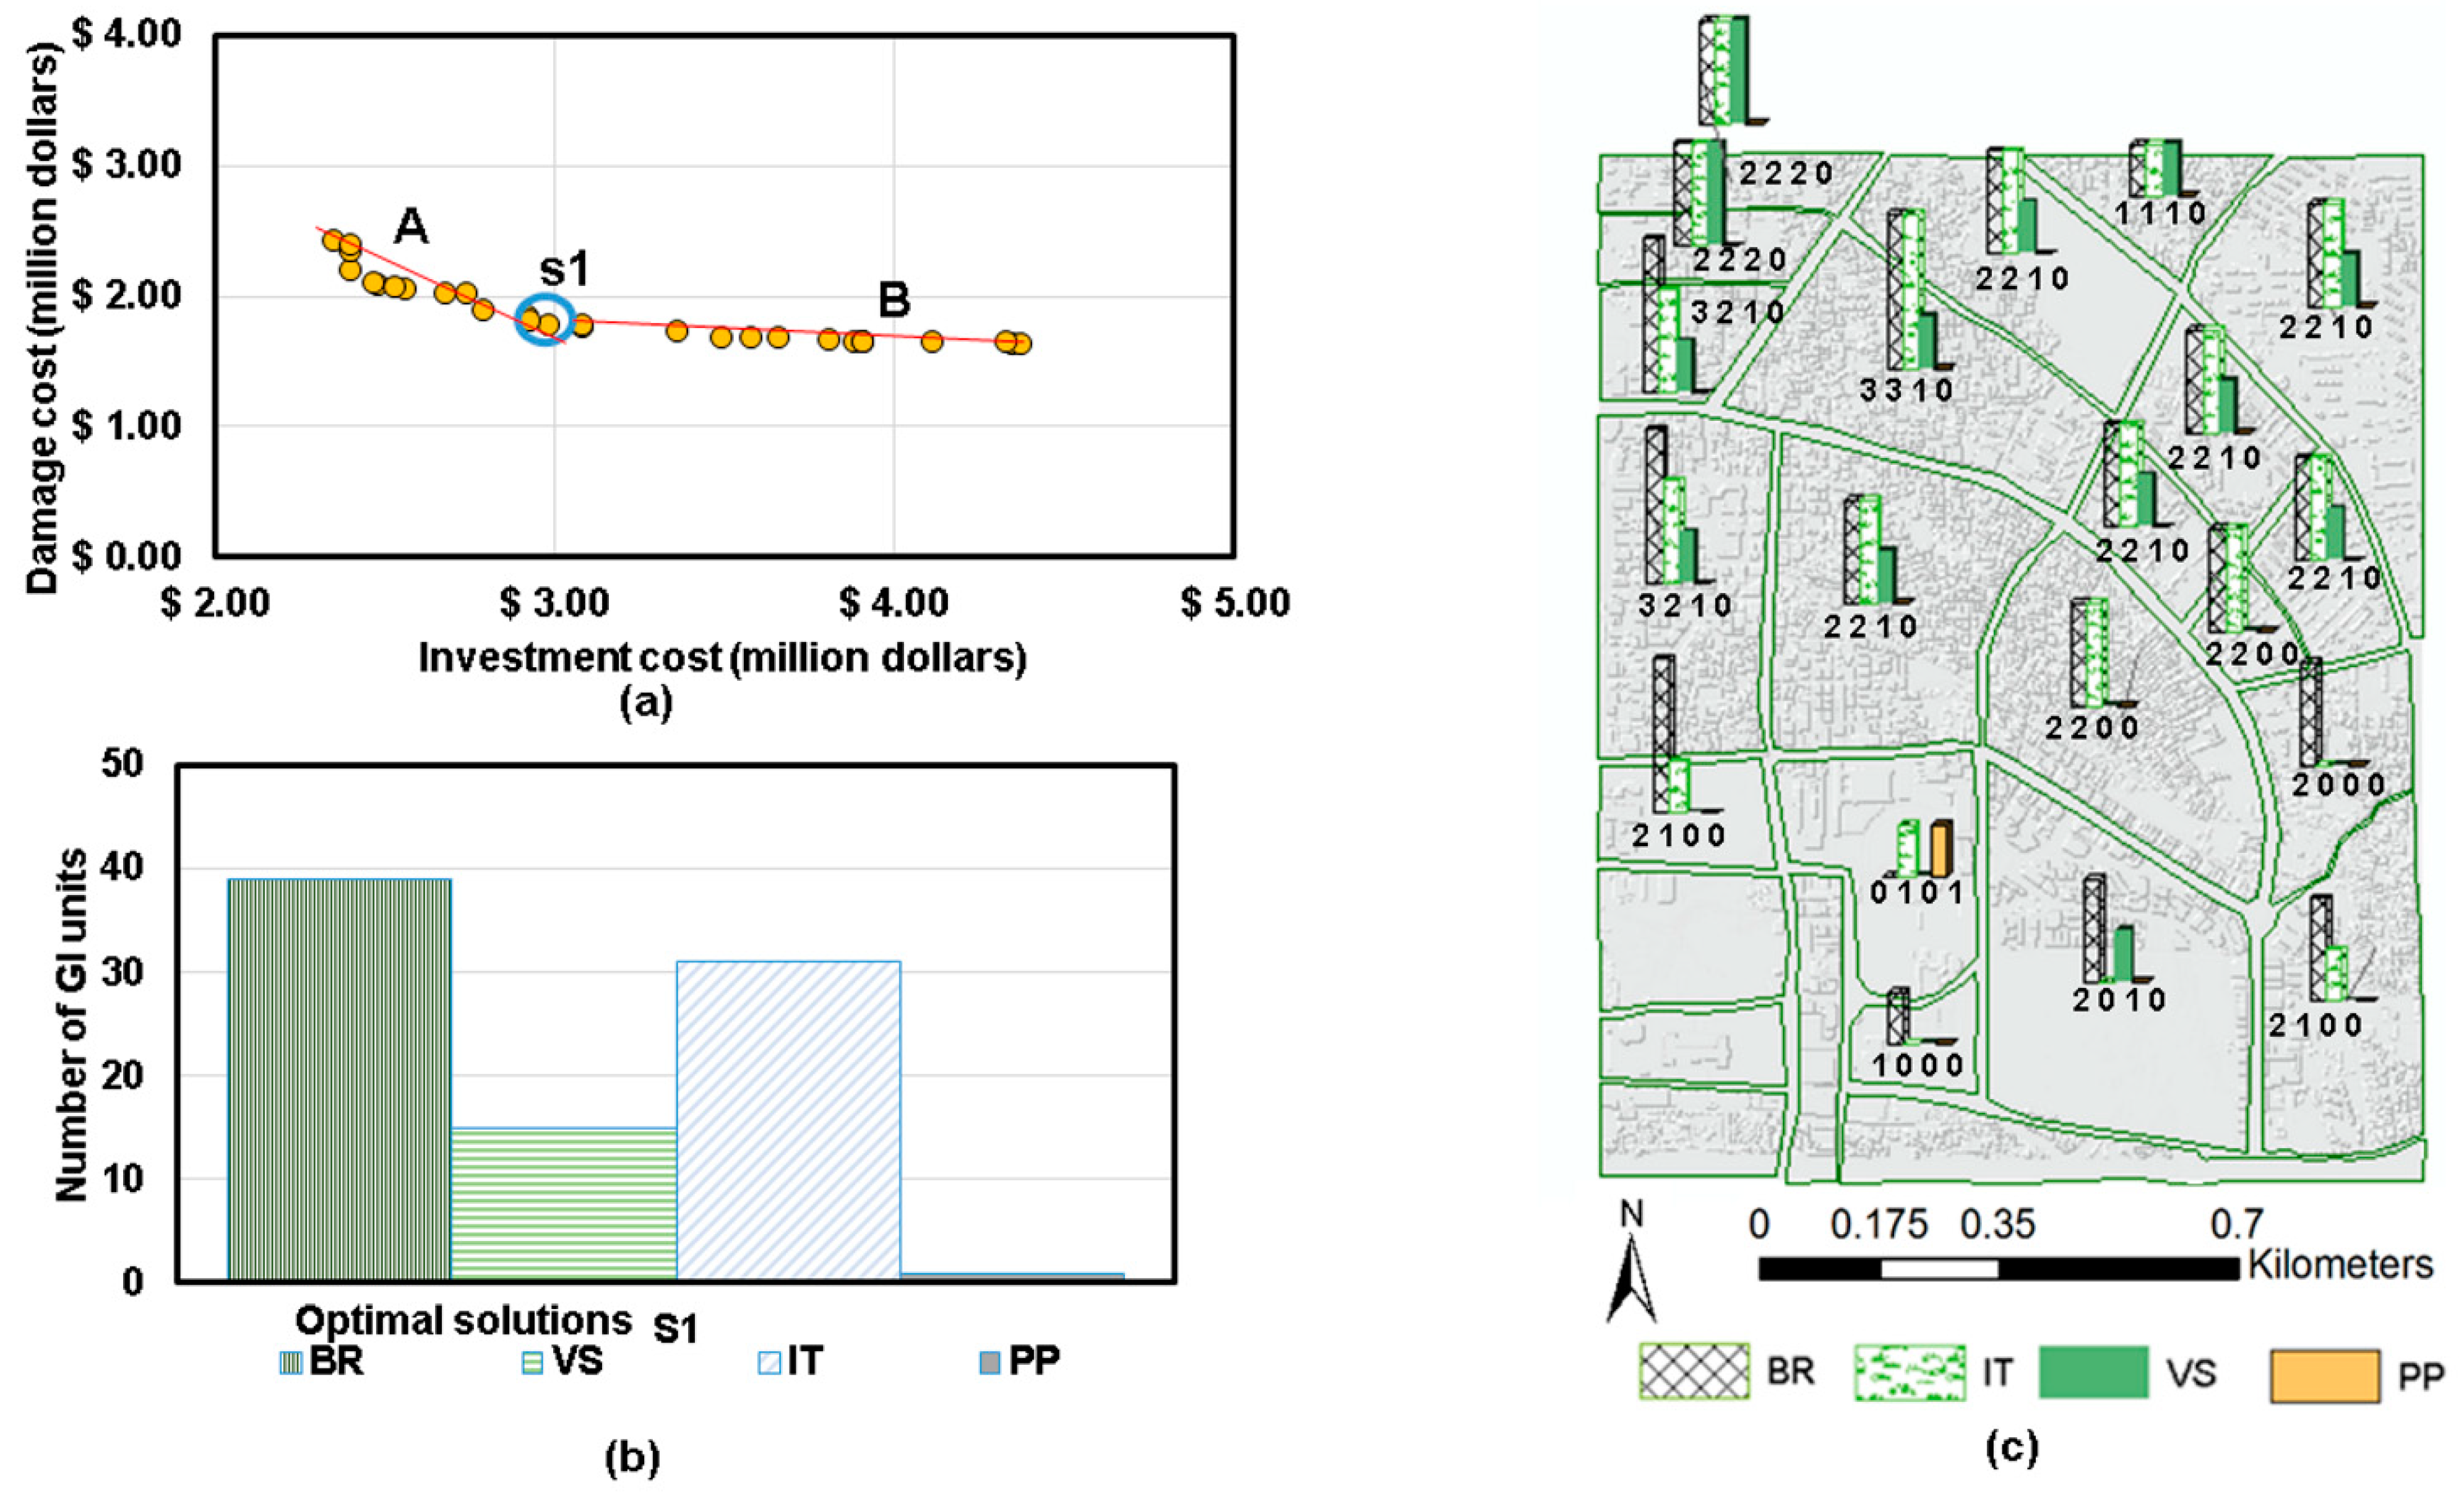
With the criteria presented by the same authors in [19], the maximum number of GI practices found was 130: 47 bio-retention cells, 42 infiltration trenches, 33 vegetative swales, and 8 porous pavements. As stated in Section 3.1 and presented in Figure 2, the first component of the proposed assessment searches for the optimal number of GI practices that minimizes both flood damage and investment costs. Figure 4a shows the non-dominated solutions which reduce flood damage and investment cost by implementing green infrastructure for a 2-year rainfall event. Figure 4b presents the optimal number of GI from a selected solution s1 with the aim of identifying the GI practice that best reduces flood damage. Figure 4c presents the optimal number of green infrastructure deployed in the catchment.
4.2. Grey Infrastructure
A coupled 1D/2D model [42] was run and the initial damage cost without implementing any infrastructure was computed in each grid cell of the 2D domain using the maximum water depth. The drainage system was optimized with the hydrological rainfall-runoff process and routing of flows in pipes performed in the 1D sewer network for a 2-year rainfall event. In order to obtain the optimal grey infrastructure (i.e., sizing of pipes and storage tanks), the second component of the proposed assessment (see Figure 2) searches for a non-dominated solution (Pareto front) that minimizes flood damage and investment costs.
The maximum value of the grey infrastructure (sizing of pipes and storage tanks) was found to be in the order of $22.3 million. The investment cost was computed taking into account pipe length and cost based on its diameter plus the storage structure cost.
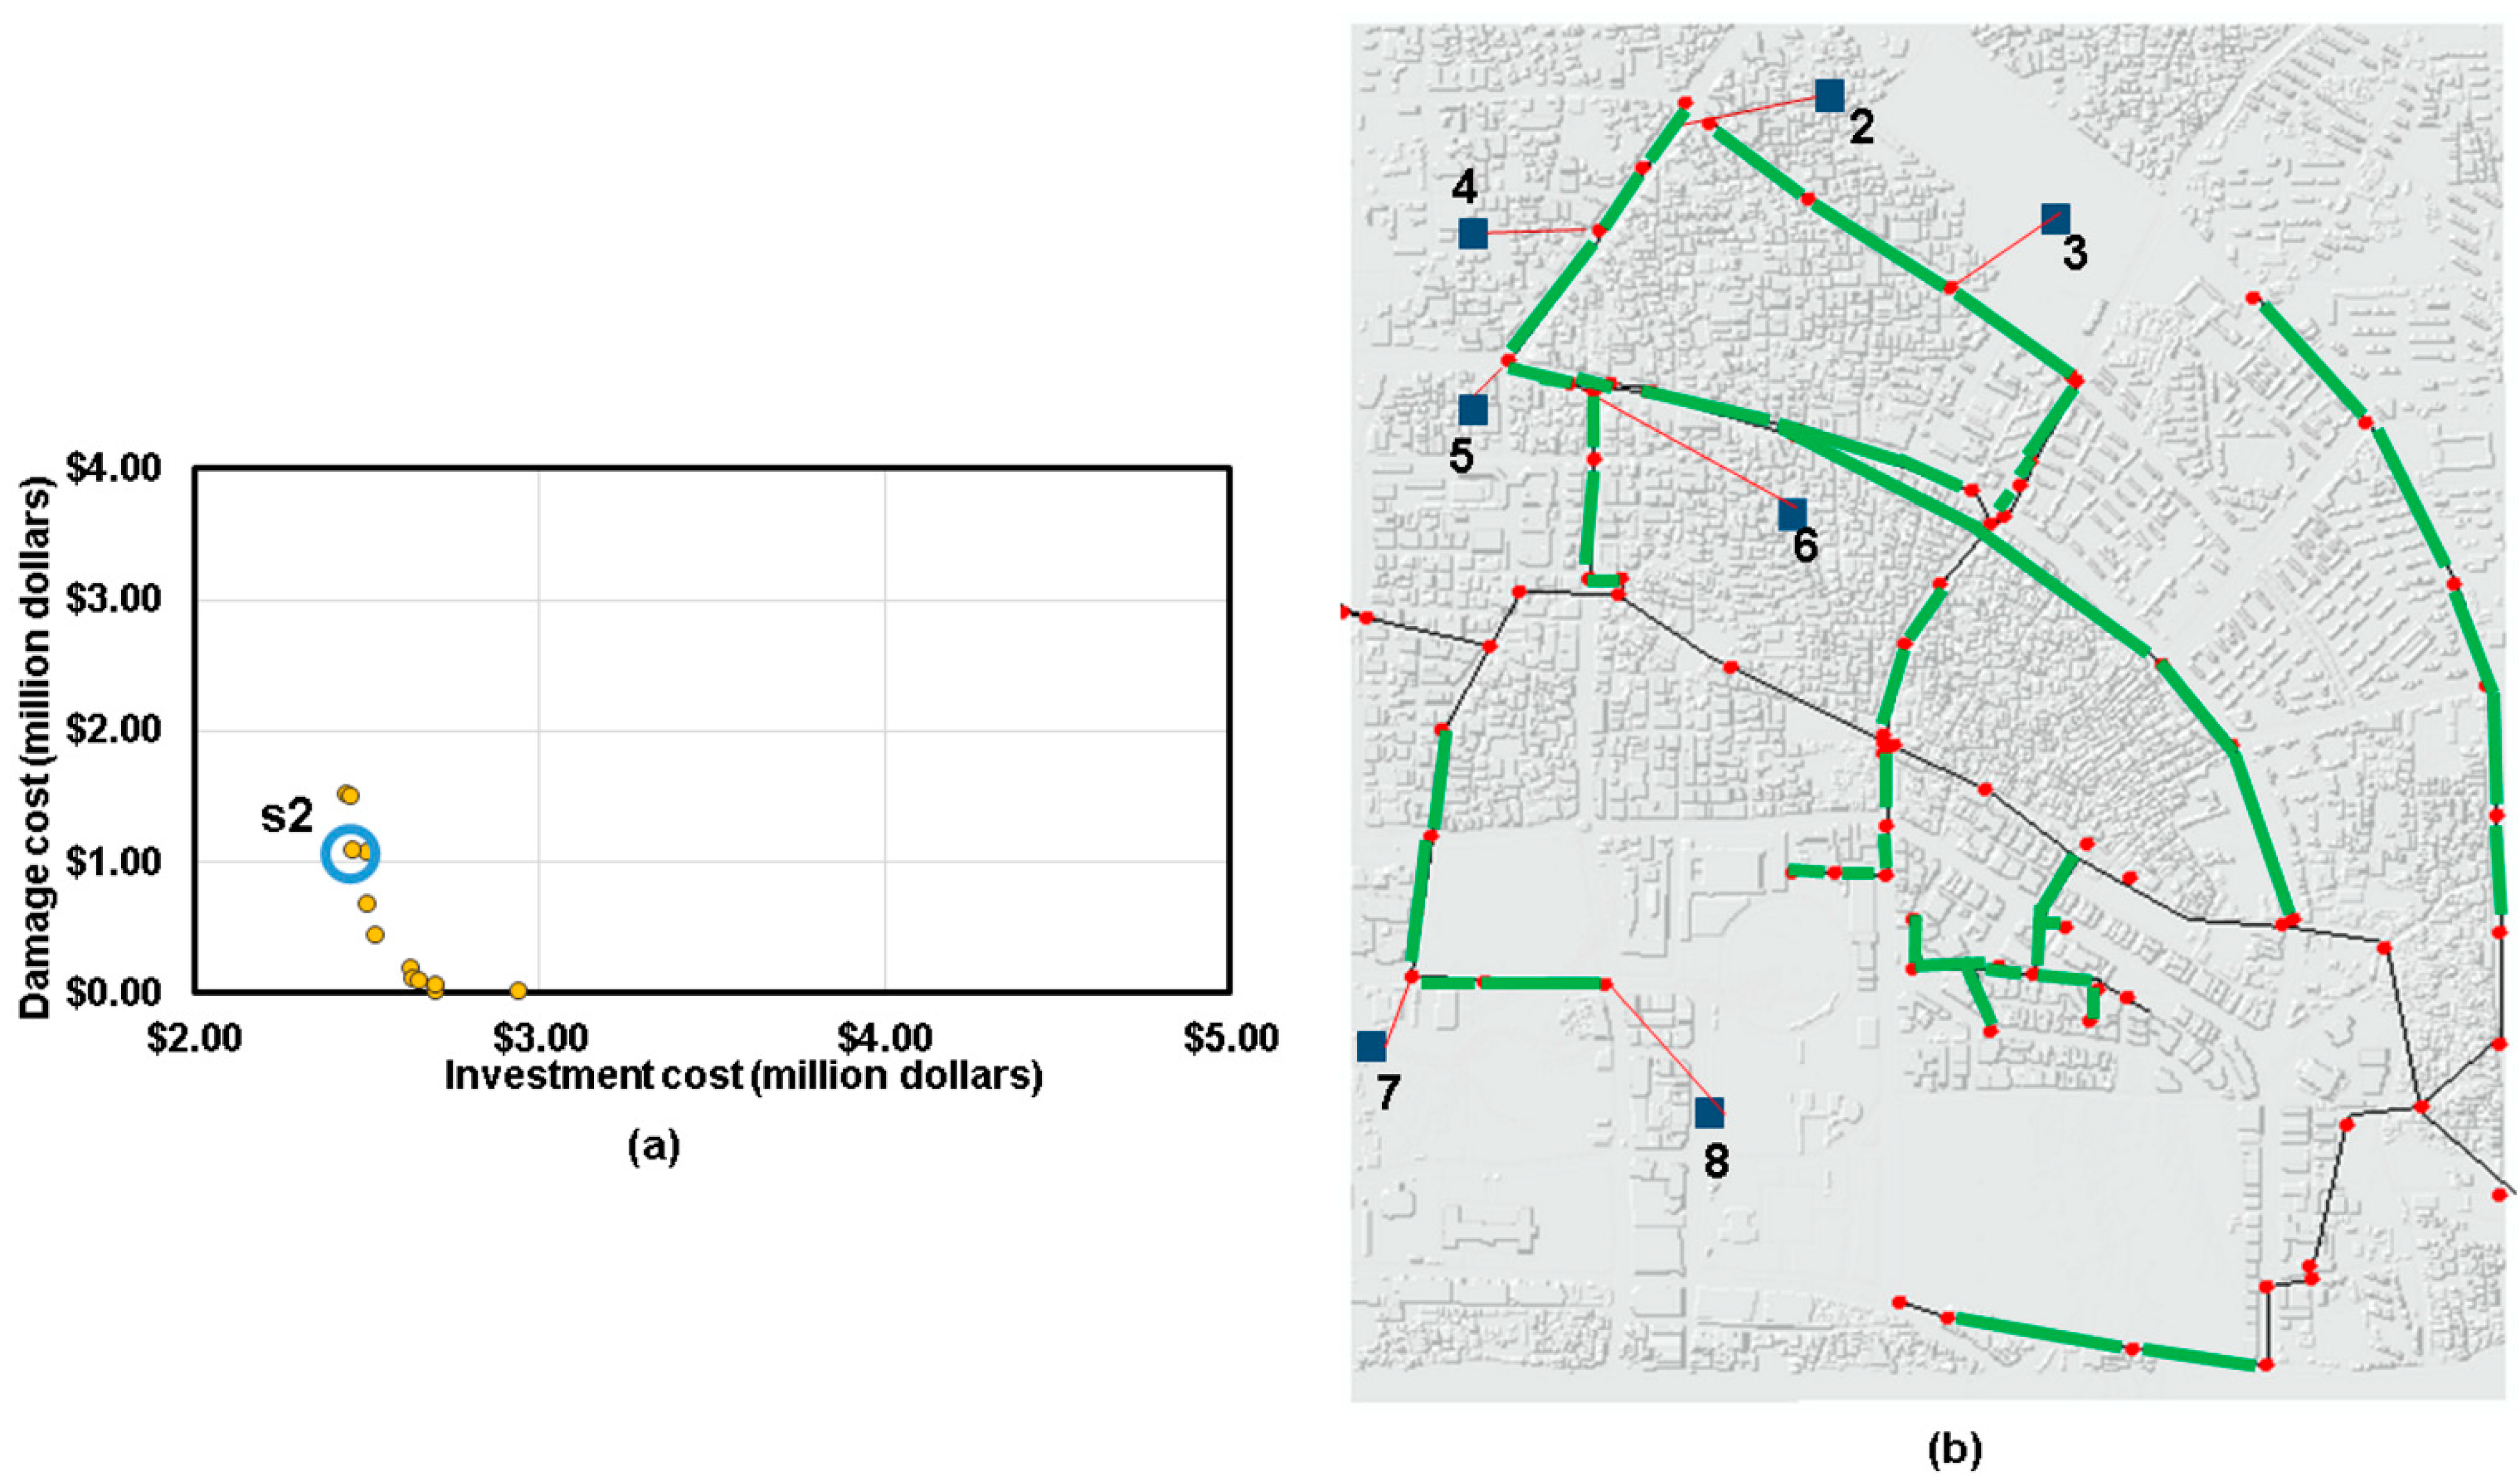
An initial damage cost of $3.7 million was obtained. For this case, there is a 29% difference compared to the damage calculated (i.e., in component 1) from flooding of each particular node ($5.2 million). Figure 5a presents the non-dominated solutions by implementing grey infrastructure for a 2-year rainfall event, while Figure 5b depicts the optimal solution s2 of grey infrastructure.
4.3. Combined Green-Grey Infrastructure
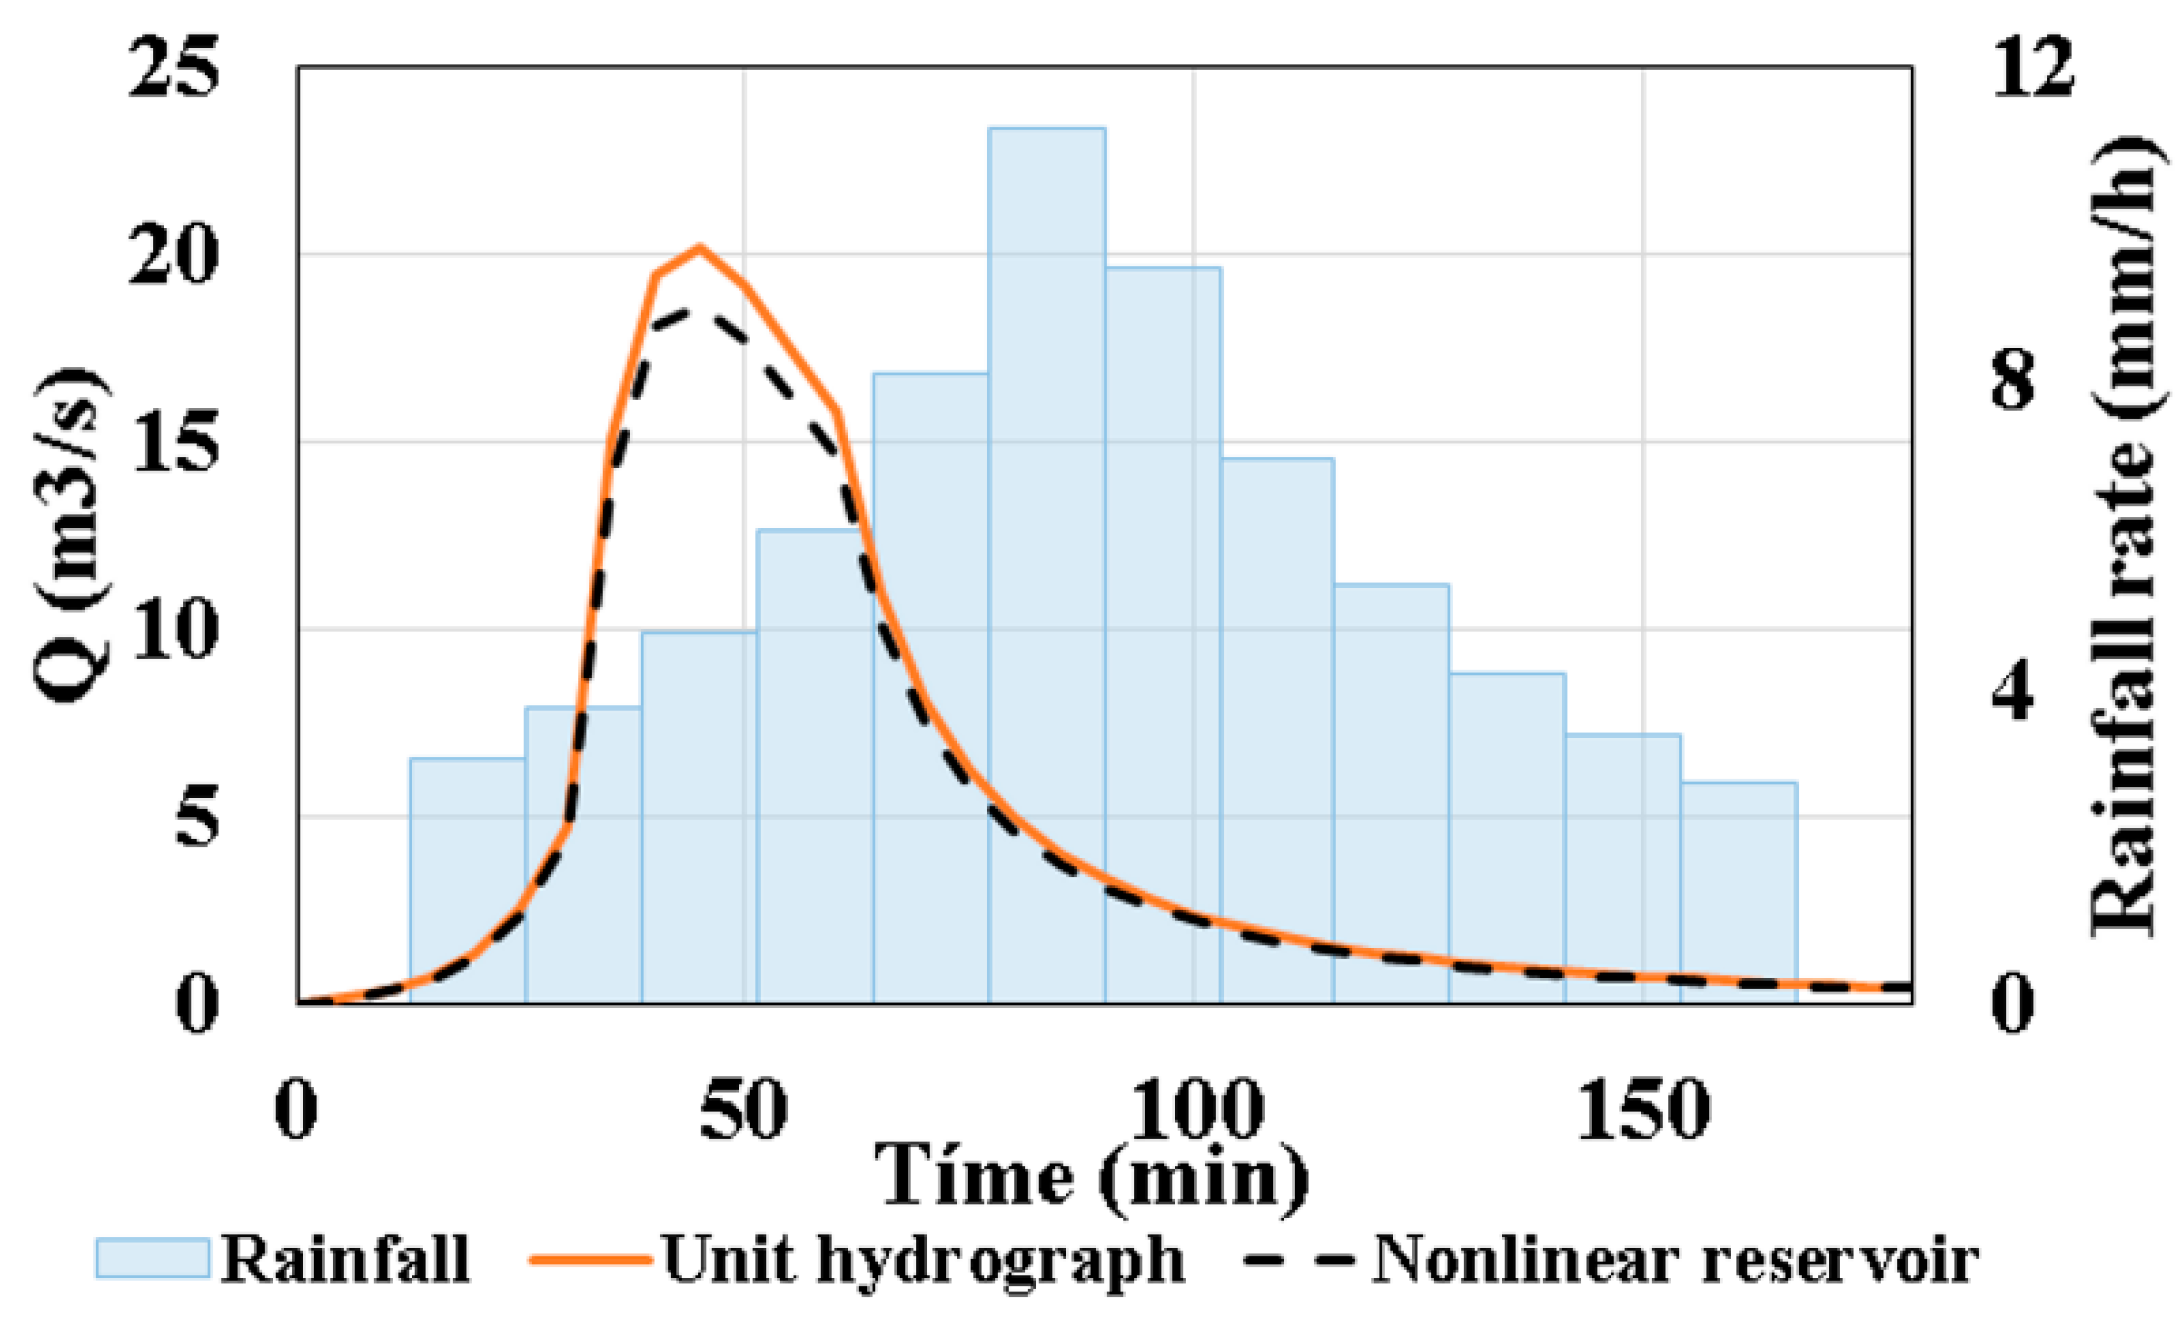
Using the third component presented in Section 3.3, which is based on the rainfall-runoff and infiltration computation in the Surf-2D, optimal solutions s1 and s2 were combined and further evaluated. The results of the surrogate model which produces surface runoff as a boundary condition into the Surf-2D model using the unit hydrograph method, were compared to the validated nonlinear reservoir routing method coded in SWMM software [40]. The rainfall intensity for this case study is 70 mm/h of 1-h duration corresponding to a return period of 2 years.
According to [47], a value of 0.65 mm was assumed as initial losses (rainfall interception and depression storage) for both methods. Infiltration losses were computed with the nonlinear reservoir method assigning clay and sandy soil types (present in the area) in the corresponding subcatchments. Average Green-Ampt parameter values were assigned as trial and error, and listed as follows: suction head (Ψ = 50 mm), effective saturated conductivity ( = 0.65 mm/h), and the moisture deficit ( = 0.38) for a clay soil; and Ψ = 49.5 mm, = 64.3 mm/h, = 0.41 for a sandy soil. Figure 6 shows the comparison between the unit hydrograph and the nonlinear reservoir methods for the case study. The hydrograph obtained was used as an inflow boundary condition in the Surf-2D model.
In order to assess the performance of the Green-Ampt algorithm 2D, a sensitivity analysis was carried out to evaluate its outcome as the effective hydraulic conductivity parameter (ke) in the equation, which is necessary to obtain good estimates of infiltration rates and water depth. To this purpose, the infiltration rates measured in the field of the case study presented in [54] were used for comparison purposes. According to this work, two types of soils (clay and sandy) cover the majority of the soil types in the area. The Green-Ampt parameter values presented in Table 1 were applied following the recommended values listed in [48,55].
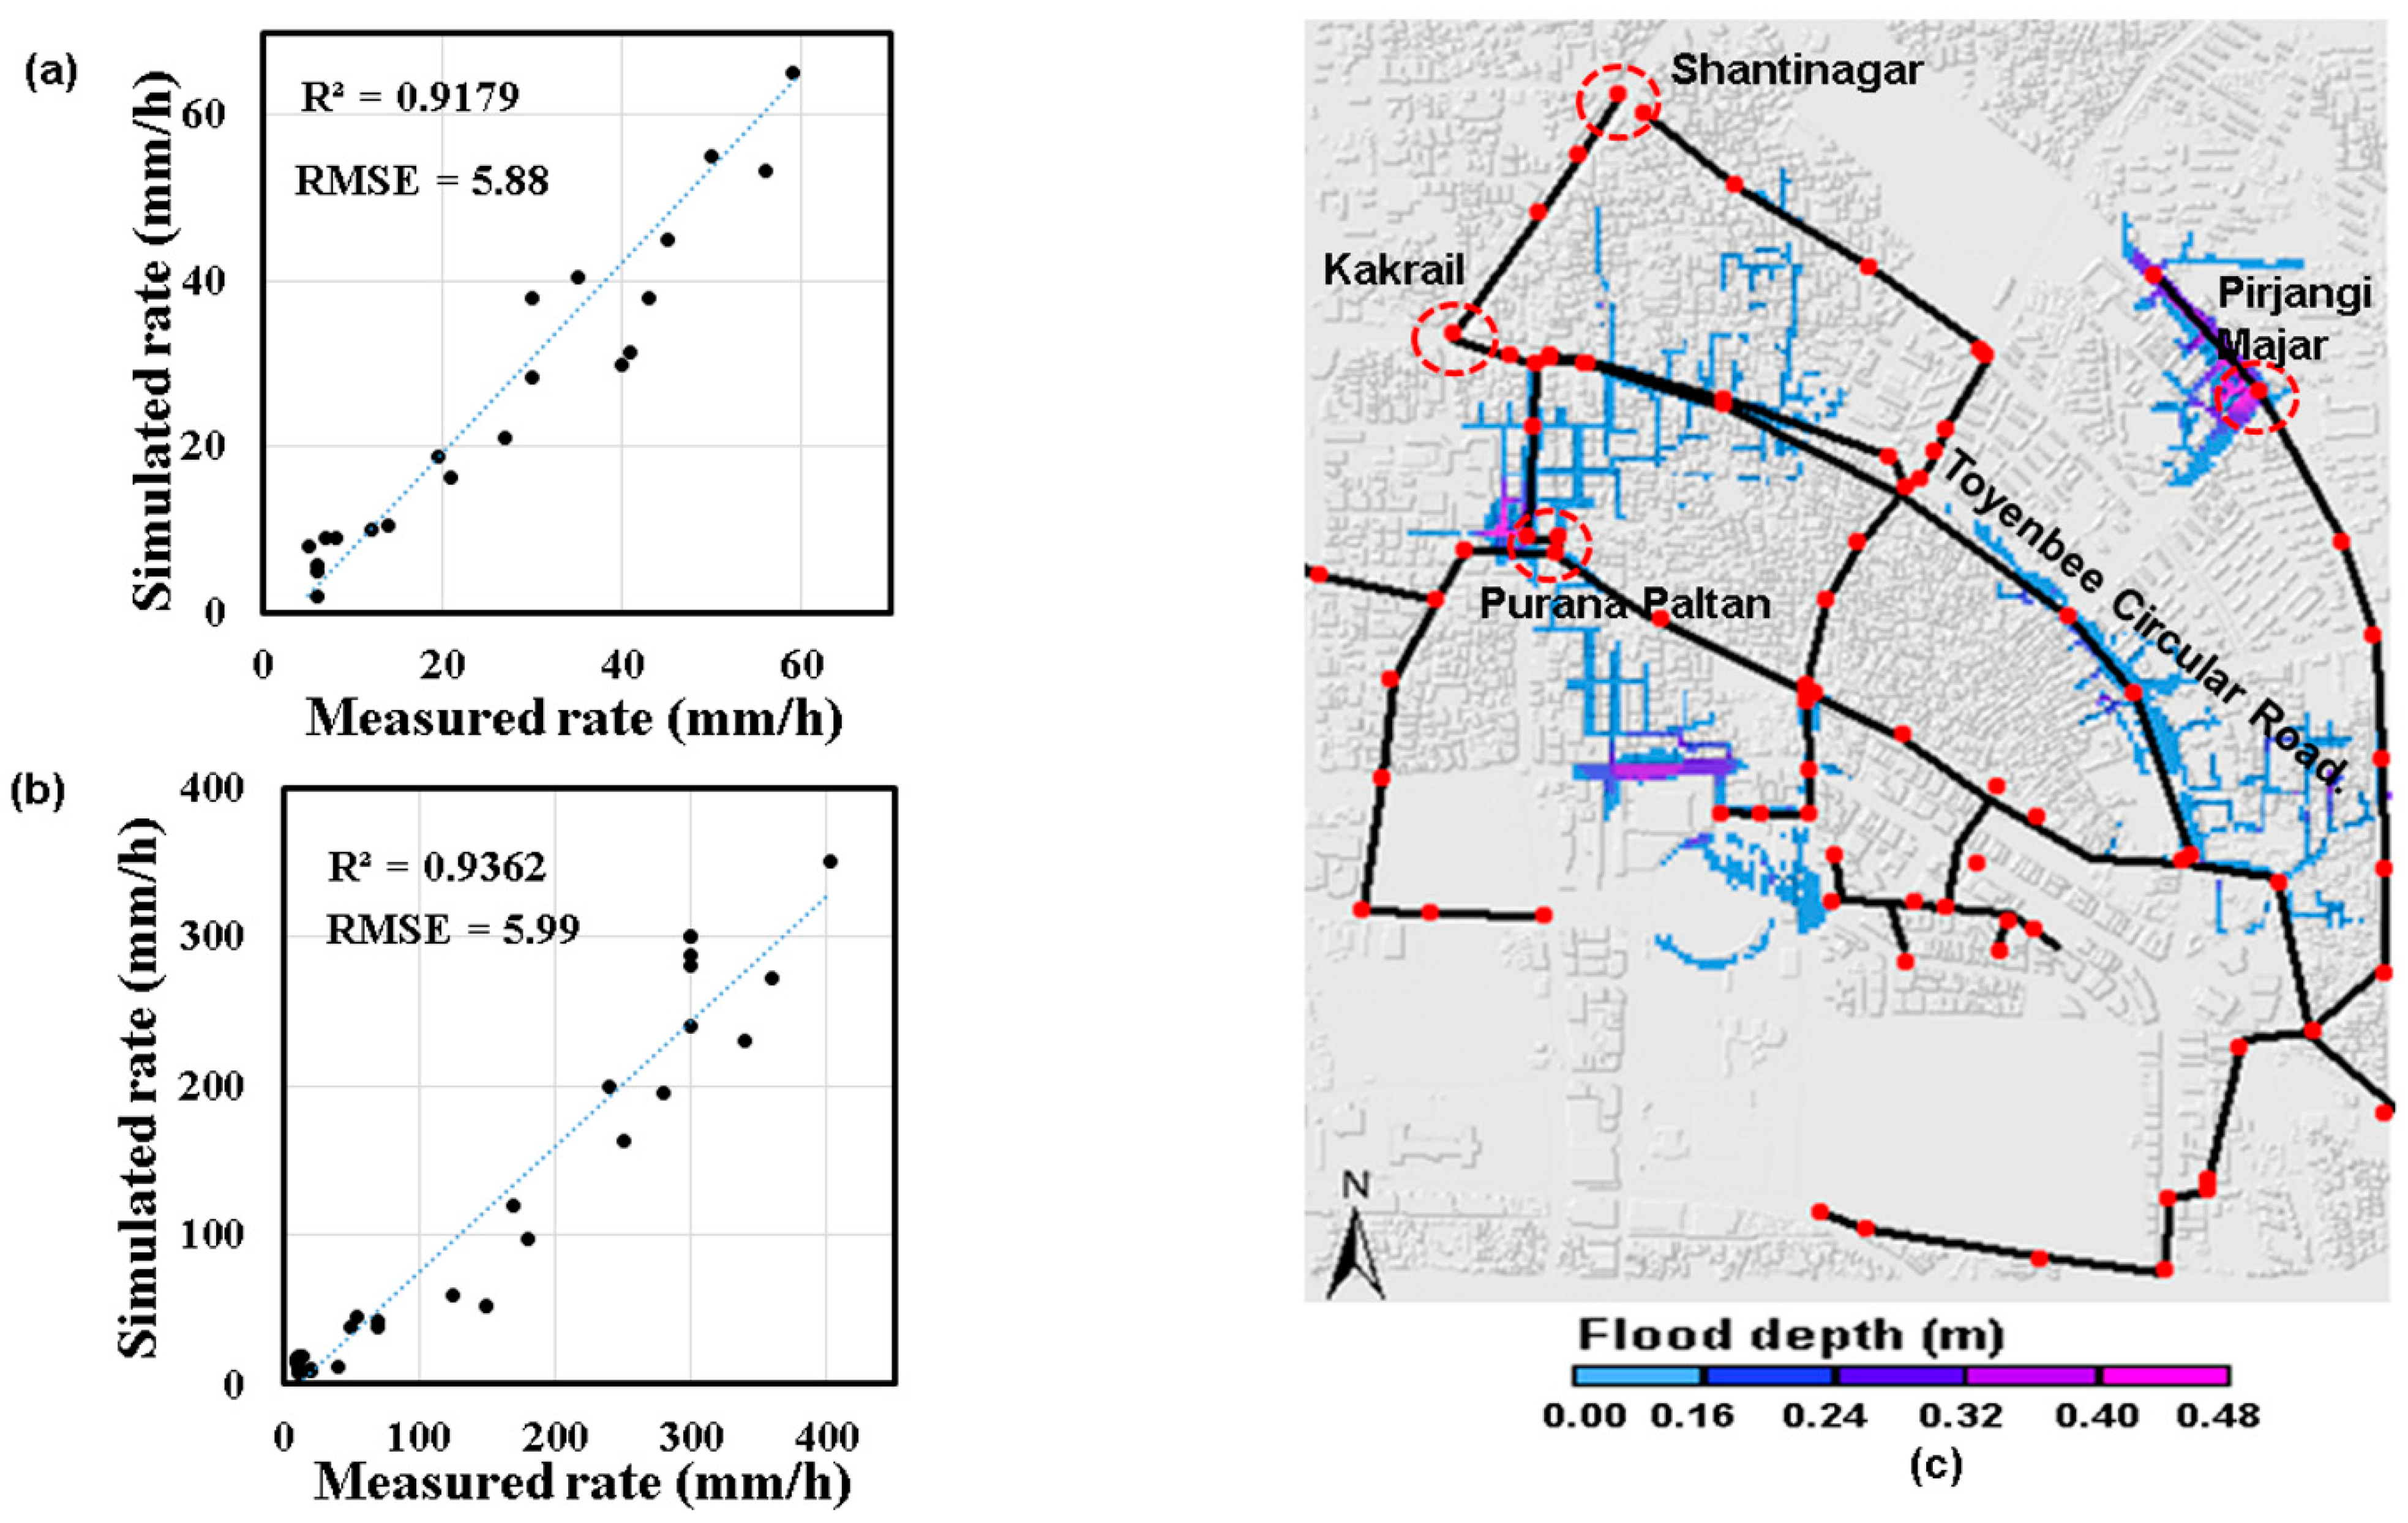
Figure 7a presents a scatter plot with the simulated infiltration rate in mm/h for a clay soil compared to the field records presented in [54]. Similarly, Figure 7b shows the simulated infiltration rate in mm/h for a sandy soil compared to the measured infiltration rates. Figure 7c shows a flood depth map of the case study without implementing any infrastructure. Damage and investment costs were also computed within this approach and compared with those obtained in Section 4.1 and Section 4.2. In the absence of field records, the coupled SWMM/Surf-2D model results in terms of flood depth were found to be similar to those obtained in previous studies in [30,56,57].
Table 2 presents a summary of the initial damage cost without implementing solutions and the related green-grey infrastructure performance.
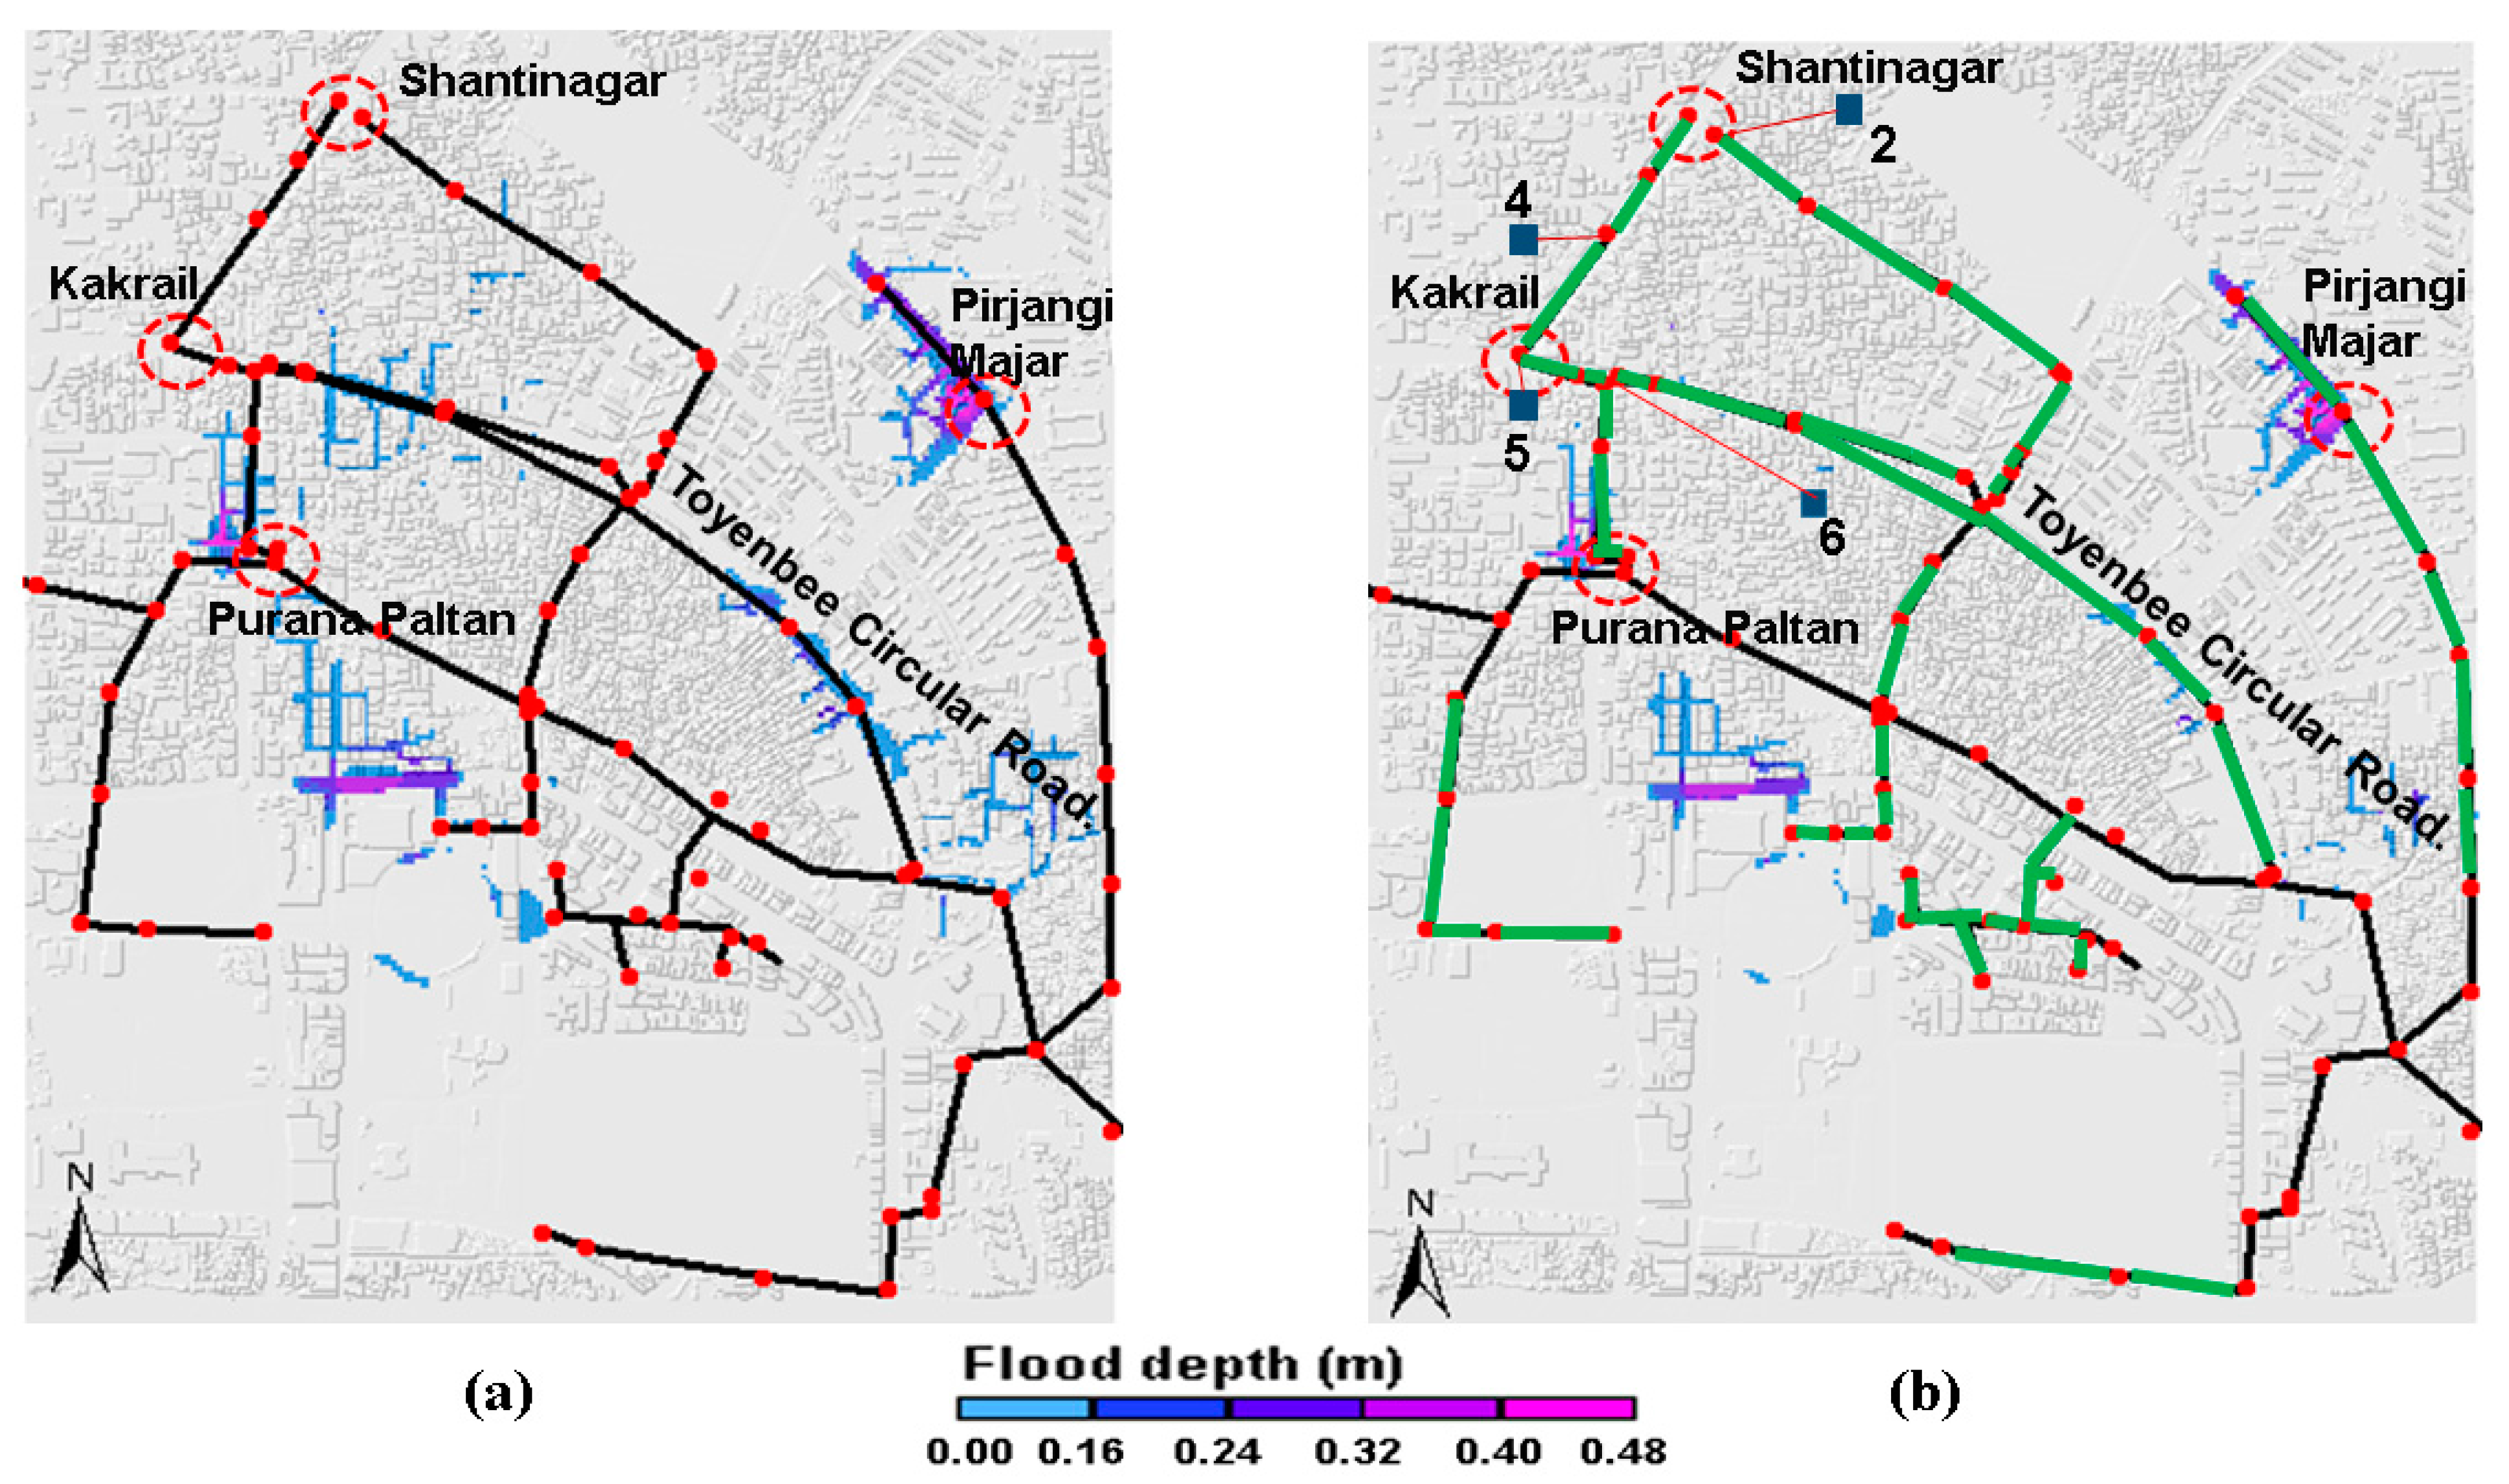
Figure 8a shows a flood depth map with the model simulation of the optimal green infrastructure represented in the Surf-2D model and its connection with the sewer network. To be able to represent this, the optimal percentage of impervious areas to be treated obtained from optimal solution s1 were used to assign a specific hydraulic conductivity (ke) of the soil (i.e., ke value assigned for each grid cell). Figure 8b presents a flood depth map of the optimal combination of green-grey infrastructures.
5. Discussion
The results show a maximum damage cost of $2.35 million generated by implementing green infrastructure (see Figure 4a). With green infrastructure it is possible to further minimize damage cost to 65% (line A) with solution s1 ($1.8 million) by investing $3 million. However, flood damage is not reduced to zero and, despite more than $3 million of investment, the damage cost reduction is not noticeable (line B). The optimal number of pieces of green infrastructures was found to be 86, consisting of 39 bio-retention cells, 31 infiltration trenches, 15 vegetative swales, and 1 porous pavement (Figure 4b). Green infrastructure types such as infiltration trenches and bio-retention cells present the largest number of practices. A larger number of these practices would have an effect on reducing flood damage when compared to vegetative swales and porous pavements (Figure 4c).
Grey infrastructure can reduce damage cost to zero for different levels of investment (Figure 5a). A maximum damage cost of $1.5 million is achieved compared to that obtained with GI ($ 2.35 million). It can be observed that for total protection against flood damage, an investment of between $2.7 and $3.0 million needs to be made. For comparison purposes, similarly to the GI, a non-zero damage solution was selected. Solution s2 reduces damage to 70% with an investment of $2.7 million. The analysis from the non-dominated solutions (Figure 5b) shows that optimal solution s2 suggests the implementation of seven storage tanks, numbers 2, 3, 4, 5, 6, 7, and 8, and the replacement of 48 pipe diameters. This would reduce flood damage to $1.1 million.
The surface runoff achieved with the surrogate model (unit hydrograph method) is in good agreement with the nonlinear reservoir method that uses SWMM (Figure 6). However, there is a slight difference in the peak discharge because the hydrological analysis for runoff formation performed by each method is different. Runoff values obtained with the surrogate model are approximately 6% higher compared with the nonlinear method, and NB infiltration losses in the surrogate model are not as infiltration is computed with the 2D algorithm in the Surf-2D model. The nonlinear method computes runoff with both initial and infiltration losses.
In general, the simulated infiltration rates are consistent with those measured as the coefficient of determination (R2) found was 0.91 and a RMSE of 5.88 mm h−1 for a clay soil (Figure 7a) and R2 = 0.93 and a RMSE = 5.99 mm h−1 for a sandy soil (Figure 7b). Simulation results show the considerable hydraulic surcharge in the system that leads to flooding (Figure 7c). The impact of rainfall runoff and infiltration in the 2D domain is also presented. For instance, average flood depths from 0.1 m to 0.23 m were found in Purana Paltan and from 0.17 m to 0.28 m in Pirjangi Majar. Similarly, average flood depths were observed from 0.1 m to 0.3 m in Toyenbee Circular Road.
The estimated maximum damage costs (without infrastructure) including rainfall-runoff and infiltration computation calculated in the Surf-2D were found to be $4.0 million (see Table 2). Results for this study also indicate that there could be an overestimation of approximately 23% ($5.2 million) if computing damage cost taking into account flooding in each particular node of the sewer network (the 1D approach). Similarly, there could be an underestimation of approximately 7.5% ($3.7 million) if damage cost is calculated with the entire catchment hydrology simulated within the 1D sewer network (the 1D/2D approach).
A reduction in flood depths and flood extent was observed (Figure 8a). The inclusion of the infiltration process in the Surf-2D model reduced the flood depth values. The impact of representing green infrastructure in the 2D domain was noticed in the Kakrail, Pirjangi Majar, and Purana Paltan regions as well as in Toyenbee Circular Road. However, a flood depth reduction to zero was not obtained. This is due to the optimal percentage of the area treated available in the entire catchment for each GI practice being less than 8% (i.e., GI practice represented in 2D domain as percentage of area treated). This means that for approximately 400 hectares (ha), the catchment has only 28 ha that can be treated with green infrastructure.
With the optimal green infrastructure represented in the 2D domain (solution s1), the calculated damage cost including rainfall-runoff, the infiltration computation included in the Surf-2D, and its connection with the sewer network, were found to be $1.4 million (see the summary in Table 2). This value is 22% less than the damage cost value originally obtained from the selected solution s1 ($1.8 million) shown in Figure 4. The investment cost computed for this solution was $3 million (see the summary in Table 2).
Green measures from solution s1 were represented in the 2D domain as previously explained while grey measures (solution s2) were implemented in the 1D sewer model, as explained in Section 3.2. In general, a reduction in flood depths and flood extent is observed (Figure 8b). The impact of the combined green-grey infrastructures is also shown. In the Kakrail, Pirjangi Majar, and Purana Paltan regions, a flood-depth reduction to zero was achieved in some places. This impact can be due to the assigned hydraulic conductivity (ke) of the soil for each grid cell in these regions according to the values obtained for clay and sandy soils in the eastern part of Dhaka City [54].
With the implementation of green infrastructure in the catchment, and it being represented in a 2D domain, it is no longer necessary to site storage tanks numbers 3, 7, and 8 (Figure 8b), despite the initial suggestion of optimal solution s2 (Figure 5b). This is because, for this component, the 1D sewer model does not initially have water to simulate the overland flow draining back to the system so these tanks are not filled with stormwater throughout the simulation.
With the optimal combinations of green-grey infrastructures (solutions s1 + s2), the calculated damage cost was found to be $0.97 million for a level of investment equal to $4.4 million (shown also in Table 2). These results show a 75% reduction in damage cost compared to the reduction obtained from implementing only green infrastructure (65%). However, although $4.4 million would need to be invested to address the damage of $4.0 million, the considerable multiple additional benefits that green infrastructures offer, such as water quality enhancement (due to runoff filtration and groundwater recharge), recreation, enhanced liveability, and direct traffic, among others, should also be taken into account so that this combined solution is, nevertheless, selected.
The abovementioned results show that for some cases the differences between flood extent, flood depths, and damage cost estimation from different approaches can be significant. Hence, this model-based assessment based on rainfall-runoff and infiltration computation calculated in the proposed Surf-2D model and its connection with the sewer network is closer to real-world physics, and as such it is likely to produce more accurate results.
6. Conclusions
This paper describes a novel model-based framework to evaluate optimal combinations of green-grey infrastructures for urban flood reduction. The assessment includes the performance of these solutions when dealing with a minimization of investment costs and direct flood damage. Three modelling components have been developed to form the structure of the framework. The first component provides the optimal number of pieces of green infrastructure (GI) allocated in the catchment. The second component provides optimal grey infrastructure such as pipe and storage tank sizing. The third component evaluates the selected optimal combinations of green-grey infrastructures based on rainfall-runoff and infiltration computation included in the proposed Surf-2D model. The potential of this model-based assessment has been demonstrated in the real-life case study of Dhaka City (Bangladesh), where different green and grey infrastructures were evaluated in relation to investment and flood damage costs.
The results obtained demonstrate in quantitative terms how the performance analysis of green-grey infrastructure for flood mitigation can be improved substantially through this proposed model-based assessment. When including rainfall-runoff and infiltration processes within a 2D model domain, along with its connection with a sewer system, the damage cost results differ from the other approaches presented. In the case analyzed here, there could be an overestimation of this cost (approximately 23%) if green infrastructure is fully represented in a 1D modelling approach. Similarly, there could be an underestimation even if the overland flow is taken into consideration but the catchment hydrology is entirely computed in a 1D domain (approximately 8%). Thus, the direct impact of rainfall-runoff and infiltration enable real-world physics to be reproduced when identifying the best green-grey solutions to improve urban flood risk management.
A combination of green-grey solutions has been shown to be the best course to follow. This combination shows a better damage cost reduction compared to the value obtained from only implementing green infrastructure (GI). GI practices were represented in this case using a specific hydraulic conductivity (ke) of the soil and assigned to each grid cell depending on its land use type. Even though it is beyond the scope of this study, multiple benefits of green and grey solutions should be assessed, especially where there are space limitations, as is the case here. Similarly, uncertainty associated with the optimal solution results should also be addressed.
Author Contributions
Conceptualization: C.M., Z.V., A.S.; methodology: C.M., Z.V., A.S.; software: C.M., A.S.; validation: C.M., A.S.; formal analysis: C.M., A.S., Z.V.; investigation: C.M., A.S.; resources: C.M., Z.V., A.S.; data curation: C.M., A.S.; writing—original draft preparation: C.M., A.S.; —review and editing: A.S., Z.V.; visualization: C.M.; supervision: A.S., Z.V.; All authors have read and agreed to the published version of the manuscript.
Funding
This work received partial funding from the European Union Seventh Framework Programme under Grant agreement No. 603663 for the research project PEARL. The research leading to these results was supported by the Administrative Department of Science, Technology and Innovation, COLCIENCIAS under Grant N.568 of 2012 and the Advanced Training Program for Teaching and Research of the Universidad del Magdalena—Colombia awarded to the first author.
Acknowledgments
The authors would also like to thank the UK Environmental Agency for the EA benchmark dataset.
Conflicts of Interest
The authors declare no conflict of interest. The funders had no role in the design of the study; in the collection, analyses, or interpretation of data; in the writing of the manuscript, or in the decision to publish the results.
References
- Environment Agency. Using Science to Create a better place. Cost-benefit of SUDS in Urban Areas; Science Report—SC060024 Report Version 1.0; Environmental Agency: Bristol, UK, 2013.
- Ashley, R.; Blecken, G.; Bacchin, T. Attractive and Innovative Socio-Technical Solutions: Green Infrastructure Brings Multifunctional Values to Urban Citizens. Green/Blue Infrastructure for Sustainable, Attractive Cities. Deliverable Report. 2014. Available online: https://climate-adapt.eea.europa.eu/metadata/projects/green-blue-infrastructure-for-sustainable-attractive-cities (accessed on 19 July 2021).
- Staddon, C.; de Vito, L.; Zuniga-Teran, A.; Schoeman, Y.; Hart, A.; Booth, G. Contributions of green infrastructure to enhancing urban resilience. Environ. Syst. Decis. 2018, 38, 330–338. [Google Scholar] [CrossRef] [Green Version]
- Alves, A.; Patiño Gómez, J.; Vojinovic, Z.; Sanchez, A.; Weesakul, S. Combining Co-benefits and stakeholders perceptions into Green-blue infrastructure selection for flood risk reduction. Environments 2018, 5, 29. [Google Scholar] [CrossRef] [Green Version]
- Cohen, J.P.; Field, R.; Tafuri, A.N.; Ports, M.A. Cost Comparison of Conventional Gray Combined Sewer Overflow Control Infrastructure versus a Green/Gray Combination. J. Irrig. Drain. Eng. 2011, 138, 534–540. [Google Scholar] [CrossRef]
- Dong, X.; Guo, H.; Zeng, S. Enhancing future resilience in urban drainage system: Green versus grey infrastructure. Water Res. 2017. [Google Scholar] [CrossRef]
- Thorne, C.; Lawson, E.; Ozawa, C.; Hamlin, S.; Smith, L. Overcoming uncertainty and barriers to adoption of Blue-Green infrastructure for urban flood risk management. J. Flood Risk Manag. 2015, 11 (Suppl. 2), S555–S1136. [Google Scholar] [CrossRef]
- Onuma, A.; Tsuge, T. Comparing green infrastructure as ecosystem-based disaster risk reduction with gray infrastructure in terms of costs and benefits under uncertainty: A theoretical approach. Int. J. Disaster Risk Reduct. 2018, 22–28. [Google Scholar] [CrossRef]
- Shubert, J.; Burns, M.; Fletcher, T.; Sanders, B. A framework for the case-specific assessment of green infrastructure in mitigating urban flood hazards. Adv. Water Resour. 2017, 55–68. [Google Scholar] [CrossRef]
- Joyce, J.; Chang, N.; Harji, R.; Ruppert, T.; Imen, S. Developing a multi-scale modelling system for resilience assessment of green-grey drainage infrastructure under climate change and sea level rise impact. Environ. Model. Softw. 2017, 90, 1–26. [Google Scholar] [CrossRef]
- De Caro, M.; Crosta, G.; Previati, A. Modelling the interference of underground structures with groundwater flow and remedial solutions in Milan. Eng. Geol. 2020, 272, 105652. [Google Scholar] [CrossRef]
- Li, J.; Wang, Y.; Ni, Z.; Chen, S.; Xia, B. An integrated strategy to improve the microclimate regulation of green-blue-grey infrastructure in specific urban forms. J. Clean. Prod. 2020, 271, 122555. [Google Scholar] [CrossRef]
- Ferrano, D.; Costabile, P.; Costanzo, C.; Petaccia, G.; Macchione, F. A spectral analysis approach for the a priori generation of computational grids in the 2-D hydrodynamic-based runoff simulations at a basin scale. J. Hydrol. 2020, 582, 124508. [Google Scholar] [CrossRef]
- Costabile, P.; Costanzo, C.; Ferrano, D.; Macchione, F.; Petaccia, G. Performances of the New HEC-RAS version 5 for 2-D hydrodynamic-based Rainfall-runoff simulations at basin scale: Comparison with a state of the art model. Water 2020, 12, 2326. [Google Scholar] [CrossRef]
- Webber, J.; Fu, G.; Butler, D. Rapid surface water intervention performance comparison for urban planning. Water Sci. Technol. 2018, 77, 2084–2092. [Google Scholar] [CrossRef] [PubMed]
- Tügel, F.; Özgen-Xian, I.; Marafini, E.; Hadidi, A.; Hinkelmann, R. Flash flood simulations for an Egyptian city—mitigation measures and impact of infiltration. Urban Water J. 2020, 17, 1–11. [Google Scholar] [CrossRef] [Green Version]
- Barreto, W.; Vojinovic, Z.; Price, R.; Solomatine, D. A Multi-Objective Evolutionary Approach for Rehabilitation of Urban Drainage Systems. Water Resour. Plan. Manag. 2010, 136, 547–554. [Google Scholar] [CrossRef]
- Giacomoni, M. Use of Multi-Objective evolutionary algorithm optimization for low impact development placement. In Proceedings of the International Low Impact Development Conference 2015: It Works in All Climates and Soils, Houston, TX, USA, 19–21 January 2015. [Google Scholar] [CrossRef]
- Martínez, C.; Sanchez, A.; Galindo, R.; Mulugeta, A.; Vojinovic, Z.; Galvis, A. Configuring Green Infrastructure for Urban Runoff and Pollutant Reduction Using an Optimal Number of Units. Water 2018, 10, 1528. [Google Scholar] [CrossRef] [Green Version]
- Piscopo, A.; Detenbeck, N.; Stagnitta, T. Incorporating green infrastructure into water management plans using multi-objective optimization. In Proceedings of the 9th International Congress on Environmental Modelling and Software, Ft. Collins, CO, USA, 24 June 2018. [Google Scholar]
- Labib, S. Investigation of the likelihood of green infrastructure (GI) enhancement along linear waterways or on derelict sites (DS) using machine learning. Environ. Model. Softw. 2019, 118, 146–165. [Google Scholar] [CrossRef] [Green Version]
- Bakhshipour, A.; Dittmer, U.; Haghighi, A.; Nowak, W. Hybrid green-blue-gray decentralized urban drainage systems design, a simulation-optimization framework. J. Environ. Manag. 2019, 249, 109364. [Google Scholar] [CrossRef]
- Yoon, E.; Kim, B.; Lee, D. Multi-objective planning model for urban greening based on optimization algorithms. Urban For. Urban Green. 2019, 40, 183–194. [Google Scholar] [CrossRef]
- Alves, A.; Gersonius, B.; Kapelan, Z.; Vojinovic, Z.; Sanchez, A. Assessing the Co-benefits of green-blue-grey infrastructure for sustainable urban flood risk management. J. Environ. Manag. 2019, 239, 244–254. [Google Scholar] [CrossRef]
- Alves, A.; Vojinovic, Z.; Kapelan, Z.; Sanchez, A.; Gersonius, B. Exploring trade-offs among the multiple benefits of green-blue-grey infrastructure for urban flood mitigation. Sci. Total Environ. 2020, 703, 134980. [Google Scholar] [CrossRef]
- Ferranti, E.; Jaluzot, A. Using the business model Canvas to increase the impact of green infrastructure valuation tools. Urban For. Urban Green. 2020, 54, 126776. [Google Scholar] [CrossRef]
- Adeogun, A.; Daramola, M.; Pathirana, A. Coupled 1D-2D hydrodynamic inundation model for sewer overflow: Influence of modelling parameters. Water Sci. 2015, 29, 146–155. [Google Scholar] [CrossRef] [Green Version]
- Salvan, L.; Abily, M.; Gourbesville, P.; Schoorens, J. Drainage system and detailed urban topography: Towards operational 1D-2D modelling for stormwater management. In Proceedings of the 12th International Conference on Hydroinformatics, Incheon, Korea, 21–26 August 2016. [Google Scholar] [CrossRef] [Green Version]
- Noh, S.; Lee, J.; Lee, S.; Kawaike, K.; Seo, D. Hyper-resolution 1D-2D urban flood modelling using LiDAR data and hybrid parallelization. Environ. Model. Soft. 2018, 103, 131–145. [Google Scholar] [CrossRef]
- Martínez, C.; Sanchez, A.; Toloh, B.; Vojinovic, Z. Multi-objective evaluation of urban drainage networks using a 1D/2D flood inundation model. Water Resour. Manag. 2018, 32, 4329–4343. [Google Scholar] [CrossRef]
- Yin, D.; Evans, B.; Wang, Q.; Chen, Z.; Jia, H.; Chen, A.; Fu, G. Integrated 1D and 2D model for better assessing runoff quantity control of low impact development facilities on community scale. Sci. Total Environ. 2020, 720, 137630. [Google Scholar] [CrossRef] [PubMed]
- Li, Q.; Liang, Q.; Xia, X. A novel 1D-2D coupled model for hydrodynamic simulation of flows in drainage networks. Adv. Water Resour. 2020, 137, 103519. [Google Scholar] [CrossRef]
- Jang, J.; Chang, T.; Chen, W. Effect of inlet modelling on surface drainage in coupled urban flood simulation. J. Hydrol. 2018, 562, 168–180. [Google Scholar] [CrossRef]
- Leng, L.; Mao, X.; Jia, H.; Xu, T.; Chen, A.; Yin, D.; Fu, G. Performance assessment of coupled green-grey-blue systems for sponge city construction. Sci. Total Environ. 2020, 728, 138608. [Google Scholar] [CrossRef]
- Chen, W.; Wang, W.; Huang, G.; Wang, Z.; Lai, C.; Yang, Z. The capacity of grey infrastructure in urban flood management: A comprehensive analysis of grey infrastructure and the green-grey approach. Int. J. Disaster Risk Reduct. 2021, 54, 102045. [Google Scholar] [CrossRef]
- Gallo, E.; Bell, C.; Panos, C.; Smith, S.; Hogue, T. Investigating trade-offs of Green to grey stormwater Infrastructure using a planning-level decision support tool. Water 2020, 12, 2005. [Google Scholar] [CrossRef]
- Leon, K.; Richard, F. Integrating blue-green and grey infrastructure through an adaptation pathways approach to surface water flooding. Phil. Trans. R. Soc. A 2020, 378, 20190204. [Google Scholar]
- Ahmed, F. Urban Flood, Its Effects and Management Options: A Case Study of Dhaka City. Master’s Thesis, UNESCO-IHE Institute for Water Education, Delft, The Netherlands, 2008. [Google Scholar]
- Deb, K.; Pratap, A.; Agarwall, A.; Meyarivan, T. A Fast and Elitist Multi-Objective Genetic Algorithm. IEEE Trans. Evol. Comput. 2002, 6, 182–197. [Google Scholar] [CrossRef] [Green Version]
- Rossman, L. Storm Water Management Model Reference Manual Volume II—Hydraulics; EPA/600/R-17/111; U.S. Environmental Protection Agency: Washington, DC, USA, 2017.
- Shoemaker, L.; Riverson, J.; Alvi, K.; Zhen, J.; Paul, S.; Rafi, T. SUSTAIN—A Framework for Placement of Best Management Practices in Urban Watersheds to Protect Water Quality; EPA/600/R-09/095; National Risk Management Research Laboratory Office of Research and Development U.S. Environmental Protection Agency: Cincinnati, OH, USA, 2013.
- Seyoum, S.; Vojinovic, Z.; Price, R.; Weesakul, S. A coupled 1D and non-inertia 2D flood inundation model for simulation of urban flooding. ASCE J. Hydraul. Eng. 2012, 138, 23–34. [Google Scholar] [CrossRef]
- Islam, K. Flood Loss Potentials in Non-Agricultural Sectors, Assessment Methods and Standard Loss Database for Bangladesh; Palak Publishers: Dhaka, Bangladesh, 2005. [Google Scholar]
- Dutta, D.; Herath, S.; Musiake, K. Direct flood damage modeling towards urban flood risk management. In Joint Workshop on Urban Safety Engineering; International Center for Urban Safety Engineering (ICUS/INCEDE), IIS, University of Tokyo: Tokyo, Japan, 2001; pp. 128–143. [Google Scholar]
- Yu, D.; Lane, S. Urban fluvial flood modelling using a two-dimensional diffusion wave treatment, part 1: Mesh resolution effects. Hydrol. Process. 2006, 20, 1541–1565. [Google Scholar] [CrossRef]
- SCS, Soil Conservation Service. Design of Hydrograph; US Department of Agriculture: Washington, DC, USA, 2002.
- Rammal, M.; Berthier, E. Runoff losses on urban surfaces during frequent rainfall events: A review of observations and modelling attempts. Water 2020, 12, 2777. [Google Scholar] [CrossRef]
- Chow, V.T. Applied Hydrology; McGraw-Hill Inc.: New York, NY, USA, 1988. [Google Scholar]
- Delestre, O.; Darboux, F.; James, F.; Lucas, C.; Laguerre, C.; Cordier, S. FullSWOF: Full Shallow-Water equations for overland flow. J. Open Source Softw. 2018, 2, 448–486. [Google Scholar] [CrossRef] [Green Version]
- Stone, J.; Hawkins, R.; Shirley, E. Approximate form of Green-Ampt infiltration equation. J. Irrig. Drain Eng. 1994, 120, 128–137. [Google Scholar] [CrossRef]
- Green, W.; Ampt, G. Studies on soil physics: 1. Flow of air and water through soils. J. Agric. Sci. 1911, 4, 1–24. [Google Scholar]
- Mein, R.; Larson, C. Modelling infiltration during a steady rain. Water Resour. Res. 1973, 9, 384–394. [Google Scholar] [CrossRef] [Green Version]
- Leandro, J.; Martins, R. A methodology for linking 2D overland flow models with the sewer network model SWMM 5.1 based on dynamic link libraries. Water Sci. Eng. 2016, 73, 3017–3026. [Google Scholar] [CrossRef] [PubMed]
- Uddin, Z. Impact of Urbanization on Hydrological Processes: A Case Study in the Eastern Part of Dhaka City; Institute of Water and Flood Management, Bangladesh University of Engineering and Technology: Dhaka, Bangladesh, 2014. [Google Scholar]
- Rawls, W.; Brakensiek, D.; Miller, N. Green-Ampt infiltration parameters from soils data. J. Hydraul. Eng. 1983, 109, 62–70. [Google Scholar] [CrossRef] [Green Version]
- Seyoum, S. Framework for Dynamic Modelling of Urban Floods at Different Topographical Resolutions; CRC Press, Taylor & Francis Group: Leiden, The Netherlands, 2013; ISBN 978-1-138-00048-3. [Google Scholar]
- Vojinovic, Z.; Sahlu, S.; Sanchez, A.; Seyoum, S.; Anvarifar, F.; Matungulu, H.; Barreto, W.; Savic, D.; Kapelan, Z. Multi-objective rehabilitation of urban drainage systems under uncertainties. J. Hydroinform. 2014, 16, 1044–1061. [Google Scholar] [CrossRef]
Figure 1.
Segunbagicha urban catchment, Dhaka: (a) land use type and (b) drainage layout.

Figure 2.
Structure of the proposed multi-objective model-based assessment.

Figure 3.
Green infrastructure for the Segunbagicha catchment in Dhaka showing the maximum possible number of practices in each subcatchment: bio-retention cells (BR); infiltration trench (IT); vegetative swale (VS); and porous pavement (PP).
Figure 3.
Green infrastructure for the Segunbagicha catchment in Dhaka showing the maximum possible number of practices in each subcatchment: bio-retention cells (BR); infiltration trench (IT); vegetative swale (VS); and porous pavement (PP).

Figure 4.
(a) The non-dominated optimal solutions implementing green infrastructure. (b) Optimal number of GI practices associated with solution s1. (c) Optimal number of green infrastructures allocated in the catchment (solution s1).
Figure 4.
(a) The non-dominated optimal solutions implementing green infrastructure. (b) Optimal number of GI practices associated with solution s1. (c) Optimal number of green infrastructures allocated in the catchment (solution s1).

Figure 5.
(a) The non-dominated optimal solutions implementing grey infrastructure. (b) Optimal solution (s2) of grey infrastructure, pipes to be replaced (green lines) and number and location of storage tanks (dark blue squares).
Figure 5.
(a) The non-dominated optimal solutions implementing grey infrastructure. (b) Optimal solution (s2) of grey infrastructure, pipes to be replaced (green lines) and number and location of storage tanks (dark blue squares).

Figure 6.
Comparison between the unit hydrograph and the nonlinear reservoir methods for the case study.
Figure 6.
Comparison between the unit hydrograph and the nonlinear reservoir methods for the case study.

Figure 7.
(a) Simulated infiltration rates vs. measured infiltration rates for a clay soil; (b) simulated infiltration rates vs. measured infiltration rates for a sandy soil; and (c) flood depth map without implementing infrastructure.
Figure 7.
(a) Simulated infiltration rates vs. measured infiltration rates for a clay soil; (b) simulated infiltration rates vs. measured infiltration rates for a sandy soil; and (c) flood depth map without implementing infrastructure.

Figure 8.
Flood depth maps with (a) the optimal green infrastructure represented in the Surf-2D model, hydraulic conductivity (ke) assigned for each grid cell, and (b) the optimal combination of green-grey infrastructures, pipes to be replaced (green line) and location of storage tanks (dark blue squares).


| Soil Type | Ψ (mm) | ||
|---|---|---|---|
| Clay | 0.3–1.0 | 50 | 0.38 |
| Sandy | 10.9–117.8 | 49.5 | 0.41 |
Table 2.
Summary of the green-grey infrastructure performance.
| Modelling Approach | Initial Damage Cost (Max.) without Infrastructure ($ Million Dollars) | Infrastructure Type | Maximum Investment Cost of Infrastructure ($ Million Dollars) | Selected Optimal Solution | Damage Cost ($ Million Dollars) | Investment Cost ($ Million Dollars) |
|---|---|---|---|---|---|---|
| 1D | 5.2 | Green | 10 | s1 | 1.8 | 3.0 |
| 1D/2D (1) | 3.7 | Grey | 22.3 | s2 | 1.1 | 2.5 |
| 1D/2D (2) | 4.0 | Green | 10 | s1 (3) | 1.4 | 3.0 |
| 1D/2D (2) | 4.0 | Green-grey | 32.3 | s1(3) + s2 | 0.97 | 4.4 |
(1) Computed with the entire catchment hydrology simulated within the 1D sewer network. (2) Computed with rainfall-runoff and infiltration process on the overland flow and its connection with a sewer system. (3) Green infrastructure represented in the Surf-2D model using the percentage of impervious areas to be treated.
Publisher’s Note: MDPI stays neutral with regard to jurisdictional claims in published maps and institutional affiliations. |
© 2021 by the authors. Licensee MDPI, Basel, Switzerland. This article is an open access article distributed under the terms and conditions of the Creative Commons Attribution (CC BY) license (https://creativecommons.org/licenses/by/4.0/).
Share and Cite
MDPI and ACS Style
Martínez, C.; Vojinovic, Z.; Sanchez, A. Multi-Objective Model-Based Assessment of Green-Grey Infrastructures for Urban Flood Mitigation. Hydrology 2021, 8, 110. https://0-doi-org.brum.beds.ac.uk/10.3390/hydrology8030110
AMA Style
Martínez C, Vojinovic Z, Sanchez A. Multi-Objective Model-Based Assessment of Green-Grey Infrastructures for Urban Flood Mitigation. Hydrology. 2021; 8(3):110. https://0-doi-org.brum.beds.ac.uk/10.3390/hydrology8030110
Chicago/Turabian StyleMartínez, Carlos, Zoran Vojinovic, and Arlex Sanchez. 2021. "Multi-Objective Model-Based Assessment of Green-Grey Infrastructures for Urban Flood Mitigation" Hydrology 8, no. 3: 110. https://0-doi-org.brum.beds.ac.uk/10.3390/hydrology8030110
Note that from the first issue of 2016, this journal uses article numbers instead of page numbers. See further details here.