Article

Long-Term Concentrations and Loads of Four Dissolved Macronutrients from Two Agroforestry Catchments in NW Spain

by
Rosane da Silva Dias
1,
José Manuel Mirás-Avalos
2,* and
Antonio Paz-González
1
1
Centro de Investigaciones Científicas Avanzadas CICA, As Carballeiras, s/n Campus de Elviña, University of Corunna, 15008 Corunna, Spain
2
Unidad de Suelos y Riegos (Asociada a EEAD-CSIC), Centro de Investigación y Tecnología Agroalimentaria de Aragón (CITA), Montañana, 50059 Zaragoza, Spain
*
Author to whom correspondence should be addressed.
Submission received: 25 May 2021 / Revised: 18 June 2021 / Accepted: 24 June 2021 / Published: 26 June 2021

Abstract

:
Understanding hydrological processes controlling stream chemistry and quantifying solute concentrations over time is crucial for estimating future alterations of water quality due to land use or climate change impacts, as well as for setting preventive or remedial actions. In the current study, soluble sodium (Na+), potassium (K+), calcium (Ca2+), and magnesium (Mg2+) concentrations and loads were assessed in waters from two small catchments located at different distances to the sea (9 km Valiñas and 30 km Abelar) in NW Spain from 2003 to 2016. Solute concentrations were determined using spectrometric techniques, while streamflow data were employed for estimating loads. Moreover, concentration-discharge relations were calculated for each solute and catchment. The average concentrations of soluble Na+, K+, Ca2+ and Mg2+ were, respectively, 16.5, 2.6, 7.9 and 4.1 mg L−1 in Valiñas, and 8.2, 0.9, 2.9 and 3.4 mg L−1 in Abelar, although variability among samplings was high. The four soluble ions showed a dilution pattern in Valiñas, whereas in Abelar Na+ tended to a chemostatic behavior and K+ and Ca2+ were positively related to streamflow. In conclusion, the dominant processes controlling these relationships are local and depend on catchment characteristics such as land use (including slurry applications in Abelar), distance to the sea, and vegetation cover.

1. Introduction

Peri-urban catchments are characterized by a wide range of land uses, including agriculture, forestry and recreation, that impact on water quality [1,2]. Moreover, solute concentrations in water depend on catchment characteristics such as climatology, topography, land use, size and bedrock nature [3,4]. In this context, understanding the hydrological processes that control stream chemistry, as well as the sources of chemical inputs, is highly relevant for estimating how changing climate and future land use may affect the chemistry of water bodies [5]. In fact, the material transported with water provides information about residence time, biogeochemical transformations and water sources [6]. Moreover, quantifying solute concentrations over time can allow for the assessment of the anthropogenic impacts on catchments, and help set preventive or remedial actions [7].
Rock weathering and solute transport are linked to hydrology in watersheds and this coupling is reflected in the relationships between stream discharge and solute concentrations [8]. Therefore, the study of concentration-discharge (C-Q) relationships allows for a better understanding of hydrological processes and chemical sources [5,9,10,11]. The C-Q relations are usually linear in a log(C)-log(Q) space [8], thus the empirical relations can be approximated by a power law, C = a × Qb, where a and b are fitting parameters [4,8,11]. In this context, the b exponent is a relevant metric that expresses the slope of the regression in the log(C)-log(Q) plot and is related to the “chemostasis” concept [8]. The three main behaviors–enrichment or removal (i.e. positive slope), chemostatic (i.e. near-zero slope) and dilution (i.e. negative slope)–can be the consequence of mechanisms controlling the runoff formation and the transport processes [4,11].
Land use influences natural phenomena and ecological processes affecting water quality of streams [12], since dissolved solutes can leach by diffusion and reach surface waters. Major basic cations, or macronutrients, such as sodium (Na+), potassium (K+), calcium (Ca2+) and magnesium (Mg2+), are geogenic solutes, originating mainly from rock weathering [11]. Moreover, Na+ concentrations in streams are highly variable due to geological features, residual water discharges and other factors, including proximity to the sea, which increases the concentrations of this ion in the rainwater [13]. However, marine contribution in Na+ deposition predominates only close to the coast in Galicia (northwest Spain) [14]. As a reference, Meybeck and Helmer [1] reported 3.65 mg L−1 of Na+ in unpolluted rivers worldwide. In the case of K+, concentrations in streams are usually below 10 mg L−1, although they can increase by atmospheric deposition, runoff from agricultural lands and irrigation drainage [15]. In fact, the average concentration of this ion in unpolluted rivers worldwide has been reported at 0.12 mg L−1 [1], although it reached 0.5 mg L−1 in the natural waters of Galicia [16]. Bedrock materials and rock weathering processes are the main factors affecting Ca2+ and Mg2+ concentrations in surface waters [17,18]. In unpolluted waters, the average Ca2+ concentration has been reported as 13.4 mg L−1 [1], whereas, due to the prevalence of granite bedrock, the concentration of this solute in Galician waters is lower, 6 mg L−1 [16], although it has been reported to reach 20.7 mg L−1 [19]. Finally, the concentration of Mg2+ in unpolluted waters is 3.1 mg L−1 on average [1], whereas it is 2 mg L−1 in unpolluted Galician streams [16].
Since these solutes are major nutrients for plants, land use might affect their concentrations in surface waters. Specifically, the current study focuses on waters from two catchments located at different distances to the sea (9 km Valiñas and 30 km Abelar) in NW Spain. These sites have contrasting characteristics including land use, size, bedrock materials, distance to the coast and to the main town of the region. This study aimed at: (i) assessing to which extent the concentrations of four macronutrients are influenced by catchment characteristics, especially size and distance to the coast; (ii) exploring the dependence of the concentrations of these solutes on human activities, mainly intensive slurry applications; and (iii) comparing the behaviors of soluble Na+, K+, Ca2+ and Mg2+ concentrations between the two catchments by means of the slope in C-Q relations. We hypothesized that land-use history, especially in the Abelar catchment, where slurry was intensively applied to the soil, might modify not only the concentrations of these four major water-soluble ionic species but also their dynamics, including the C-Q relations.

2. Materials and Methods
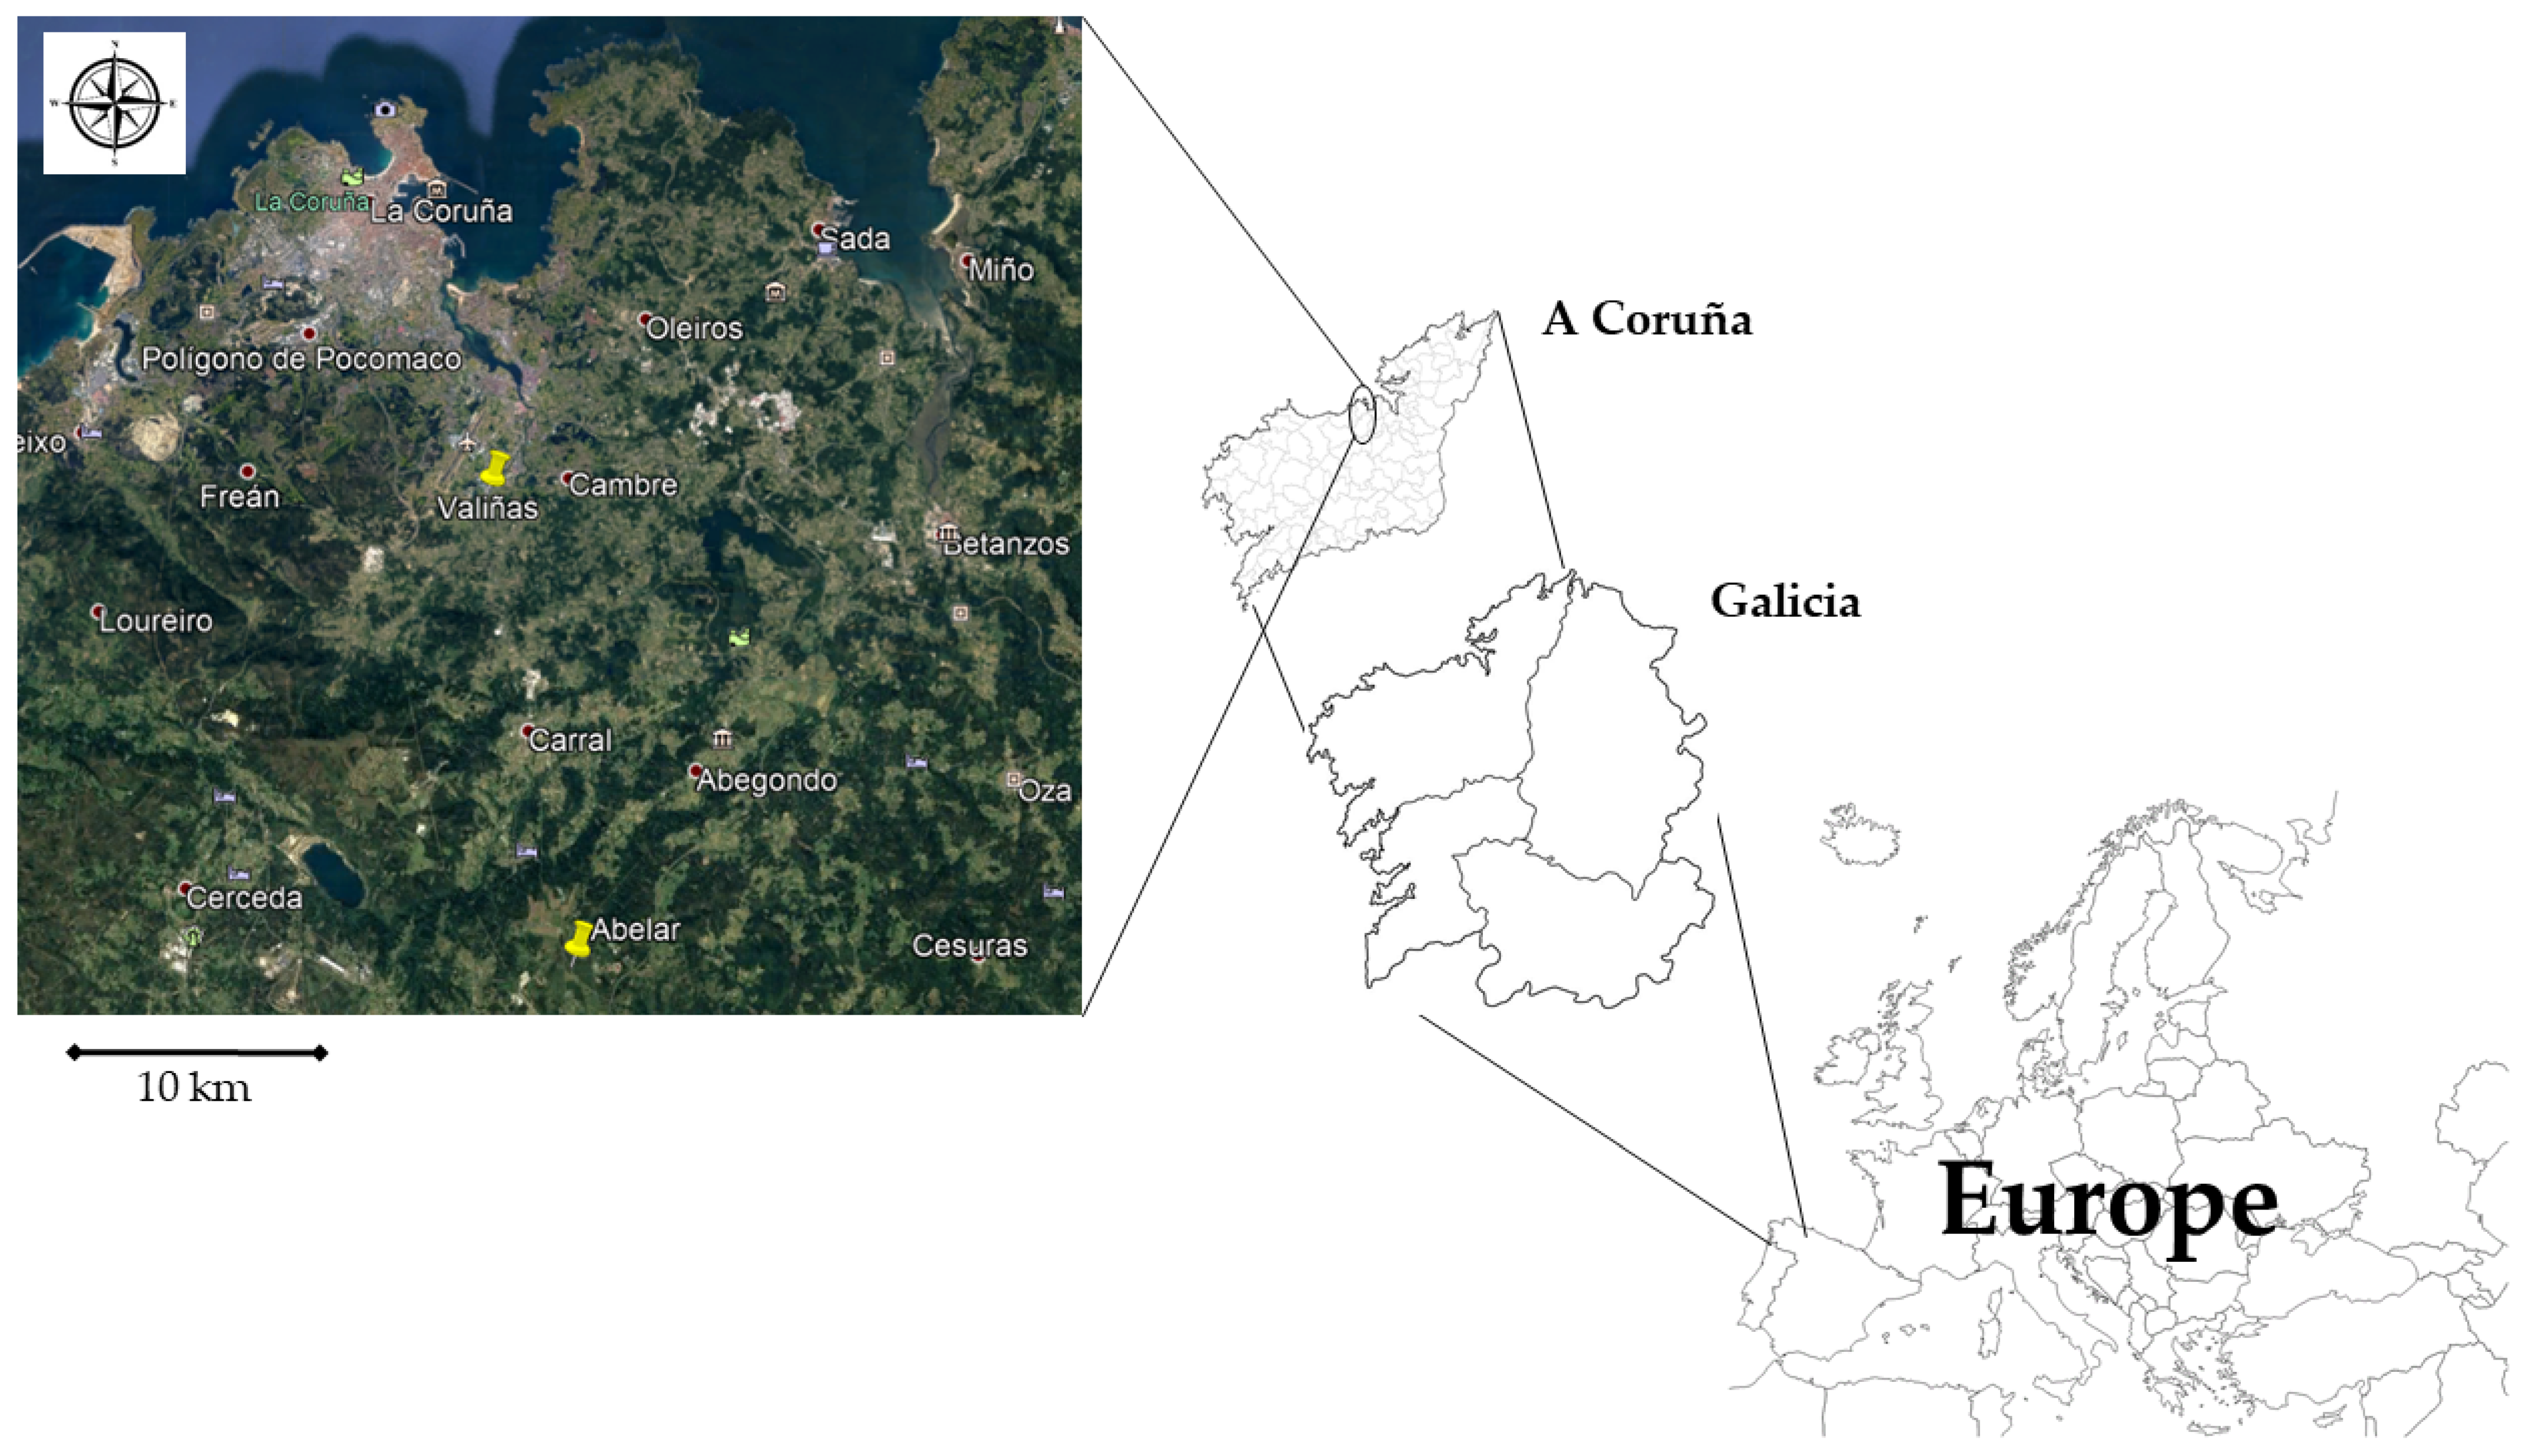
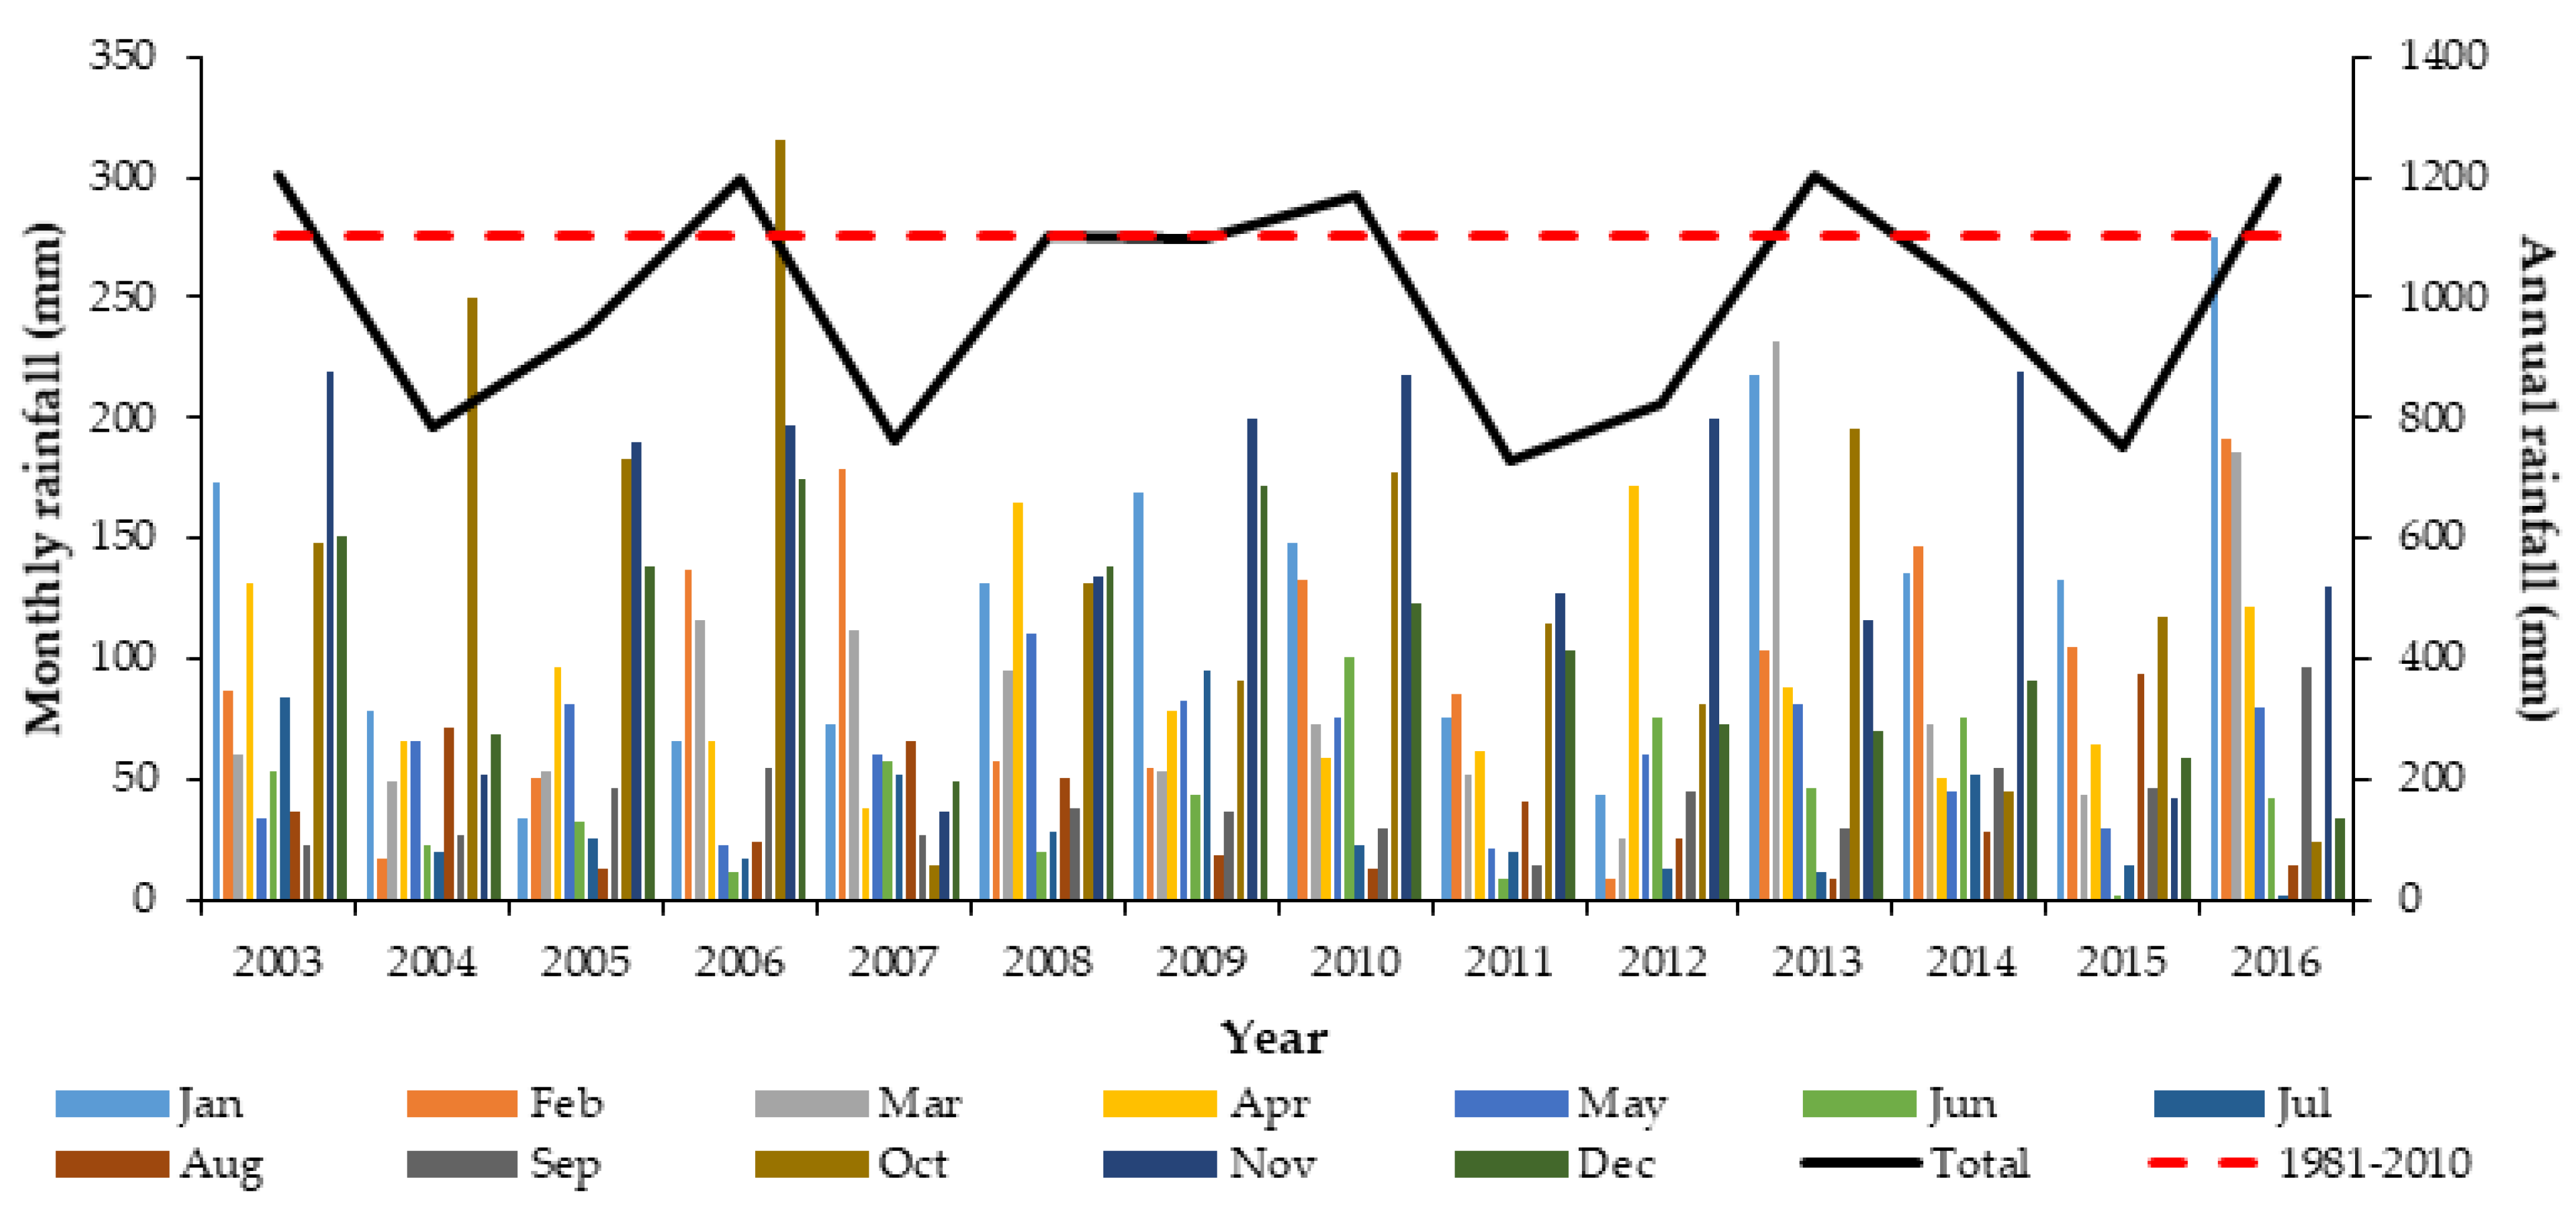
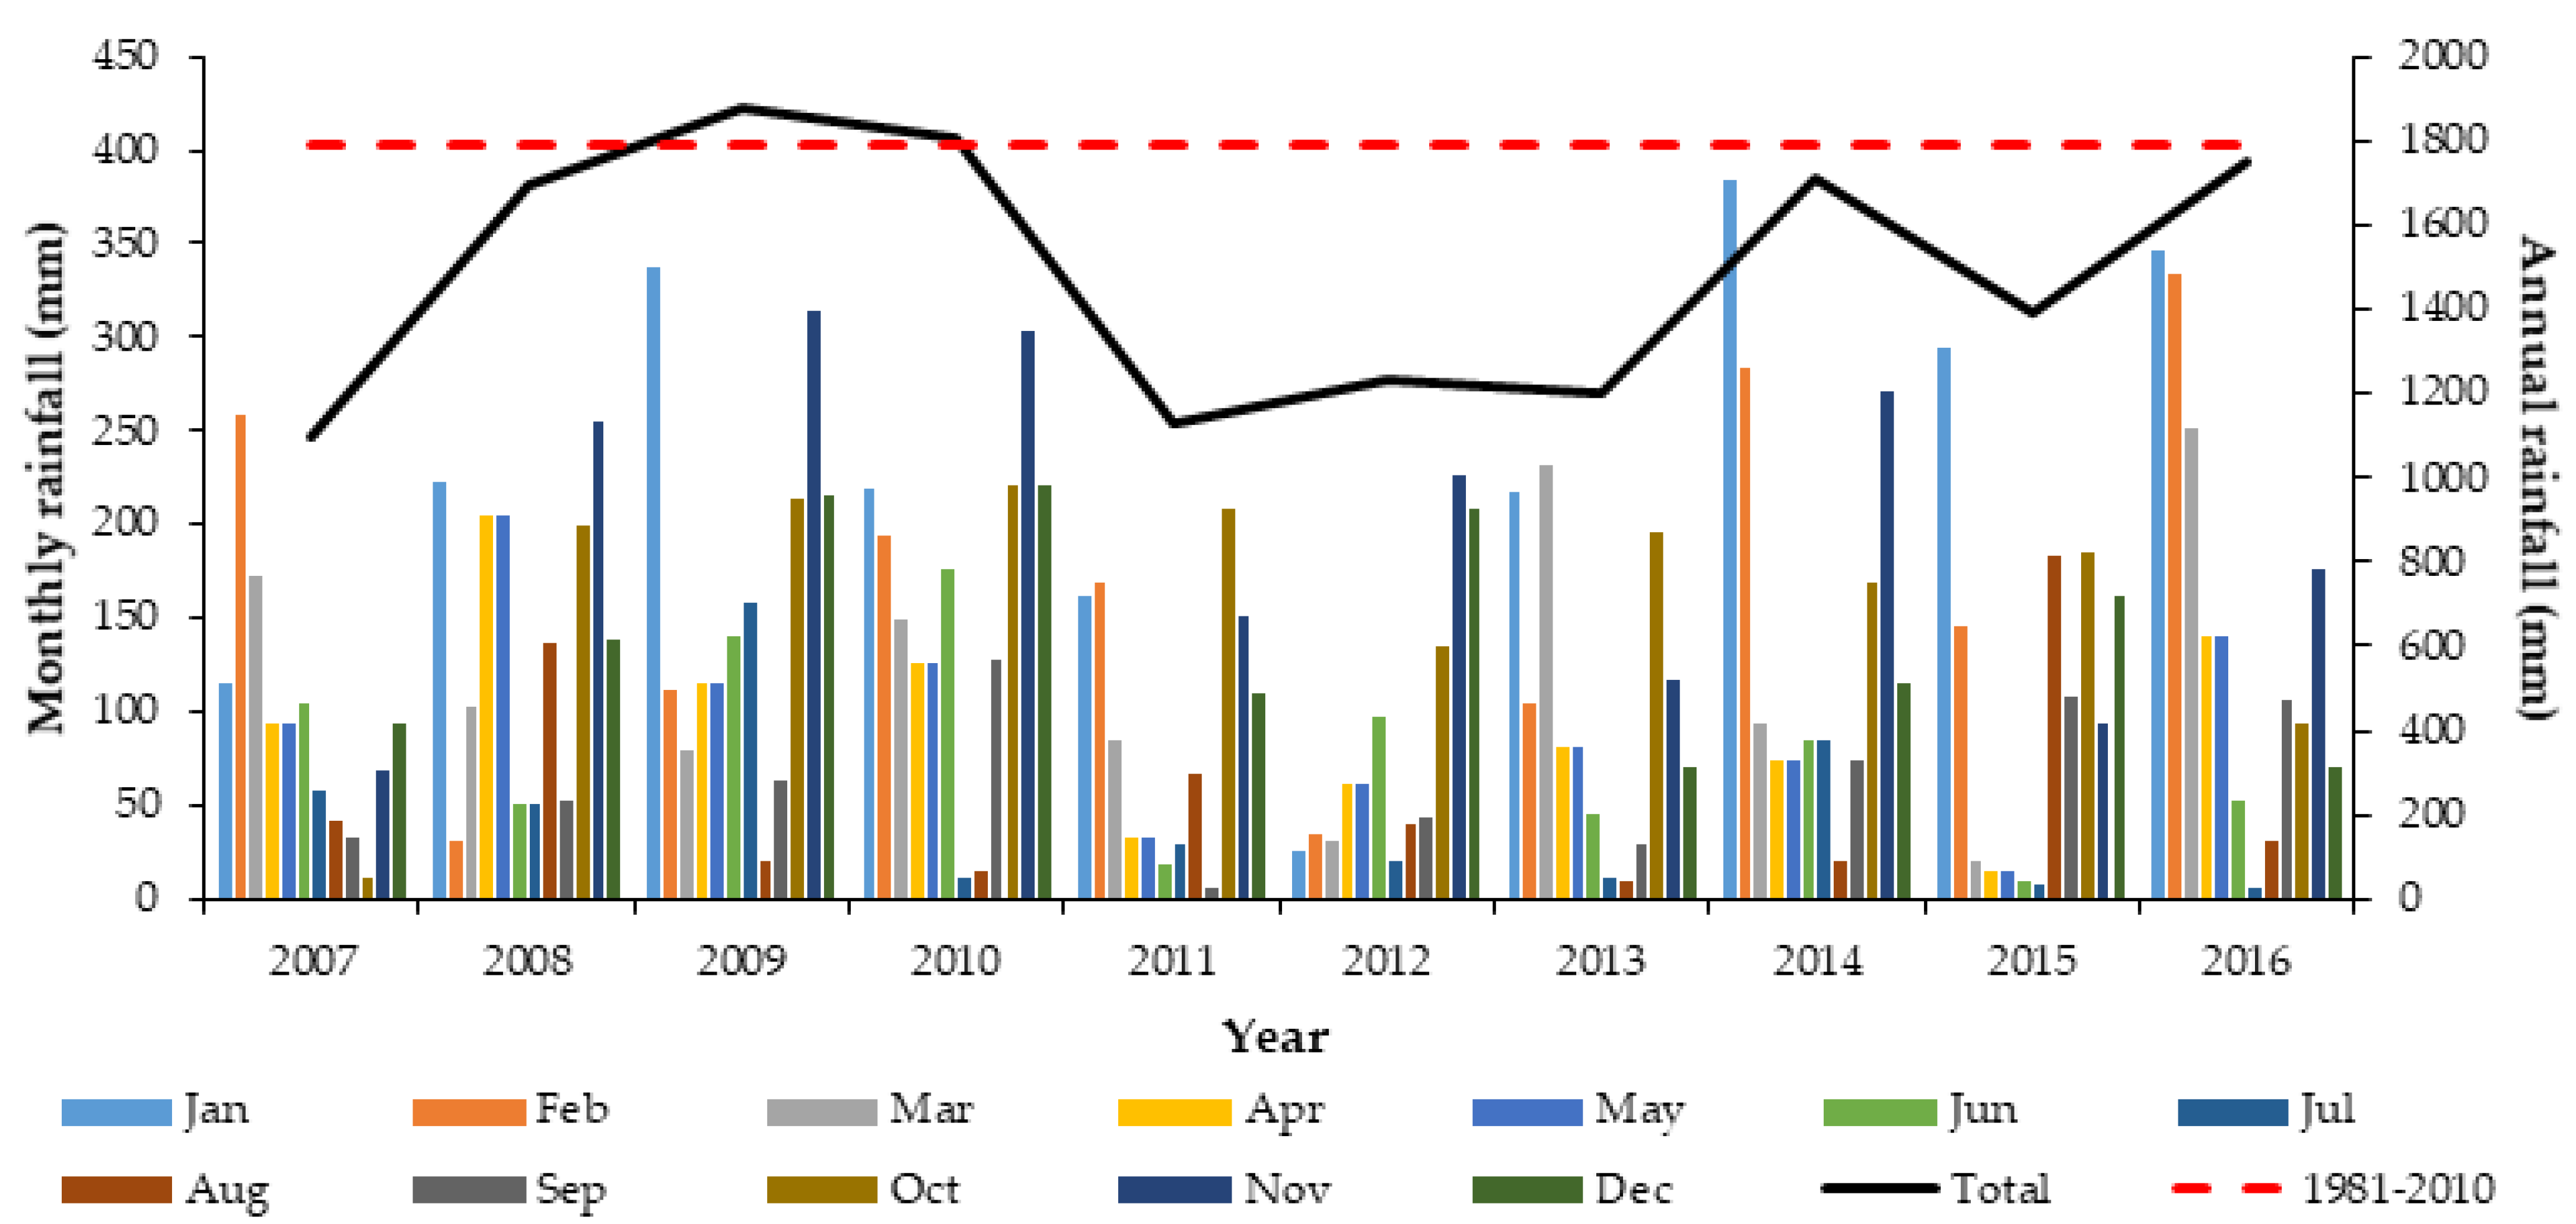
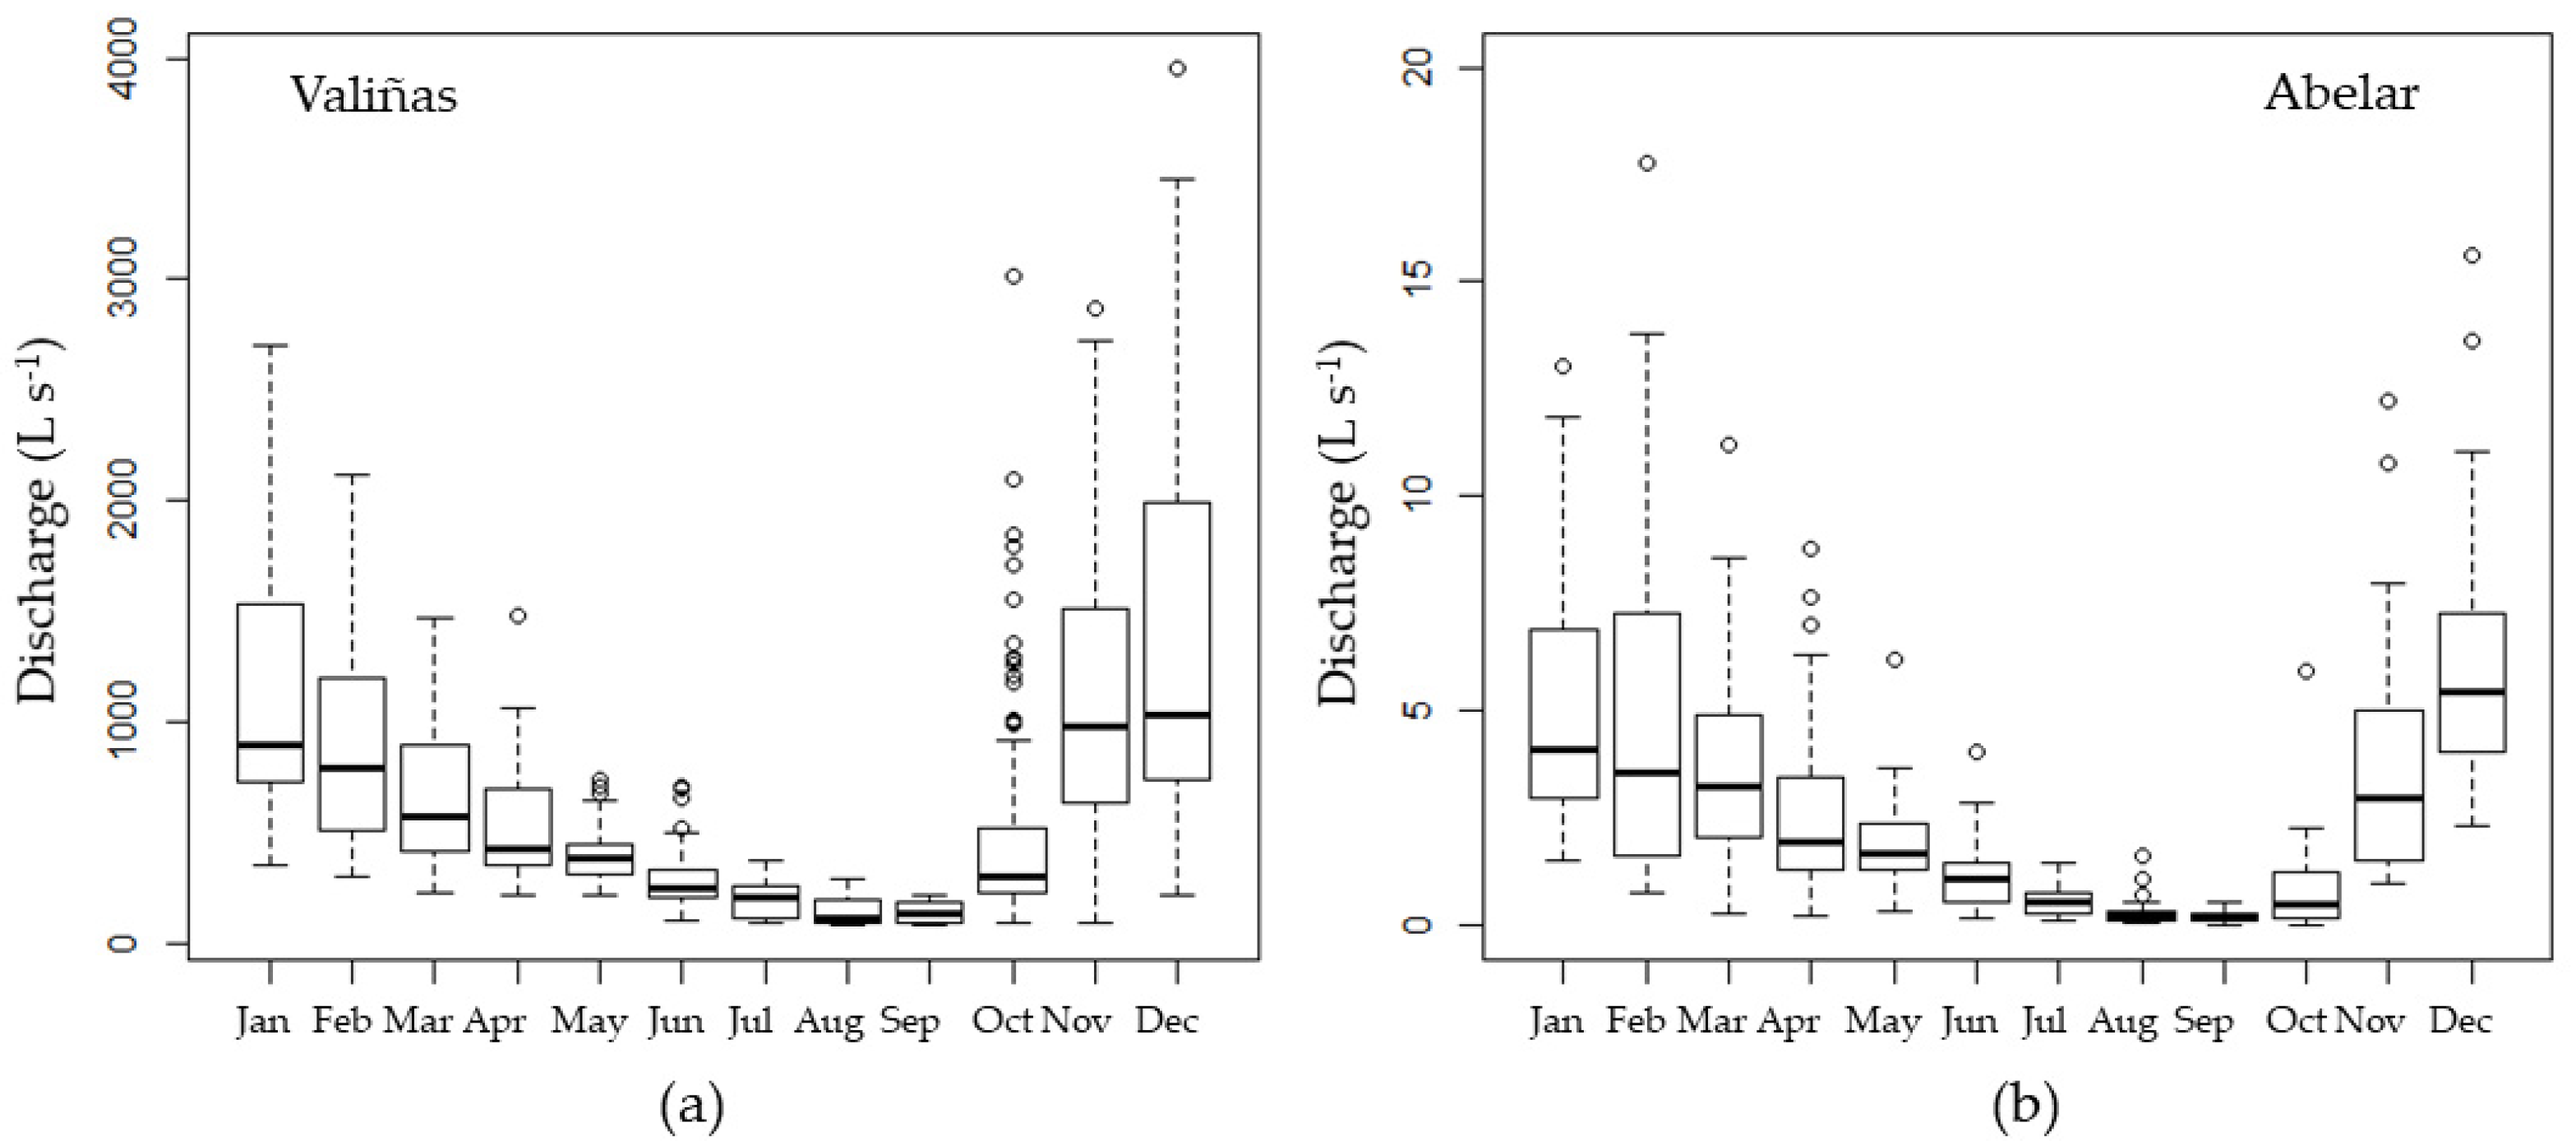
2.1. Study Sites

This work focuses on two catchments with different sizes, geological origins, land use and distance to the coast, both located in A Coruña province (northwest Spain): Valiñas and Abelar (Figure 1).
The Valiñas River is a small headwater stream with a catchment that is 36.3 km2 in surface. Topographically, this catchment consists of steep uplands and contrasting lowlands or local small plains. The bedrock consists of granite (85%) and some outcrops of schists (15%) from the Ordes series in the Northeast of the catchment [20]. The soils within this catchment present loam and sandy-loam textures, with pH ranging from 4.1 to 6.1 [20]. This catchment is located at 9 km from the coast, approximately, and it has been transformed by human activities. The main land use is agriculture (55% of the catchment is cultivated) but forest is also present (45% of the surface). The steep upland slopes are well vegetated with woodland and shrubs. Agriculture has dominated the lowlands and remains relevant nowadays. In fact, the lower part of the Valiñas catchment is dominated by pastures, old orchards and scattered fields in patches where maize is grown. However, an increasing area is being occupied by housing and light industry. Small villages and buildings are not connected to a public sewer system and release sewage into the river, which negatively affects water quality. Surface runoff from village streets, roads and a highway also impact the water quality of this stream [20]. The climate is humid and temperate with an annual total rainfall amount of 1102 mm and an average temperature of 13.8 °C from 1981 to 2010. Figure 2 shows the monthly rainfall amounts for a 30-year period (1981–2010) and those from the studied years (2003–2016). These data were recorded at the weather station of Alvedro (A Coruña), located 3 km from the catchment outlet, approximately. It can be assumed that 2004, 2007, 2011 and 2015 were extraordinarily dry because annual rainfall was, respectively, 29%, 31%, 34% and 32% lower than the 30-year average (Figure 2). However, rainfall amounts in 2003, 2006, 2008, 2009, 2013 and 2016 were close to the average, representing the rainy conditions of the area. The monthly rainfall amounts showed the high temporal variability of rainfall in this region [21].
The Abelar catchment covers 10.7 ha (0.107 km2) and is located at 30 km from the coast, approximately. Geologically, the catchment is characterized by a rocky substrate, dominated by metamorphic schists from the Ordes series, in which permeability is associated with fissuring and surface alteration. The low permeability of these rock formations means that the piezometric level tends to follow the shape of the topography [22]. The soil is loam to silt-loam, with depths ranging from 45 to 125 cm and an acid pH, around 5.1 [23]. An operational farm has been established in this catchment for several years and excessive doses of slurry were applied to the soils. Later, the farm was replaced by a Eucalyptus globulus stand (1270 trees ha−1) covering most of the catchment area in 1998, approximately 85%. Two narrow power-line corridors with maize and pasture (11% of the area) and a small riparian woodland (4% of the area) still remain [23]. No applications of slurry were performed over the Eucalyptus plantation. However, a small maize field, approximately 3% of the catchment surface, remained within the studied site and, occasionally, received applications of slurry, namely twice between 1998 and 2010, affecting water flow and element concentration at the catchment outlet. A comprehensive description of this site can be found in Rodríguez-Suárez et al. [22]. The climate is humid and temperate with an annual total rainfall amount of 1787 mm and an average temperature of 13.0 °C, for the 1981–2010 period. Figure 3 shows the monthly rainfall amounts for a 30-year period (1981–2010) and those from the studied years (2007–2016). These data were recorded at a weather station located within the study site, whereas 30-year data came from the meteorological station of Lavacolla (Santiago de Compostela, A Coruña province), located 10 km from the catchment outlet, approximately. It can be assumed that 2007 was dry, while 2011 and 2013 were extraordinarily dry because annual rainfall was, respectively, 48%, 37% and 33% lower than the 30-year average (Figure 3). However, rainfall amounts in 2008, 2010, 2014 and 2016 were close to the average, representing the rainy conditions of the area.

2.2. Sampling and Laboratory Determinations

The study period extended from January 2003 to December 2016 for Valiñas, and from January 2007 to December 2016 for Abelar. Water samples were collected at the catchment outlets under base and storm flow conditions. The sampling strategy was a stratified point sampling involving more frequent collections when flow was high [24] since a continuous sampling, which would improve the characterization of the rising and falling of the hydrograph [25], was not possible. A total of 984 samples were taken at the outlet of the Valiñas catchment (70 ± 13 samples per year), whereas 391 samples were collected at the outlet of Abelar (39 ± 8 samples per year). The number of samples taken each individual year was a consequence of the frequency and intensity of rainfall.
Samples were collected using polyethylene terephthalate (PET) bottles and they were stored at 4 °C for preservation purposes. The concentrations of four macronutrients, namely sodium (Na+), potassium (K+), calcium (Ca2+) and magnesium (Mg2+), were determined directly on the samples after filtration through a 0.45 μm filter [26]. These concentrations were measured by inductively coupled argon plasma-mass spectrometry (ICP-MS) using a Jobin Yvon JY 50-P instrument (Jobin Yvon, Longjumeau, France).

2.3. Mass Balance Calculations

In order to estimate the mass balance of Na+, K+, Ca2+ and Mg2+, discharge data (Q) at the catchment outlets are required. In the current study, Q data were not continuously recorded. Therefore, daily Q was estimated using Visual Balan v.1.0 [27]. This software computes the water balance at a daily timestep. For streamflow calculation, the model uses the Muskingum-Cunge method [28]. The inputs for the water balance considered by Visual Balan are the contributions from tributary streams and rainfall, whereas, the outputs considered are runoff, infiltration, evaporation and surface discharge. The only data that this model requires are the catchment characteristics and daily records of rainfall and reference evapotranspiration. In the current study, the weather stations mentioned when describing the two catchments considered provided the daily records of rainfall and reference evapotranspiration. Estimations from this model show a reasonable fit with direct Q measurements in the studied catchments [29]. Moreover, the results obtained are in agreement with measured discharges in similar catchments from the same region [30].
In order to build a continuous database for mass balance calculations, daily concentrations of the different solutes were interpolated from measured data and discharge was obtained from model estimates. Daily solute loads from each catchment were estimated using the following equation (adapted from [31]):
E = (Q × C × t)/A
where E is the solute load (kg ha−1), Q is the discharge (L s−1), C is the concentration of the solute (kg L−1), t is time (seconds) and A is the area of the catchment (ha). Then, monthly seasonal and annual averages were computed. In the case of the season, we consider the period from January to March, as winter, April to June as spring, July to September as summer, and October to December as winter.

2.4. Relations between Concentration and Discharge

For each solute and each catchment, the relation between solute concentration and discharge (C = a × Qb) was assessed in order to evaluate solute behaviors between catchments and whether this behavior can be generalized. These two variables are expected to show a linear relation in a log-log scale, expressed by two regression parameters: a, which is the intercept and has the same units as the concentration, and b, which is the unit-less exponent representing the slope of the interpolating line [11]. This b exponent determines the behavior of the solute [8]. As suggested by Meybeck and Moatar [32], C-Q relations were assessed for high and low flows separately in order to obtain a finer classification of the solute behavior into different categories. The criteria for determining high and low flows was the median of the discharge daily values [4,8].

2.5. Data Analysis

2.5.1. Statistical Analysis

The main descriptive statistics of the studied datasets were computed, including mean, median, minimum, maximum, skewness, kurtosis and coefficient of variation (CV). These are calculated for each solute in each catchment aiming at highlighting differences between catchments, which are a consequence of natural and anthropogenic factors. Relations among the different solutes and Q were assessed through the Pearson’s r correlation coefficient. The Kolmogorov-Smirnoff test was used for comparing, on a yearly basis, the frequency distributions of the different solutes studied. The statistical significance of having a b exponent different from zero was assessed by means of Student’s t test at 0.05 level of significance [11].

2.5.2. Time Series Analysis

The monthly averages of the concentrations of each solute in each catchment were subjected to time series analysis in order to assess their trend and seasonality. The autocorrelation function was employed for examining how a value depended on preceding values over a period of time. This function is represented with a correlogram. The slope of this correlogram provides the time of response of the hydrological system [33]. Time series analysis has been widely applied in hydrology to assess the inertia of the system and to make forecasting and generate synthetic series which are inputs for the analysis of complex water resources systems [34,35].
Both statistical and time-series analyses were carried out using the R statistical environment v.4.0.5 [36].

3. Results

3.1. Magnitude

Table 1 shows the statistical summary of the concentrations of the four water-soluble ionic species for the two catchments over the whole study period.
The mean concentrations of these solutes were significantly higher in Valiñas than in Abelar. However, in both catchments, median concentrations were relatively close to the mean concentrations for each of the nutrients analyzed. In absolute terms, Na+ ranged from 8.90 to 27.20 mg L−1 in Valiñas and from 3.65 to 23.20 mg L−1 in Abelar; K+ from 1.13 to 13.49 mg L−1 in Valiñas and from 0.21 to 104.00 mg L−1 in Abelar; Ca2+ ranged from 4.47 to 20.70 mg L−1 in Valiñas and from 1.34 to 9.40 mg L−1 in Abelar; finally, Mg2+ ranged from 2.15 to 7.30 mg L−1 in Valiñas and from 1.62 to 7.20 mg L−1 in Abelar. This wide range of concentrations caused skewness and kurtosis values to be far from those corresponding to a normal distribution (Table 1). The coefficients of variation were relatively low for Na+ and Mg2+ in Valiñas (< 20%), whereas this coefficient was extremely high for K+ concentrations in Abelar (Table 1).
Pearson’s r correlation coefficients (Table 2) showed that discharge was negatively and significantly correlated with the concentrations of the studied solutes in the Valiñas catchment. In the case of Abelar, Na+ and Ca2+ concentrations were significantly correlated with discharge; in contrast, K+ and Mg2+ concentrations did not show a significant correlation with discharge (Table 2). The concentrations of the four macronutrients studied were significantly and positively correlated in both catchments (Table 2).

3.2. Monthly and Seasonal Evolution of Macronutrient Concentrations

In both sites, the highest discharge values occurred in autumn and winter, between November and February, while the lowest values occurred in summer, between July and September (Figure 4). A noticeable difference in discharge between the two catchments was observed, with higher values in Valiñas.
For the Valiñas catchment, the highest concentrations of Na+, K+, Ca2+ and Mg2+ tended to occur in late summer or early autumn, between August and October (Figure 5a). In contrast, no particular patterns were observed for Na+, K+ and Mg2+ in Abelar due to the presence of outliers in the data series, while Ca2+ concentrations behaved in the opposite way as those from Valiñas (Figure 6a). When removing the extreme outlier, likely caused by an anthropogenic source, Na+ and Mg2+ tended to be constant along the year in Abelar, while K+ and Ca2+ tended to appear in lower concentrations during summer.
Autocorrelation functions showed a seasonality for the concentrations of all macronutrients in Valiñas (Figure 5b), with four-month cycle fluctuations. This seasonality was also observed for Ca2+ concentrations in Abelar but not for the rest of the solutes, which tended to behave rather constantly in the case of Na+ and Mg2+, and rather erratically in the case of K+ (Figure 6b).
In the Valiñas catchments, the concentrations of the four macronutrients showed a higher magnitude in 2008 and 2012 but presented and marked seasonal tendency (Figures S1–S4). In contrast, the concentrations of the four studied macronutrients in Abelar tended to decrease in the long term (Figures S5–S8). Kolmogorov-Smirnoff tests indicated that the concentrations of these solutes differed from year to year, with 2008 and 2009 being the years that showed different concentrations with respect to the other years studied (Tables S1–S3).
Moreover, the concentrations of Na+, K+ and Ca2+ were significantly higher (almost double) in Valiñas than in Abelar on a yearly and seasonal basis. Within a single catchment, the concentrations of Na+, Ca2+ and Mg2+ showed significant differences among seasons in Valiñas, namely the concentrations were higher in summer and autumn than in spring and winter, while K+ concentrations did not differ among seasons (Table 3). In the case of Abelar, Na+ and K+ concentrations did not differ among seasons, whereas those of Ca2+ and Mg2+ were lower in summer (Table 3).

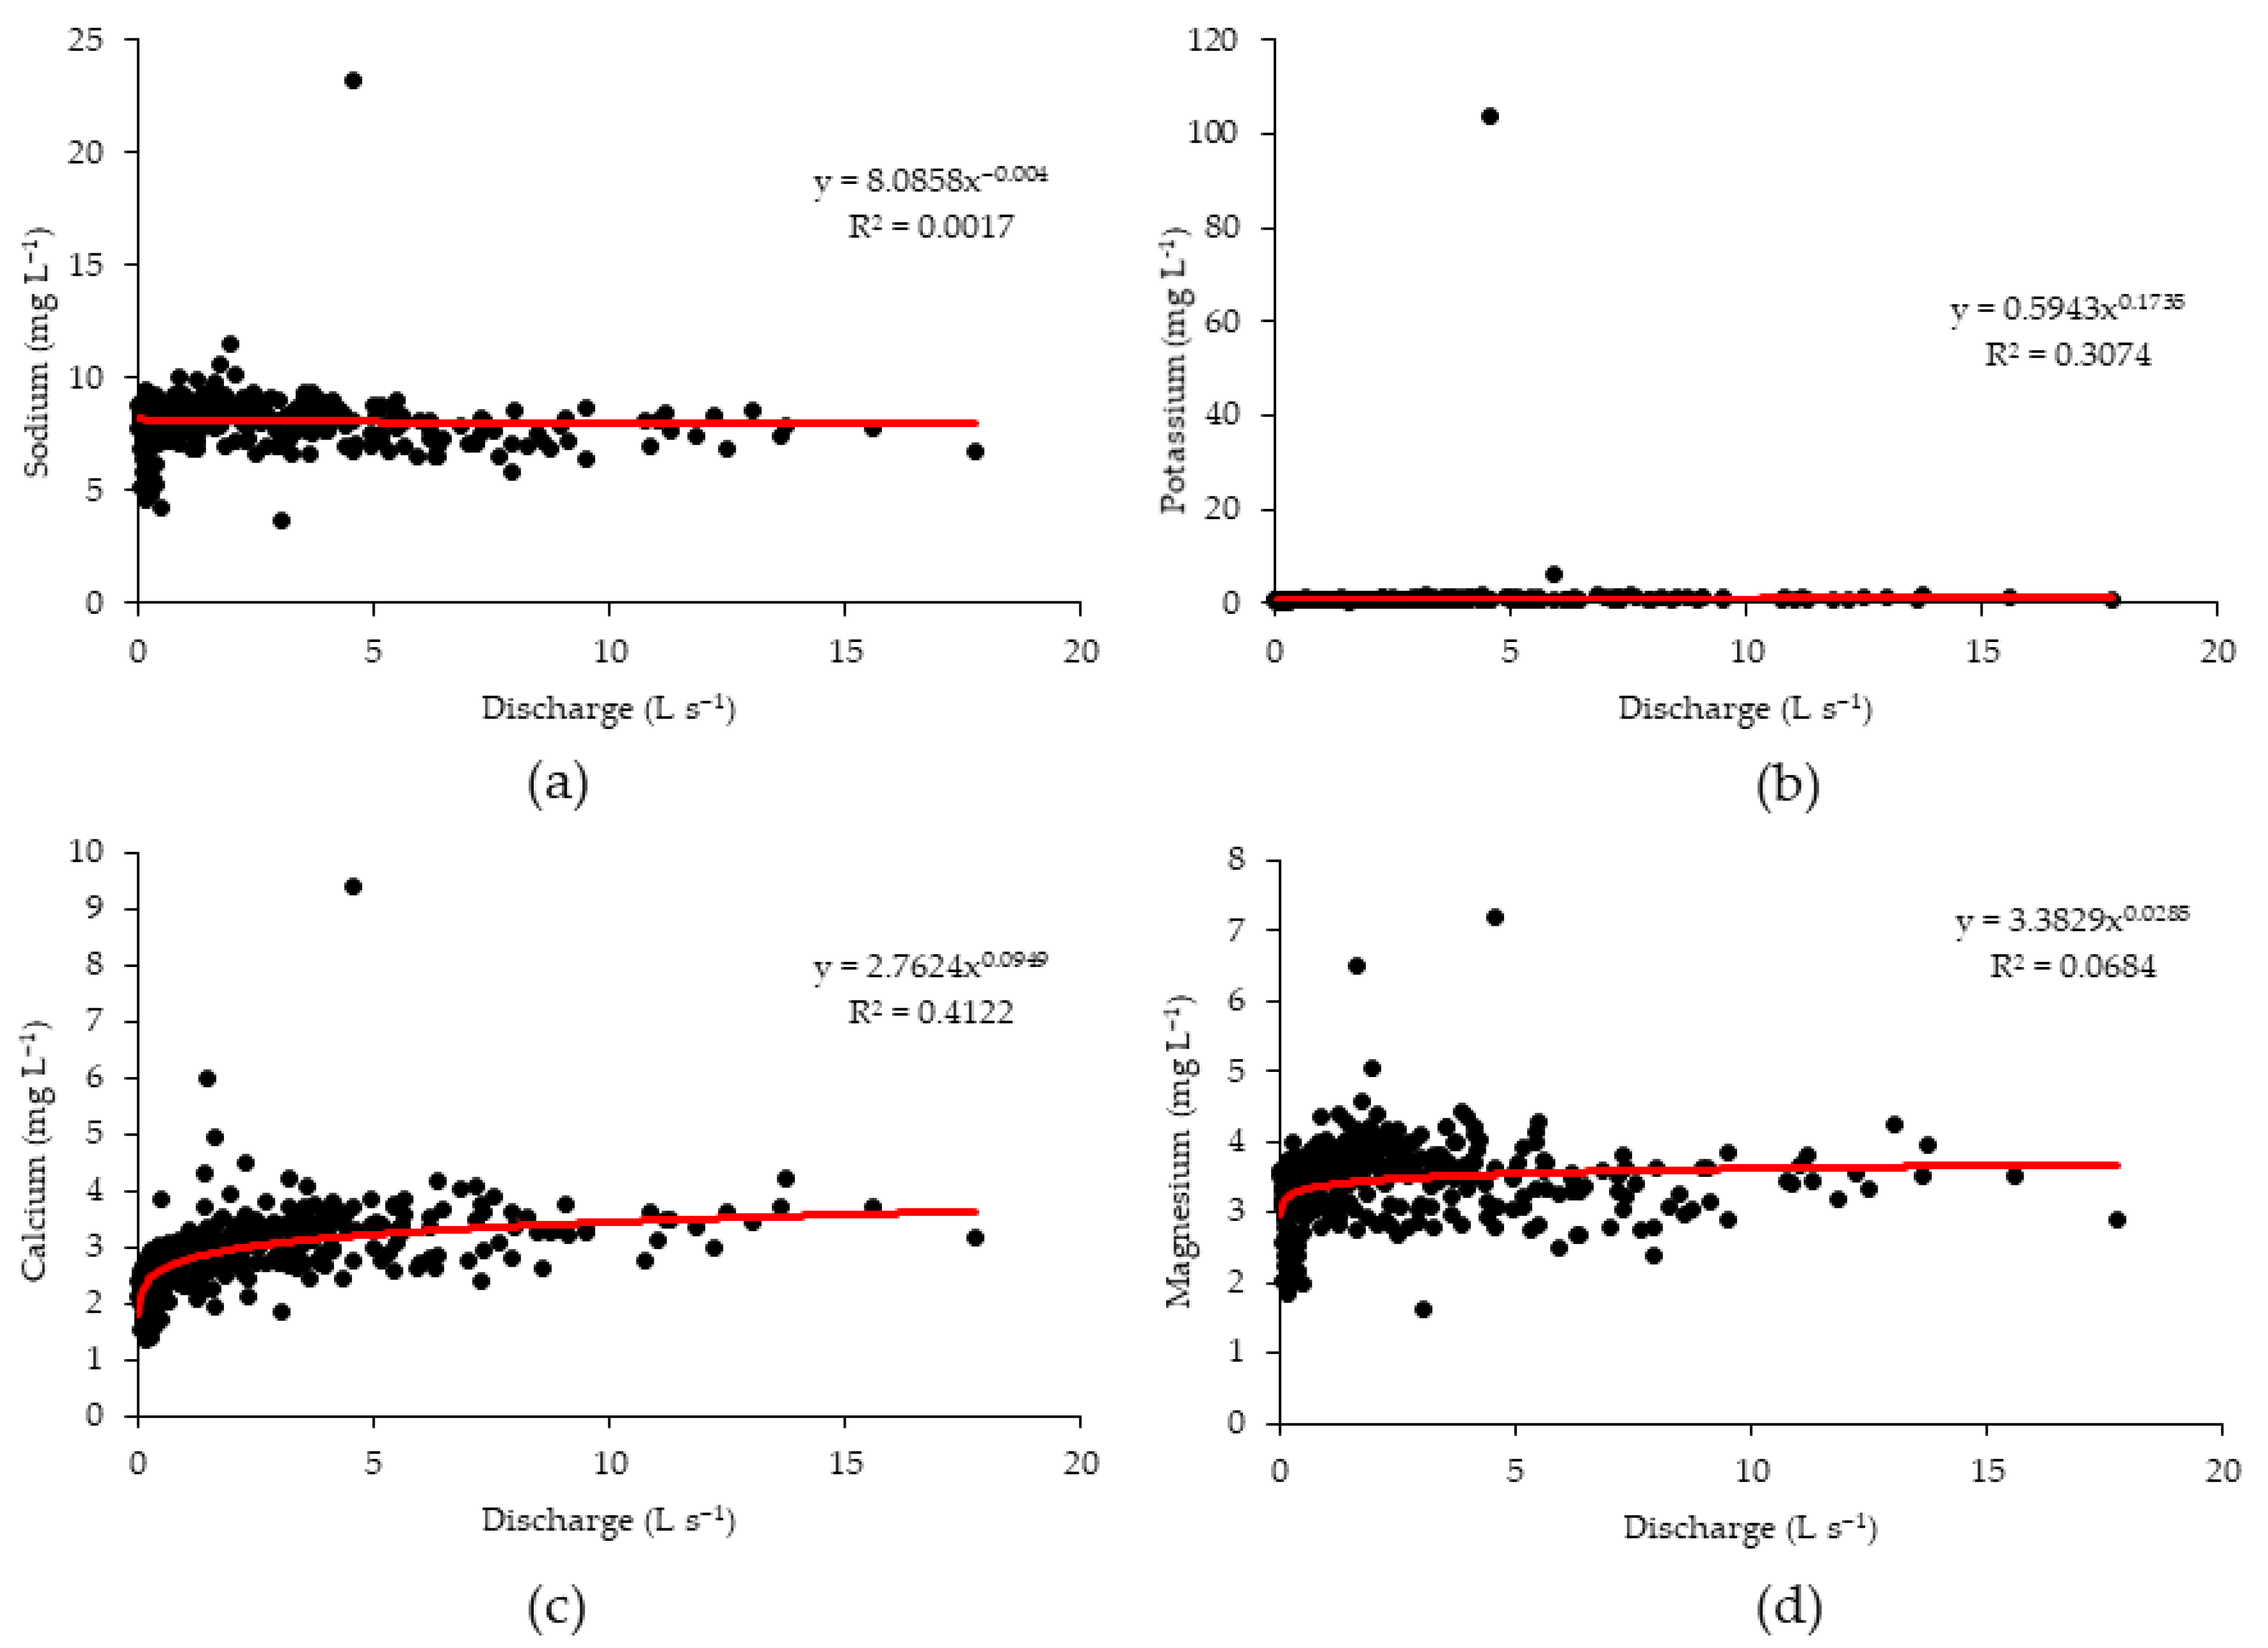
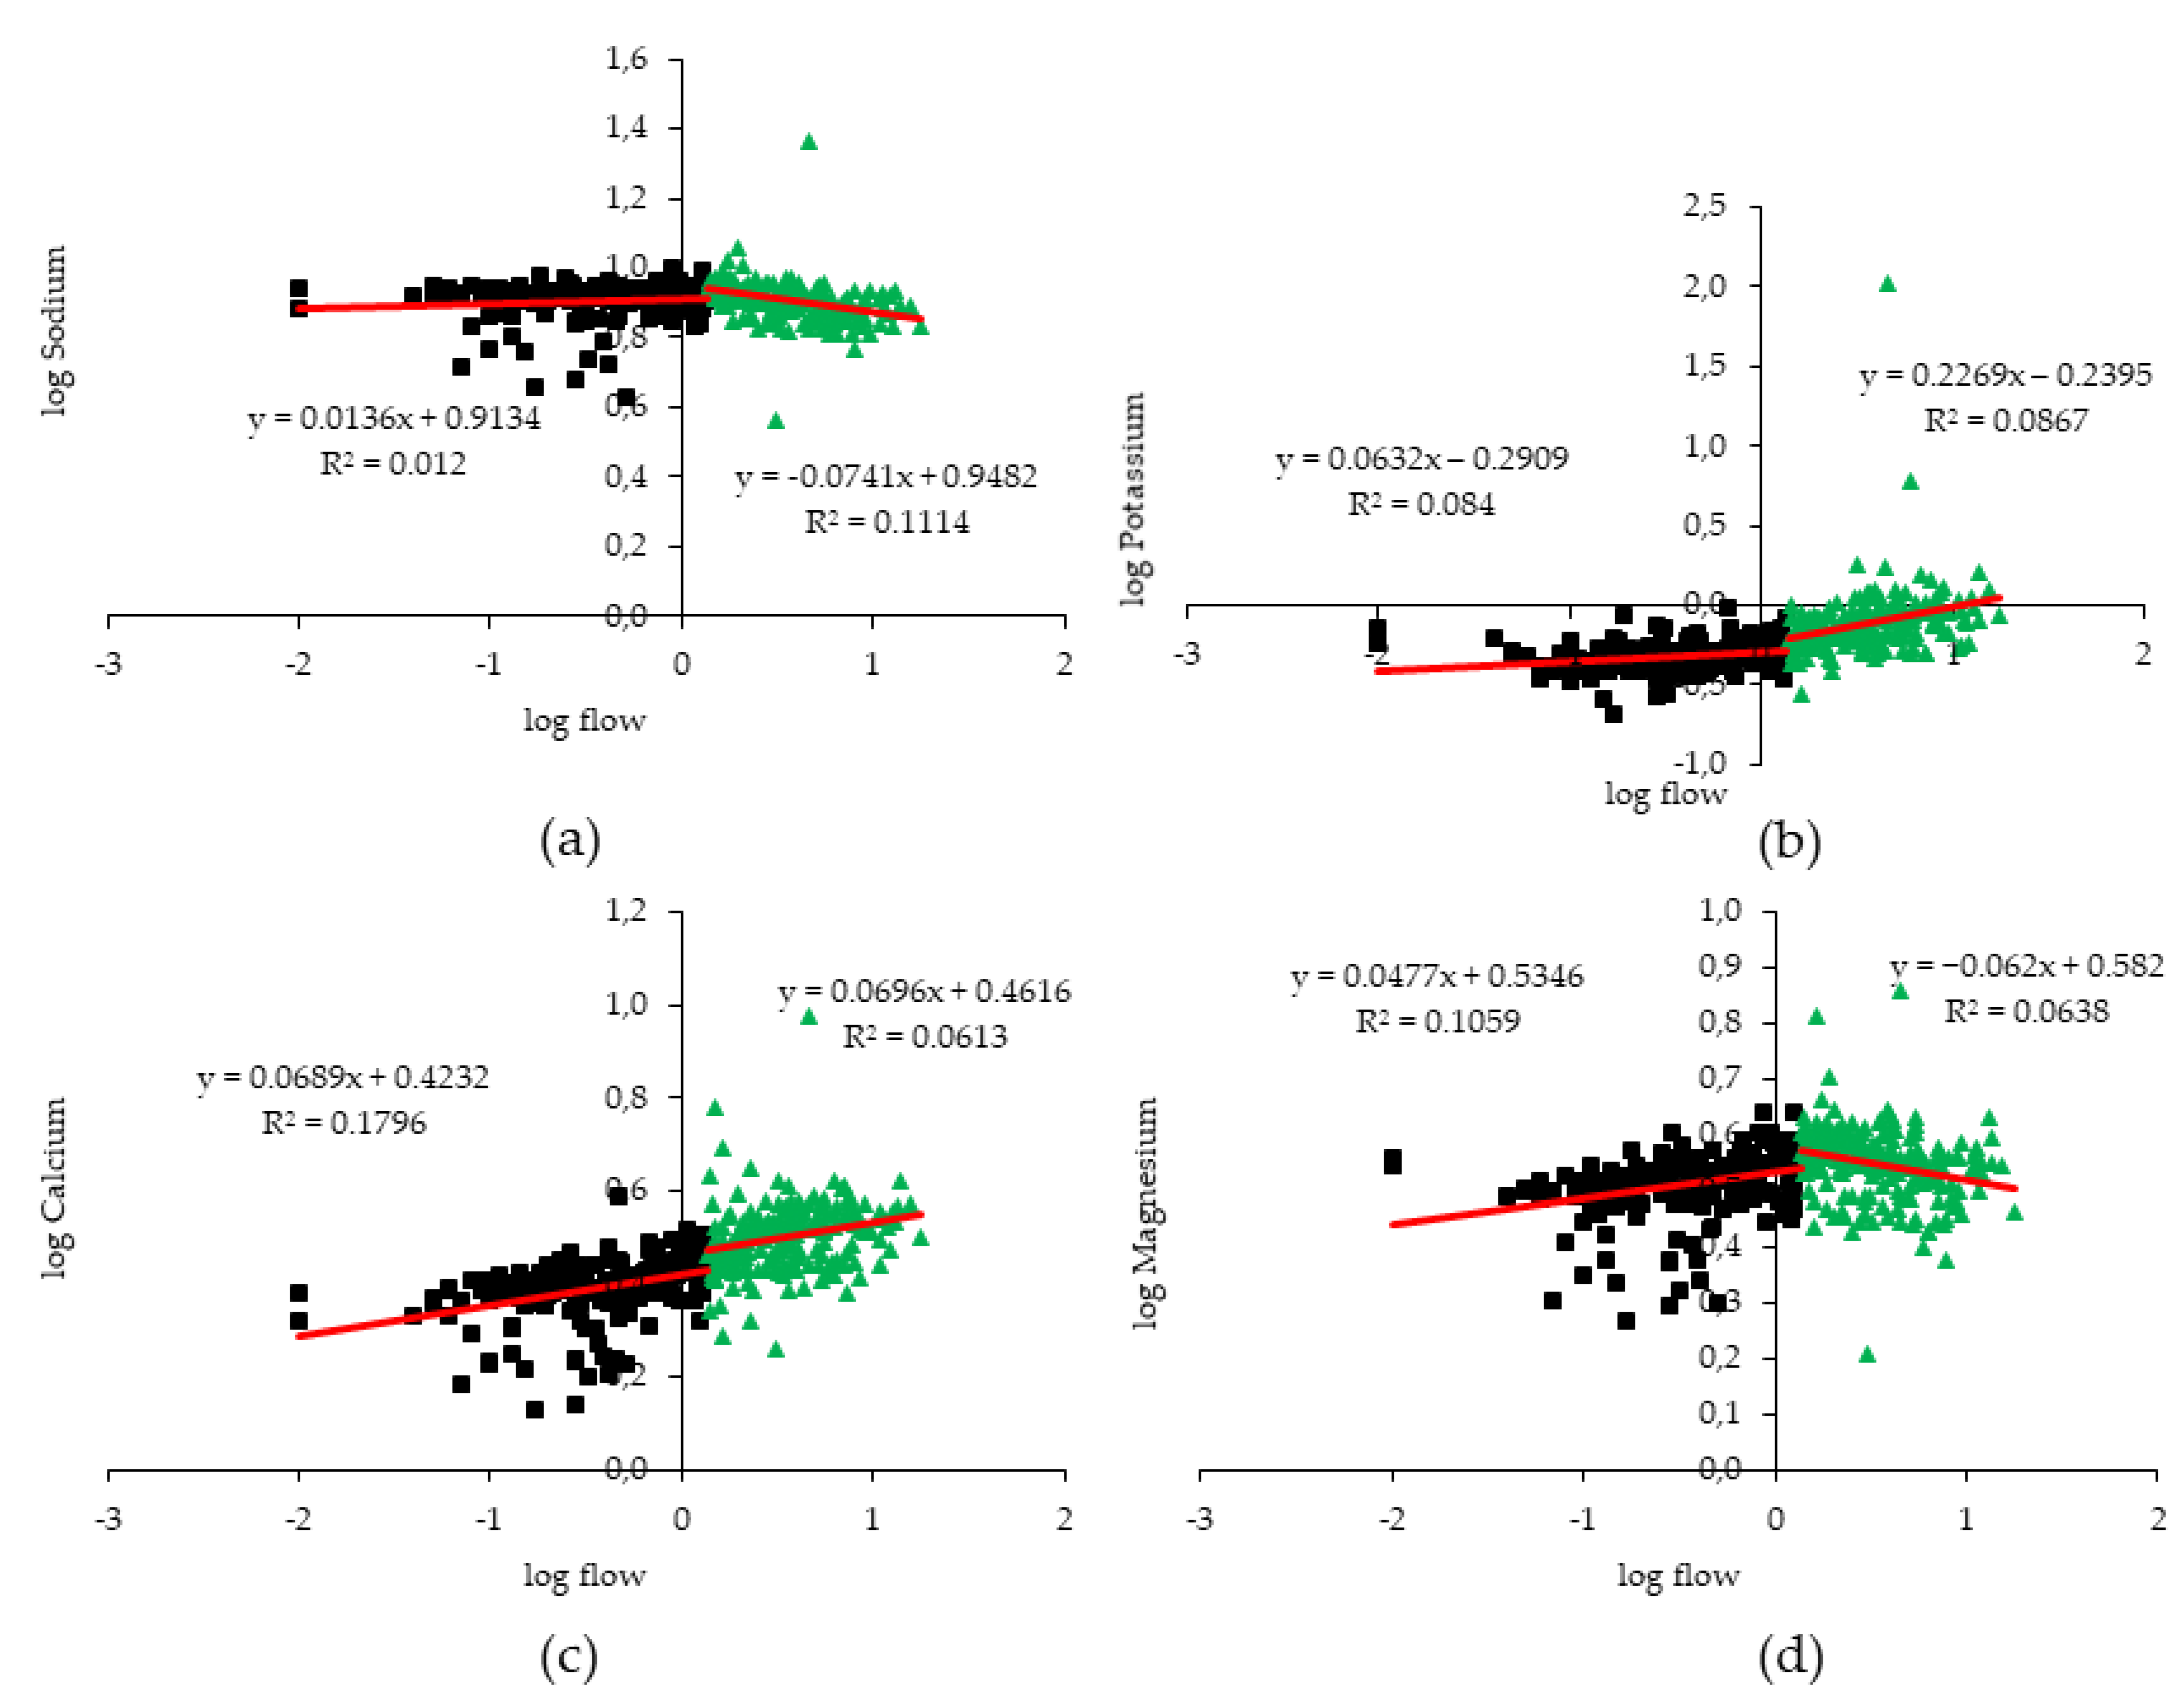
3.3. Concentration-Discharge Relations

Figure 7 shows plots of concentration versus discharge for the four studied macronutrients in Valiñas. Decreasing concentrations with discharge were clearly observed for sodium and magnesium, whereas potassium and calcium concentrations tended to reduce with increasing discharge to a lesser extent. The b exponents were −0.127, −0.122, −0.123 and −0.156 for Na+, K+, Ca2+ and Mg2+ respectively. Solute concentrations decreased up to, approximately, 2 m3 s−1 of discharge, after which concentrations tended to level off (Figure 7).
When plotted on a log-log space (Figure 8), the four solutes showed a dilution behavior with increasing discharge and no significant changes in the slope of the regression lines were observed when considering flows lower or greater than the median, except for the case of K+ in which a reduction in the slope value was detected under high flow conditions.
In the case of Abelar (Figure 9), the concentrations of Na+ and Mg2+ remained almost constant independently of discharge, whereas those of K+ and Ca2+ tended to increase with discharge (Figure 9). When plotted on a log-log space, the concentrations of Na+ remained practically stable when flow was lower than the median, whereas they tended to decrease when discharge values were greater than the median (Figure 10a). In contrast, K+ concentrations increased with discharge and the slope of this increase was much higher under high flow conditions (Figure 10b). The concentrations of Ca2+ increased with the discharge and no significant change in the slope of this relation was observed when discharge was greater than the median (Figure 10c). In the case of Mg2+, the concentration slightly increased with discharge but decreased under high flow conditions (Figure 10d).
Considering the whole dataset, half of the C-Q relationships were negative for low flows, one was flat and three were positive. Under high flow conditions, five out of eight C-Q relationships were negative, two were positive and the remaining one was flat. Moreover, Student’s t tests revealed that b exponents were significantly different from 0 for all macronutrients in Valiñas and Abelar (p-values ranging from 3.2 × 10⁻⁸ to 0.025), except for that of Na+ in Abelar (p-value = 0.205).

3.4. Loads of Macronutrients in Each Catchment

The loads of the four major macronutrients studied showed a great variability at the monthly, seasonal and annual scales. Moreover, loads increased in autumn and winter with respect to spring and summer losses in both study sites (Table 4). In general, macronutrient exports from the Valiñas catchment were higher than those from Abelar. Depending on the solute, season and year, the ratio of the loads from Valiñas to those of Abelar ranged from 0.7 to 2.4 for Na+, from 0.5 to 5.0 for K+, from 0.8 to 3.3 for Ca2+, and from 0.4 to 1.4 for Mg2+.
In Valiñas, the annual transfers of Na+ ranged from 57.17 kg ha−1 in 2015 to 99.28 kg ha−1 in 2006. On average for the study period, Na+ loads were 56.10 kg ha−1 during autumn and winter, whereas they were 21.05 kg ha−1 during spring and summer. Moreover, Na+ losses during the six driest months were 27.64% of the annual losses, on average for the studied period. The annual loads of K+ ranged from 8.58 kg ha−1 in 2015 to 16.09 kg ha−1 in 2013. On average, for the 14 years of study, K+ losses were 8.91 kg ha−1 during autumn and winter, and 3.09 kg ha−1 during spring and summer. The K+ transfers during the six driest months were 26.22% of the annual losses. The annual loads of Ca2+ ranged from 26.34 kg ha−1 in 2015 to 48.47 kg ha−1 in 2006. On average, Ca2+ loads were 26.66 kg ha−1 during autumn and winter, and 9.85 kg ha−1 during spring and summer. The Ca2+ transfers during the six driest months were 27.26% of the annual losses. Finally, the annual transfers of Mg2+ ranged from 13.70 kg ha−1 in 2015 to 24.48 kg ha−1 in 2016. On average for the study period, Mg2+ loads were 13.71 kg ha−1 during autumn and winter, and 5.25 kg ha−1 during spring and summer. The Mg2+ transfers during the six driest months were 28.05% of the annual losses.
In Abelar, the annual loads of Na+ ranged from 39.23 kg ha−1 in 2012 to 89.06 kg ha−1 in 2013. On average for the study period, Na+ loads were 49.42 kg ha−1 during autumn and winter, whereas they were 13.84 kg ha−1 during spring and summer. Moreover, Na+ losses during the six driest months were 21.88% of the annual losses, on average for the studied period. The annual loads of K+ ranged from 3.41 kg ha−1 in 2012 to 20.81 kg ha−1 in 2008. On average for the 14 years of study, K+ losses were 7.33 kg ha−1 during autumn and winter, and 1.16 kg ha−1 during spring and summer. The K+ transfers during the six driest months were 13.65% of the annual losses. The annual loads of Ca2+ ranged from 14.82 kg ha−1 in 2012 to 40.30 kg ha−1 in 2010. On average, Ca2+ loads were 20.90 kg ha−1 during autumn and winter, and 5.07 kg ha−1 during spring and summer. The Ca2+ transfers during the six driest months were 19.54% of the annual losses. Finally, the annual transfers of Mg2+ ranged from 17.07 kg ha−1 in 2012 to 39.19 kg ha−1 in 2010. On average, for the study period, Mg2+ loads were 21.29 kg ha−1 during autumn and winter, and 5.86 kg ha−1 during spring and summer. The Mg2+ transfers during the six driest months were 21.59% of the annual losses.

4. Discussion

4.1. Influence of Catchment Features on Macronutrient Concentrations and Loads

In the current study, the mean concentrations of Na+, K+ and Mg2+ in waters from both catchments were greater than the reference values for unpolluted rivers [1], as previously reported for streams in Galicia [16,19]. In contrast, the mean concentration of Ca2+ in waters from both catchments was lower than the reference value for unpolluted rivers. For instance, Na+, K+ and Mg2+ mean concentrations in Valiñas were, respectively, 4.5, 21.8 and 1.3 times greater than the reference values, while Ca2+ concentrations were 0.6 times that of the reference. In Abelar, Na+, K+ and Mg2+ mean concentrations were, respectively, 2.2, 7.6 and 1.1 times greater than their corresponding reference, respectively; however, Ca2+ concentrations in Abelar were 20% those of the reference for unpolluted waters. Therefore, the concentrations observed in the current study can be considered high for three of the macronutrients studied and low for Ca2+. This can be explained by the lithology of the area, consisting of rocks with low calcium contents. Nevertheless, the magnitudes observed are in agreement with previous reports in the region. For instance, high concentrations of Na+ (from 8.74 to 34.35 mg L−1) have been reported in Galician streams due to the oceanic influence and the bedrock materials [19,37,38,39,40]. However, the Mg2+ concentrations measured in the current study were greater than those reported for other Galician streams [38,39,40].
Large differences in the magnitude of the macronutrients studied were detected between the two catchments. On average, Na+ concentrations in the waters from the Valiñas catchment were two-fold those from Abelar, whereas K+ and Ca2+ concentrations were almost 3 times greater in waters from Valiñas than from Abelar; the concentration of Mg2+ was 20% greater in waters from Valiñas than from Abelar. The proximity to the sea is one of the main factors influencing the Na+ contents in rainfall, fog and water bodies [41] since these elements can reach the system through atmospheric deposition [13]. Therefore, the greatest concentrations of this solute in water samples from Valiñas were likely caused by a shorter distance (9 km) to the Atlantic Ocean than the Abelar catchment (30 km). Nevertheless, the nature of the soils and the lithology, as well as land use, might have also affected the concentrations of macronutrients in waters from both catchments. A great difference between Valiñas and Abelar regarding soil origin and bedrock exists. There is mainly granite in Valiñas and schists in Abelar. This would have led to differences between catchments in the base levels of each solute in the streams as well as in the process of rock weathering [42].

4.2. Human Activity Effects on Macronutrient Concentrations

Apart from the main features of catchments, the impact of anthropic activities on the concentrations of solutes detected in surface waters can be relevant and, sometimes, this impact is evident due to changes in magnitude, seasonality and long-term trends [11]. For instance, Na+ concentrations have been reported to increase over time due to human influence (application of deicing salt) in Swiss catchments [11]. In the current study, the Na+ and K+ highest concentrations in the Abelar catchment seem to be originated from slurry applications, when this catchment was devoted to crop production, which buffered the seasonal oscillations expected. When the land use in this catchment changed after afforestation, the concentrations of these solutes in the stream were lower and tended to decrease over time. In the case of the Valiñas catchment, the concentrations of these solutes did not have large variations over time or within a given year, suggesting that processes of fertilization and transfer to the stream are limited, except for some high concentrations of K+ in spring 2003 and summer 2014 (Figure 5a), which may indicate fertilizer leaching to the stream.
In contrast, Ca2+ and Mg2+ are geogenic solutes [11,43] and their concentrations in the streams are related to the nature of the bedrock materials existing in each of the studied catchments. Unexpectedly, the concentrations of Ca2+ observed in the waters from Abelar were lower than those found in Valiñas because the bedrock in Abelar consists of schists, which usually have higher contents of Ca2+ than granite. Nevertheless, bedrock composition does not determine the composition of water. The concentration of Ca2+ is controlled by other factors such as carbonate content, pH and cationic exchange processes. In the case of the Abelar catchment, the highest concentration of Ca2+ in the water was detected after an episode of slurry application by the end of October 2008 (Figure 6a), in agreement with former studies in which high concentrations of this solute in the streams were related to agricultural activities [11,16,38,43]. After catchment afforestation, the concentrations of this solute in the water were reduced. The concentrations of Mg2+ in waters from Abelar were lower than in waters from Valiñas and increased in magnitude due to slurry applications. After afforestation, the concentrations of this solute were reduced and kept constant over time.

4.3. Concentration-Discharge Relationships

The current study revealed that concentration-discharge relations for Na+, K+, Ca2+ and Mg2+ differed between two catchments with different sizes, geological materials, land uses and located at different distances from the sea. According to the criteria proposed by Herdon et al. [44], limiting chemostatic behavior as −0.1 < b < 0, the C-Q curves observed in the current study indicated that the concentrations of Na+, Mg2+ and Ca2+ in Abelar followed a chemostatic behavior, which is usually attributed to homogeneous and uniform distribution of elements in a given catchment or, alternatively, to temporal stability of flow paths [3,8,43]. In contrast, the concentrations of the four macronutrients in Valiñas showed a negative chemodynamic behavior that can be attributed to dilution during high flows [45,46,47]. Finally, K+ concentrations in Abelar showed a positive chemodynamic behavior that is usually attributed to enhanced erosion during high flows or to a reconnection of surface or subsurface catchment components where a given solute is more abundant [46,48]. It must be noted that the threshold of b > 0.1 is arbitrary and the use of Student’s t tests are preferred [49]. In the current study, we employed this methodology and, despite the low values, the exponent b was significant in all cases, except for Na+ in the Abelar catchment. Therefore, according to this criterion, all solutes showed a chemodynamic behavior, except for Na+ in Abelar.
In the current study, the approach by Meybeck and Moatar [32], consisting of splitting the hydrograph at the median flow and calculating separate log-C log-Q slopes was followed [4,32]. Although this approach has been criticized because of being arbitrary, Diamond and Cohen [50] tested several breaking points for the C-Q curves and most of them were centered on the median flow, supporting our choice. In this study, depending on the solute and the catchment, five combinations were observed: down-down, down-flat, flat-down, up-up and up-down. In Valiñas, C-Q types were down-down for Na+, Ca2+ and Mg2+, whereas a down-flat behavior was observed for K+. In Abelar, C-Q types were flat-down for Na+, up-up for K+ and Ca2+ and an up-down pattern was observed for Mg2+. Therefore, in agreement with observations made in French catchments [4], we found that less than 13% of all C-Q slopes were flat across the hydrograph, contrasting with previous studies that suggested the predominance of chemostatic C-Q relationships for major ions [8,51]. This can be explained by the hydrograph segmentation technique, which avoids confounding patterns for low and high flows [32].
In the Valiñas catchment, the negative relationship between Na+ concentration and discharge suggests that the sodium that reaches the soil through atmospheric deposition is diluted during the wet season, as reported for other catchments [5,11]. In contrast, Na+ concentrations in the Abelar catchment showed a chemostatic behavior at base flow conditions [8], since they remained constant despite the changes in discharge. However, when considering flows greater than the median, a slight trend to decrease Na+ concentration with increasing discharge was observed in Abelar. The differences between catchments on the C-Q relationships for this solute can be attributed to catchment characteristics and land use [5,11,43].
The other solutes studied (K+, Ca2+ and Mg2+) showed a dilution effect in the Valiñas catchment, except for Mg2+ at high flow conditions, which remained chemostatic. This suggests a source-limited behavior. However, the increase of K+ and Ca2+ concentrations during high flow conditions in Abelar suggests a source of these nutrients from sites in the system not normally accessed during base flow [5]. A recent study showed, through numerical simulations, that the vertical distribution of solute generation and activation thresholds of solute export are more influential in shaping the solute behavior (C-Q relation) than the timing of solute input [49]. The depth at which the solute is supplied or generated plays a major role in defining the b exponent for highly (Na+) and weakly (Ca2+, Mg2+, and K+) diluting solutes. Sporadic input applications increase temporal variability and add uncertainty to the solute behavior, the response of which remains the most difficult to constrain [49].
Finally, it is important to highlight that our data consists of low-frequency measurements, which allow for a powerful description of general patterns, although they obscure short-term C-Q dynamics, when hydrology, biological activity, and antecedent distribution of solute sources likely play a major role [4,46,52,53].

5. Conclusions

The long-term series of water quality analyzed in the current study allowed for assessing the signature of catchment features and the impact of human activities on Na+, K+, Ca2+ and Mg2+ concentrations observed in two small Atlantic watersheds. Changes in the magnitude of these major soluble ions were clearly related to human activities in the smallest catchment (Abelar), overwhelming the natural climatic variability. In contrast, catchment characteristics, such as distance to the coast and bedrock composition, had a significant influence on the concentrations of the macronutrients studied. Nevertheless, trends in long-term dynamics were not observed for the considered solutes in any of the studied catchments.
The analysis of the empirical C-Q power laws allowed the classification of the solute behaviors, which depended on the catchment features. While the four macronutrients showed a dilution pattern in the catchment located at the shortest distance to the coast (Valiñas), Na+ tended to a chemostatic behavior in Abelar. Surprisingly, K+ and Ca2+ were positively related to streamflow in Abelar, which can be explained by the land use within the catchment, resulting in an up behavior for biologically reactive solutes at low flows and hydrological exports at high flows.
Despite the coarse resolution of the water quality data set, along with the relatively small sample size, the obtained results reinforce and expand the current understanding of the biogeochemical response of rivers, demonstrating that long-term observations allow for identifying several aspects of anthropic activities and watershed features on the concentrations of macronutrients in streams.

Supplementary Materials

The following are available online at https://0-www-mdpi-com.brum.beds.ac.uk/article/10.3390/hydrology8030096/s1, Table S1: p-values from the Kolmogorov-Smirnoff tests comparing the temporal (on a yearly basis) distribution of sodium and potassium concentrations in waters from the Valiñas catchment. Yellow indicates those differences that are not significant, Table S2: p-values from the Kolmogorov-Smirnoff tests comparing the temporal (on a yearly basis) distribution of calcium and magnesium concentrations in waters from the Valiñas catchment. Yellow indicates those differences that are not significant, Table S3: p-values from the Kolmogorov-Smirnoff tests comparing the temporal (on a yearly basis) distribution of sodium, potassium, calcium and magnesium concentrations in waters from the Abelar catchment. Yellow indicates those differences that are not significant, Figure S1: Time series seasonal decomposition plots for sodium concentrations at the outlet of the Valiñas catchment during the study period (2003–2016), Figure S2: Time series seasonal decomposition plots for potassium concentrations at the outlet of the Valiñas catchment during the study period (2003–2016), Figure S3: Time series seasonal decomposition plots for calcium concentrations at the outlet of the Valiñas catchment during the study period (2003–2016), Figure S4: Time series seasonal decomposition plots for magnesium concentrations at the outlet of the Valiñas catchment during the study period (2003–2016), Figure S5: Time series seasonal decomposition plots for sodium concentrations at the outlet of the Abelar catchment during the study period (2003–2016), Figure S6: Time series seasonal decomposition plots for potassium concentrations at the outlet of the Abelar catchment during the study period (2003–2016), Figure S7: Time series seasonal decomposition plots for calcium concentrations at the outlet of the Abelar catchment during the study period (2003–2016), Figure S8: Time series seasonal decomposition plots for magnesium concentrations at the outlet of the Abelar catchment during the study period (2003–2016).

Author Contributions

Conceptualization, A.P.-G.; methodology, A.P.-G.; validation, R.d.S.D., J.M.M.-A. and A.P.-G.; formal analysis, J.M.M.-A.; investigation, R.d.S.D.; resources, A.P.-G.; data curation, R.d.S.D., J.M.M.-A. and A.P.-G.; writing—original draft preparation, J.M.M.-A.; writing—review and editing, R.d.S.D., J.M.M.-A. and A.P.-G.; supervision, A.P.-G.; project administration, A.P.-G.; funding acquisition, A.P.-G. All authors have read and agreed to the published version of the manuscript.

Funding

This research received no external funding.

Data Availability Statement

The data presented in this study are available on request from the corresponding author.

Conflicts of Interest

The authors declare no conflict of interest. The funders had no role in the design of the study; in the collection, analyses, or interpretation of data; in the writing of the manuscript, or in the decision to publish the results.

References

  1. Meybeck, M.; Helmer, R. The quality of rivers: From pristine stage to global pollution. Palaeogeogr. Palaeoclim. Palaeoecol. 1989, 75, 283–309. [Google Scholar] [CrossRef]
  2. Gwenzi, W.; Chinyama, S.R.; Togarepi, S. Concentration-discharge patterns in a small urban headwater stream in a seasonally dry water-limited tropical environment. J. Hydrol. 2017, 550, 12–25. [Google Scholar] [CrossRef]
  3. Musolff, A.; Fleckenstein, J.H.; Rao, P.S.C.; Jawitz, J.W. Catchment controls on solute export. Ad. Water Resour. 2015, 86, 133–146. [Google Scholar] [CrossRef]
  4. Moatar, F.; Abbott, B.W.; Minaudo, C.; Curie, F.; Pinay, G. Elemental properties, hydrology, and biology interact to shape concentration-discharge curves for carbon, nutrients, sediment and major ions. Water Resour. Res. 2017, 53, 1270–1287. [Google Scholar] [CrossRef]
  5. Hunsaker, C.T.; Johnson, D.W. Concentration-discharge relationships in headwater streams of the Sierra Nevada, California. Water Resour. Res. 2017, 53, 7869–7884. [Google Scholar] [CrossRef]
  6. Abbott, B.W.; Baranov, V.; Mendoza-Lera, C.; Nikolakopoulou, M.; Harjung, A.; Kolbe, T.; Balasubramanian, M.N.; Vaessen, T.N.; Ciocca, F.; Campeau, A.; et al. Using multi-tracer inference to move beyond single-catchment ecohydrology. Earth Sci. Rev. 2016, 160, 19–42. [Google Scholar] [CrossRef] [Green Version]
  7. Turner, R.E.; Rabalais, N.N. Changes in Mississippi River water quality this century. BioScience 1991, 41, 140–147. [Google Scholar] [CrossRef]
  8. Godsey, S.E.; Kirchner, J.W.; Clow, D.W. Concentration-discharge relationships reflect chemostatic characteristics of US catchments. Hydrol. Process. 2009, 23, 1844–1864. [Google Scholar] [CrossRef]
  9. Brooks, P.D.; Chorover, J.; Fan, Y.; Godsey, S.E.; Maxwell, R.M.; McNamara, J.P.; Tague, C. Hydrological partitioning in the critical zone: Recent advances and opportunities for developing transferable understanding of water cycle dynamics. Water Resour. Res. 2015, 51, 6973–6987. [Google Scholar] [CrossRef] [Green Version]
  10. Baronas, J.; Torres, M.; Clark, K.; West, A. Mixing as a driver of temporal variations in river hydrochemistry: 2. Major and trace element concentration dynamics in the Andes-Amazon. Water Resour. Res. 2017, 53, 3120–3145. [Google Scholar] [CrossRef]
  11. Botter, M.; Burlando, P.; Fatichi, S. Anthropogenic and catchment characteristic signatures in the water quality of Swiss Rivers: A quantitative assessment. Hydrol. Earth Syst. Sci. 2019, 23, 1885–1904. [Google Scholar] [CrossRef] [Green Version]
  12. Zucca, C.; Canu, A.; Previtali, F. Soil degradation by land use change in an agropastoral area in Sardinia (Italy). Catena 2010, 83, 46–54. [Google Scholar] [CrossRef]
  13. Moreda-Piñeiro, J.; Alonso-Rodríguez, E.; Moscoso-Pérez, C.; Blanco-Heras, G.; Turnes-Carou, I.; López-Mahía, P.; Muniategui-Lorenzo, S.; Prada-Rodríguez, D. Influence of marine, terrestrial and anthropogenic sources on ionic and metallic composition of rainwater at a suburban site (northwest coast of Spain). Atmos. Environ. 2014, 88, 30–38. [Google Scholar] [CrossRef]
  14. Silva, B.; Rivas, T.; García-Rodeja, E.; Prieto, B. Distribution of ions of marine origin in Galicia (NW Spain) as a function of distance from the sea. Atmos. Environ. 2007, 41, 4396–4407. [Google Scholar] [CrossRef]
  15. Skowron, P.; Skowrońska, M.; Bronowicka-Mielniczuk, U.; Filipek, T.; Igras, J.; Kowalczyk-Juśko, A.; Krzepiłko, A. Anthropogenic sources of potassium in surface water: The case study of the Bystrzyca river catchment, Poland. Agric. Ecosys. Environ. 2018, 265, 454–460. [Google Scholar] [CrossRef]
  16. Antelo-Cortizas, J.M.; Arce-Vázquez, F. Características fisicoquímicas das augas superficiais. In As Augas de Galicia; Díaz Fierros, F., Ed.; Consello da Cultura Galega: Xunta de Galicia, Santiago de Compostela, Spain, 1996; pp. 351–446. [Google Scholar]
  17. Makeyev, A.O.; Berkgaut, V.V. Weathering of silicates as a source of mineral nutrients for plants (as exemplified by soils with a texturally-differentiated profile of the Komi ASSR). Sov. Soil Sci. 1989, 21, 42–52. [Google Scholar]
  18. Calvo de Anta, R.; Macias, F. Influence of geological material in the composition of Surface waters in Galicia (NW Spain). Genesis of clay minerals. Clay Miner. 1993, 28, 285–296. [Google Scholar] [CrossRef]
  19. Sande-Fouz, P.; Mirás-Avalos, J.M.; Vidal-Vázquez, E. Temporal oscillations of calcium, magnesium, potassium, and sodium dissolved contents in an agroforestry catchment from the Atlantic Galicia. Comm. Soil Sci. Plant Anal. 2012, 43, 280–287. [Google Scholar] [CrossRef]
  20. Sande-Fouz, P.; Mirás-Avalos, J.M.; Vidal-Vázquez, E.; Paz-González, A. Phosphorus contents and loads at the outlet of an agroforestry catchment. Comm. Soil Sci. Plant Anal. 2009, 40, 660–671. [Google Scholar] [CrossRef]
  21. Mirás-Avalos, J.M.; Mestas-Valero, R.M.; Sande-Fouz, P.; Paz-González, A. Consistency analysis of pluviometric information in Galicia (NW Spain). Atmos. Res. 2009, 94, 629–640. [Google Scholar] [CrossRef]
  22. Rodríguez-Suárez, J.A.; Soto, B.; Pérez, R.; Díaz-Fierros, F. Influence of Eucalyptus globulus plantation growth on water table levels and low flows in a small catchment. J. Hydrol. 2011, 396, 321–326. [Google Scholar] [CrossRef]
  23. Rodríguez-Suárez, J.A.; Díaz-Fierros, F.; Pérez, R.; Soto, B. Assessing the influence of afforestation with Eucalyptus globulus on hydrological response from a small catchment in northwestern Spain using the HBV hydrological model. Hydrol. Process. 2014, 28, 5561–5572. [Google Scholar] [CrossRef]
  24. Kronvang, B.; Bruhn, A.J. Choice of sampling strategy and estimation method for calculating nitrogen and phosphorus transport in small lowland streams. Hydrol. Proces. 1996, 10, 1483–1501. [Google Scholar] [CrossRef]
  25. Grismer, M.E. Stream sediment and nutrient loads in the Tahoe Basin: Estimated versus monitored loads for TMDL “crediting”. Environ. Monitor. Assess. 2013, 185, 7883–7894. [Google Scholar] [CrossRef]
  26. Cantarero, A.; López, M.B.; Mahía, J.; Maestro, M.A.; Paz, A. Determination of total and dissolved phosphorus in agricultural runoff samples by ICP-MS. Comm. Soil Sci. Plant Anal. 2002, 33, 3431–3436. [Google Scholar] [CrossRef]
  27. Samper, J.; Huguet, L.l.; Ares, J.; García Vera, M.A. Manual del Usuario del Programa VISUAL BALAN v.1.0: Código Interactivo Para la Realización de Balances Hidrológicos y la Estimación de la Recarga; Publicación Técnica de ENRESA nº 5/99: Madrid, Spain, 1999; p. 205. Available online: https://inis.iaea.org/collection/NCLCollectionStore/_Public/31/031/31031625.pdf (accessed on 5 April 2021).
  28. Shaw, E.M.; Beven, K.J.; Cappell, N.A.; Lamb, R. Hydrology in Practice, 4th ed.; CRC Press: London, UK, 2011; p. 560. [Google Scholar] [CrossRef]
  29. Samper, J.; García Vera, M.A.; Pisani, B.; Alvares, D.; Varela, A.; Losada, J.A. Modelos Hidrológicos y Sistemas de Información Geográfica para la Estimación de los Recursos Hídricos: Aplicación de GIS-BALAN a Varias Cuencas Españolas. In Estudios de la Zona No Saturada del Suelo; Samper Calvete, F.J., Paz González, A., Eds.; Universidade da Coruña: La Coruña, Spain, 2005; Volume 7, pp. 269–274. Available online: http://zonanosaturada.com/zns05/publications_files/area_4/05.pdf (accessed on 5 April 2021).
  30. Rodríguez-Blanco, M.L.; Taboada-Castro, M.M.; Taboada-Castro, M.T. An assessment of the recent evolution of the streamflow in a near-natural system: A case study in the headwaters of the Mero Basin (Galicia, Spain). Hydrology 2020, 7, 97. [Google Scholar] [CrossRef]
  31. Verstraeten, G.; Poesen, J. Regional scale variability in sediment and nutrient delivery from small agricultural watersheds. J. Environ. Qual. 2002, 31, 870–879. [Google Scholar] [CrossRef]
  32. Meybeck, M.; Moatar, F. Daily variability of river concentrations and fluxes: Indicators based on segmentation of the rating curve. Hydrol. Process. 2012, 26, 1188–1207. [Google Scholar] [CrossRef] [Green Version]
  33. Mangin, A. Pour une meilleure connaissance des systèmes hydrologiques à partir des analyses corrélatoire et spectrale. J. Hydrol. 1984, 67, 25–43. [Google Scholar] [CrossRef]
  34. Mayaud, C.; Wagner, T.; Benischke, R.; Birk, S. Single event time series analysis in a binary karst catchment evaluated using a groundwater model (Lurbach system, Austria). J. Hydrol. 2014, 511, 628–639. [Google Scholar] [CrossRef] [PubMed] [Green Version]
  35. Cepeda Cuervo, E.; Achcar, J.A.; Andrade, M.G. Seasonal hydrological and meteorological time series. Erath Sci. Res. J. 2018, 22, 83–90. [Google Scholar] [CrossRef]
  36. R Core Team. R: A Language and Environment for Statistical Computing; R Foundation for Statistical Computing: Vienna, Austria, 2021; Available online: http://www.R-project.org/ (accessed on 5 April 2021).
  37. Membiela, P.; Montes, C.; Martínez-Ansemil, E. Hydro-chemical characteristics of Galicia rivers (NW Iberian Peninsula). Limnetica 1991, 7, 163–174. [Google Scholar]
  38. Taboada-Castro, M.M.; Rodríguez-Blanco, M.L.; Taboada-Castro, M.T. Assessing the influence of catchment land-use patterns on the nutrients and major ions chemistry of drainage water. Comm. Soil Sci. Plant Anal. 2013, 44, 422–428. [Google Scholar] [CrossRef]
  39. Rial Rivas, M.E. Investigación dos Procesos que Regulan o Caudal e a Calidade das Augas na Bacía do Río Anllóns. Ph.D. Thesis, Universidade de Santiago de Compostela, La Coruña, Spain, 2007. [Google Scholar]
  40. Diéguez, A.; Rodríguez-Blanco, M.L.; Taboada-Castro, M.; Taboada-Castro, M.T. Interrelationships of water quality, nutrients, and major ions in a stream draining a mixed-use catchment, NW Spain. Comm. Soil Sci. Plant Anal. 2012, 43, 95–101. [Google Scholar] [CrossRef]
  41. Wilkinson, J.; Reynolds, B.; Neal, C.; Hills, S.; Neal, M.; Harrow, M. Major, minor and trace element composition of cloudwater and rainwater at Plynlimon. Hydrol. Eartch. Syst. Sci. 1997, 1, 557–569. [Google Scholar] [CrossRef] [Green Version]
  42. Goldich, S.S. A study in rock weathering. J. Geol. 1938, 46, 17–58. [Google Scholar] [CrossRef]
  43. Thompson, S.E.; Basu, N.B.; Lascurain, J.; Aubeneau, A.; Rao, P.S.C. Relative dominance of hydrological versus biogeochemical factors on solute export across impact gradients. Water Resour. Res. 2011, 47, W00J05. [Google Scholar] [CrossRef]
  44. Herdon, E.M.; Dere, A.L.; Sullivan, P.L.; Norris, D.; Reynolds, B.; Brantley, S.L. Landscape heterogeneity drives contrasting concentration-discharge relationships in shale headwater catchments. Hydrol. Earth Syst. Sci. 2015, 19, 3333–3347. [Google Scholar] [CrossRef] [Green Version]
  45. Shanley, J.B.; McDowell, W.H.; Stallard, R.F. Long-term patterns and short-term dynamics of stream solutes and suspended sediment in a rapidly weathering tropical watershed. Water Resour. Res. 2011, 47, W07515. [Google Scholar] [CrossRef]
  46. Thomas, Z.; Abbott, B.W.; Troccaz, O.; Baudry, J.; Pinay, G. Proximate and ultimate controls on carbon and nutrient dynamics of small agricultural catchments. Biogeosciences 2016, 13, 1863–1875. [Google Scholar] [CrossRef] [Green Version]
  47. Balerna, J.A.; Melone, J.C.; Knee, K.L. Using concentration-discharge relationships to identify influences on surface and subsurface water chemistry along a watershed urbanization gradient. Water 2021, 13, 662. [Google Scholar] [CrossRef]
  48. Holmes, R.M.; McClelland, J.W.; Peterson, B.J.; Tank, S.E.; Bulygina, E.; Eglinton, T.I.; Gordeev, V.V.; Gurtovaya, T.Y.; Raymond, P.A.; Repeta, D.J.; et al. Seasonal and annual fluxes of nutrients and organic matter from large rivers to the Arctic Ocean and surrounding seas. Estuaries Coasts 2012, 35, 369–382. [Google Scholar] [CrossRef]
  49. Botter, M.; Li, L.; Hartmann, J.; Burlando, P.; Fatichi, S. Depth of solute generation is a dominant control on concentration-discharge relations. Water Resour. Res. 2020, 56, e2019WR026695. [Google Scholar] [CrossRef]
  50. Diamond, J.S.; Cohen, M.J. Complex patterns of catchment solute-discharge relationships for coastal plain rivers. Hydrol. Process. 2018, 32, 388–401. [Google Scholar] [CrossRef]
  51. Creed, I.F.; McKnight, D.M.; Pellerin, B.A.; Green, M.B.; Bergamaschi, B.A.; Aiken, G.R.; Burns, D.A.; Findlay, S.E.G.; Shanley, J.B.; Striegl, R.G.; et al. The river as a chemostat: Fresh perspectives on dissolved organic matter flowing down the river continuum. Can. J. Fish. Aquat. Sci. 2015, 72, 1272–1285. [Google Scholar] [CrossRef] [Green Version]
  52. Hornberger, G.M.; Scanlon, T.M.; Raffensperger, J.P. Modelling transport of dissolved silica in a forested headwater catchment: The effect of hydrological and chemical time scales on hysteresis in the concentration-discharge relationship. Hydrol. Process. 2001, 15, 2029–2038. [Google Scholar] [CrossRef]
  53. Strohmeier, S.; Knorr, K.H.; Reichert, M.; Frei, S.; Fleckenstein, J.H.; Peiffer, S.; Matzner, E. Concentrations and fluxes of dissolved organic carbon in runoff from a forested catchment: Insights from high frequency measurements. Biogeosciences 2013, 10, 905–916. [Google Scholar] [CrossRef] [Green Version]
Figure 1. Location of the studied catchments (yellow marks) in the northwest of Spain.
Hydrology 08 00096 g001
Figure 2. Monthly rainfall (mm) registered at Alvedro meteorological stations during the studied years and for the period 1981–2010 (dotted red line). Annual values are also shown (black line).
Hydrology 08 00096 g002
Figure 3. Monthly rainfall (mm) registered at O Abelar meteorological station during the studied years and in the period 1981–2010 (dotted red line) for the meteorological station of Santiago. Annual values are also shown (black line).
Hydrology 08 00096 g003
Figure 4. Boxplots of discharge by month for the (a) Valiñas and (b) Abelar catchments over the studied period (2003–2016 in Valiñas and 2007–2016 in Abelar). The horizontal middle line indicates the median; the lower and upper edges of the box indicate the 25 and 75% points, respectively; the whiskers indicate the main body of data (without outliers); circles indicate outliers.
Hydrology 08 00096 g004
Figure 5. Temporal evolution (a) of the monthly concentration of sodium, potassium, calcium, and magnesium in water samples of the Valiñas catchment. Autocorrelation functions (ACF) for the four studied macronutrients (b).
Hydrology 08 00096 g005
Figure 6. Temporal evolution (a) of the monthly concentration of sodium, potassium, calcium, and magnesium in water samples of the Abelar catchment. Autocorrelation functions (ACF) for the four studied macronutrients (b).
Hydrology 08 00096 g006
Figure 7. Concentration-discharge relationships for (a) sodium, (b) potassium, (c) calcium and (d) magnesium in the Valiñas catchment. Regression equations and coefficients are shown.
Hydrology 08 00096 g007
Figure 8. Log [concentration]–Log [discharge] plots for (a) sodium, (b) potassium, (c) calcium and (d) magnesium in the Valiñas catchment. Regression equations and coefficients are displayed separately for those data below and above the median flow.
Hydrology 08 00096 g008
Figure 9. Concentration-discharge relationships for (a) sodium, (b) potassium, (c) calcium and (d) magnesium in the Abelar catchment. Regression equations and coefficients are shown.
Hydrology 08 00096 g009
Figure 10. Log [concentration]–Log [discharge] plots for (a) sodium, (b) potassium, (c) calcium and (d) magnesium in the Abelar catchment. Regression equations and coefficients are displayed separately for those data below and above the median flow.
Hydrology 08 00096 g010
Table 1. Statistical summary of the sodium, potassium, calcium and magnesium concentrations in water samples from Valiñas and Abelar catchments over the whole study period (2003–2016 for Valiñas and 2007–2016 for Abelar). Number of samples was 984 and 391 in Valiñas and Abelar, respectively.
SoluteMeanMedianMinimumMaximumSkewnessKurtosisCoefficient of Variation
mg L−1 %
Valiñas
Sodium16.4516.108.9027.200.47−0.1216.67
Potassium2.622.301.1313.493.3216.6443.56
Calcium7.887.554.4720.701.334.7021.53
Magnesium4.113.982.157.300.670.0519.42
Abelar
Sodium8.158.283.6523.205.1875.2014.13
Potassium0.910.570.21104.0019.63387.24576.53
Calcium2.852.761.349.403.0026.4822.84
Magnesium3.433.441.627.201.079.9215.17
Table 2. Pearson’s r correlation coefficients among discharge and solute concentrations for the whole dataset from each of the two studied catchments (Valiñas and Abelar). In the case of Abelar, the correlations are shown for both the entire dataset and by removing a single outlier.
PairValiñas 1Abelar
Complete DatasetRemoving Outliers
Discharge vs. Sodium−0.58 ***−0.25 ***−0.31 ***
Discharge vs. Potassium−0.20 ***0.01 NS0.48 ***
Discharge vs. Calcium−0.44 ***0.47 ***0.56 ***
Discharge vs. Magnesium−0.60 ***0.01 NS0.02 NS
Sodium vs. Potassium0.44 ***0.65 ***−0.12 *
Sodium vs. Calcium0.74 ***0.52 ***0.28 ***
Sodium vs. Magnesium0.92 ***0.80 ***0.80 ***
Potassium vs. Calcium0.64 ***0.53 ***0.46 ***
Potassium vs. Magnesium0.44 ***0.37 ***0.12 *
Calcium vs. Magnesium0.77 ***0.68 ***0.61 ***
1 The significance of the correlation coefficients is indicated: NS not significant; * significant at p < 0.05; *** significant at p < 0.001.
Table 3. Average concentrations (mg L−1) of sodium, potassium, calcium and magnesium on a seasonal basis for the Valiñas and Abelar catchments.
SoluteSeason
SpringSummerAutumnWinter
Valiñas
Sodium15.9219.0716.4415.19
Potassium2.263.313.012.13
Calcium7.539.038.416.92
Magnesium3.914.934.163.67
Abelar
Sodium8.288.058.198.08
Potassium0.610.452.120.84
Calcium2.942.373.033.20
Magnesium3.593.183.393.59
Table 4. Macronutrient loads (kg ha−1) for the spring-summer and autumn-winter periods, as well as the annual load, of the studied years in both Valiñas and Abelar catchments. Avg. = average.
CatchmentYearSodiumPotassiumCalciumMagnesium
Spring
Summer
Autumn
Winter
AnnualSpring
Summer
Autumn
Winter
AnnualSpring
Summer
Autumn
Winter
AnnualSpring
Summer
Autumn
Winter
Annual
Valiñas200324.0369.3193,333.4410.3013.7411.3931.4242.815.9816.9522.93
200417.4147.3464,742.566.108.717.7622.6530.414.2511.4515.70
200516.6449.5166,152.407.449.837.5923.3630.954.0612.4316.49
200618.3980.8999,282.3113.3815.698.8439.6348.474.7619.6324.39
200722.9539.0261,973.145.788.9210.4718.6029.075.959.9315.88
200829.1853.1582,325.4610.1915.6515.2729.3144.586.7712.9719.74
200919.6257.3276,943.139.5012.649.6128.0937.705.0213.9718.99
201025.6173.5599,163.7010.8814.5912.1833.8946.076.5017.5324.03
201115.4946.4361,922.137.729.846.9321.9528.883.9111.1615.07
201219.2741.3160,582.756.709.459.1119.3428.454.7510.3015.05
201323.9068.4692,363.3512.7416.0911.0633.2844.346.0516.9523.00
201418.4048.4066,802.587.6510.228.0822.3730.454.6611.4316.09
201516.0041.1757,172.566.028.587.6218.7226.344.009.7013.70
201627.7869.5197,293.7810.3614.1411.9730.5642.536.9017.5824.48
Avg.21.0556.1077,143.098.9112.019.8526.6636.505.2513.7118.97
Abelar200710.0332.8042.831.043.985.023.4214.1917.614.3615.4519.80
200818.5122.2340.751.4119.4020.816.808.8515.658.119.4017.50
200914.1065.4379.530.849.3510.194.6928.5833.276.2730.1536.41
201017.0768.0985.161.658.6310.287.6332.6740.307.8631.3339.19
20116.6642.7349.400.435.235.662.2417.5519.792.8318.5621.39
201212.4126.8139.231.082.333.414.3710.4514.825.3211.7417.07
201318.5770.4989.061.988.1610.147.5231.3938.917.6530.0037.65
20149.9966.6776.660.737.778.503.2528.8132.054.1326.9831.10
20159.8441.2351.080.683.594.273.1815.8519.033.7816.5120.29
201621.1857.6878.861.774.896.667.6320.6328.268.3222.7931.11
Avg.13.8449.4263.251.167.338.495.0720.9025.975.8621.2927.15
Publisher’s Note: MDPI stays neutral with regard to jurisdictional claims in published maps and institutional affiliations.

