
A GIS-Cellular Automata-Based Model for Coupling Urban Sprawl and Flood Susceptibility Assessment


 , ,
, ,  ,
, 
Abstract
:1. Introduction
2. Materials and Methods
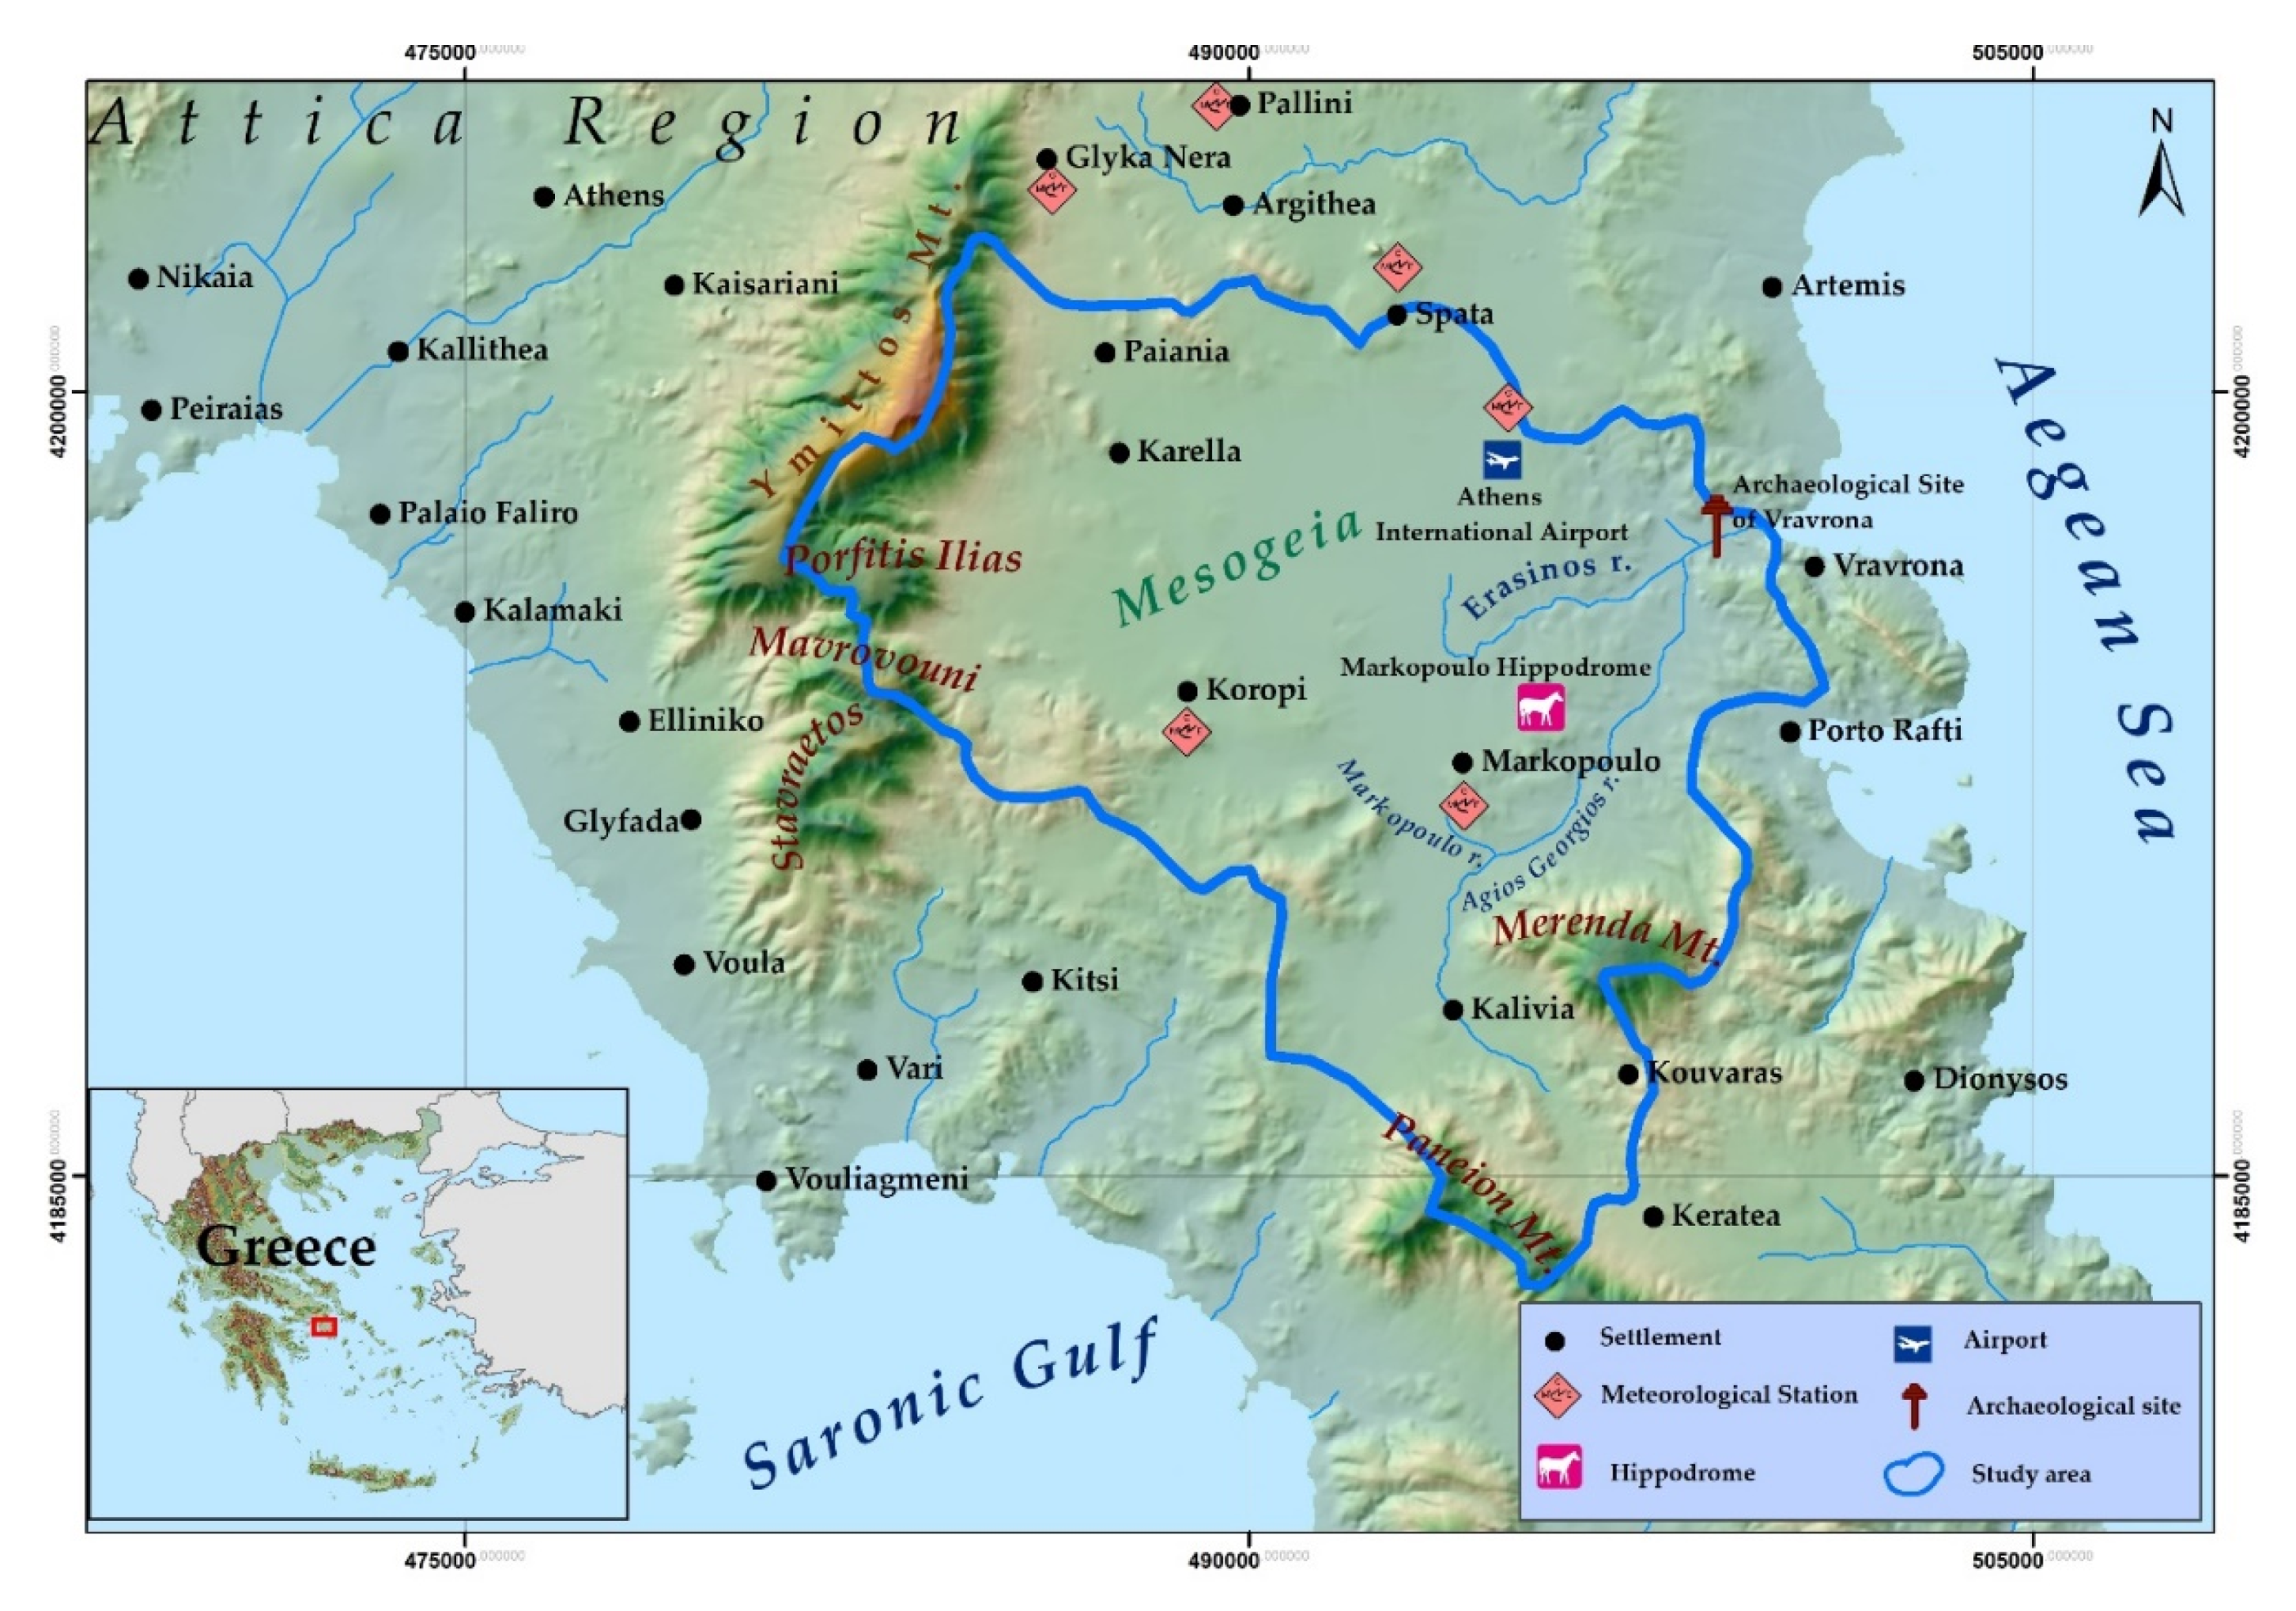
2.1. Study Area
2.2. Data
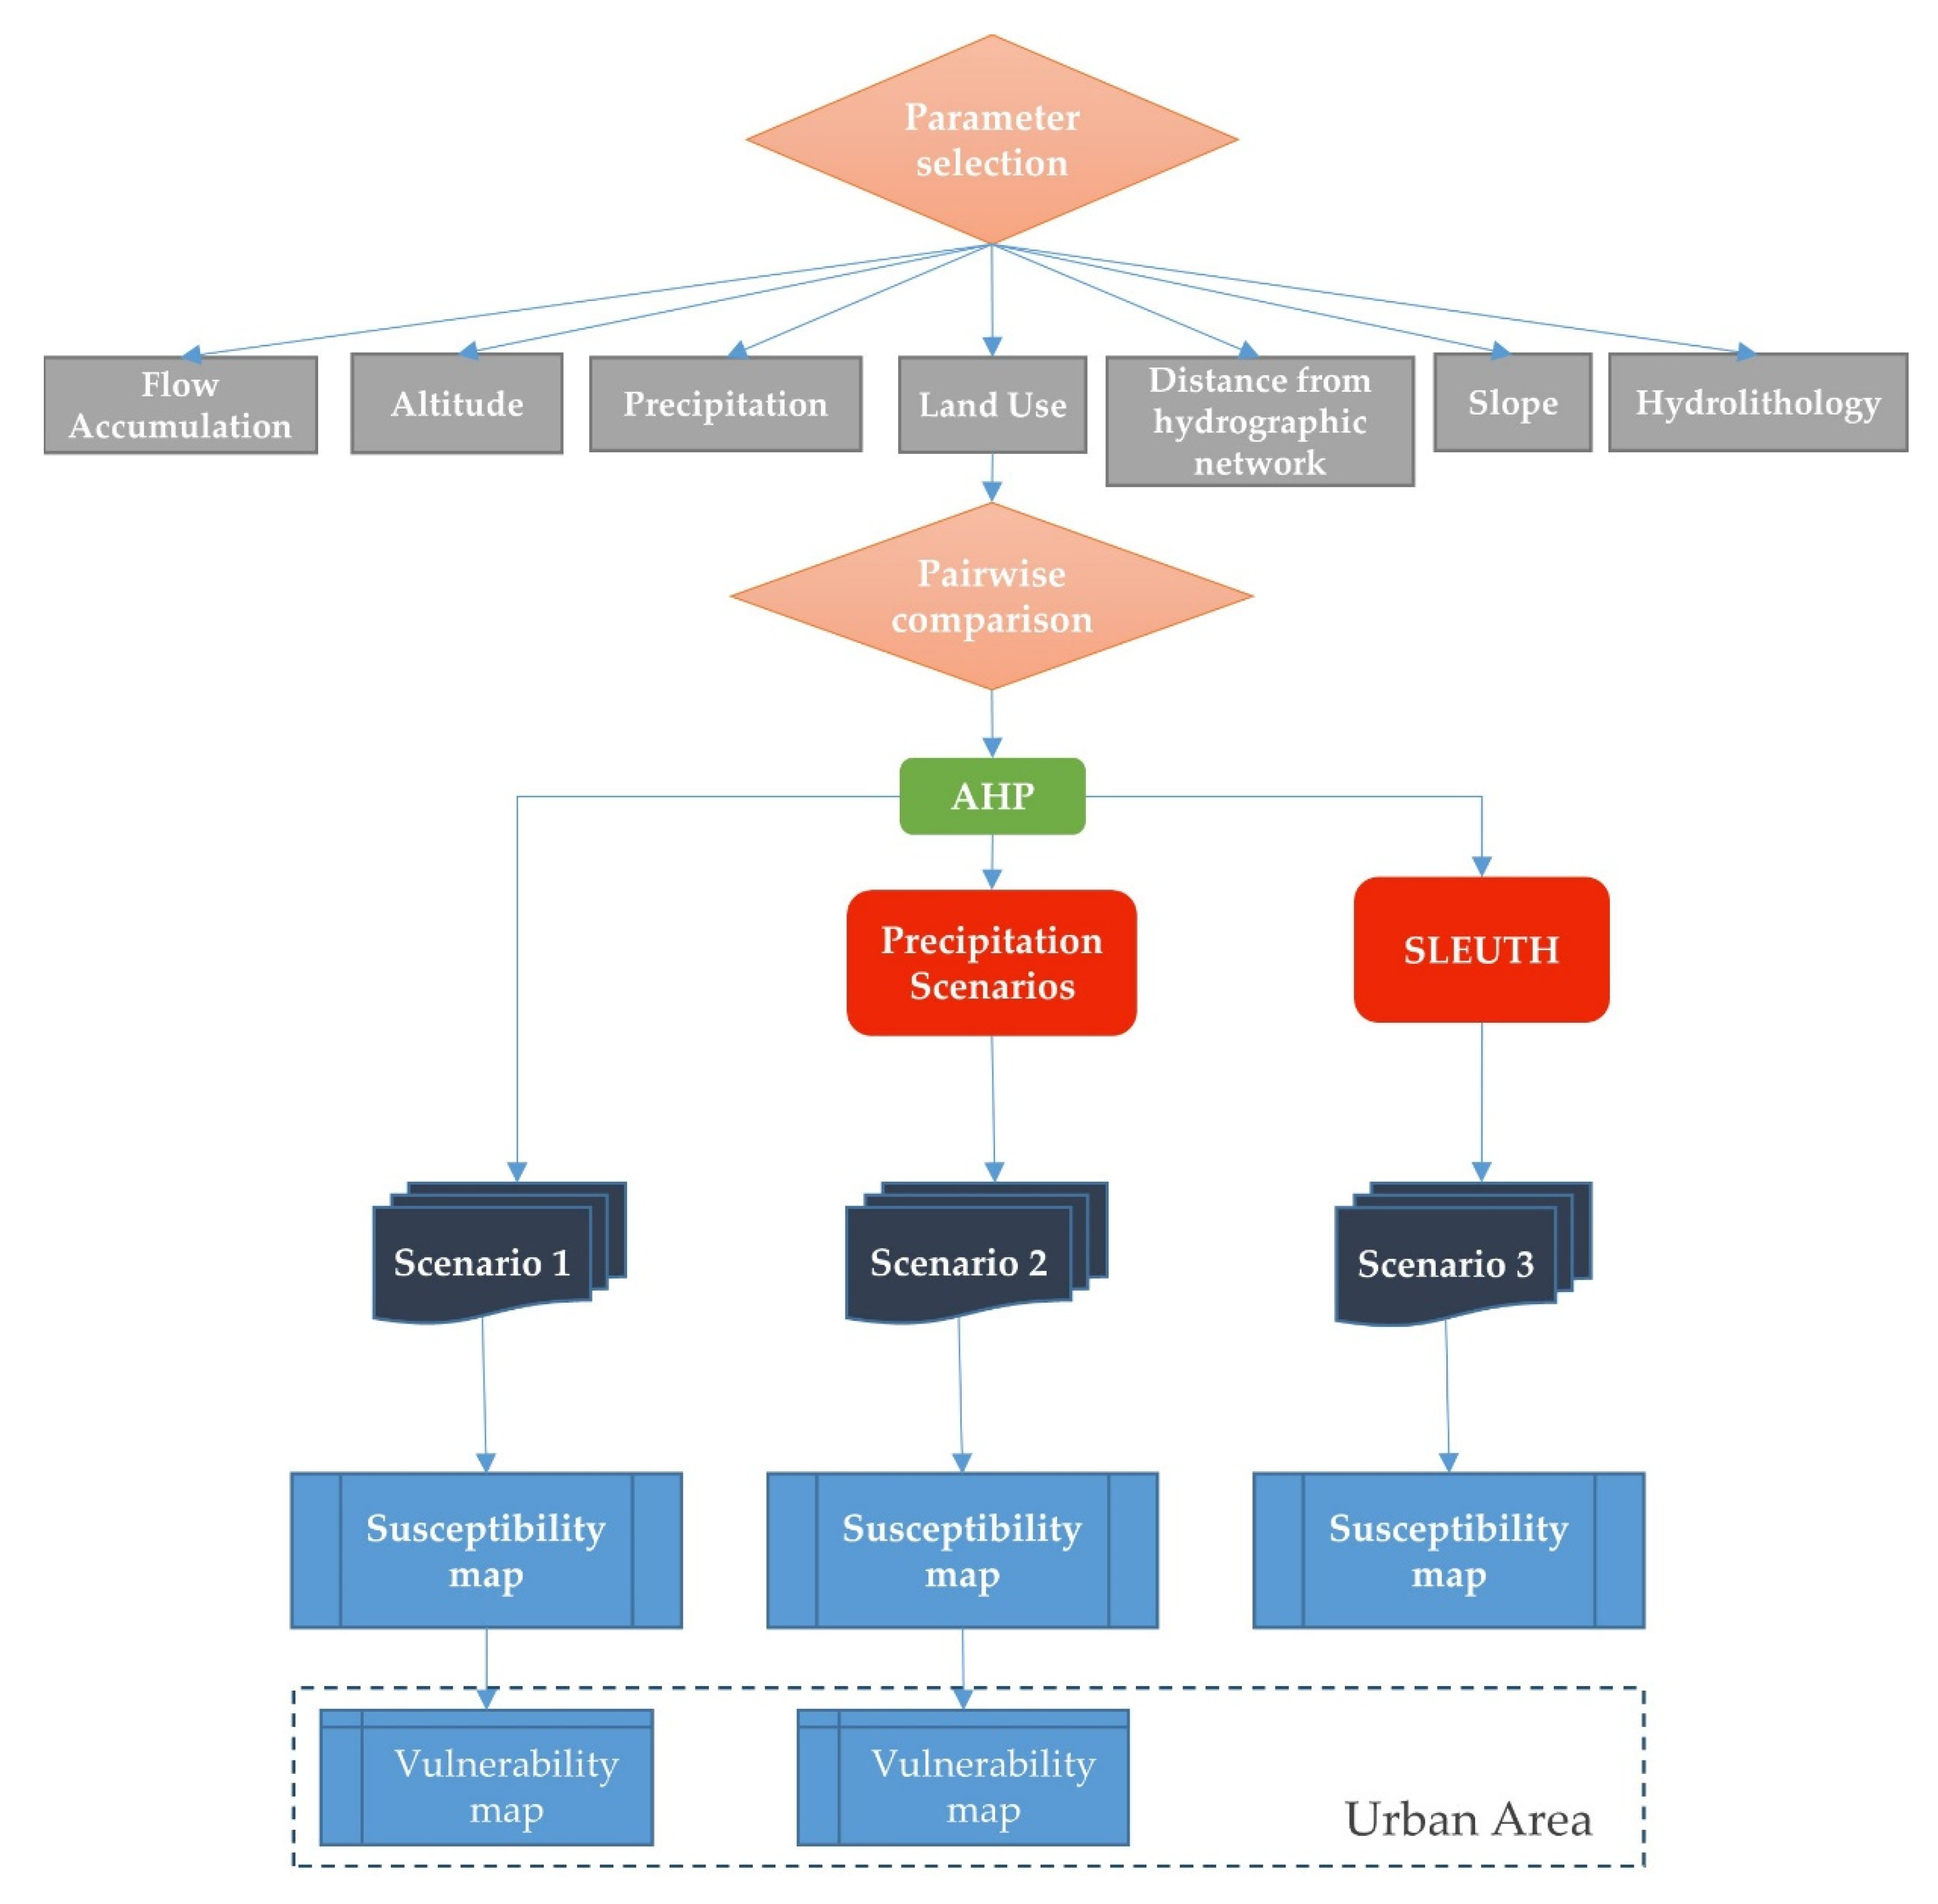
2.3. Methodological Framework
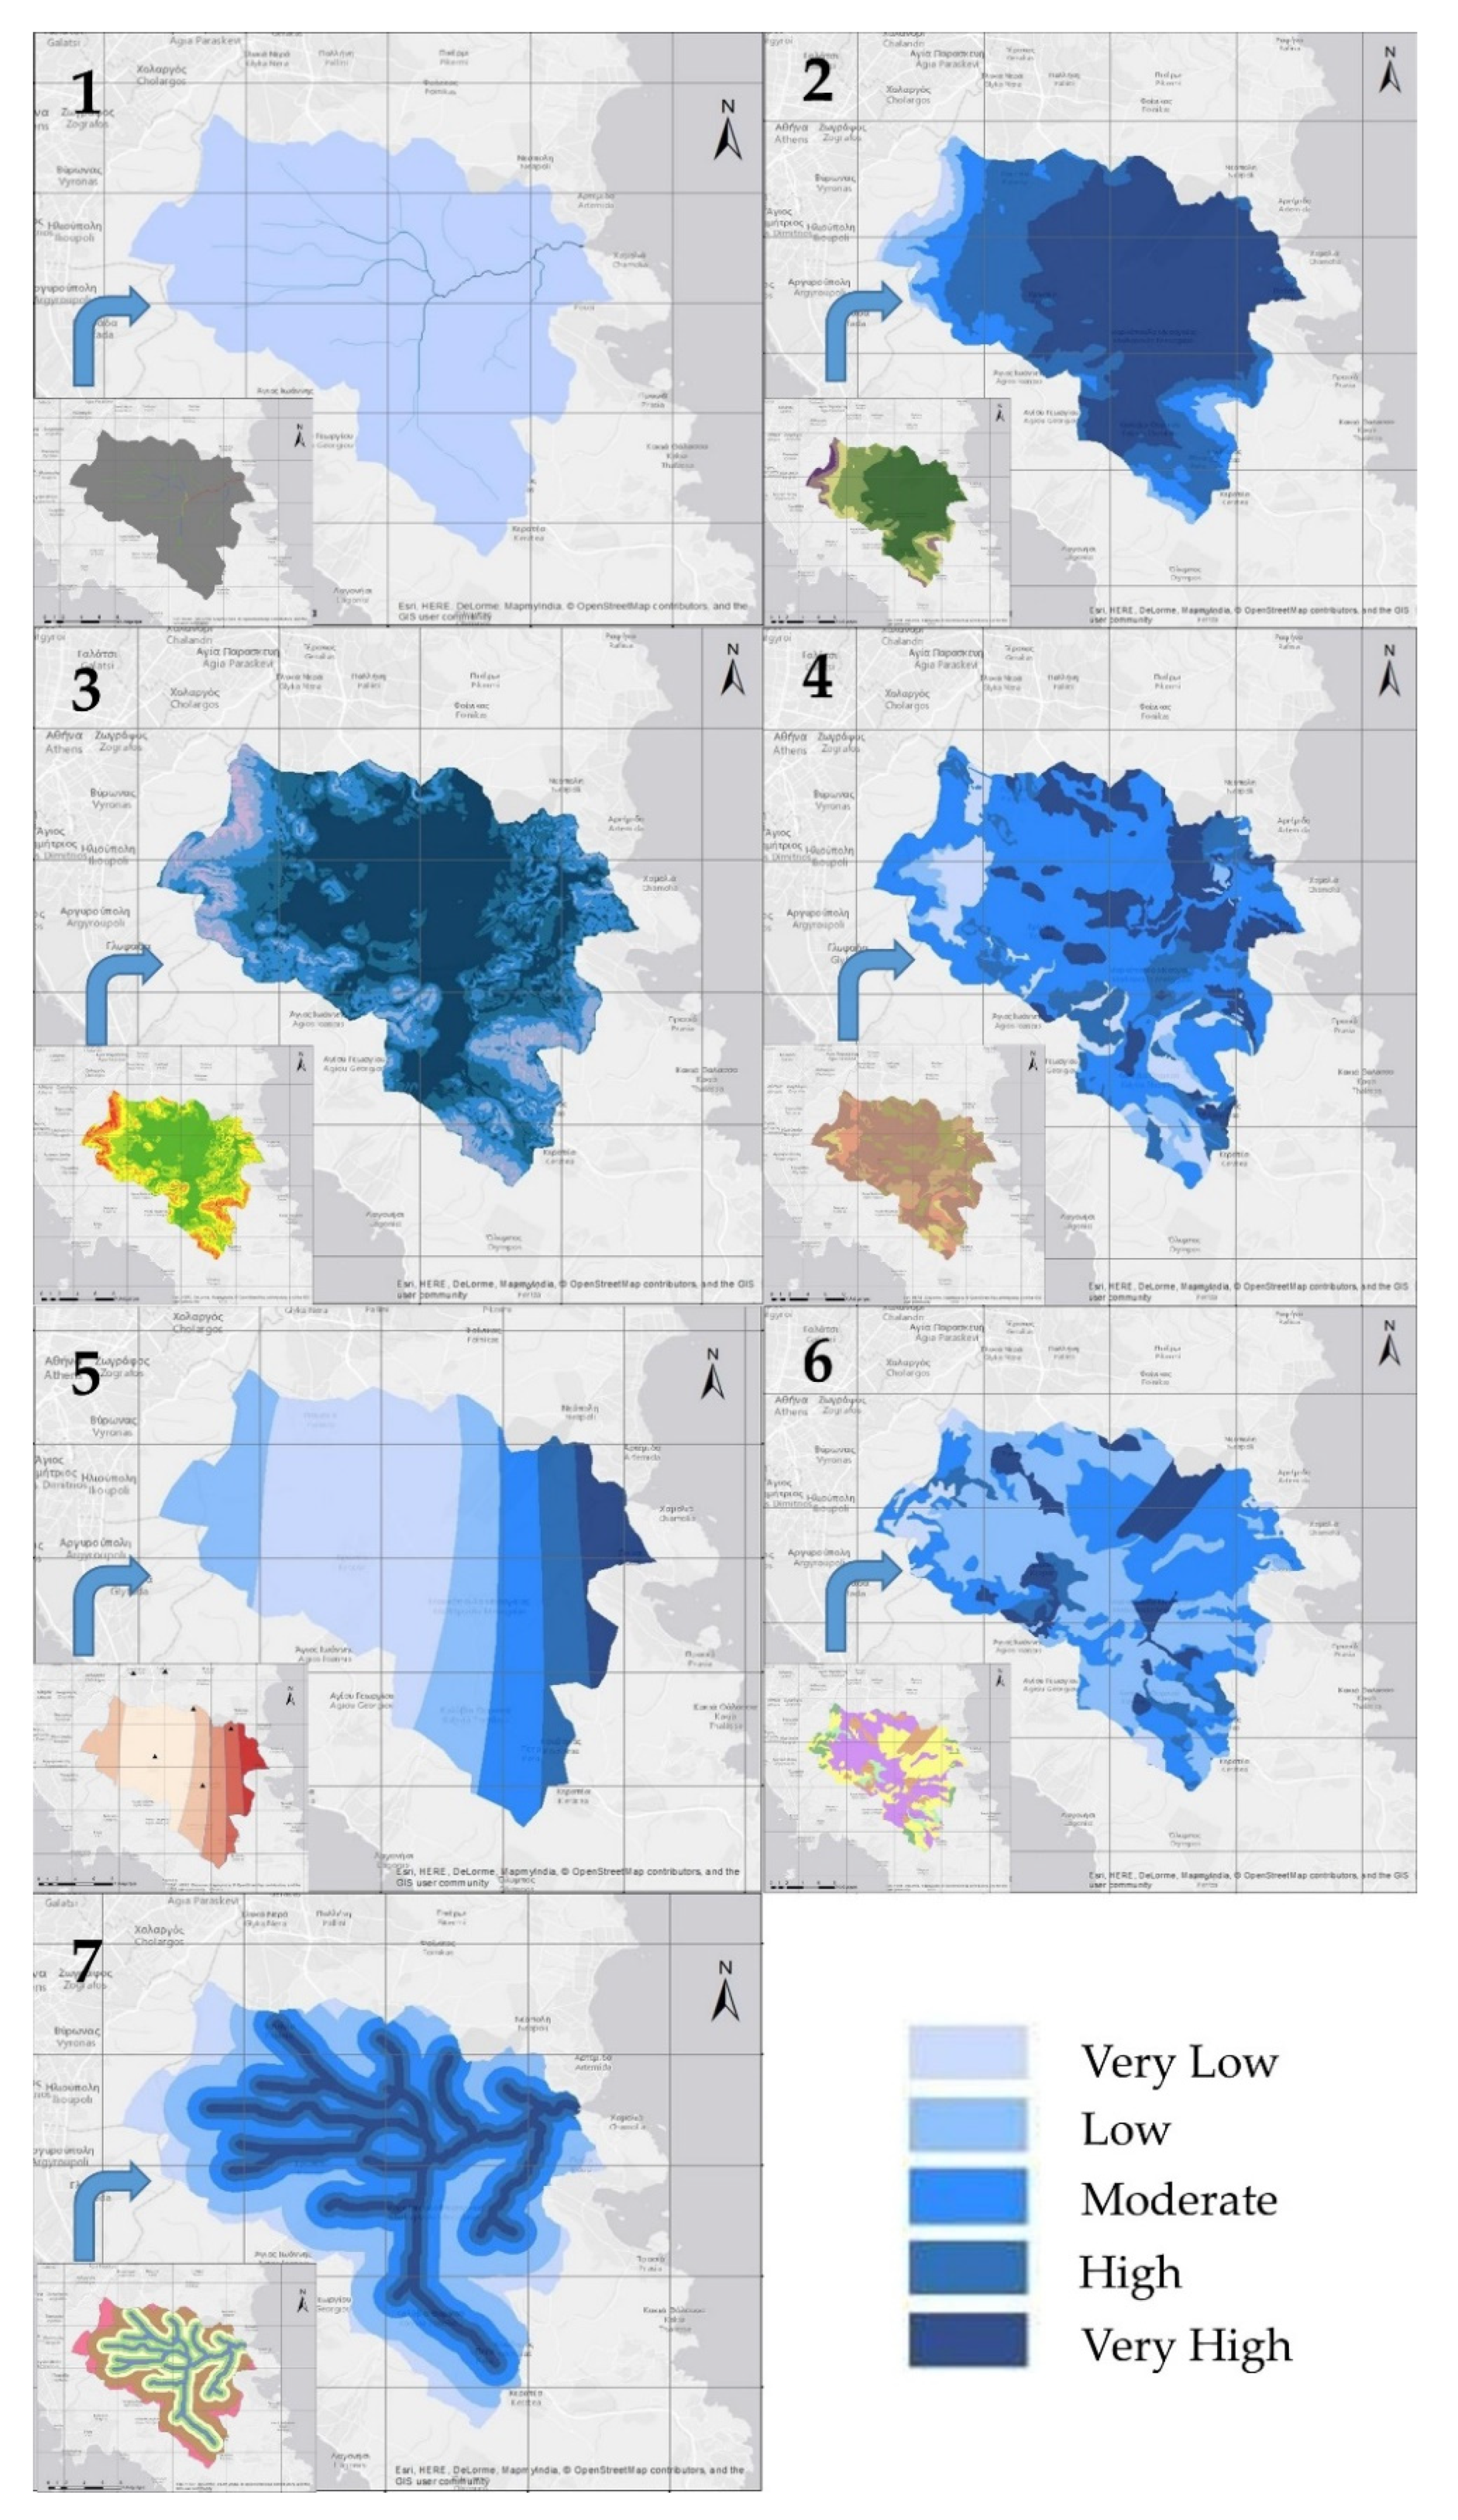
2.3.1. The AHP Model
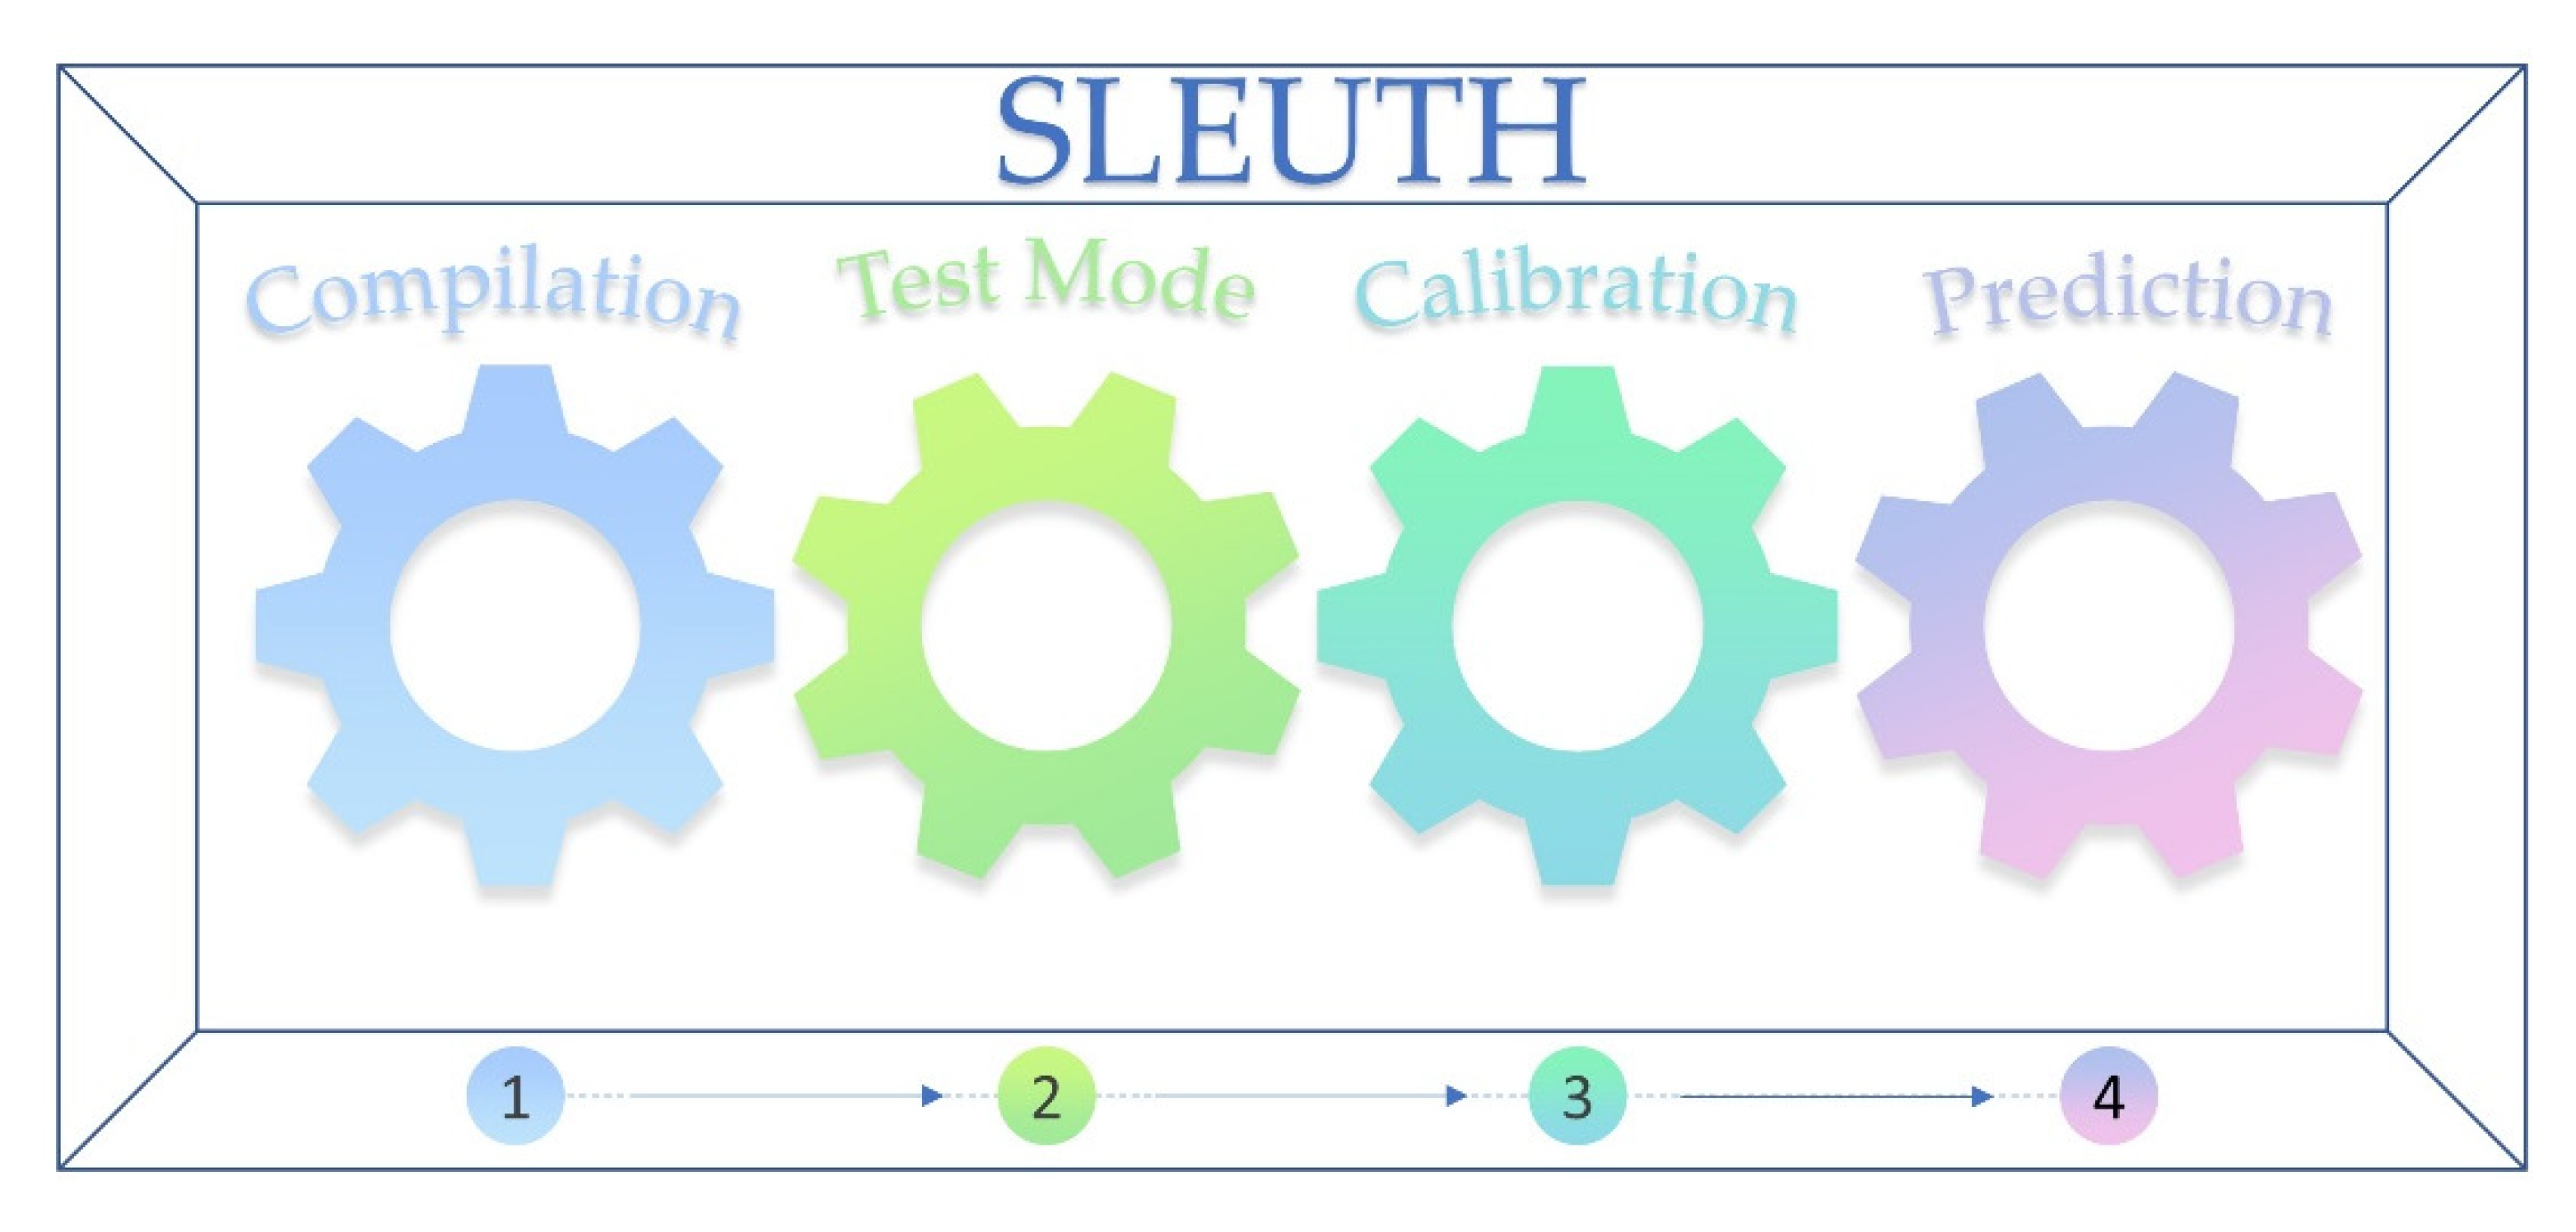
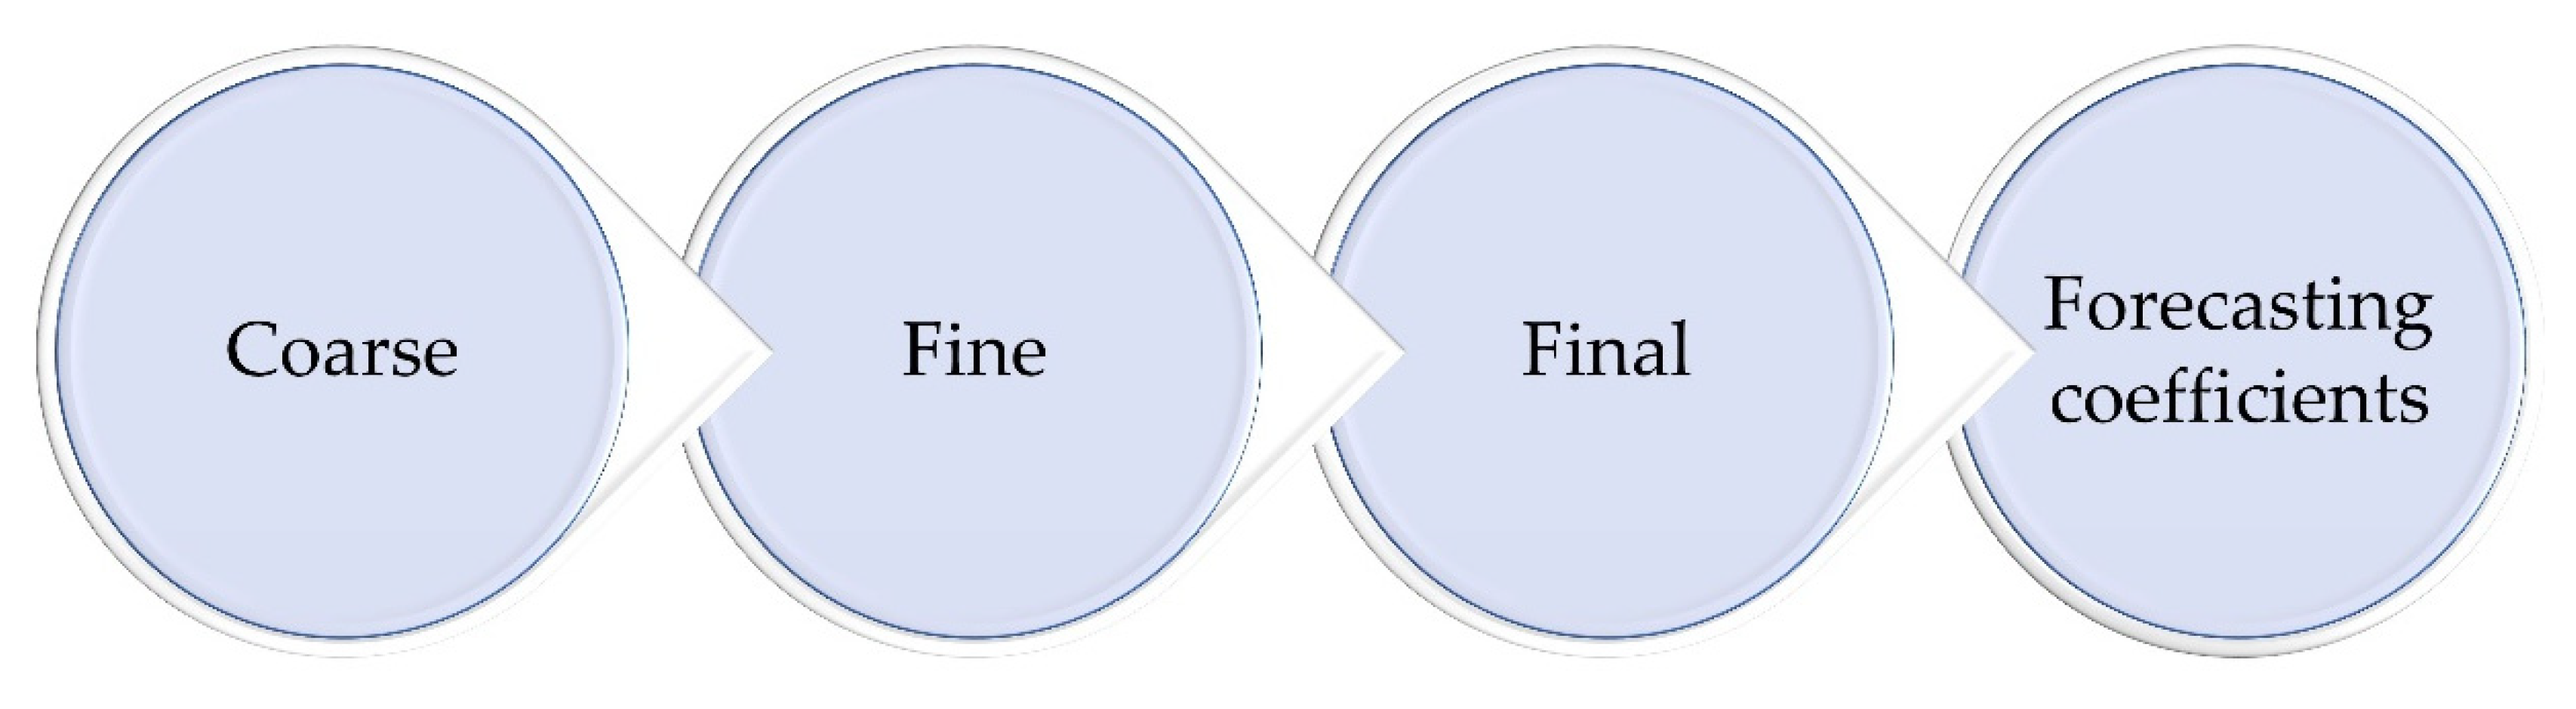
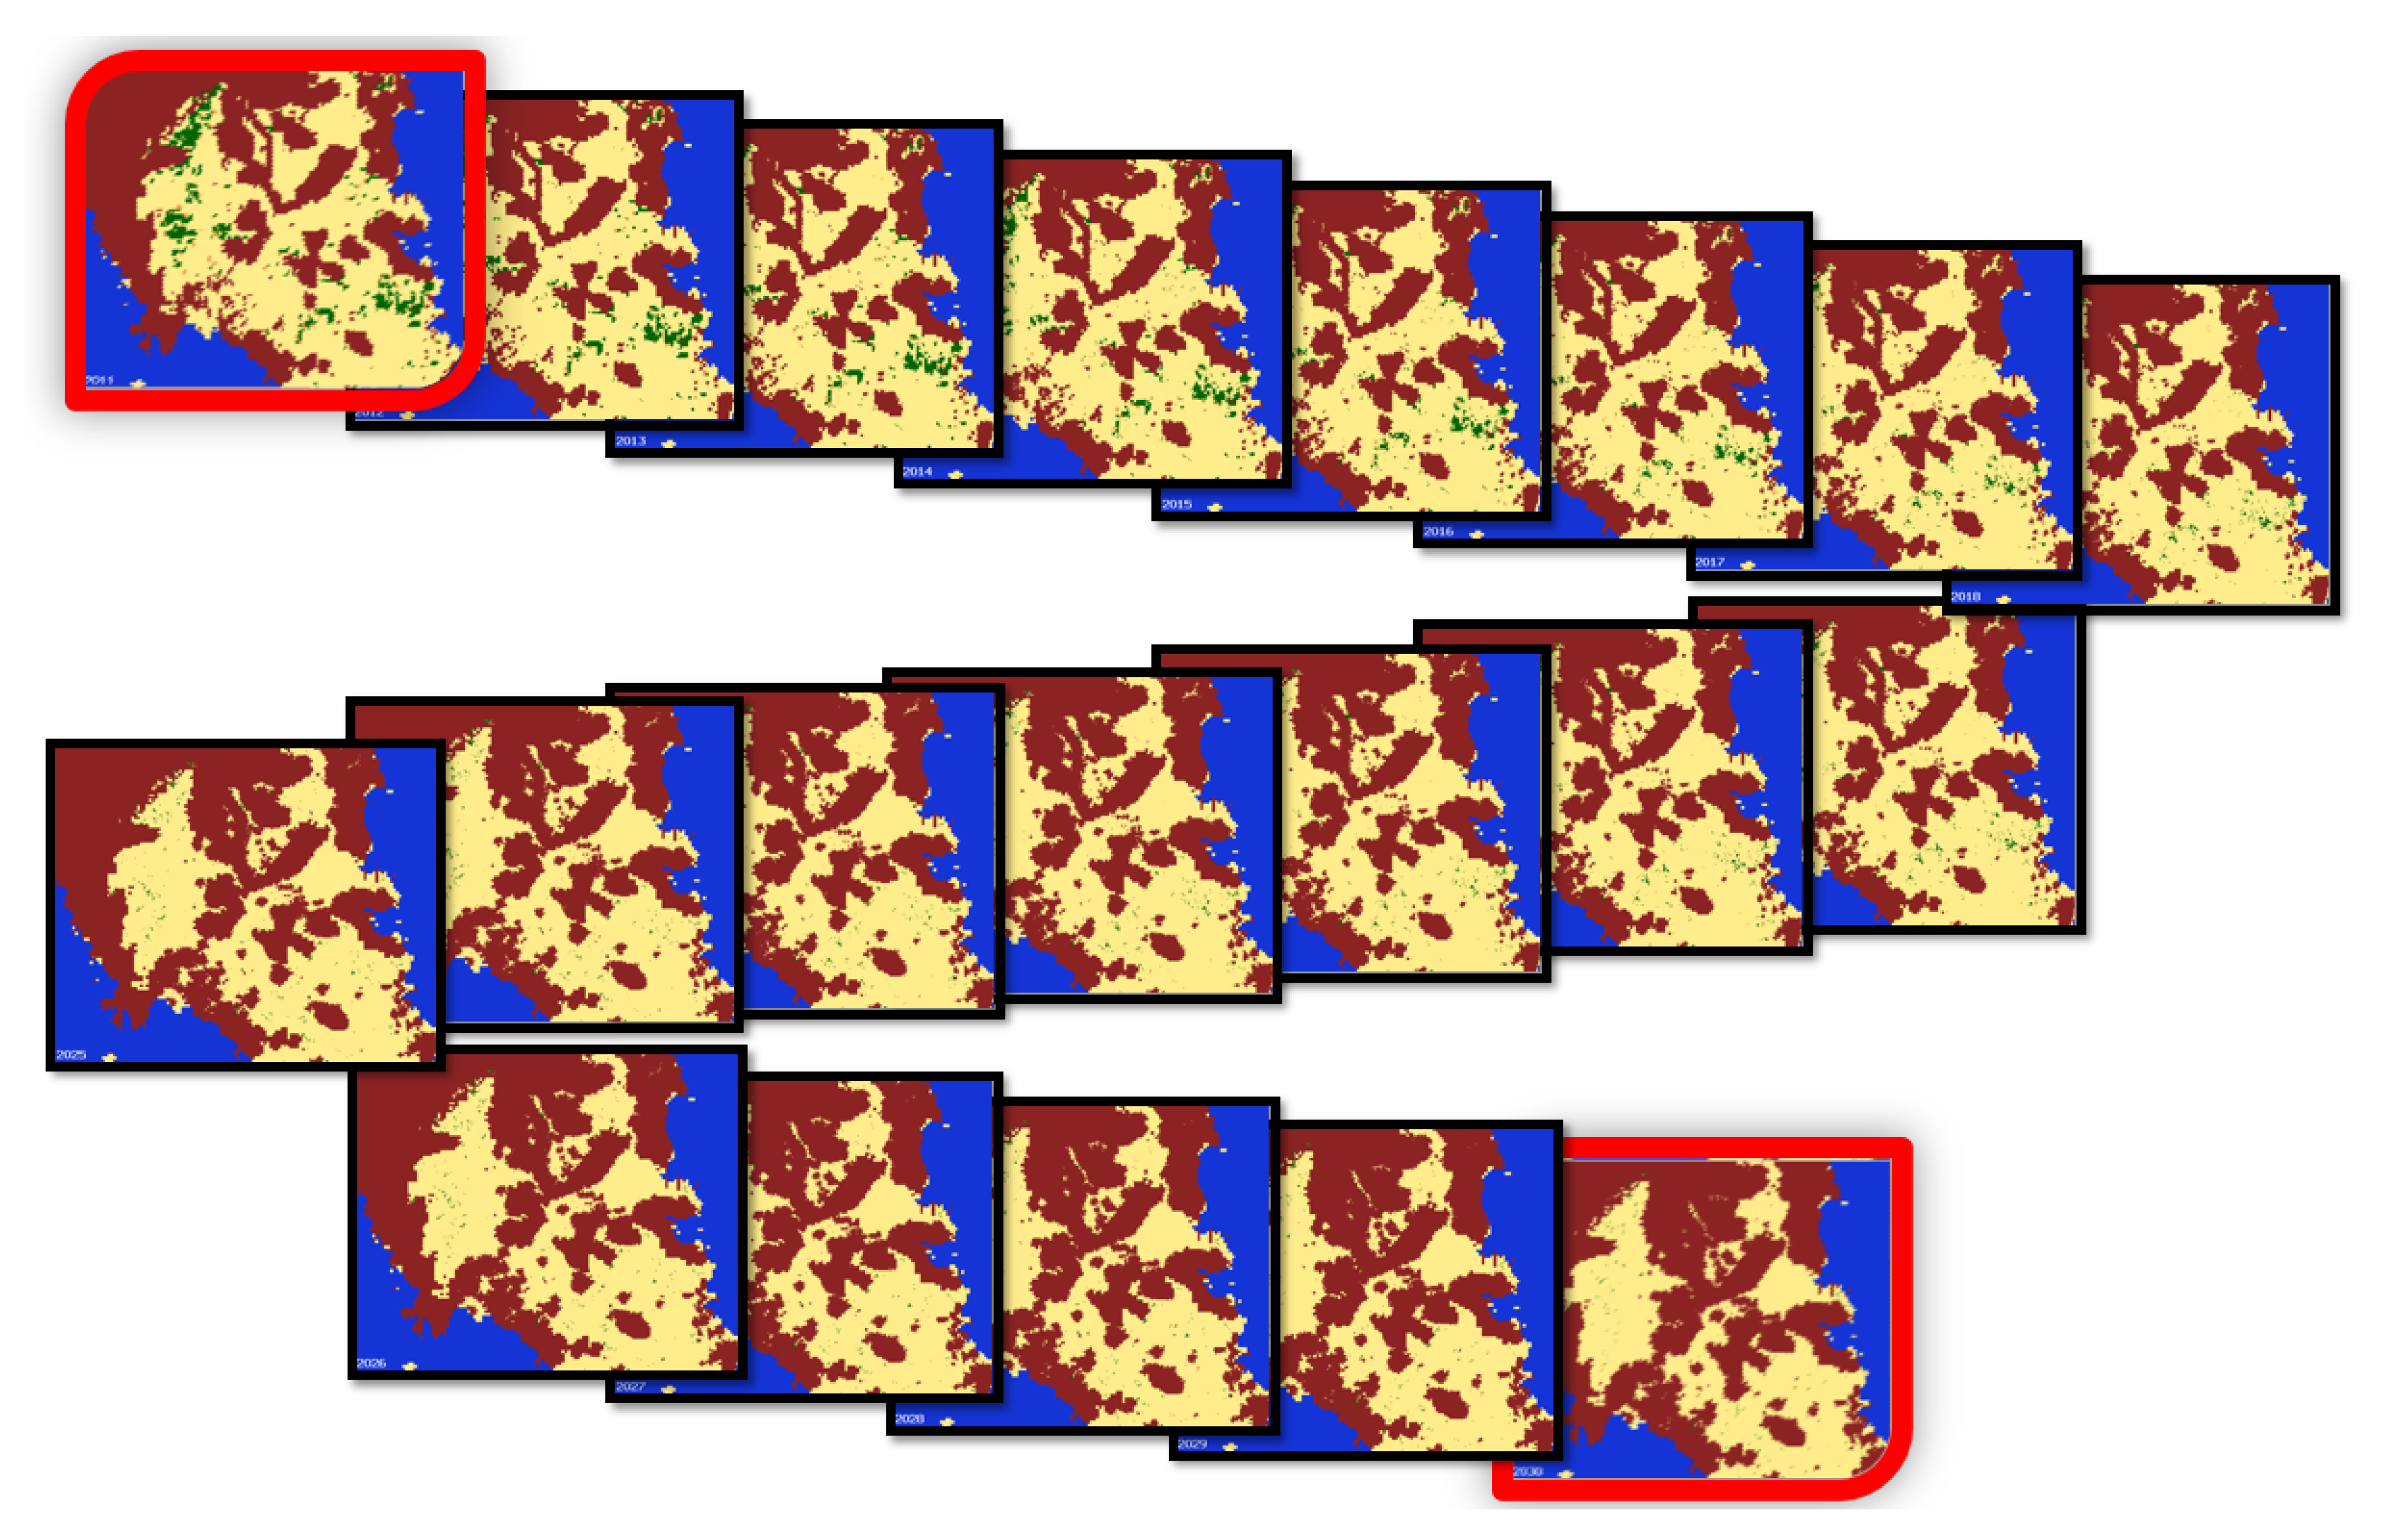
2.3.2. The SLEUTH Model
- S lope;
- L and uses;
- E xclusion (Building Prohibition Areas);
- U rbanization;
- T ransportation;
- H illshade.
- Diffusion (determines the minimum and automatic probability of urbanization);
- Spread (determines the part of the development that derives from existing urban centers);
- Breed (defines each new urban place to develop into an urban center);
- Slope resistance (determines the reduction in urbanization due to ground slopes);
- Road gravity (determines the urbanization, which follows the road network).
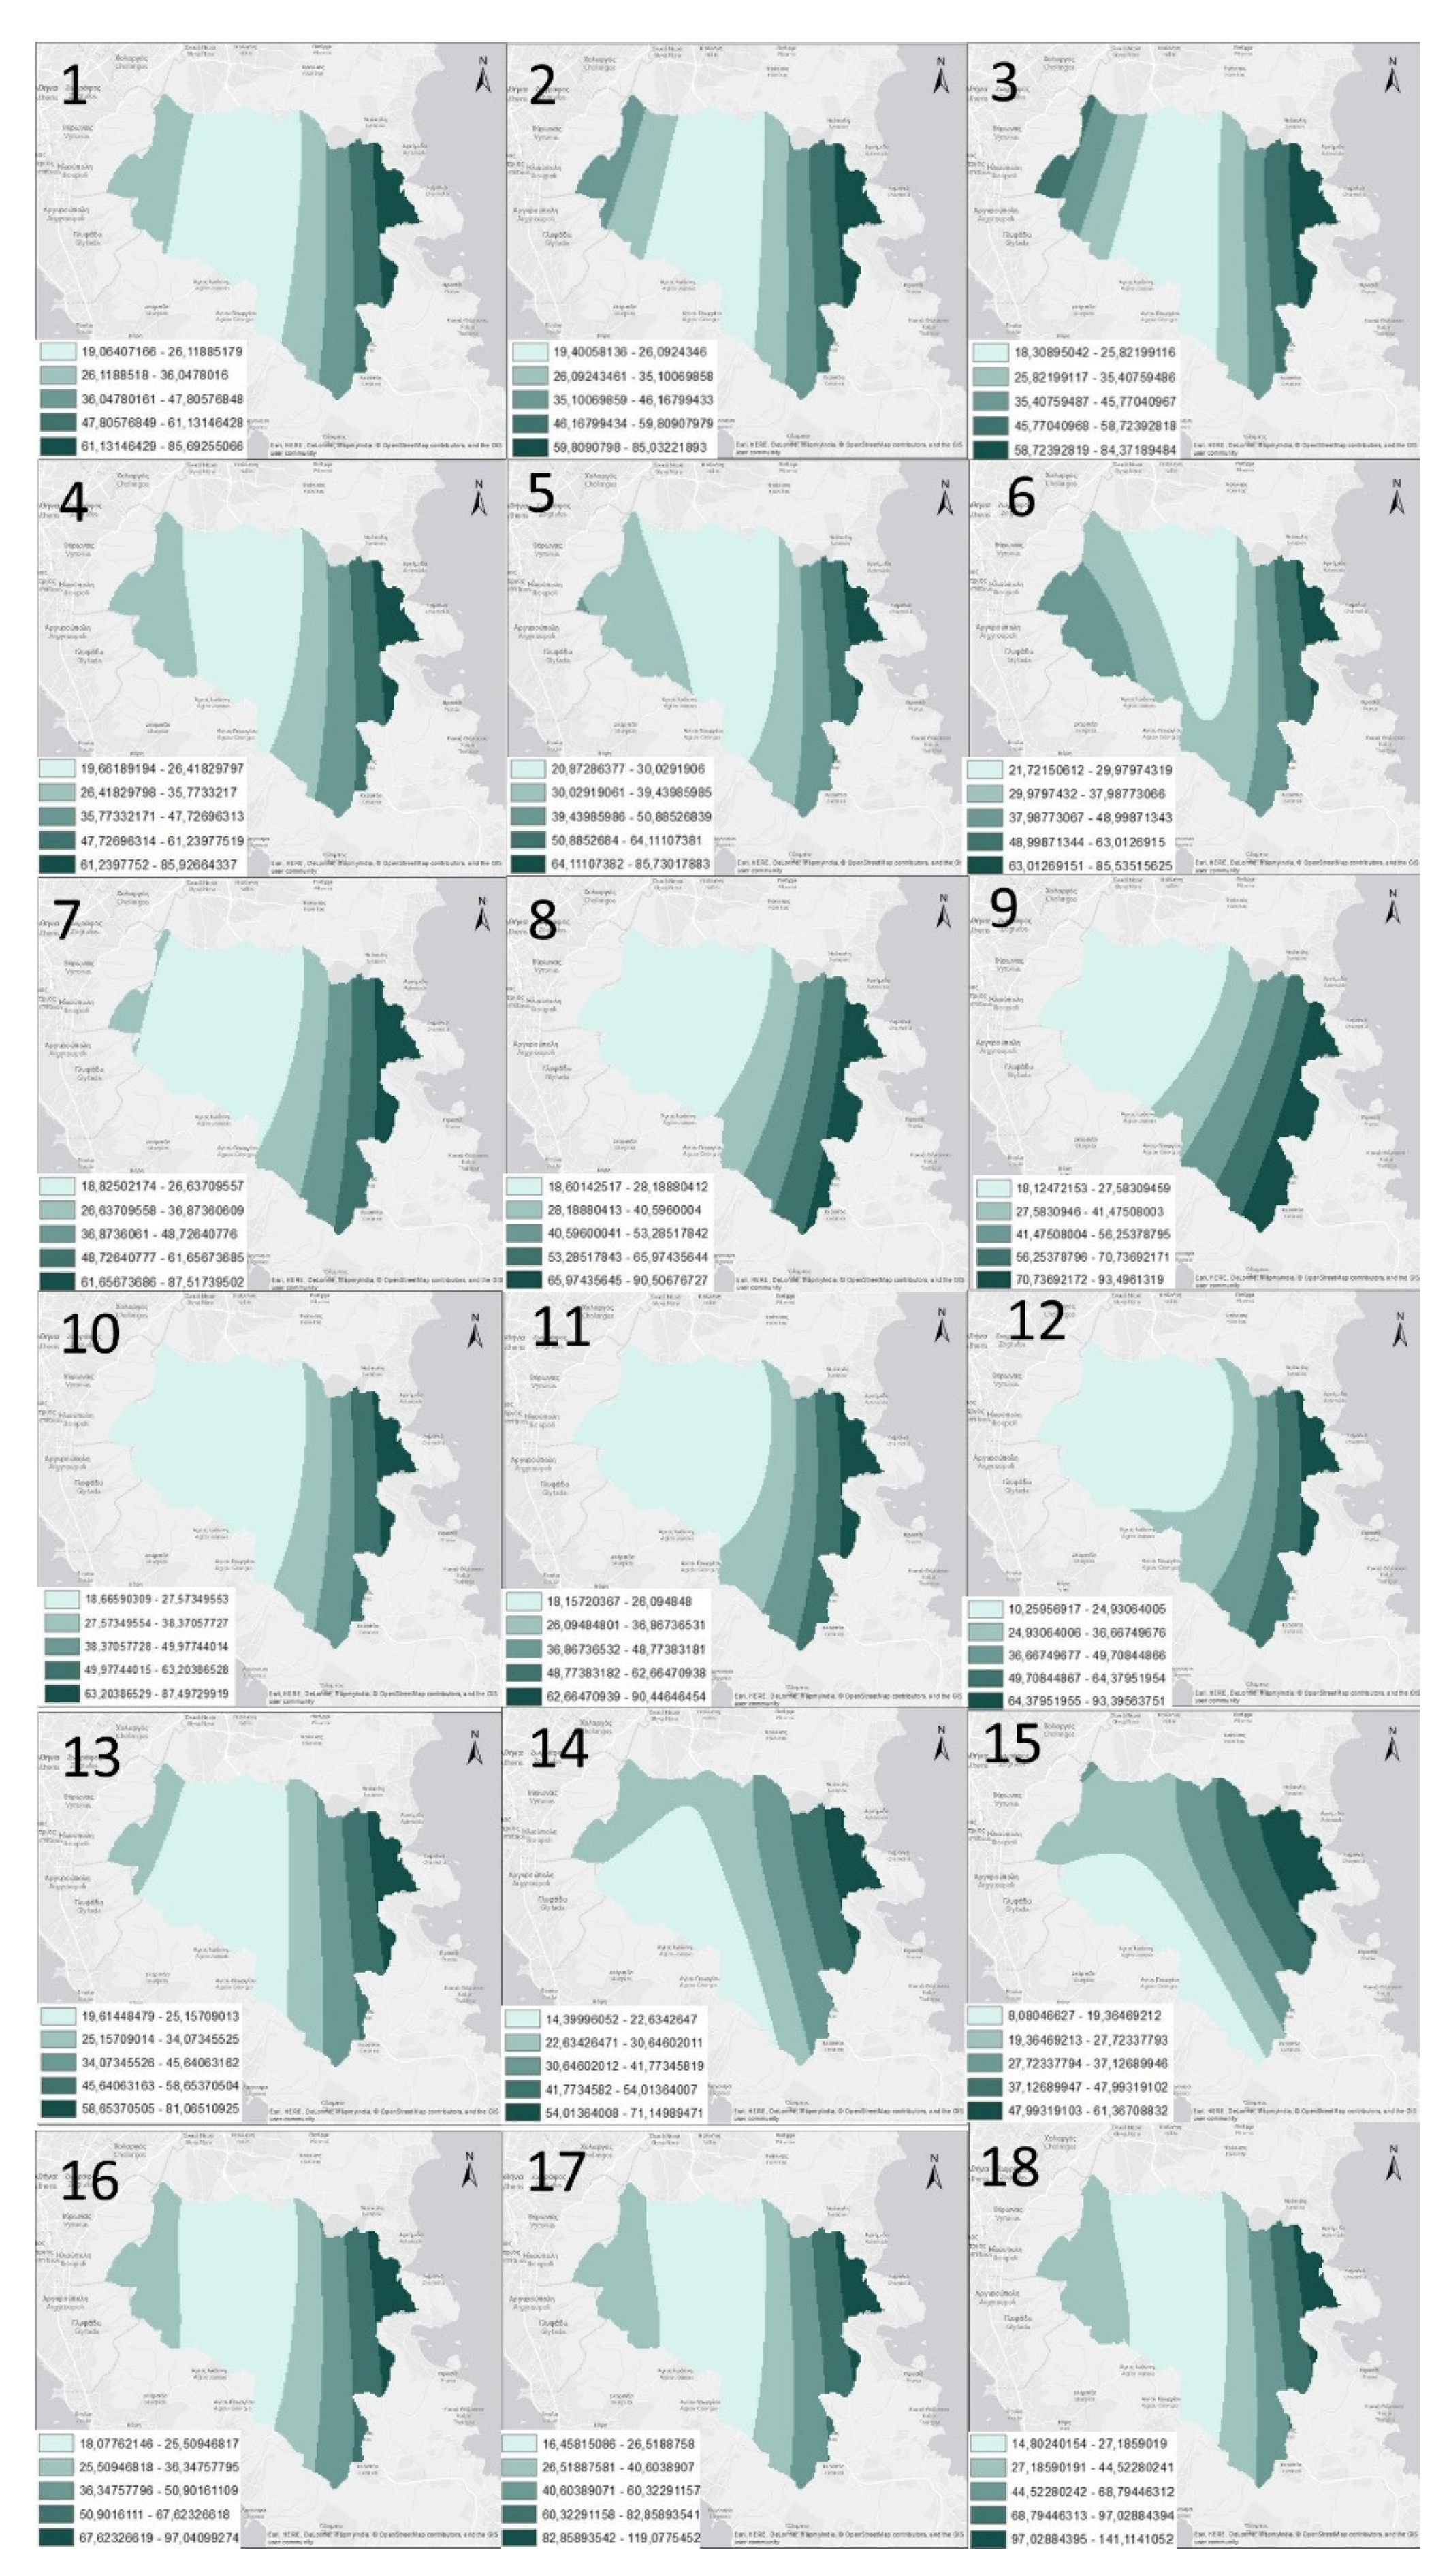
2.3.3. Precipitation Scenarios
2.4. Validation
3. Results
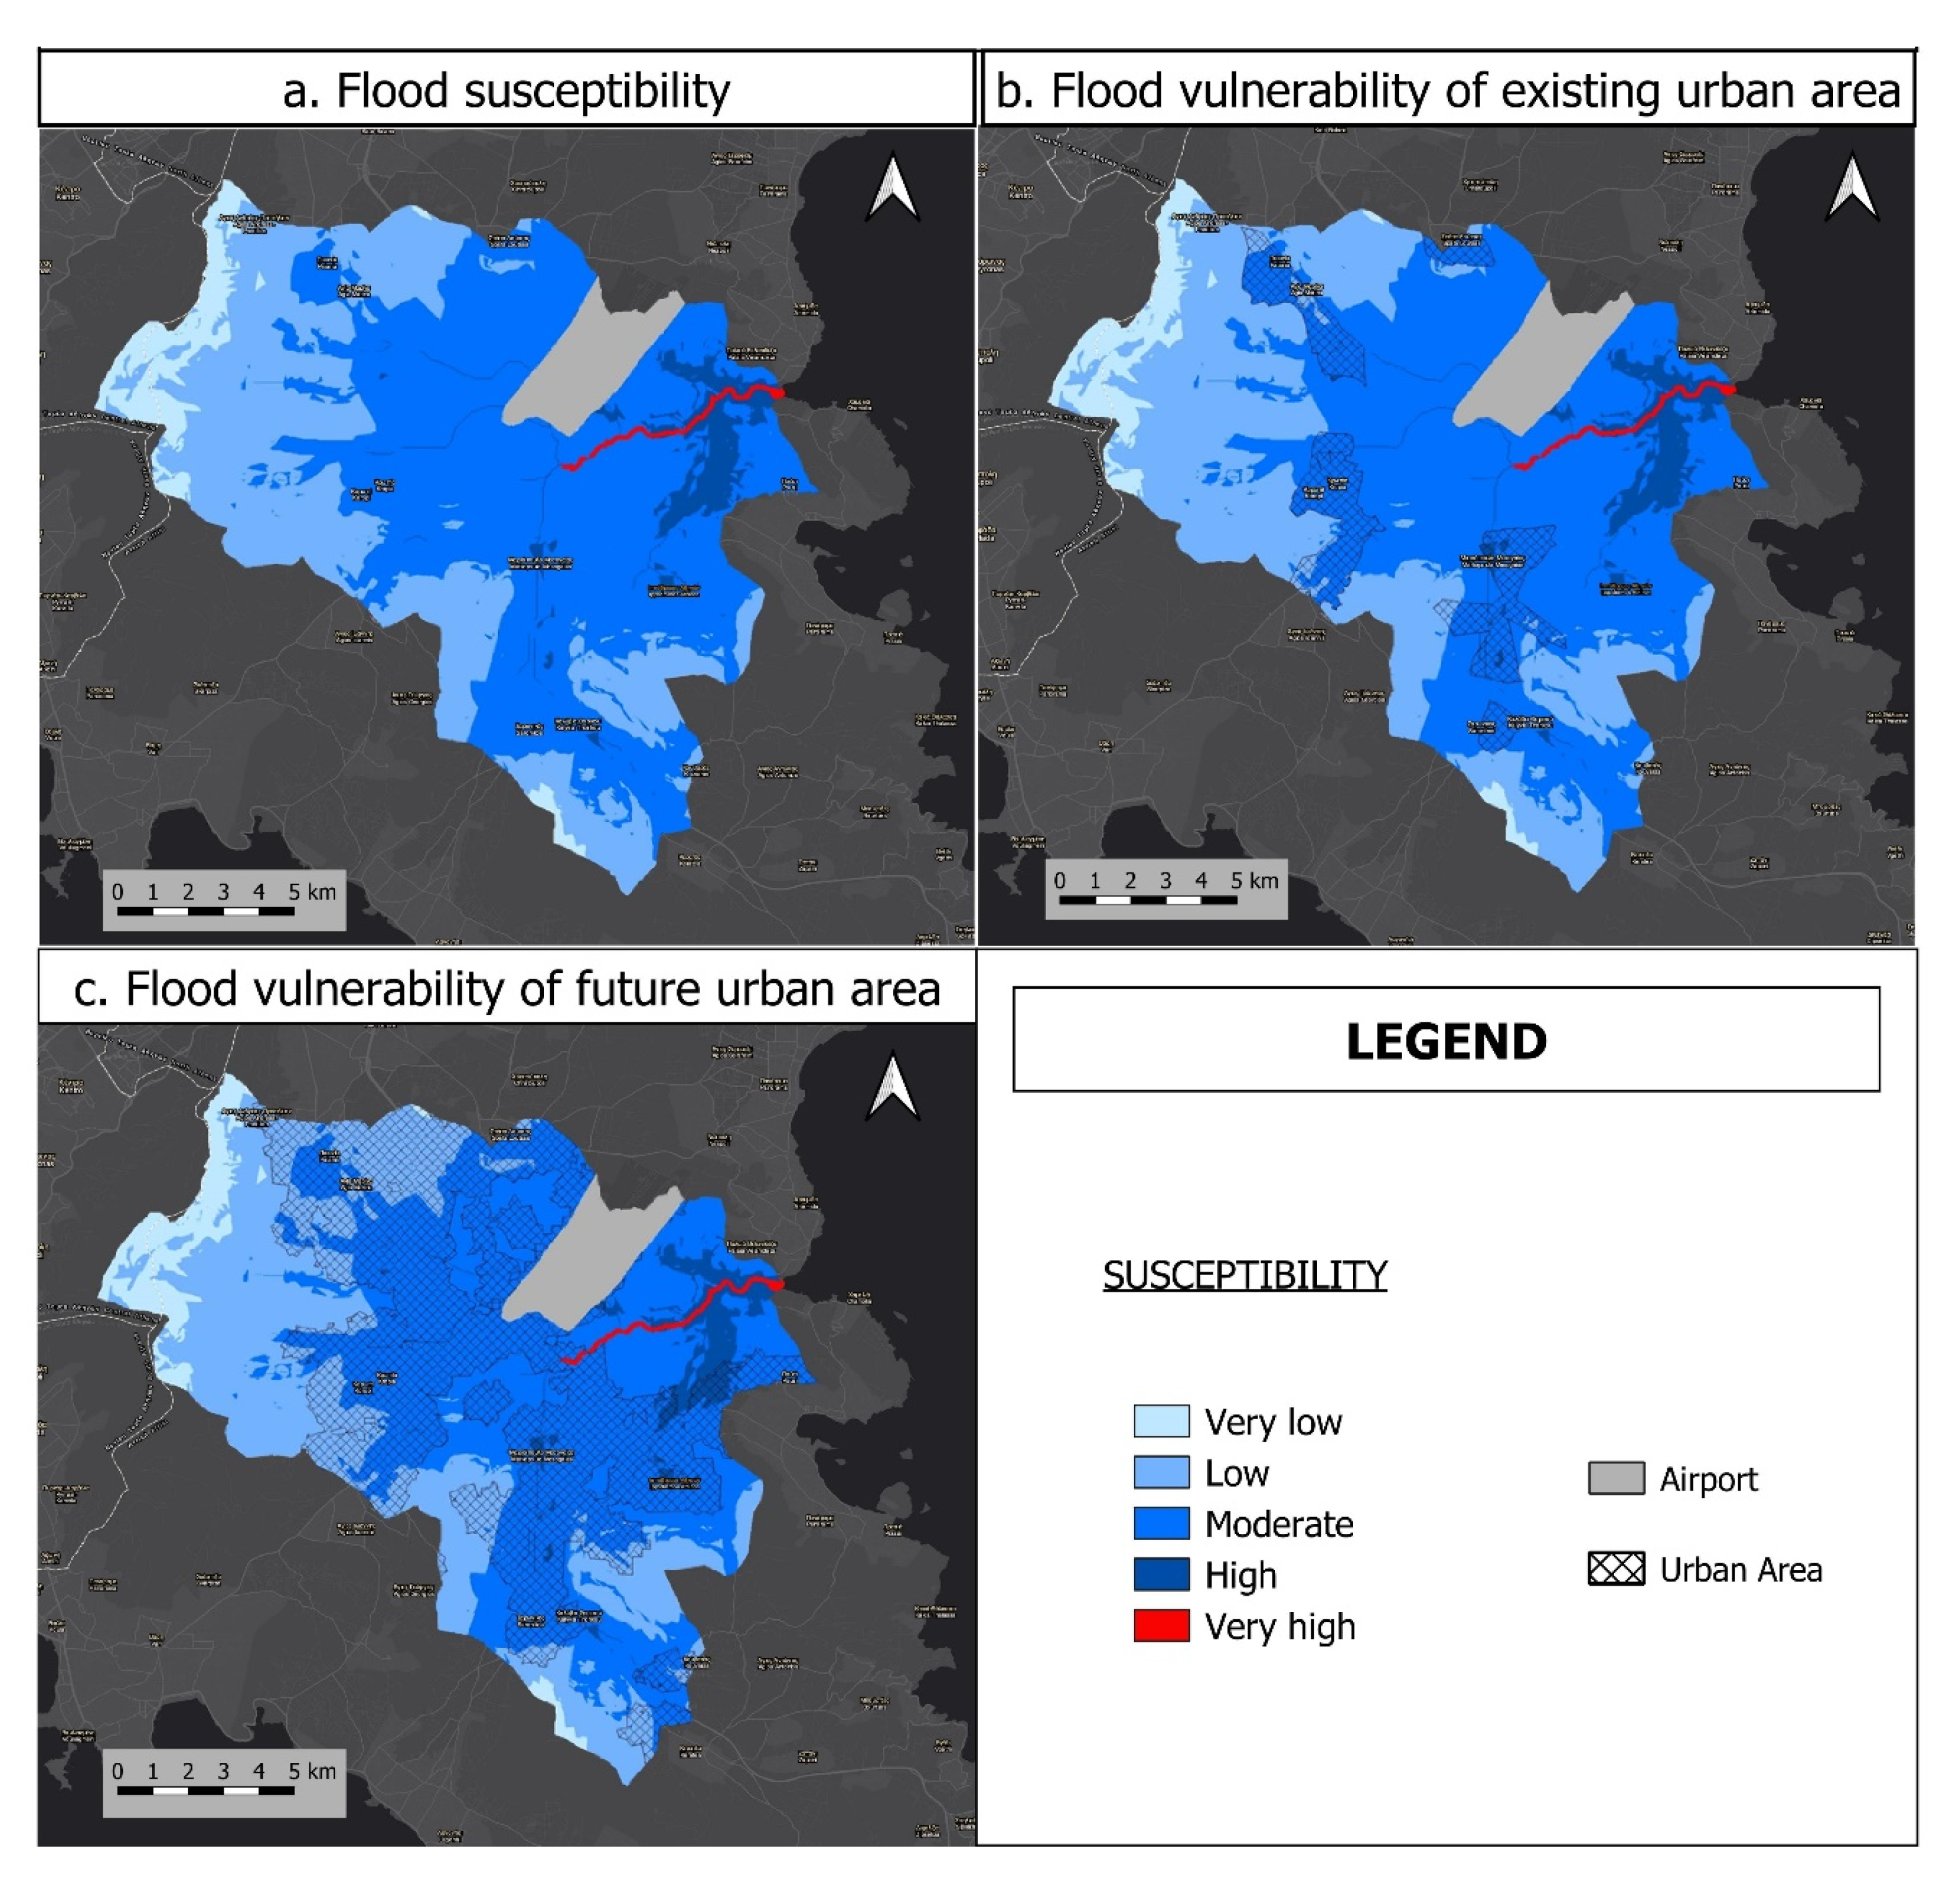
3.1. Main Results of the Methodology
3.2. Validation of the Methodology
4. Discussion
4.1. Main Aspects of Discussion
4.2. Limitations and Future Work
5. Conclusions
Author Contributions
Funding
Acknowledgments
Conflicts of Interest
References
- Kalogeropoulos, K.; Chalkias, C. Modelling the Impacts of Climate Change on Surface Runoff in Small Mediterranean Catchments: Empirical Evidence from Greece: Modelling the Impacts of Climate Change on Surface Runoff. Water Environ. J. 2013, 27, 505–513. [Google Scholar] [CrossRef]
- Kalogeropoulos, K.; Karalis, S.; Karymbalis, E.; Chalkias, C.; Chalkias, G.; Katsafados, P. Modeling flash floods in Vouraikos River mouth, Greece. In Proceedings of the MEDCOAST Conference, Marmaris, Turkey, 30 October–3 November 2013; Volume 2, pp. 1135–1146. [Google Scholar]
- Stathopoulos, N.; Kalogeropoulos, K.; Polykretis, C.; Skrimizeas, P.; Louka, P.; Karymbalis, E.; Chalkias, C. Introducing flood susceptibility index using remote-sensing data and geographic information systems: Empirical analysis in Sperchios River basin, Greece. In Remote Sensing of Hydrometeorological Hazards; CRC Press: Boca Raton, FL, USA, 2017; pp. 381–400. [Google Scholar]
- Borga, M.; Anagnostou, E.N.; Blöschl, G.; Creutin, J.-D. Flash Flood Forecasting, Warning and Risk Management: The HYDRATE Project. Environ. Sci. Policy 2011, 14, 834–844. [Google Scholar] [CrossRef]
- Dinh, Q.; Balica, S.; Popescu, I.; Jonoski, A. Climate Change Impact on Flood Hazard, Vulnerability and Risk of the Long Xuyen Quadrangle in the Mekong Delta. Int. J. River Basin Manag. 2012, 10, 103–120. [Google Scholar] [CrossRef]
- Chang, N.-B.; Guo, D.-H. Urban flash flood monitoring, mapping and forecasting via a tailored sensor network system. In Proceedings of the 2006 IEEE International Conference on Networking, Sensing and Control, Fort Lauderdale, FL, USA, 23–25 April 2006; pp. 757–761. [Google Scholar]
- Gaitanis, A.; Kalogeropoulos, K.; Detsis, V.; Chalkias, C. Monitoring 60 Years of Land Cover Change in the Marathon Area, Greece. Land 2015, 4, 337–354. [Google Scholar] [CrossRef] [Green Version]
- Alaghmand, S.; Abdullah, R.B.; Abustan, I.; Vosoogh, B. GIS-Based River Flood Hazard Mapping in Urban Area (a Case Study in Kayu Ara River Basin, Malaysia). Int. J. Eng. Technol. 2010, 2, 488–500. [Google Scholar]
- Smith, K.; Petley, D.N. Environmental Hazards: Assessing Risk and Reducing Disaster, 5th ed.; Routledge: Abingdon, UK, 2009. [Google Scholar]
- Maantay, J.; Maroko, A. Mapping Urban Risk: Flood Hazards, Race, & Environmental Justice in New York. Appl. Geogr. 2009, 29, 111–124. [Google Scholar] [CrossRef] [PubMed] [Green Version]
- Smith, K. Environmental Hazards: Assessing Risk and Reducing Disaster, 6th ed.; Routledge Taylor & Francis Group: London, UK; New York, NY, USA, 2013; ISBN 978-0-415-68105-6. [Google Scholar]
- Sekovski, I.; Armaroli, C.; Calabrese, L.; Mancini, F.; Stecchi, F.; Perini, L. Coupling Scenarios of Urban Growth and Flood Hazards along the Emilia-Romagna Coast (Italy). Nat. Hazards Earth Syst. Sci. 2015, 15, 2331–2346. [Google Scholar] [CrossRef] [Green Version]
- Glas, H.; Rocabado, I.; Huysentruyt, S.; Maroy, E.; Salazar Cortez, D.; Coorevits, K.; De Maeyer, P.; Deruyter, G. Flood Risk Mapping Worldwide: A Flexible Methodology and Toolbox. Water 2019, 11, 2371. [Google Scholar] [CrossRef] [Green Version]
- Nigussie, T.A.; Altunkaynak, A. Modeling the Effect of Urbanization on Flood Risk in Ayamama Watershed, Istanbul, Turkey, Using the MIKE 21 FM Model. Nat. Hazards 2019, 99, 1031–1047. [Google Scholar] [CrossRef]
- Huong, H.T.L.; Pathirana, A. Urbanization and Climate Change Impacts on Future Urban Flooding in Can Tho City, Vietnam. Hydrol. Earth Syst. Sci. 2013, 17, 379–394. [Google Scholar] [CrossRef] [Green Version]
- Quan, R. Impact of Future Land Use Change on Pluvial Flood Risk Based on Scenario Simulation: A Case Study in Shanghai, China. Arab. J. Geosci. 2021, 14, 943. [Google Scholar] [CrossRef]
- Tsatsaris, A.; Kalogeropoulos, K.; Stathopoulos, N.; Louka, P.; Tsanakas, K.; Tsesmelis, D.E.; Krassanakis, V.; Petropoulos, G.P.; Pappas, V.; Chalkias, C. Geoinformation Technologies in Support of Environmental Hazards Monitoring under Climate Change: An Extensive Review. ISPRS Int. J. Geo-Inf. 2021, 10, 94. [Google Scholar] [CrossRef]
- Kalogeropoulos, K.; Stathopoulos, N.; Psarogiannis, A.; Pissias, E.; Louka, P.; Petropoulos, G.P.; Chalkias, C. An Integrated GIS-Hydro Modeling Methodology for Surface Runoff Exploitation via Small-Scale Reservoirs. Water 2020, 12, 3182. [Google Scholar] [CrossRef]
- Nikolaos, S.; Kleomenis, K.; Elias, D.; Panagiotis, S.; Panagiota, L.; Vagelis, P.; Christos, C. A Robust Remote Sensing–Spatial Modeling–Remote Sensing (R-M-R) Approach for Flood Hazard Assessment. In Spatial Modeling in GIS and R for Earth and Environmental Sciences; Elsevier: Amsterdam, The Netherlands, 2019; pp. 391–410. ISBN 978-0-12-815226-3. [Google Scholar]
- Gioti, E.; Riga, C.; Kalogeropoulos, K.; Chalkias, C. A GIS-Based Flash Flood Runoff Model Using High Resolution DEM and Meteorological Data. EARSeL Eproceedings 2013, 12, 33–43. [Google Scholar]
- Tsanakas, K.; Gaki-Papanastassiou, K.; Kalogeropoulos, K.; Chalkias, C.; Katsafados, P.; Karymbalis, E. Investigation of Flash Flood Natural Causes of Xirolaki Torrent, Northern Greece Based on GIS Modeling and Geomorphological Analysis. Nat. Hazards 2016, 84, 1015–1033. [Google Scholar] [CrossRef]
- Chalkias, C.; Stathopoulos, N.; Kalogeropoulos, K.; Karymbalis, E. Applied Hydrological Modeling with the Use of Geoinformatics: Theory and Practice. In Empirical Modeling and Its Applications; Habib, M., Ed.; InTech: London, UK, 2016; ISBN 978-953-51-2493-1. [Google Scholar]
- Al-Suhili, R.; Cullen, C.; Khanbilvardi, R. An Urban Flash Flood Alert Tool for Megacities—Application for Manhattan, New York City, USA. Hydrology 2019, 6, 56. [Google Scholar] [CrossRef] [Green Version]
- Wijaya, O.T.; Yang, T.-H. A Novel Hybrid Approach Based on Cellular Automata and a Digital Elevation Model for Rapid Flood Assessment. Water 2021, 13, 1311. [Google Scholar] [CrossRef]
- Liu, L.; Liu, Y.; Wang, X.; Yu, D.; Liu, K.; Huang, H.; Hu, G. Developing an Effective 2-D Urban Flood Inundation Model for City Emergency Management Based on Cellular Automata. Nat. Hazards Earth Syst. Sci. 2015, 15, 381–391. [Google Scholar] [CrossRef] [Green Version]
- Jamali, B.; Bach, P.M.; Cunningham, L.; Deletic, A. A Cellular Automata Fast Flood Evaluation (CA-ffé) Model. Water Resour. Res. 2019, 55, 4936–4953. [Google Scholar] [CrossRef] [Green Version]
- Nkwunonwo, U.C.; Whitworth, M.; Baily, B. Urban Flood Modelling Combining Cellular Automata Framework with Semi-Implicit Finite Difference Numerical Formulation. J. Afr. Earth Sci. 2019, 150, 272–281. [Google Scholar] [CrossRef] [Green Version]
- Yao, S.; Chen, N.; Du, W.; Wang, C.; Chen, C. A Cellular Automata Based Rainfall-Runoff Model for Urban Inundation Analysis Under Different Land Uses. Water Resour. Manag. 2021, 35, 1991–2006. [Google Scholar] [CrossRef]
- Armal, S.; Suhili, R.A. An Urban Flood Inundation Model Based on Cellular Automata. IJW 2019, 13, 221. [Google Scholar] [CrossRef]
- Song, J.; Fu, X.; Gu, Y.; Deng, Y.; Peng, Z.-R. An Examination of Land Use Impacts of Flooding Induced by Sea Level Rise. Nat. Hazards Earth Syst. Sci. 2017, 17, 315–334. [Google Scholar] [CrossRef] [Green Version]
- Barredo, J.I.; Engelen, G. Land Use Scenario Modeling for Flood Risk Mitigation. Sustainability 2010, 2, 1327–1344. [Google Scholar] [CrossRef] [Green Version]
- Shanableh, A.; Al-Ruzouq, R.; Yilmaz, A.; Siddique, M.; Merabtene, T.; Imteaz, M. Effects of Land Cover Change on Urban Floods and Rainwater Harvesting: A Case Study in Sharjah, UAE. Water 2018, 10, 631. [Google Scholar] [CrossRef] [Green Version]
- Littidej, P.; Buasri, N. Built-Up Growth Impacts on Digital Elevation Model and Flood Risk Susceptibility Prediction in Muaeng District, Nakhon Ratchasima (Thailand). Water 2019, 11, 1496. [Google Scholar] [CrossRef] [Green Version]
- Norman, L.M.; Huth, H.; Levick, L.; Shea Burns, I.; Phillip Guertin, D.; Lara-Valencia, F.; Semmens, D. Flood Hazard Awareness and Hydrologic Modelling at Ambos Nogales, United States-Mexico Border: Flood Hazard Awareness and Hydrologic Modelling at Ambos Nogales. J. Flood Risk Manag. 2010, 3, 151–165. [Google Scholar] [CrossRef]
- Sayas, J.P. Urban Sprawl in the Periurban Coastal Zones of Athens. Grsr 2016, 121, 71. [Google Scholar] [CrossRef] [Green Version]
- Stathopoulos, N.; Skrimizeas, P.; Kalogeropoulos, K.; Louka, P.; Tragaki, A. Statistical analysis and spatial correlation of rainfall in Greece for a 20-year time period. In Proceedings of the EasyChair Preprints; EasyChair: Manchester, UK, 2019. [Google Scholar]
- Stamellou, E.; Stathakis, D.; Triantakonstantis, D. Scenarios of Urban Sprawl Scenations in Athens, Greece; Hellas Gis: Athens, Greece, 11 December 2014. [Google Scholar]
- Kourgialas, N.N.; Karatzas, G.P. Flood Management and a GIS Modelling Method to Assess Flood-Hazard Areas—a Case Study. Hydrol. Sci. J. 2011, 56, 212–225. [Google Scholar] [CrossRef]
- Kazakis, N.; Kougias, I.; Patsialis, T. Assessment of Flood Hazard Areas at a Regional Scale Using an Index-Based Approach and Analytical Hierarchy Process: Application in Rhodope–Evros Region, Greece. Sci. Total Environ. 2015, 538, 555–563. [Google Scholar] [CrossRef]
- Garnero, G.; Godone, D. Comparisons between Different Interpolation Techniques. Int. Arch. Photogramm. Remote Sens. Spatial Inf. Sci. 2014, XL-5/W3, 139–144. [Google Scholar] [CrossRef] [Green Version]
- Xiao, Y.; Gu, X.; Yin, S.; Shao, J.; Cui, Y.; Zhang, Q.; Niu, Y. Geostatistical Interpolation Model Selection Based on ArcGIS and Spatio-Temporal Variability Analysis of Groundwater Level in Piedmont Plains, Northwest China. SpringerPlus 2016, 5, 425. [Google Scholar] [CrossRef] [PubMed] [Green Version]
- Saaty, R.W. The Analytic Hierarchy Process—What It Is and How It Is Used. Math. Model. 1987, 9, 161–176. [Google Scholar] [CrossRef] [Green Version]
- Kasilingam, R.G. Logistics and Transportation; Springer: Boston, MA, USA, 1998; ISBN 978-1-4613-7407-7. [Google Scholar]
- Kahraman, C.; Cebeci, U.; Ulukan, Z. Multi-criteria Supplier Selection Using Fuzzy AHP. Logist. Inf. Manag. 2003, 16, 382–394. [Google Scholar] [CrossRef]
- Oguztimur, S. Why fuzzy analytic hierarchy process approach for transport problems? In Proceedings of the 51st Congress of the European Regional Science Association: “New Challenges for European Regions and Urban Areas in a Globalised World”, Barcelona, Spain, 30 August–3 September 2011. [Google Scholar]
- Gigović, L.; Pamučar, D.; Bajić, Z.; Drobnjak, S. Application of GIS-Interval Rough AHP Methodology for Flood Hazard Mapping in Urban Areas. Water 2017, 9, 360. [Google Scholar] [CrossRef] [Green Version]
- Batar, A.K.; Watanabe, T. Landslide Susceptibility Mapping and Assessment Using Geospatial Platforms and Weights of Evidence (WoE) Method in the Indian Himalayan Region: Recent Developments, Gaps, and Future Directions. ISPRS Int. J. Geo-Inf. 2021, 10, 114. [Google Scholar] [CrossRef]
- Skondras, N. Decision Making in Water Resources Management: Development of a Composite Indicator for the Assessment of the Social-Environmental Systems in Terms Resilience and Vulnerability to Water Scarcity and Water Stress. Ph.D. Dissertation, Department of Natural Resources Management and Agricultural Engineering, Agricultural University of Athens, Athens, Greece, 2015. [Google Scholar]
- Daoud, J.I. Multicollinearity and Regression Analysis. J. Phys. Conf. Ser. 2017, 949, 012009. [Google Scholar] [CrossRef]
- Tsesmelis, D.E. Development, implementation and evaluation of drought and desertification risk indicators for the Integrated Management of Water Resources. Ph.D. Dissertation, Department of Natural Resources Management & Agricultural Engineering, Agricultural University of Athens, Athens, Greece, 2017. [Google Scholar]
- Tsesmelis, D.E.; Oikonomou, P.D.; Vasilakou, C.G.; Skondras, N.A.; Fassouli, V.; Alexandris, S.G.; Grigg, N.S.; Karavitis, C.A. Assessing Structural Uncertainty Caused by Different Weighting Methods on the Standardized Drought Vulnerability Index (SDVI). Stoch. Environ. Res. Risk Assess. 2019, 33, 515–533. [Google Scholar] [CrossRef]
- Skondras, N.A.; Tsesmelis, D.E.; Vasilakou, C.G.; Karavitis, C.A. Resilience–Vulnerability Analysis: A Decision-Making Framework for Systems Assessment. Sustainability 2020, 12, 9306. [Google Scholar] [CrossRef]
- Tsesmelis, D.E.; Karavitis, C.A.; Kalogeropoulos, K.; Tsatsaris, A.; Zervas, E.; Vasilakou, C.G.; Stathopoulos, N.; Skondras, N.A.; Alexandris, S.G.; Chalkias, C.; et al. Development and Application of Water and Land Resources Degradation Index (WLDI). Earth 2021, 2, 515–531. [Google Scholar] [CrossRef]
- Fassouli, V.P.; Karavitis, C.A.; Tsesmelis, D.E.; Alexandris, S.G. Factual Drought Index (FDI): A Composite Index Based on Precipitation and Evapotranspiration. Hydrol. Sci. J. 2021, 66, 1638–1652. [Google Scholar] [CrossRef]
- Paraskevis, N.; Roumpos, C.; Stathopoulos, N.; Adam, A. Spatial Analysis and Evaluation of a Coal Deposit by Coupling AHP & GIS Techniques. Int. J. Min. Sci. Technol. 2019, 29, 943–953. [Google Scholar] [CrossRef]
- Liu, Y.B.; Gebremeskel, S.; De Smedt, F.; Hoffmann, L.; Pfister, L. A Diffusive Transport Approach for Flow Routing in GIS-Based Flood Modeling. J. Hydrol. 2003, 283, 91–106. [Google Scholar] [CrossRef]
- Zhou, Y.; Varquez, A.C.G.; Kanda, M. High-Resolution Global Urban Growth Projection Based on Multiple Applications of the SLEUTH Urban Growth Model. Sci Data 2019, 6, 34. [Google Scholar] [CrossRef]
- Chaudhuri, G.; Clarke, K.C. Modeling an Indian Megalopolis—A Case Study on Adapting SLEUTH Urban Growth Model. Comput. Environ. Urban Syst. 2019, 77, 101358. [Google Scholar] [CrossRef] [Green Version]
- Chaudhuri, G.; Clarke, K.C. Temporal Accuracy in Urban Growth Forecasting: A Study Using the SLEUTH Model: Temporal Accuracy in Urban Growth Forecasting: A Study Using the SLEUTH Model. Trans. GIS 2014, 18, 302–320. [Google Scholar] [CrossRef]
- Hua, L.; Tang, L.; Cui, S.; Yin, K. Simulating Urban Growth Using the SLEUTH Model in a Coastal Peri-Urban District in China. Sustainability 2014, 6, 3899–3914. [Google Scholar] [CrossRef] [Green Version]
- Feng, Y.; Wang, R.; Tong, X.; Shafizadeh-Moghadam, H. How Much Can Temporally Stationary Factors Explain Cellular Automata-Based Simulations of Past and Future Urban Growth? Comput. Environ. Urban Syst. 2019, 76, 150–162. [Google Scholar] [CrossRef]
- Liu, D.; Clarke, K.C.; Chen, N. Integrating Spatial Nonstationarity into SLEUTH for Urban Growth Modeling: A Case Study in the Wuhan Metropolitan Area. Comput. Environ. Urban Syst. 2020, 84, 101545. [Google Scholar] [CrossRef]
- Serasinghe Pathiranage, I.S.; Kantakumar, L.N.; Sundaramoorthy, S. Remote Sensing Data and SLEUTH Urban Growth Model: As Decision Support Tools for Urban Planning. Chin. Geogr. Sci. 2018, 28, 274–286. [Google Scholar] [CrossRef] [Green Version]
- Wolf Roth, E.C.; Koscianski, A. Improving Forecasts of Land Use with Regionalized Maps in the SLEUTH Model. GeoFocus 2020, 25, 153–174. [Google Scholar] [CrossRef]
- Ilyassova, A.; Kantakumar, L.N.; Boyd, D. Urban Growth Analysis and Simulations Using Cellular Automata and Geo-Informatics: Comparison between Almaty and Astana in Kazakhstan. Geocarto Int. 2021, 36, 520–539. [Google Scholar] [CrossRef]
- Rafiee, R.; Mahiny, A.S.; Khorasani, N.; Darvishsefat, A.A.; Danekar, A. Simulating Urban Growth in Mashad City, Iran through the SLEUTH Model (UGM). Cities 2009, 26, 19–26. [Google Scholar] [CrossRef]
- Wu, X.; Hu, Y.; He, H.S.; Bu, R.; Onsted, J.; Xi, F. Performance Evaluation of the SLEUTH Model in the Shenyang Metropolitan Area of Northeastern China. Environ. Model Assess. 2009, 14, 221–230. [Google Scholar] [CrossRef]
- Syphard, A.D.; Clarke, K.C.; Franklin, J.; Regan, H.M.; Mcginnis, M. Forecasts of Habitat Loss and Fragmentation Due to Urban Growth Are Sensitive to Source of Input Data. J. Environ. Manag. 2011, 92, 1882–1893. [Google Scholar] [CrossRef] [PubMed]
- Clarke, K.C.; Gaydos, L.J. Loose-Coupling a Cellular Automaton Model and GIS: Long-Term Urban Growth Prediction for San Francisco and Washington/Baltimore. Int. J. Geogr. Inf. Sci. 1998, 12, 699–714. [Google Scholar] [CrossRef] [PubMed] [Green Version]
- Kleijnen, J.P.C. Verification and Validation of Simulation Models. Eur. J. Oper. Res. 1995, 82, 145–162. [Google Scholar] [CrossRef] [Green Version]
- Herold, M.; Goldstein, N.C.; Clarke, K.C. The Spatiotemporal Form of Urban Growth: Measurement, Analysis and Modeling. Remote. Sens. Environ. 2003, 86, 286–302. [Google Scholar] [CrossRef]
- Jantz, C.A.; Goetz, S.J.; Shelley, M.K. Using the Sleuth Urban Growth Model to Simulate the Impacts of Future Policy Scenarios on Urban Land Use in the Baltimore-Washington Metropolitan Area. Environ. Plan. B Plan. Des. 2004, 31, 251–271. [Google Scholar] [CrossRef]
- Rounsevell, M.D.A.; Reginster, I.; Araújo, M.B.; Carter, T.R.; Dendoncker, N.; Ewert, F.; House, J.I.; Kankaanpää, S.; Leemans, R.; Metzger, M.J.; et al. A Coherent Set of Future Land Use Change Scenarios for Europe. Agric. Ecosyst. Environ. 2006, 114, 57–68. [Google Scholar] [CrossRef]
- Mondal, B.; Chakraborti, S.; Das, D.N.; Joshi, P.K.; Maity, S.; Pramanik, M.K.; Chatterjee, S. Comparison of Spatial Modelling Approaches to Simulate Urban Growth: A Case Study on Udaipur City, India. Geocarto Int. 2020, 35, 411–433. [Google Scholar] [CrossRef]
- Liu, X.; Sun, R.; Yang, Q.; Su, G.; Qi, W. Simulating Urban Expansion Using an Improved SLEUTH Model. J. Appl. Remote. Sens. 2012, 6, 061709. [Google Scholar] [CrossRef] [Green Version]
- Gounaridis, D.; Chorianopoulos, I.; Symeonakis, E.; Koukoulas, S. A Random Forest-Cellular Automata Modelling Approach to Explore Future Land Use/Cover Change in Attica (Greece), under Different Socio-Economic Realities and Scales. Sci. Total Environ. 2019, 646, 320–335. [Google Scholar] [CrossRef]
- Martellozzo, F.; Amato, F.; Murgante, B.; Clarke, K.C. Modelling the Impact of Urban Growth on Agriculture and Natural Land in Italy to 2030. Appl. Geogr. 2018, 91, 156–167. [Google Scholar] [CrossRef] [Green Version]
- Aburas, M.M.; Ho, Y.M.; Ramli, M.F.; Ash’aari, Z.H. Improving the Capability of an Integrated CA-Markov Model to Simulate Spatio-Temporal Urban Growth Trends Using an Analytical Hierarchy Process and Frequency Ratio. Int. J. Appl. Earth Obs. Geoinf. 2017, 59, 65–78. [Google Scholar] [CrossRef]
- Mirbagheri, B.; Alimohammadi, A. Improving Urban Cellular Automata Performance by Integrating Global and Geographically Weighted Logistic Regression Models. Trans. GIS 2017, 21, 1280–1297. [Google Scholar] [CrossRef]
- Tian, G.; Ma, B.; Xu, X.; Liu, X.; Xu, L.; Liu, X.; Xiao, L.; Kong, L. Simulation of Urban Expansion and Encroachment Using Cellular Automata and Multi-Agent System Model—A Case Study of Tianjin Metropolitan Region, China. Ecol. Indic. 2016, 70, 439–450. [Google Scholar] [CrossRef]
- Li, F.; Wang, L.; Chen, Z.; Clarke, K.C.; Li, M.; Jiang, P. Extending the SLEUTH Model to Integrate Habitat Quality into Urban Growth Simulation. J. Environ. Manag. 2018, 217, 486–498. [Google Scholar] [CrossRef] [PubMed] [Green Version]
- Kim, Y.; Newman, G. Climate Change Preparedness: Comparing Future Urban Growth and Flood Risk in Amsterdam and Houston. Sustainability 2019, 11, 1048. [Google Scholar] [CrossRef] [PubMed] [Green Version]


| Data | Type | Spatial Resolution | Source |
|---|---|---|---|
| Altitude | Raster | 30 × 30 m | Aster GDEM * |
| Hydrolithology | Vector (Polygon) | 1:50,000 | EAGME ** |
| Land Use | Vector (Polygon) | 1:5000 | OPEKEPE *** |
| Slope | Raster | 30 × 30 m | Aster GDEM |
| Distance from hydrographic network | Raster | 30 × 30 m | Aster GDEM |
| Precipitation | Raster | 30 × 30 m | Hellenic National Meteorological Service—HNMS **** |
| Flow accumulation | Raster | 30 × 30 m | Aster GDEM |
| Flow Accumulation | Altitude | Precipitation | Land Use | Distance from Hydrographic Network | Slope | Hydrolithology | |
|---|---|---|---|---|---|---|---|
| Flow Accumulation | 1 | 2 | 2 | 2 | 3 | 4 | 6 |
| Altitude | 1/2 | 1 | 2 | 2 | 3 | 4 | 6 |
| Precipitation | 1/2 | 1/2 | 1 | 1 | 2 | 3 | 3 |
| Land Use | 1/2 | 1/2 | 1 | 1 | 2 | 3 | 3 |
| Distance from hydrographic network | 1/3 | 1/3 | 1/2 | 1/2 | 1 | 4 | 3 |
| Slope | 1/4 | 1/4 | 1/3 | 1/3 | 1/4 | 1 | 3 |
| Hydrolithology | 1/6 | 1/5 | 1/3 | 1/3 | 1/3 | 1/3 | 1 |
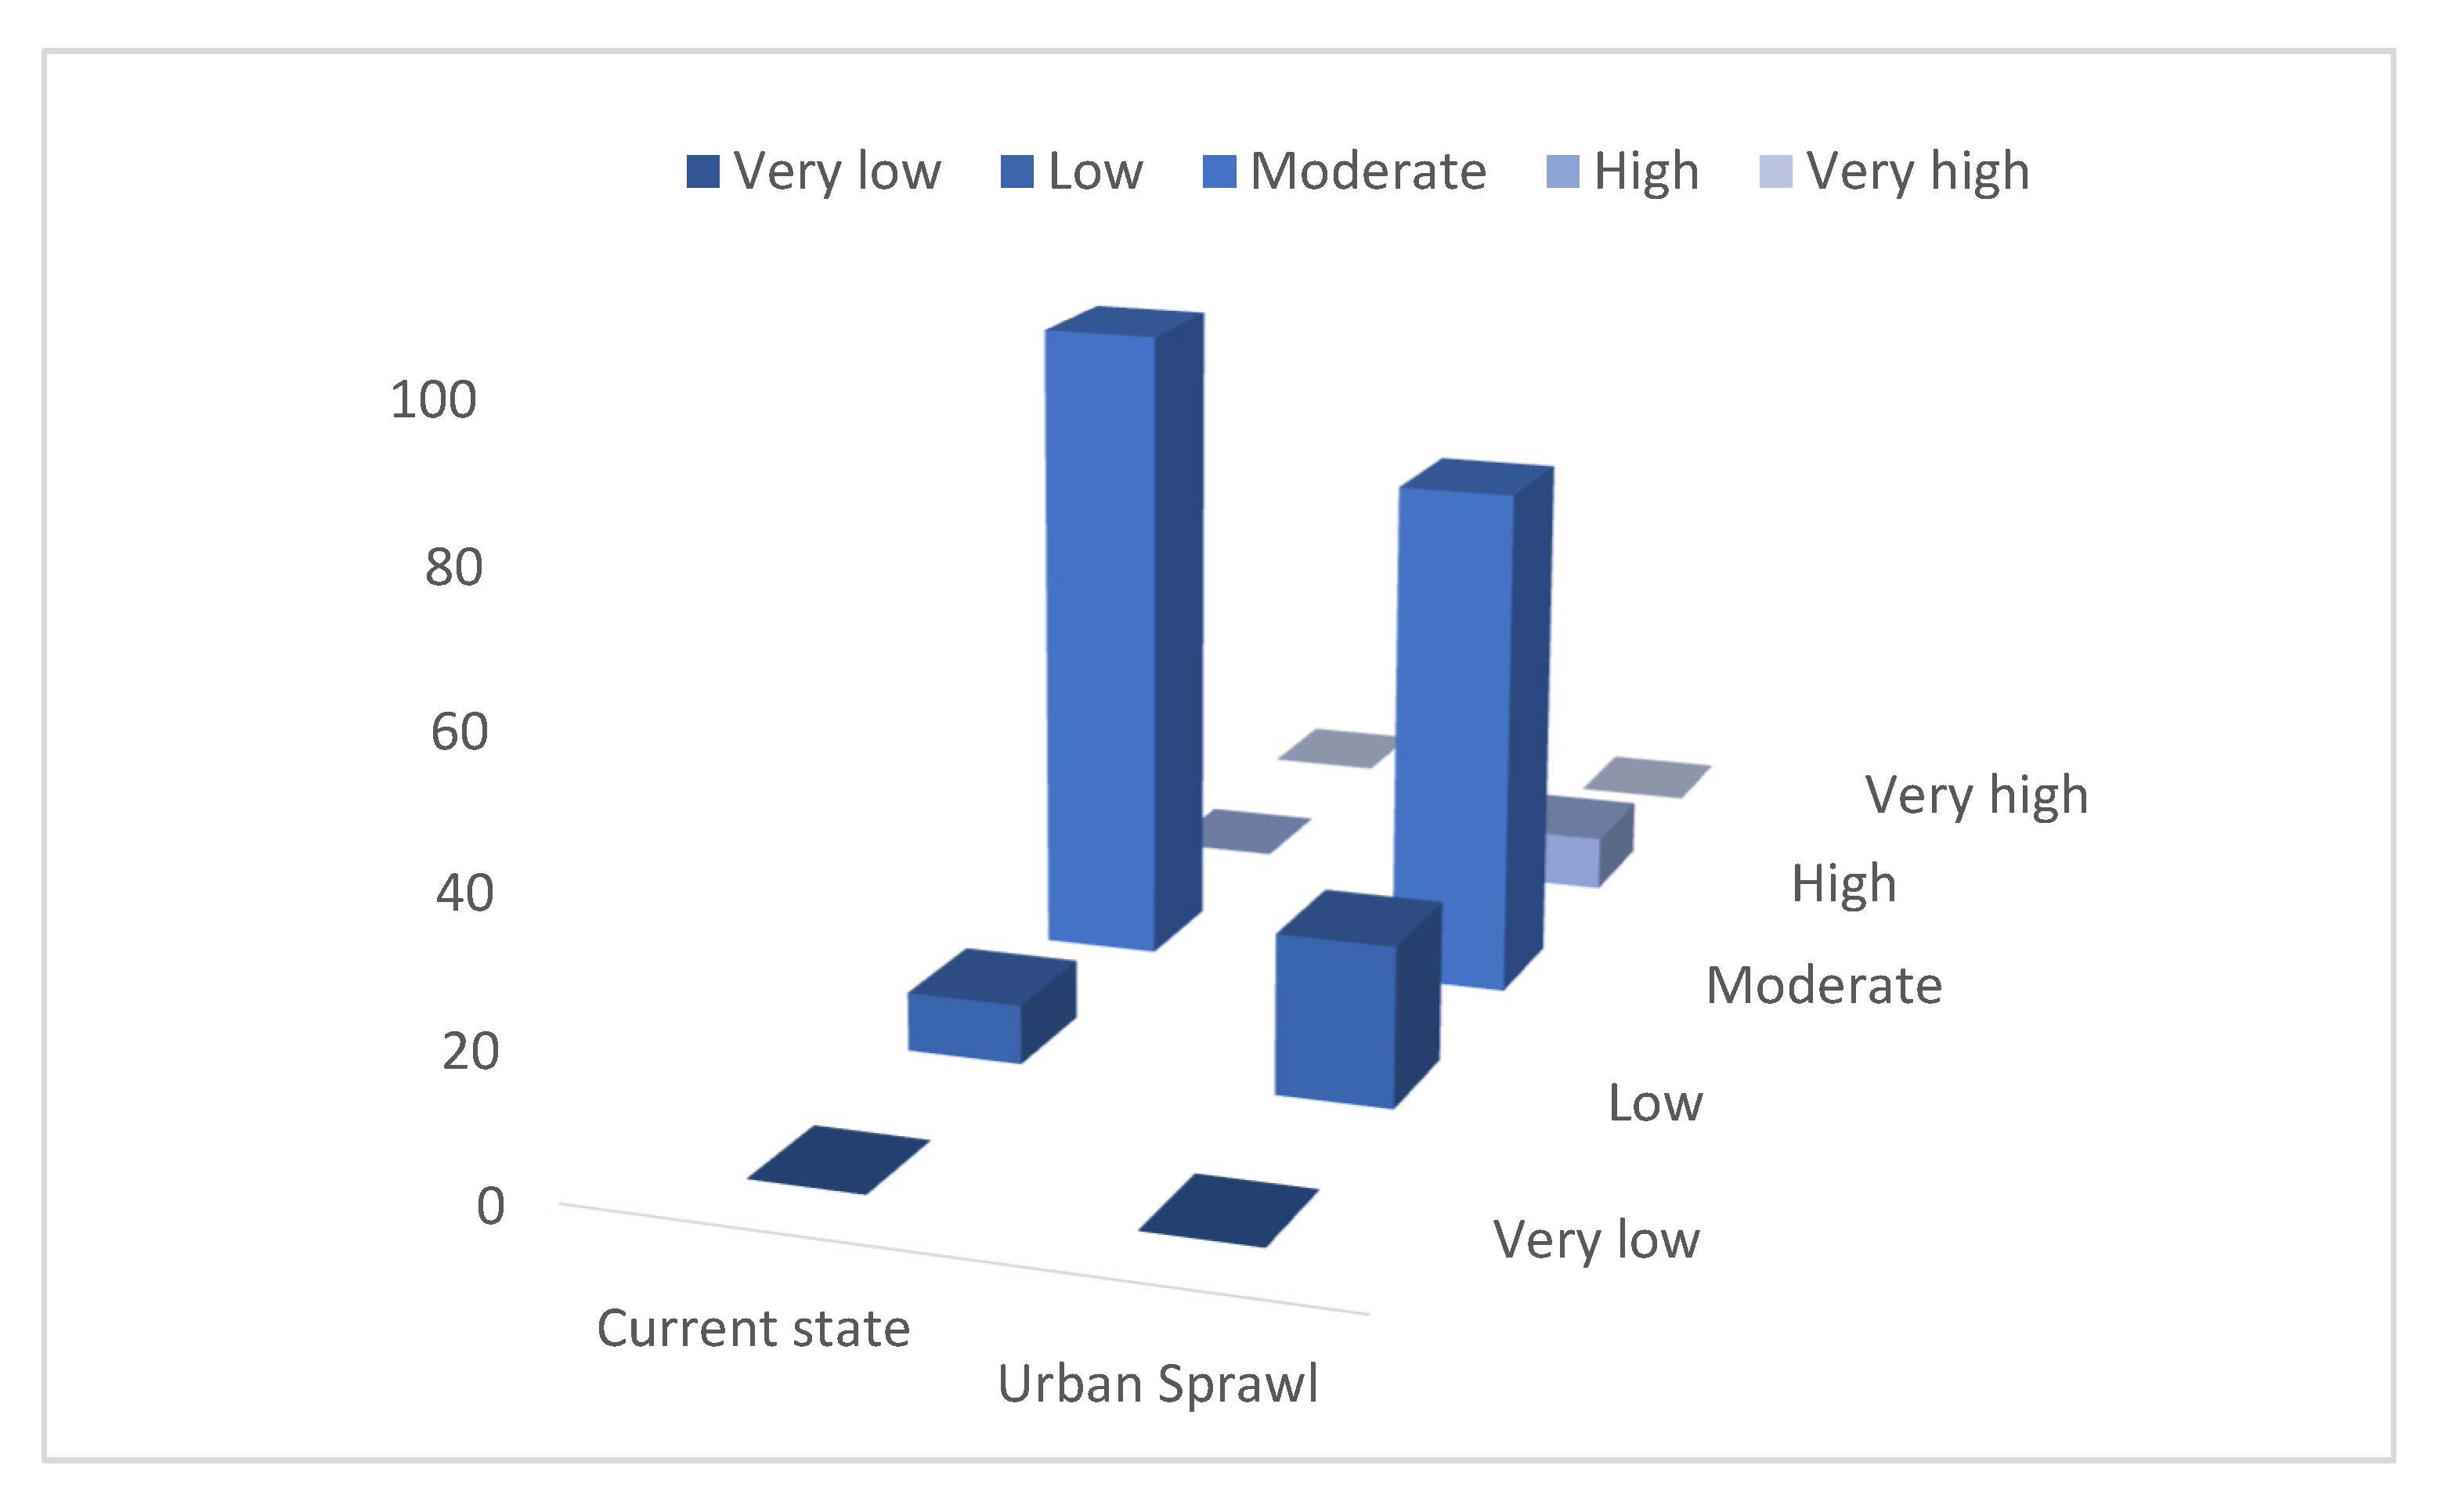
| Susceptibility | Current State | Urban Sprawl |
|---|---|---|
| Very low | 0 | 0.09 |
| Low | 1.657 | 23.102 |
| Moderate | 18.118 | 73.95 |
| High | 0.624 | 7.99 |
| Very high | 0 | 0.022 |
| Susceptibility | Current State | Urban Sprawl |
|---|---|---|
| Very low | 0 | 0.138 |
| Low | 1.471 | 21.116 |
| Moderate | 16.413 | 74.326 |
| High | 2.513 | 9.506 |
| Very high | 0 | 0.025 |
Publisher’s Note: MDPI stays neutral with regard to jurisdictional claims in published maps and institutional affiliations. |
© 2021 by the authors. Licensee MDPI, Basel, Switzerland. This article is an open access article distributed under the terms and conditions of the Creative Commons Attribution (CC BY) license (https://creativecommons.org/licenses/by/4.0/).
Share and Cite
Stamellou, E.; Kalogeropoulos, K.; Stathopoulos, N.; Tsesmelis, D.E.; Louka, P.; Apostolidis, V.; Tsatsaris, A. A GIS-Cellular Automata-Based Model for Coupling Urban Sprawl and Flood Susceptibility Assessment. Hydrology 2021, 8, 159. https://0-doi-org.brum.beds.ac.uk/10.3390/hydrology8040159
Stamellou E, Kalogeropoulos K, Stathopoulos N, Tsesmelis DE, Louka P, Apostolidis V, Tsatsaris A. A GIS-Cellular Automata-Based Model for Coupling Urban Sprawl and Flood Susceptibility Assessment. Hydrology. 2021; 8(4):159. https://0-doi-org.brum.beds.ac.uk/10.3390/hydrology8040159
Chicago/Turabian StyleStamellou, Evangelia, Kleomenis Kalogeropoulos, Nikolaos Stathopoulos, Demetrios E. Tsesmelis, Panagiota Louka, Vasileios Apostolidis, and Andreas Tsatsaris. 2021. "A GIS-Cellular Automata-Based Model for Coupling Urban Sprawl and Flood Susceptibility Assessment" Hydrology 8, no. 4: 159. https://0-doi-org.brum.beds.ac.uk/10.3390/hydrology8040159