
WFD Ecological Quality Indicators Are Poorly Correlated with Water Levels in River Catchments in Tuscany (Italy)

 ,
,
Abstract
:1. Introduction
2. Materials and Methods
2.1. Study Area
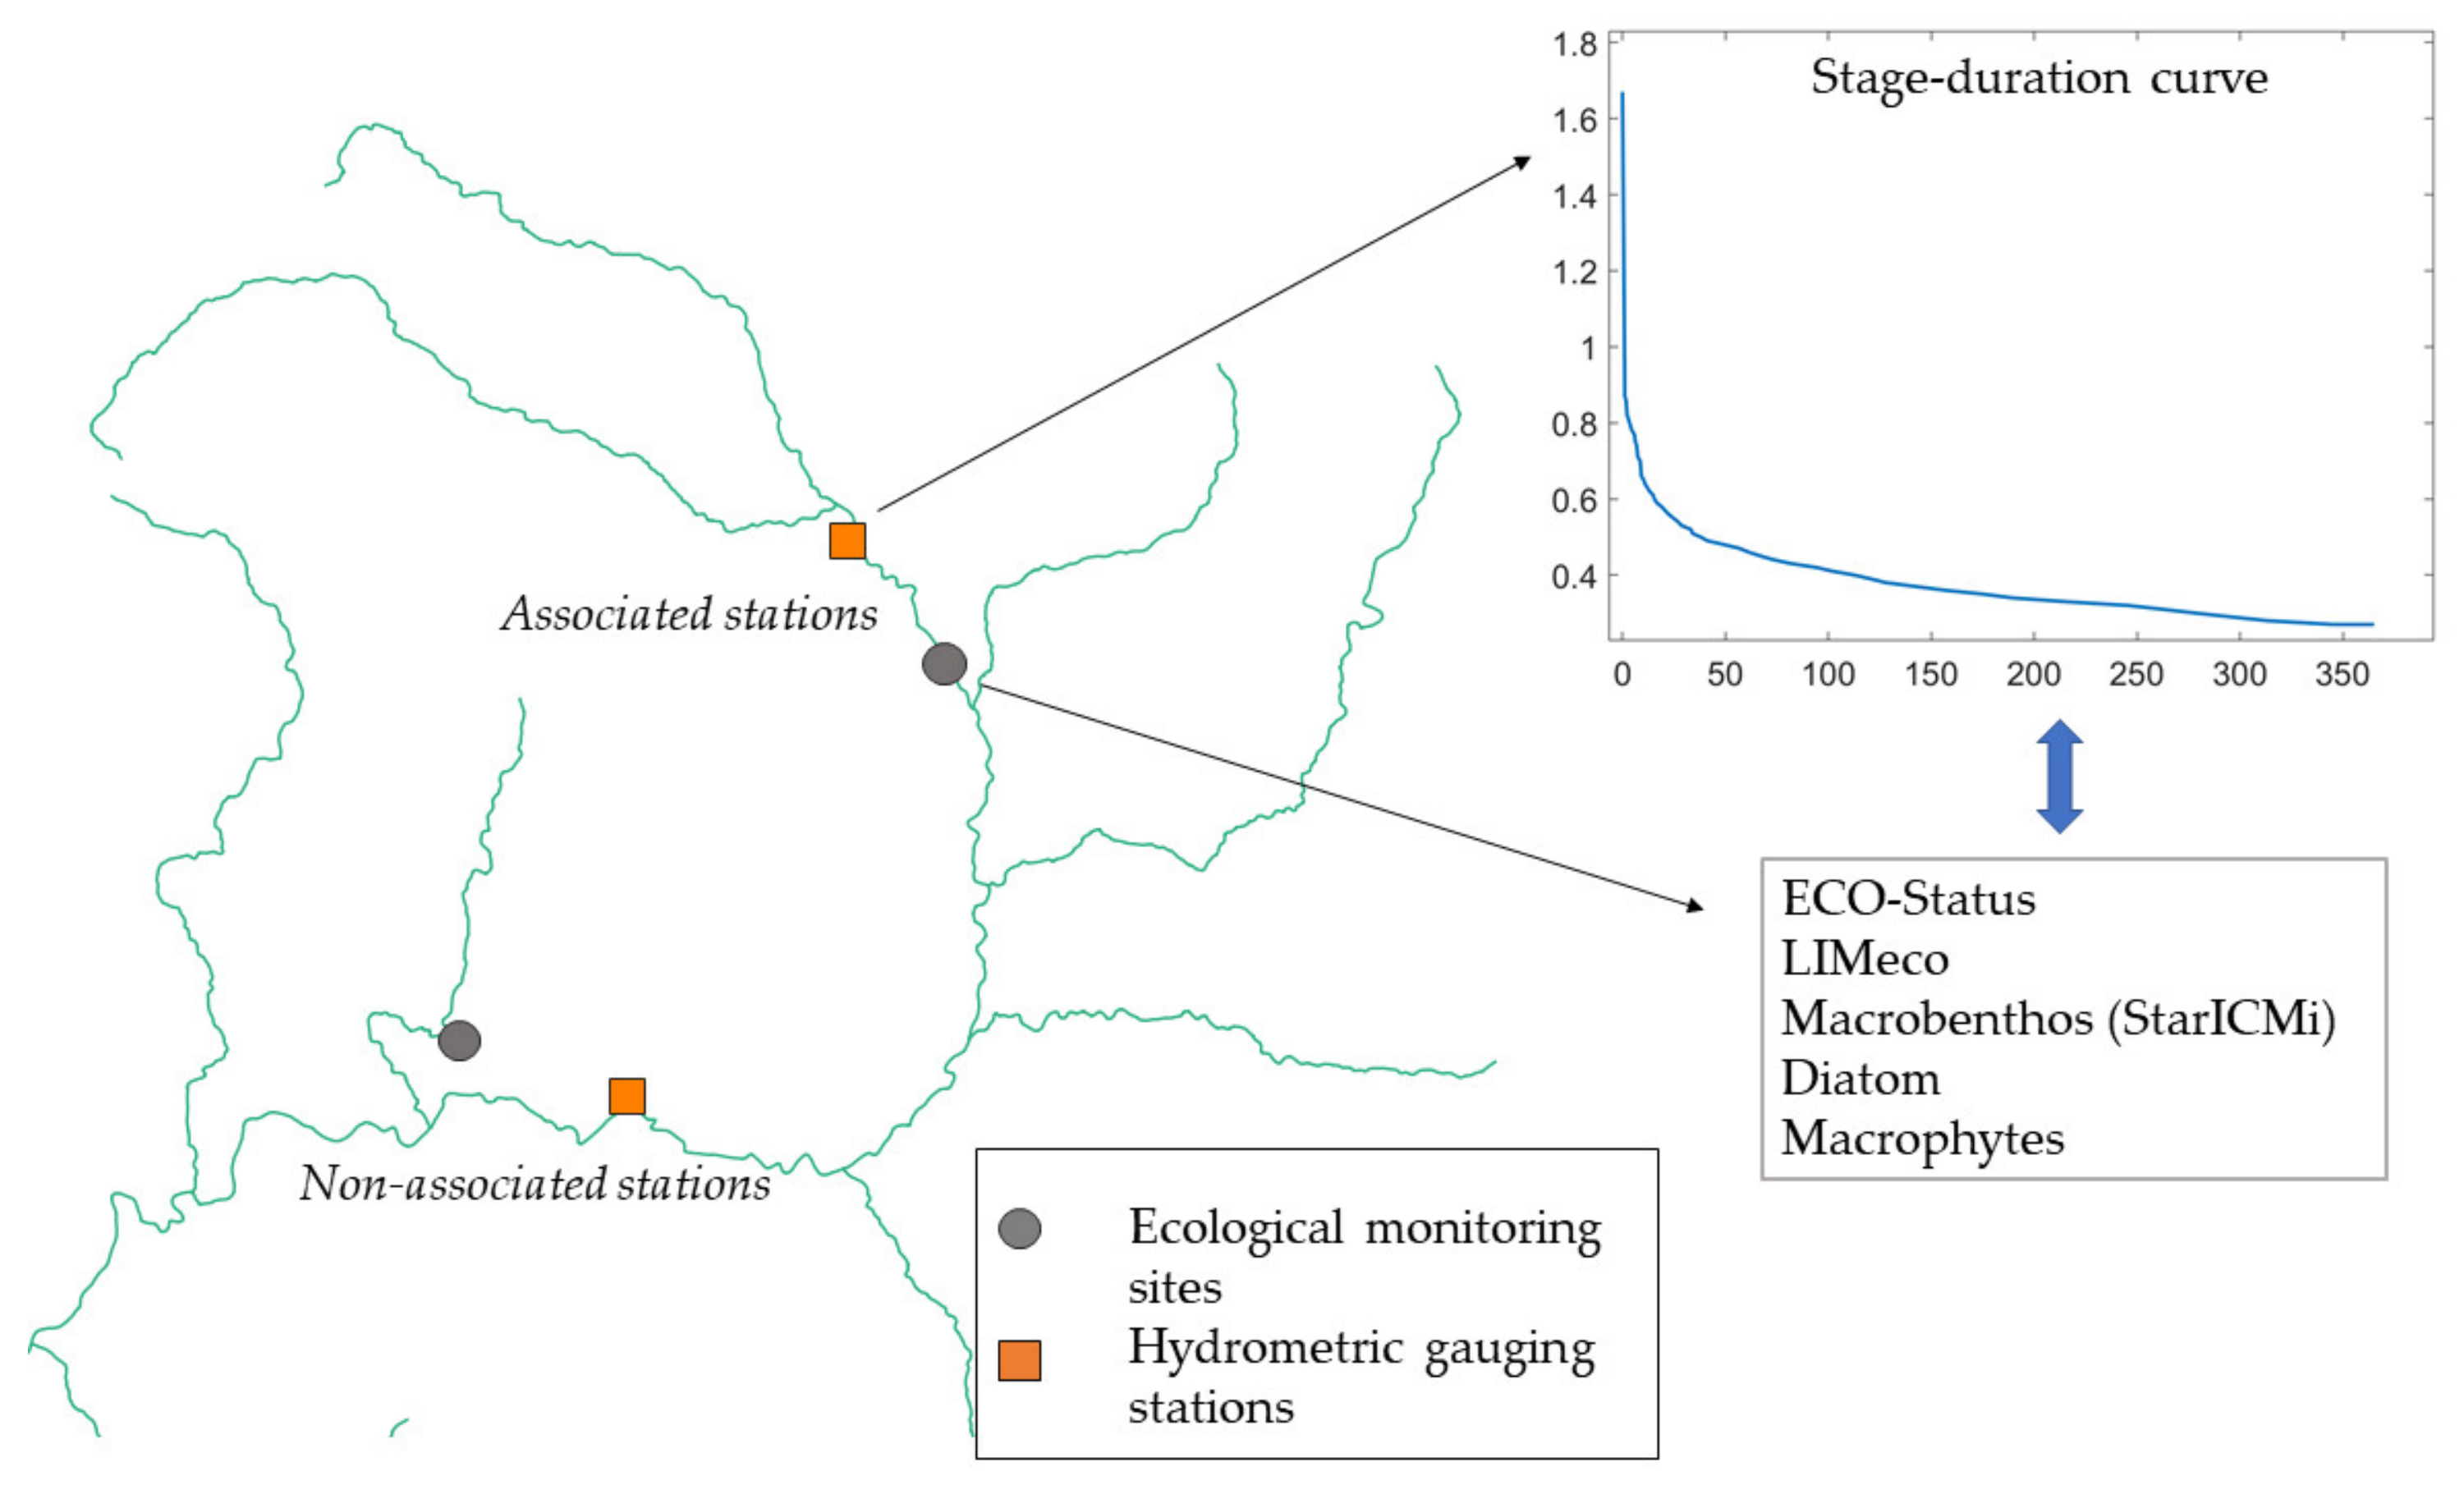
2.2. Methods
3. Results
4. Discussion
Supplementary Materials
Author Contributions
Funding
Institutional Review Board Statement
Informed Consent Statement
Data Availability Statement
Conflicts of Interest
References
- Forslund, A.; House, S.W. Securing Water for Ecosystems and Human Well-being: The Importance of Environmental Flows. In Proceedings of the World Water Week, Stockholm, Sweden, 16–22 August 2009. [Google Scholar]
- European Commission. Ecological Flows in the Implementation of the Water Framework Directive. Guidance Document No. 31. 2015. Available online: https://op.europa.eu/en/publication-detail/-/publication/b2369e0f-d154-11e5-a4b5-01aa75ed71a1/language-en (accessed on 1 November 2021).
- EU Parliament. Directive 2000/60/EC. 2000. Available online: https://eur-lex.europa.eu/legal-content/en/ALL/?uri=CELEX%3A32000L0060 (accessed on 16 December 2021).
- De Pauw, N.; Gabriels, W.; Goethals, P.L.M. Biological Monitoring of Rivers on Macroinvertebrates. In Biological Monitoring of Rivers: Applications and Perspectives; John Wiley & Sons: Chichester, UK, 2006. [Google Scholar] [CrossRef]
- Salmaso, F.; Crosa, G.; Espa, P.; Gentili, G.; Quadroni, S.; Zaccara, S. Benthic macroinvertebrates response to water management in a lowland river: Effects of hydro-power vs. irrigation off-stream diversions. Environ. Monit. Assess. 2017, 190, 33. [Google Scholar] [CrossRef]
- Verdonschot, P.F.M.; Moog, O. Tools for assessing European streams with macroinvertebrates: Major results and conclusions from the STAR project. Hydrobiologia 2006, 566, 299–309. [Google Scholar] [CrossRef] [Green Version]
- Rosenfeld, J.S. Developing flow-ecology relationships: Implications of nonlinear biological responses for water management. Freshw. Biol. 2017, 62, 1305–1324. [Google Scholar] [CrossRef] [Green Version]
- Stewart-Koster, B.; Olden, J.D.; Gido, K.B. Quantification des relations débit-écologie par des modèles linéaires fonctionnels. Hydrol. Sci. J. 2014, 59, 629–644. [Google Scholar] [CrossRef] [Green Version]
- Phelan, J.; Cuffney, T.; Patterson, L.; Eddy, M.; Dykes, R.; Pearsall, S.; Goudreau, C.; Mead, J.; Tarver, F. Fish and Invertebrate Flow-Biology Relationships to Support the Determination of Ecological Flows for North Carolina. J. Am. Water Resour. Assoc. 2017, 53, 42–55. [Google Scholar] [CrossRef]
- Davies, P.M.; Naiman, R.J.; Warfe, D.M.; Pettit, N.E.; Arthington, A.H.; Bunn, S.E. Flow–ecology relationships: Closing the loop on effective environmental flows. Mar. Freshw. Res. 2014, 65, 133–141. [Google Scholar] [CrossRef]
- Tonkin, J.D.; Jähnig, S.C.; Haase, P. The Rise of Riverine Flow-ecology and Environmental Flow Research. Environ. Process. 2014, 1, 323–330. [Google Scholar] [CrossRef]
- Richter, B.D.; Baumgartner, J.V.; Powell, J.; Braun, D.P. A Method for Assessing Hydrologic Alteration within Ecosystems. Conserv. Biol. 1996, 10, 1163–1174. [Google Scholar] [CrossRef] [Green Version]
- Belmar, O.; Martínez, N.V.; Ibanez, C.; Caiola, N. Linking fish-based biological indicators with hydrological dynamics in a Mediterranean river: Relevance for environmental flow regimes. Ecol. Indic. 2018, 95, 492–501. [Google Scholar] [CrossRef]
- Logan, L.H.; Gupta, R.S.; Ando, A.; Suski, C.; Stillwell, A.S. Quantifying tradeoffs between electricity generation and fish populations via population habitat duration curves. Ecol. Model. 2021, 440, 109373. [Google Scholar] [CrossRef]
- Ceola, S.; Pugliese, A.; Ventura, M.; Galeati, G.; Montanari, A.; Castellarin, A. Hydro-power production and fish habitat suitability: Assessing impact and effectiveness of ecological flows at regional scale. Adv. Water Resour. 2018, 116, 29–39. [Google Scholar] [CrossRef]
- Hough, I.M.; Warren, P.H.; Shucksmith, J. Designing an environmental flow framework for impounded river systems through modelling of invertebrate habitat quality. Ecol. Indic. 2019, 106, 105445. [Google Scholar] [CrossRef]
- Acuña, V.; Jorda-Capdevila, D.; Vezza, P.; De Girolamo, A.M.; McClain, M.E.; Stubbington, R.; Pastor, A.V.; Lamouroux, N.; Von Schiller, D.; Munné, A.; et al. Accounting for flow intermittency in environmental flows design. J. Appl. Ecol. 2020, 57, 742–753. [Google Scholar] [CrossRef]
- Larsen, S.; Bruno, M.C.; Zolezzi, G. WFD ecological status indicator shows poor correlation with flow parameters in a large Alpine catchment. Ecol. Indic. 2019, 98, 704–711. [Google Scholar] [CrossRef]
- Buffagni, A.; Erba, S.; Cazzola, M.; Murray-Bligh, J.; Soszka, H.; Genoni, P. The STAR common metrics approach to the WFD intercalibration process: Full application for small, lowland rivers in three European countries. Hydrobiologia 2006, 566, 379–399. [Google Scholar] [CrossRef]
- Guareschi, S.; Laini, A.; Sánchez-Montoya, M.M. How do low-abundance taxa affect river biomonitoring? Exploring the response of different macroinvertebrate-based indices. J. Limnol. 2016, 76, 9–20. [Google Scholar] [CrossRef]
- Laini, A.; Bolpagni, R.; Cancellario, T.; Guareschi, S.; Racchetti, E.; Viaroli, P. Testing the response of macroinvertebrate communities and biomonitoring indices under multiple stressors in a lowland regulated river. Ecol. Indic. 2018, 90, 47–53. [Google Scholar] [CrossRef]
- Quadroni, S.; Crosa, G.; Gentili, G.; Espa, P. Response of stream benthic macroinvertebrates to current water management in Alpine catchments massively developed for hydropower. Sci. Total. Environ. 2017, 609, 484–496. [Google Scholar] [CrossRef]
- Bo, T.; Doretto, A.; Laini, A.; Bona, F.; Fenoglio, S. Biomonitoring with macroinvertebrate communities in Italy: What happened to our past and what is the future? J. Limnol. 2016, 76, 21–28. [Google Scholar] [CrossRef] [Green Version]
- Azzellino, A.; Antonelli, M.; Canobbio, S.; Çevirgen, S.; Mezzanotte, V.; Piana, A.; Salvetti, R. Searching for a compromise between ecological quality targets, and social and ecosystem costs for heavily modified water bodies (HMWBs): The Lambro-Seveso-Olona system case study. Water Sci. Technol. 2013, 68, 681–688. [Google Scholar] [CrossRef] [Green Version]
- Lu, X.; Liu, Y.; Fan, Y. Diatom Taxonomic Composition as a Biological Indicator of the Ecological Health and Status of a River Basin under Agricultural Influence. Water 2020, 12, 2067. [Google Scholar] [CrossRef]
- Bytyçi, P.; Czikkely, M.; Shala-Abazi, A.; Fetoshi, O.; Ismaili, M.; Hyseni-Spahiu, M.; Ymeri, P.; Kabashi-Kastrati, E.; Millaku, F. Macrophytes as biological indicators of organic pollution in the Lepenci River Basin in Kosovo. J. Freshw. Ecol. 2020, 35, 105–121. [Google Scholar] [CrossRef] [Green Version]
- Wiederkehr, J.; Grac, C.; Fabrègue, M.; Fontan, B.; Labat, F.; Le Ber, F.; Trémolières, M. Experimental study of uncertainties on the macrophyte index (IBMR) based on species identification and cover. Ecol. Indic. 2015, 50, 242–250. [Google Scholar] [CrossRef]
- Latsiou, A.; Kouvarda, T.; Stefanidis, K.; Papaioannou, G.; Gritzalis, K.; Dimitriou, E. Pressures and Status of the Riparian Vegetation in Greek Rivers: Overview and Preliminary Assessment. Hydrology 2021, 8, 55. [Google Scholar] [CrossRef]
- Costa, F.; Vieira, A. Decision Support Tools for River Restoration: The Implementation of the “River Habitat Survey” Methodology on the River Selho (Guimarães Municipality, Northwest Portugal). Hydrology 2021, 8, 69. [Google Scholar] [CrossRef]
- McKenna, J.E.; Reeves, H.W.; Seelbach, P.W. Measuring and evaluating ecological flows from streams to regions: Steps towards national coverage. Freshw. Biol. 2018, 63, 874–890. [Google Scholar] [CrossRef]
- Mezger, G.; De Stefano, L.; Del Tánago, M.G. Assessing the Establishment and Implementation of Environmental Flows in Spain. Environ. Manag. 2019, 64, 721–735. [Google Scholar] [CrossRef]
- Palau, A.; Alcázar, J. The basic flow method for incorporating flow variability in environmental flows. River Res. Appl. 2012, 28, 93–102. [Google Scholar] [CrossRef]
- Caldwell, P.V.; Kennen, J.G.; Sun, G.; Kiang, J.E.; Butcher, J.; Eddy, M.C.; Hay, L.E.; Lafontaine, J.H.; Hain, E.F.; Nelson, S.; et al. A comparison of hydrologic models for ecological flows and water availability. Ecohydrology 2015, 8, 1525–1546. [Google Scholar] [CrossRef]
- Gălie, A.-C.; Mătreață, M.; Tănase, I.; Rădulescu, D. The Romanian Ecological Flow Method, RoEflow, Developed in Line with the EU Water Framework Directive. Concept and Case Studies. Sustainability 2021, 13, 7378. [Google Scholar] [CrossRef]
- Worland, S.C.; Farmer, W.; Kiang, J.E. Improving predictions of hydrological low-flow indices in ungaged basins using machine learning. Environ. Model. Softw. 2018, 101, 169–182. [Google Scholar] [CrossRef]
- Pulido-Calvo, I.; Gutiérrez-Estrada, J.C.; Sanz-Fernández, V. Drought and Ecological Flows in the Lower Guadiana River Basin (Southwest Iberian Peninsula). Water 2020, 12, 677. [Google Scholar] [CrossRef] [Green Version]
- Regional Agency of Tuscany for the Environmental Protection (ARPAT). Monitoraggio Ambientale dei Corpi Idrici Superficiali: Fiumi, Laghi, Acque di Transizione. Risultati Parziali Secondo Anno Monitoraggio Triennio 2019–2021. Available online: http://www.arpat.toscana.it/documentazione/catalogo-pubblicazioni-arpat/monitoraggio-ufficiale-delle-acque-superficiali/monitoraggio-ambientale-dei-corpi-idrici-superficiali-fiumi-laghi-acque-di-transizione-risultati-2020 (accessed on 16 December 2021).
- United States Geological Survey (USGS). USGS: Flood Frequency Analyses; USGS: Washington, DC, USA, 1960. [Google Scholar]
- Vogel, R.M.; Fennessey, N.M. Flow Duration Curves ii: A Review of Applications in Water Resources Planning. J. Am. Water Resour. Assoc. 1995, 31, 1029–1039. [Google Scholar] [CrossRef]
- Richter, B.; Baumgartner, J.; Wigington, R.; Braun, D. How much water does a river need? Freshw. Biol. 1997, 37, 231–249. [Google Scholar] [CrossRef] [Green Version]
- Buffagni, A.; Armanini, D.G.; Erba, S. Does the lentic-lotic character of rivers affect invertebrate metrics used in the assessment of ecological quality? J. Limnol. 2009, 68, 92–105. [Google Scholar] [CrossRef]
- Grela, J.; Madej, P. Assessment of the Possibilities for Determining the Channel Environmental flow Based on the Environmental Requirements of Ichthyofauna and Macrozoobentos. Acta Sci. Pol. Form. Circumiectus 2019, 18, 59–70. [Google Scholar] [CrossRef]
- Kammel, L.; Maddock, I.; Kemp, P. Ecohydraulics—An Integrated Approach; John Wiley and Sons: Hoboken, NJ, USA, 2013. [Google Scholar]
- Marx, A.; Kumar, R.; Thober, S.; Zink, M.; Wanders, N.; Wood, E.; Ming, P.; Sheffield, J.; Samaniego, L. Climate change alters low flows in Europe under a 1.5, 2, and 3 degree global warming. Hydrol. Earth Syst. Sci. Discuss. 2017, 1–24. [Google Scholar] [CrossRef] [Green Version]
- Schneider, C.; Laizé, C.L.R.; Acreman, M.C.; Flörke, M. How will climate change modify river flow regimes in Europe? Hydrol. Earth Syst. Sci. 2013, 17, 325–339. [Google Scholar] [CrossRef] [Green Version]
- Coch, A.; Mediero, L. Trends in low flows in Spain in the period 1949–2009. Hydrol. Sci. J. 2016, 61, 568–584. [Google Scholar] [CrossRef]
- De Filippis, G.; Ercoli, L.; Rossetto, R. A Spatially Distributed, Physically-Based Modeling Approach for Estimating Agricultural Nitrate Leaching to Groundwater. Hydrology 2021, 8, 8. [Google Scholar] [CrossRef]
- Tung, T.M.; Yaseen, Z.M. A survey on river water quality modelling using artificial intelligence models: 2000–2020. J. Hydrol. 2020, 585, 124670. [Google Scholar] [CrossRef]
- Shamshirband, S.; Nodoushan, E.J.; Adolf, J.E.; Manaf, A.A.; Mosavi, A.; Chau, K.-W. Ensemble models with uncertainty analysis for multi-day ahead forecasting of chlorophyll a concentration in coastal waters. Eng. Appl. Comput. Fluid Mech. 2018, 13, 91–101. [Google Scholar] [CrossRef] [Green Version]
- Zhou, Y. Real-time probabilistic forecasting of river water quality under data missing situation: Deep learning plus post-processing techniques. J. Hydrol. 2020, 589, 125164. [Google Scholar] [CrossRef]


| ECS | |||||||||||
| ECO-Status | 1 | LIMeco | |||||||||
| LIMeco | −0.47 | 1 | MB | ||||||||
| Macrobenthos | −0.80 | 0.62 | 1 | Diatom | |||||||
| Diatom | −0.32 | 0.34 | 0.43 | 1 | MP | ||||||
| Macrophytes | −0.19 | 0.58 | 0.56 | 0.46 | 1 | H365 | |||||
| H365 | 0.26 | −0.30 | −0.32 | −0.34 | −0.07 | 1 | H358 | ||||
| H358 | 0.25 | −0.30 | −0.31 | −0.33 | −0.07 | 1 | 1 | H274 | |||
| H274 | 0.25 | −0.33 | −0.33 | −0.33 | −0.10 | 0.99 | 0.99 | 1 | H7 | ||
| H7 | 0.18 | −0.35 | −0.32 | −0.35 | −0.18 | 0.91 | 0.91 | 0.94 | 1 | H1 | |
| H1 | 0.09 | −0.42 | −0.32 | −0.33 | −0.29 | 0.67 | 0.68 | 0.70 | 0.87 | 1 | H1–H365 |
| H1–H365 | −0.09 | −0.34 | −0.17 | −0.17 | −0.37 | 0.14 | 0.15 | 0.19 | 0.47 | 0.83 | 1 |
Publisher’s Note: MDPI stays neutral with regard to jurisdictional claims in published maps and institutional affiliations. |
© 2021 by the authors. Licensee MDPI, Basel, Switzerland. This article is an open access article distributed under the terms and conditions of the Creative Commons Attribution (CC BY) license (https://creativecommons.org/licenses/by/4.0/).
Share and Cite
Arrighi, C.; Bonamini, I.; Simoncini, C.; Bartalesi, S.; Castelli, F. WFD Ecological Quality Indicators Are Poorly Correlated with Water Levels in River Catchments in Tuscany (Italy). Hydrology 2021, 8, 185. https://0-doi-org.brum.beds.ac.uk/10.3390/hydrology8040185
Arrighi C, Bonamini I, Simoncini C, Bartalesi S, Castelli F. WFD Ecological Quality Indicators Are Poorly Correlated with Water Levels in River Catchments in Tuscany (Italy). Hydrology. 2021; 8(4):185. https://0-doi-org.brum.beds.ac.uk/10.3390/hydrology8040185
Chicago/Turabian StyleArrighi, Chiara, Isabella Bonamini, Cristina Simoncini, Stefano Bartalesi, and Fabio Castelli. 2021. "WFD Ecological Quality Indicators Are Poorly Correlated with Water Levels in River Catchments in Tuscany (Italy)" Hydrology 8, no. 4: 185. https://0-doi-org.brum.beds.ac.uk/10.3390/hydrology8040185