
Origins of Sulfate in Groundwater and Surface Water of the Rio Grande Floodplain, Texas, USA and Chihuahua, Mexico


Abstract
:1. Introduction
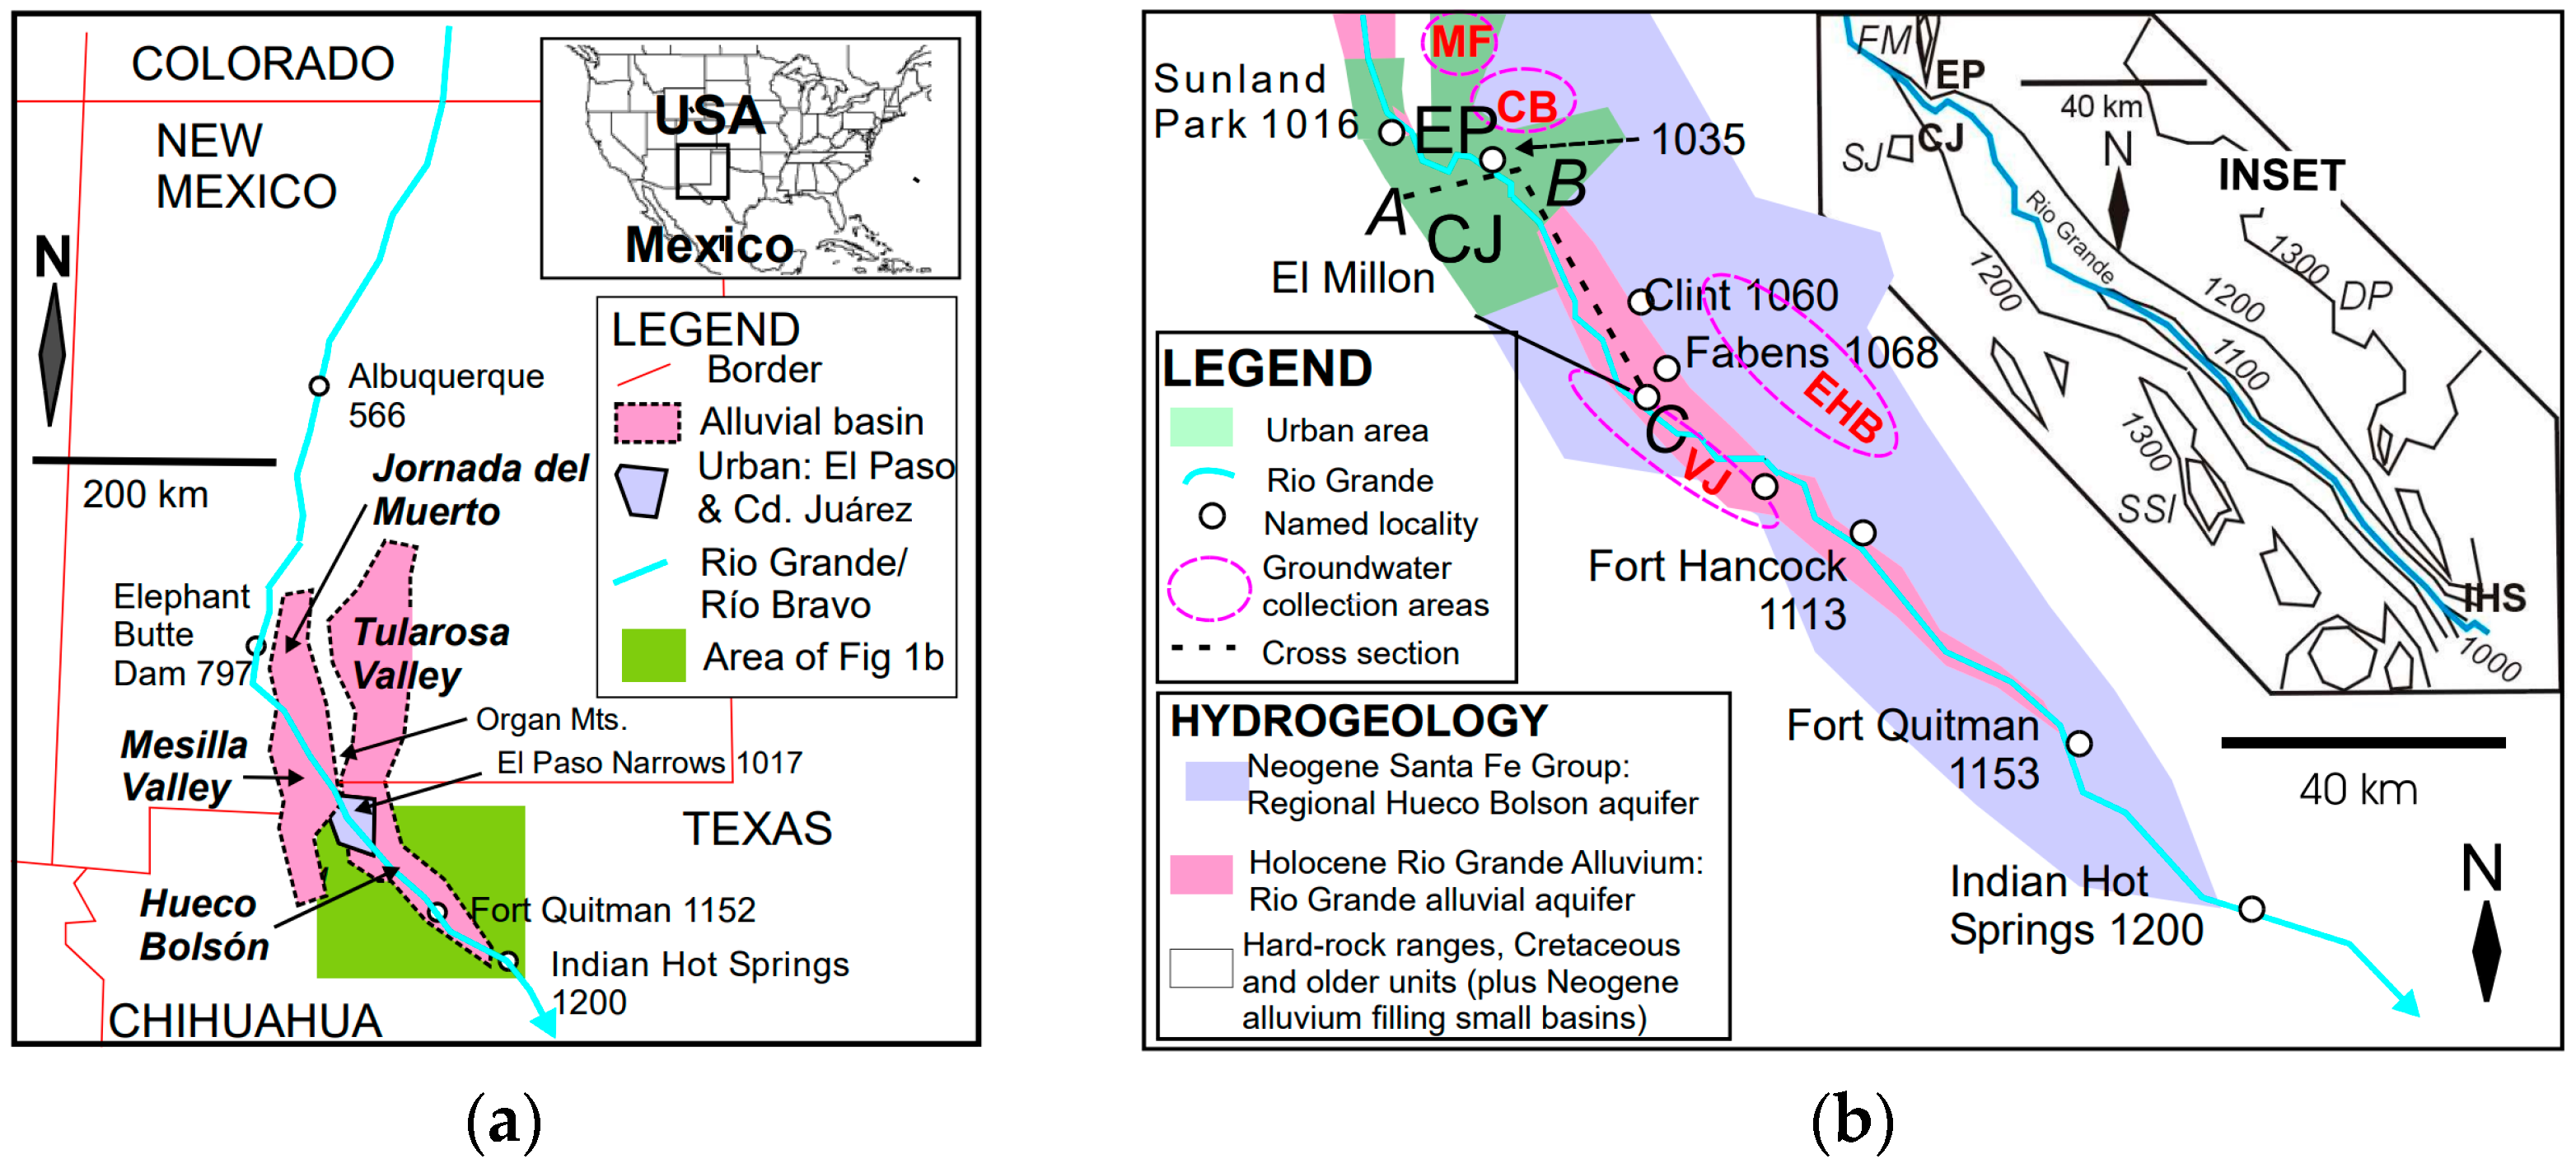
1.1. Study Area
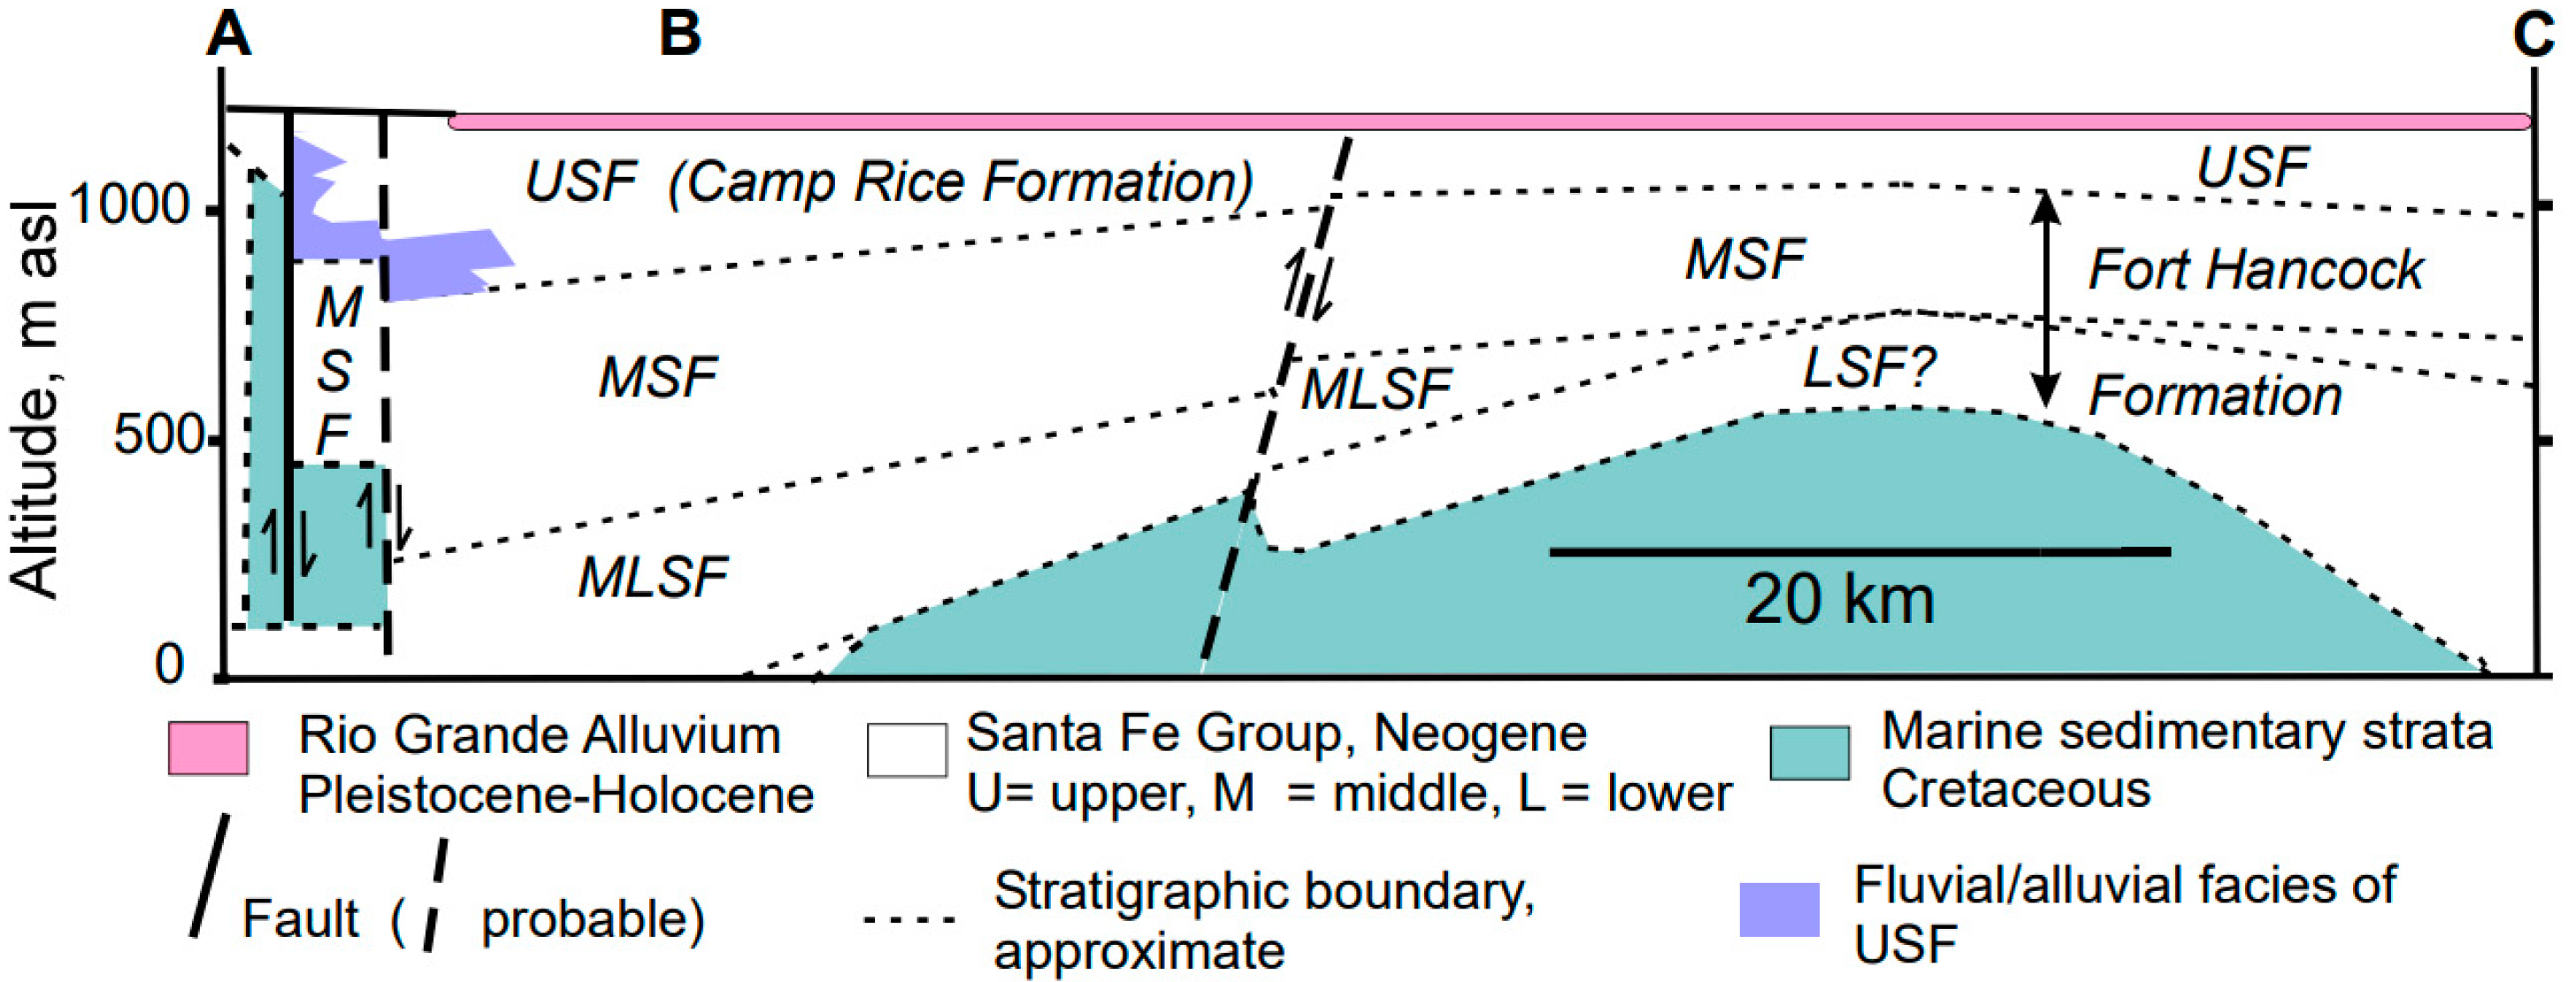
1.2. Basin Hydrology
1.3. Previous Isotope Studies, Hueco Bolsón
2. Materials and Methods
3. Results
3.1. Groundwater
3.2. Irrigation Drains and Seeps
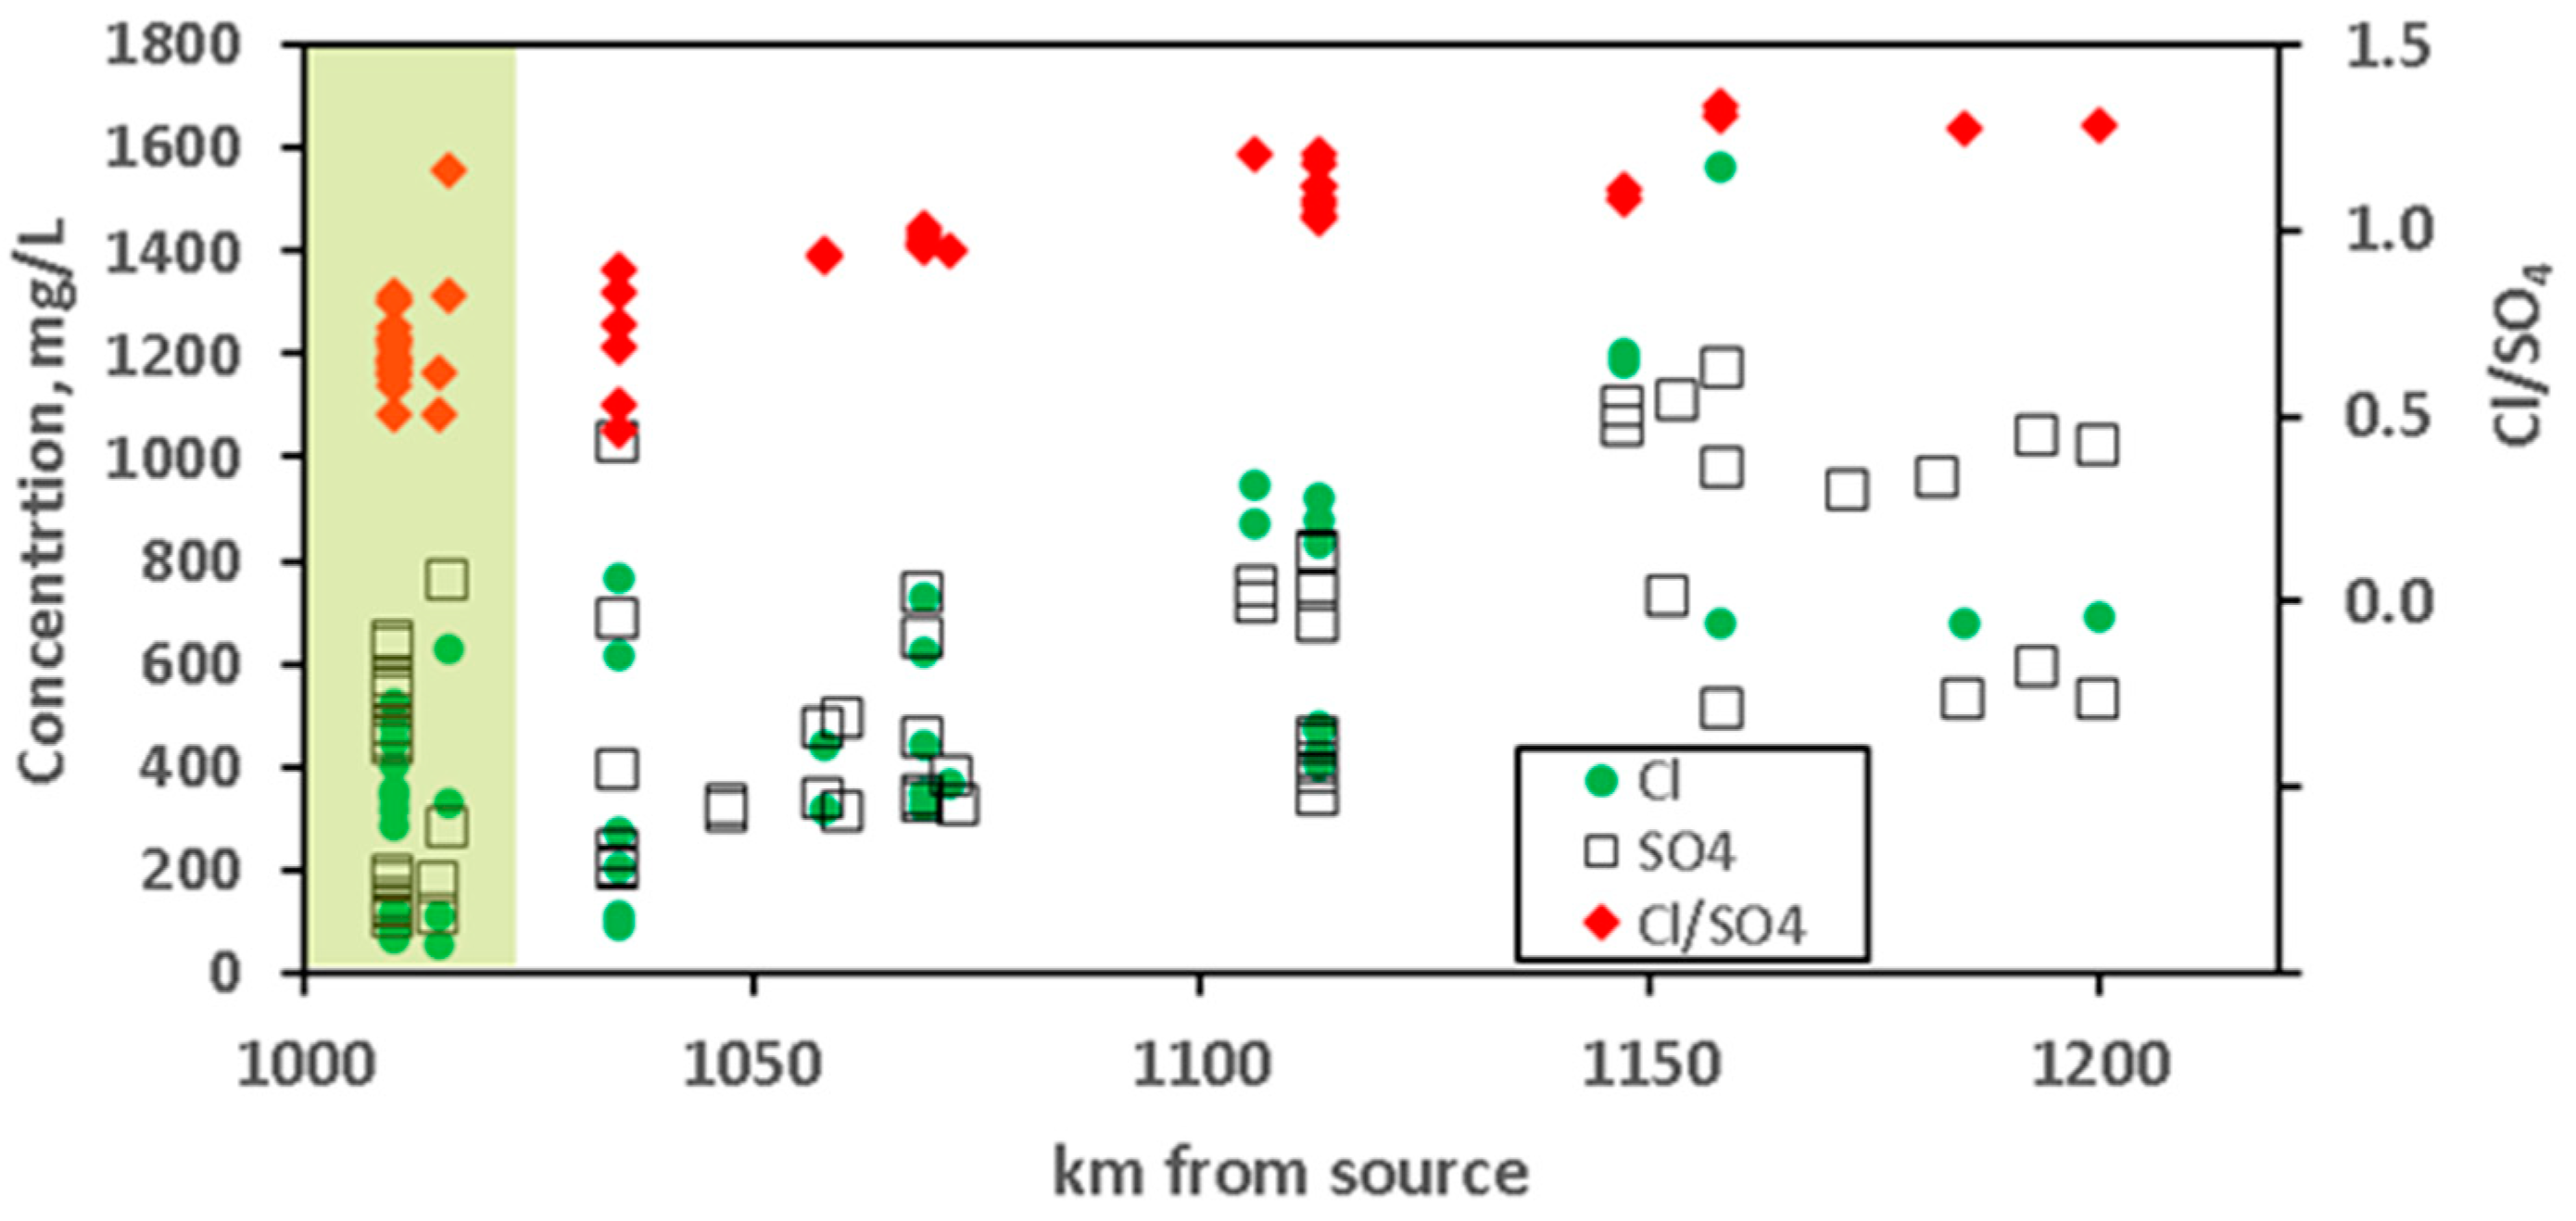
3.3. Rio Grande Surface Water
3.4. Soil Amendments
4. Discussion
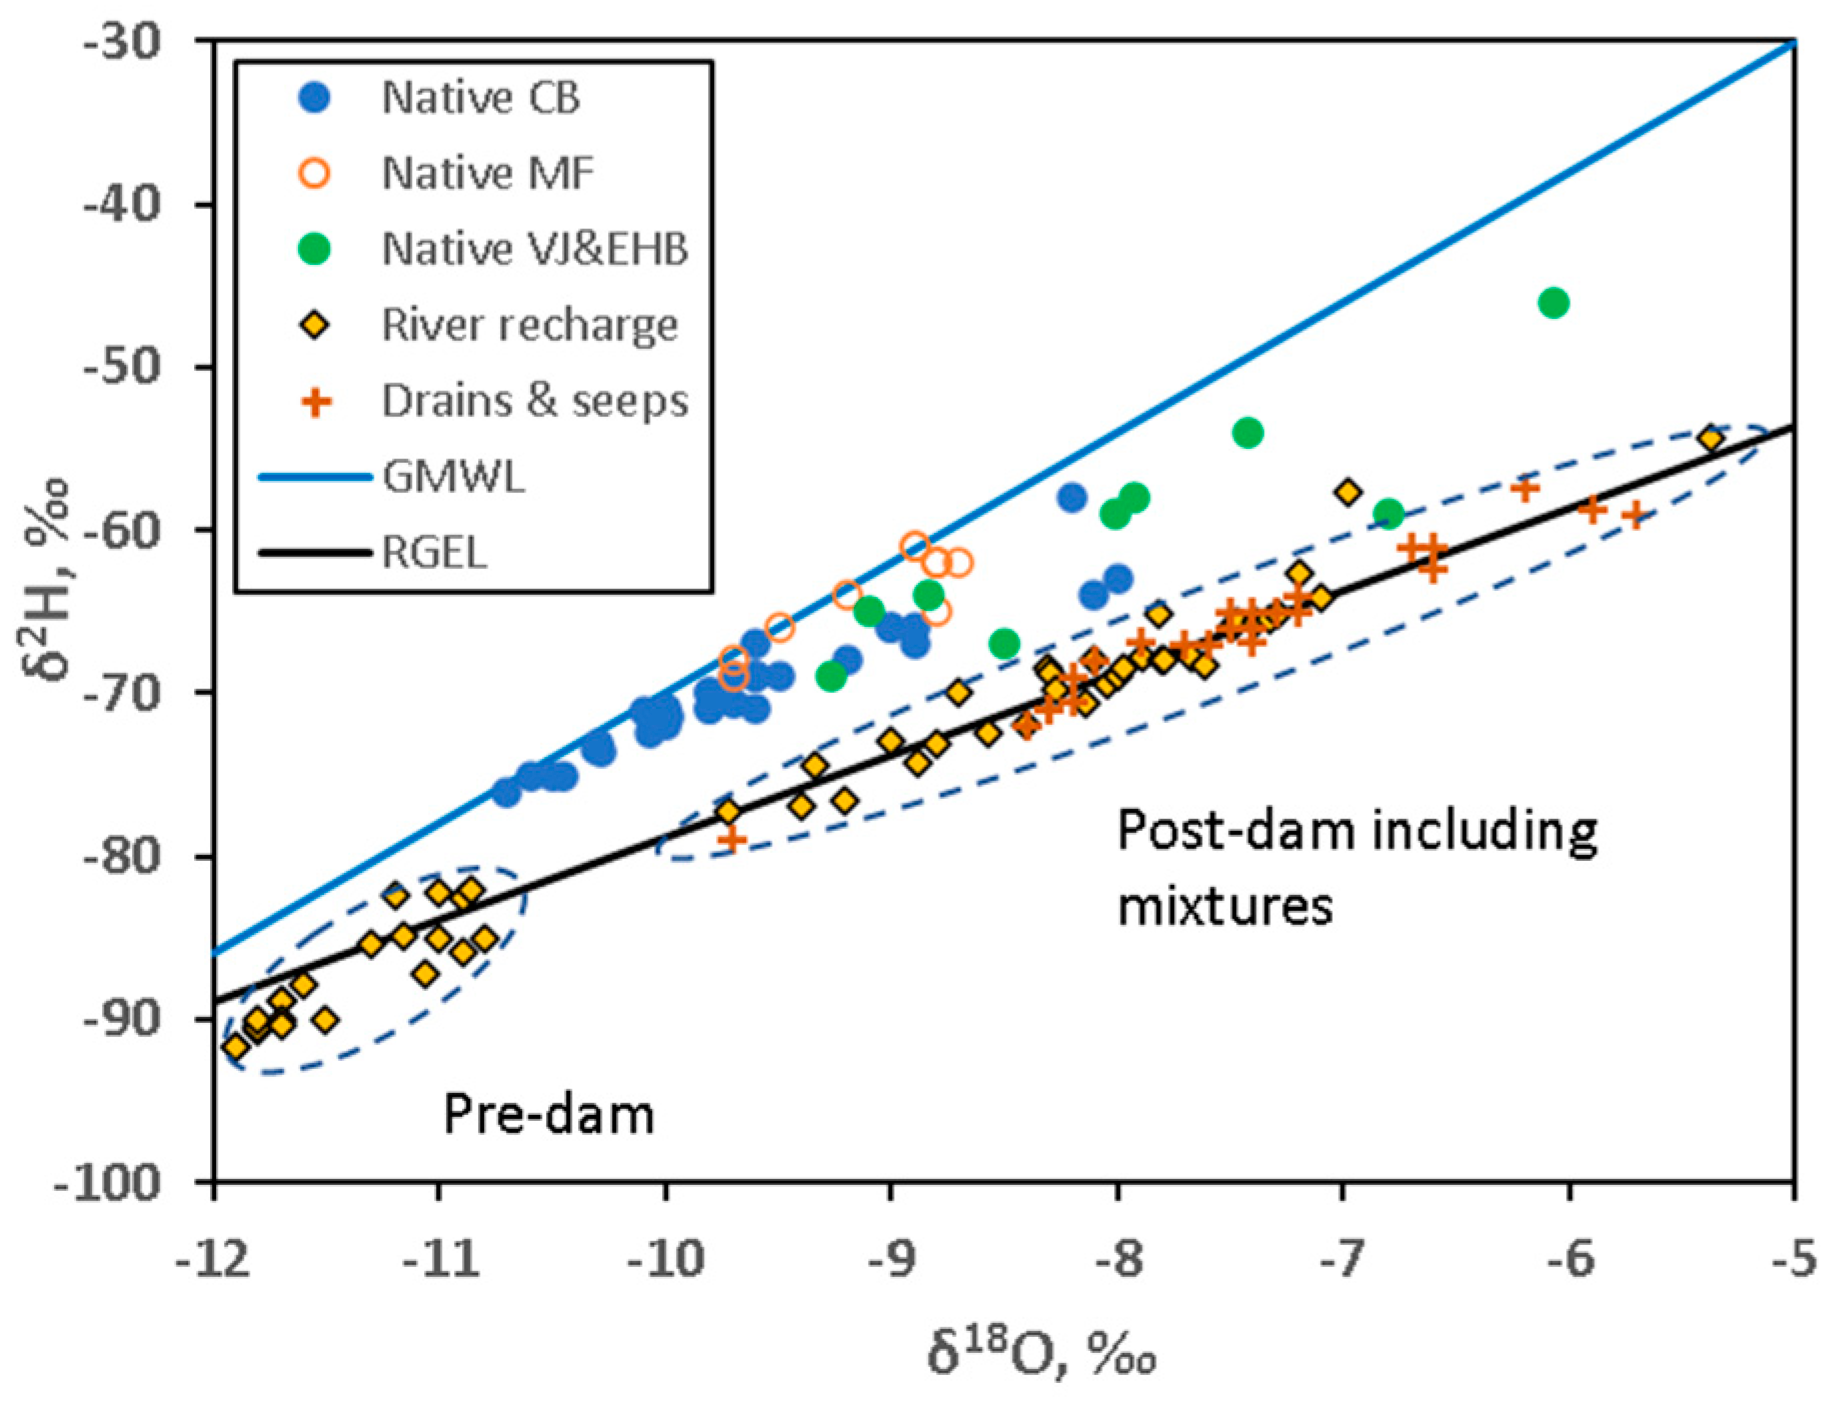
4.1. Pre-Dam Versus Post-Dam Groundwater
4.2. Rio Grande Surface Water Entering the Hueco Bolsón
4.3. Rio Grande Surface Water, 1035–1060 km
4.4. Rio Grande Surface Water Downstream of Fabens
4.5. Spatial Distribution of δ34S in Surface Water
4.6. Sulfate-δ18O as a Constraint
4.7. Agricultural or Geological Sulfate Sources?
4.8. Limitations of Study
5. Conclusions
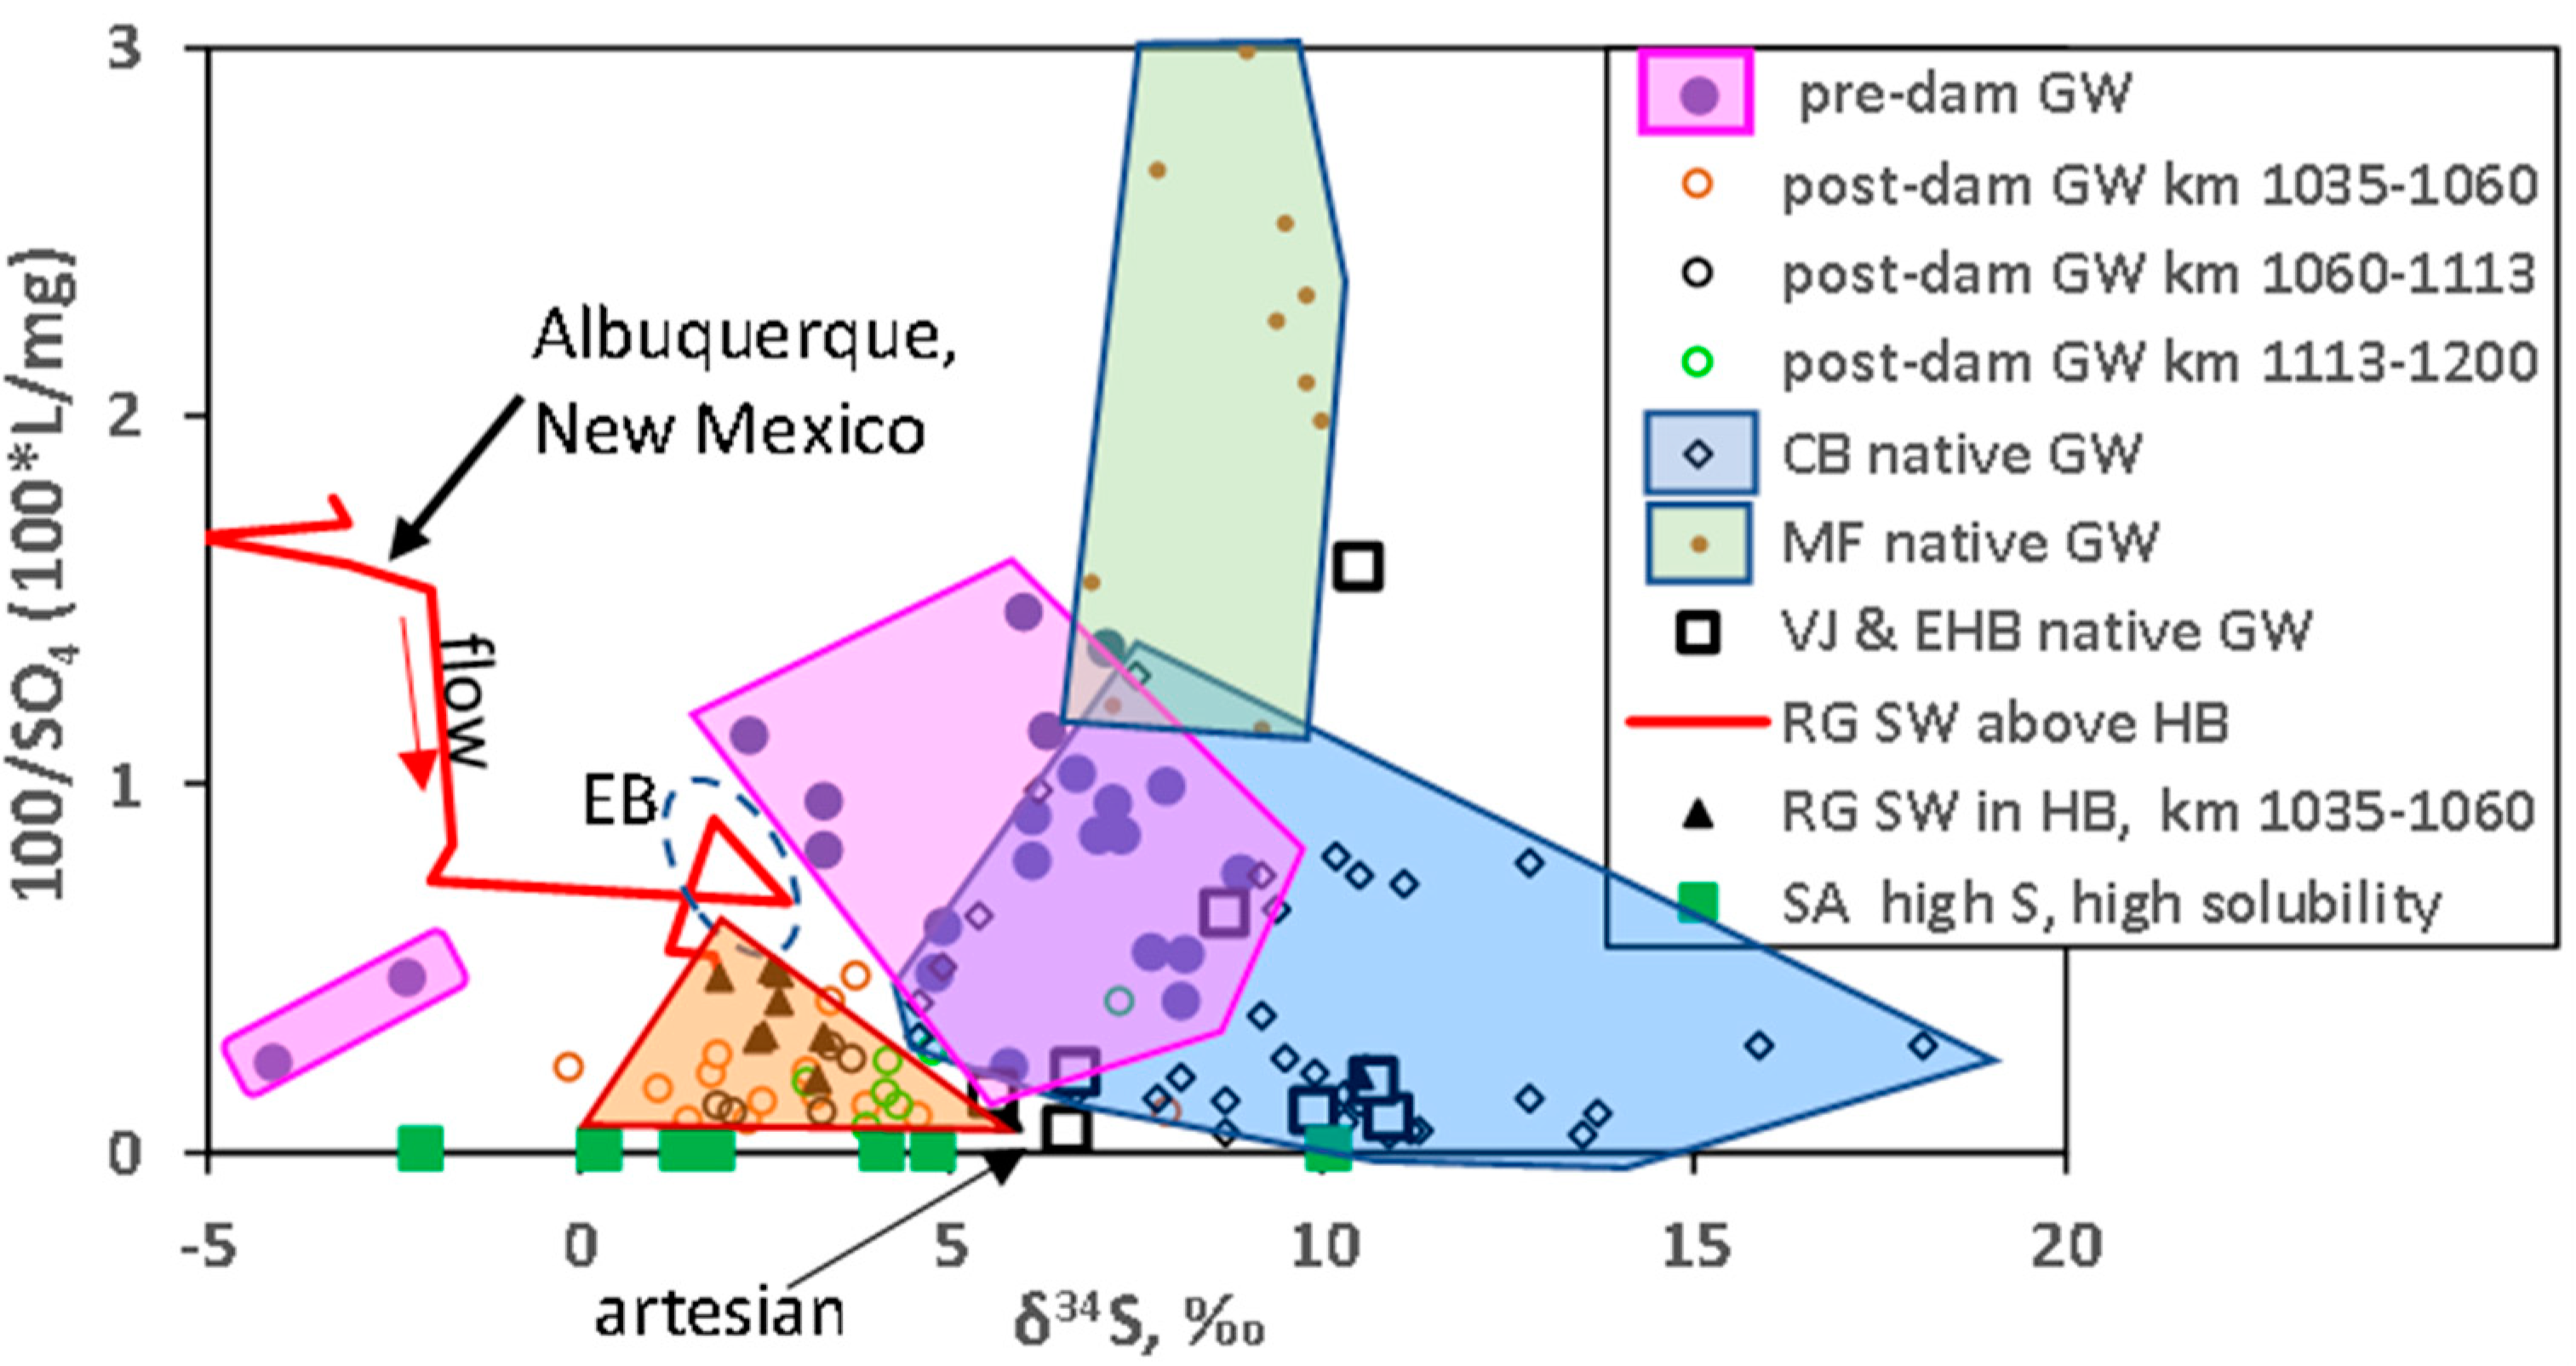
- Sulfate entering the Hueco Bolsón in Rio Grande surface water is controlled by the interaction of the river with Mesilla Valley agricultural and geologic salinity sources, as described in [14]. Deep-basin groundwater seeps at the terminus of Mesilla Valley contribute measurable sulfate at times of low flow in the river.
- Overlapping ranges of δ34S are observed in pre-dam (+2 to +9‰, two outliers < 0‰) and post-dam (0 to +7‰) groundwater. Most post-dam groundwater has higher [SO4] than pre-dam groundwater. High [SO4] in post-dam groundwater results from additions of sulfate from common soil amendments.
- The difference between sulfate in pre-dam and post-dam groundwater (identified by evaporation effects on O and H isotopes) reflects intensification of agriculture in the Hueco Bolsón since the construction of dams and irrigation schemes.
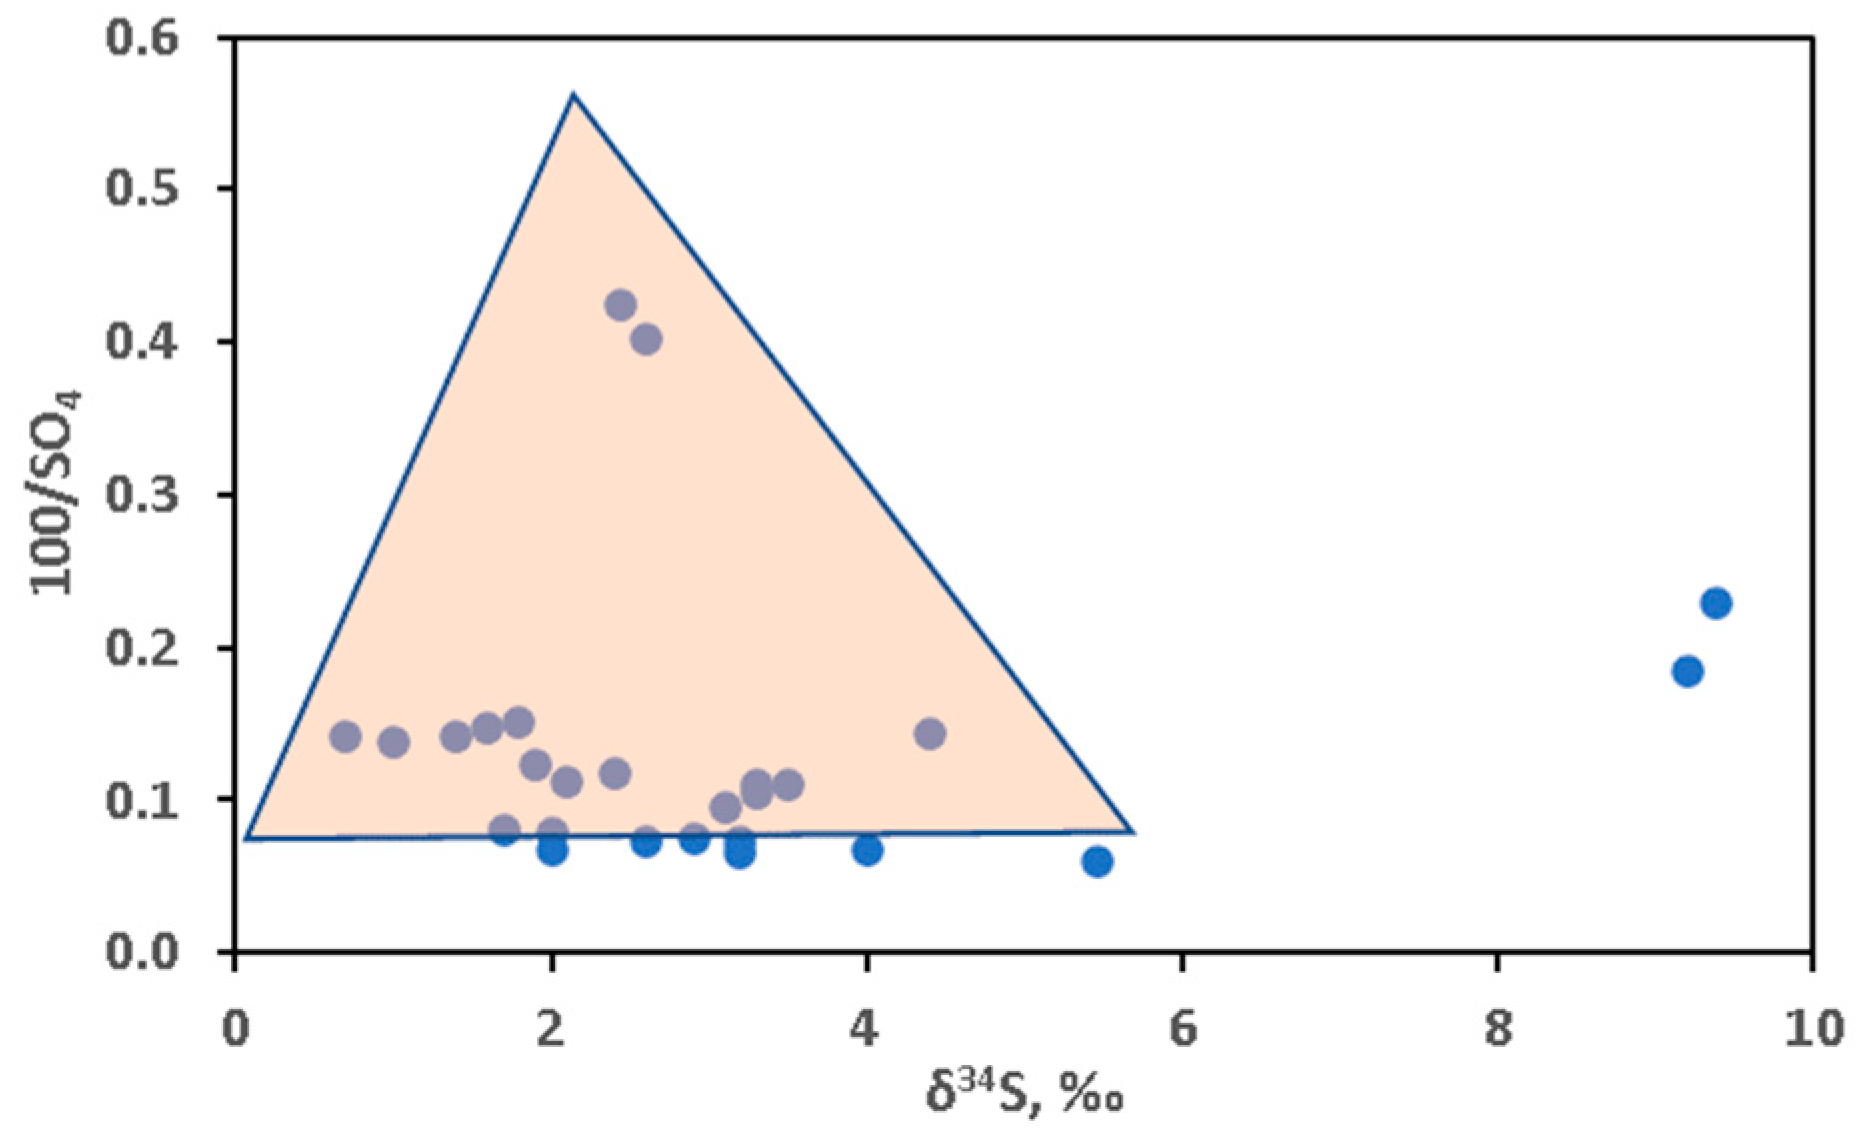
- Most water from agricultural drains and seeps is post-dam recharge with a δ34S range of 0 to +6‰, corresponding to the range for common soil amendments.
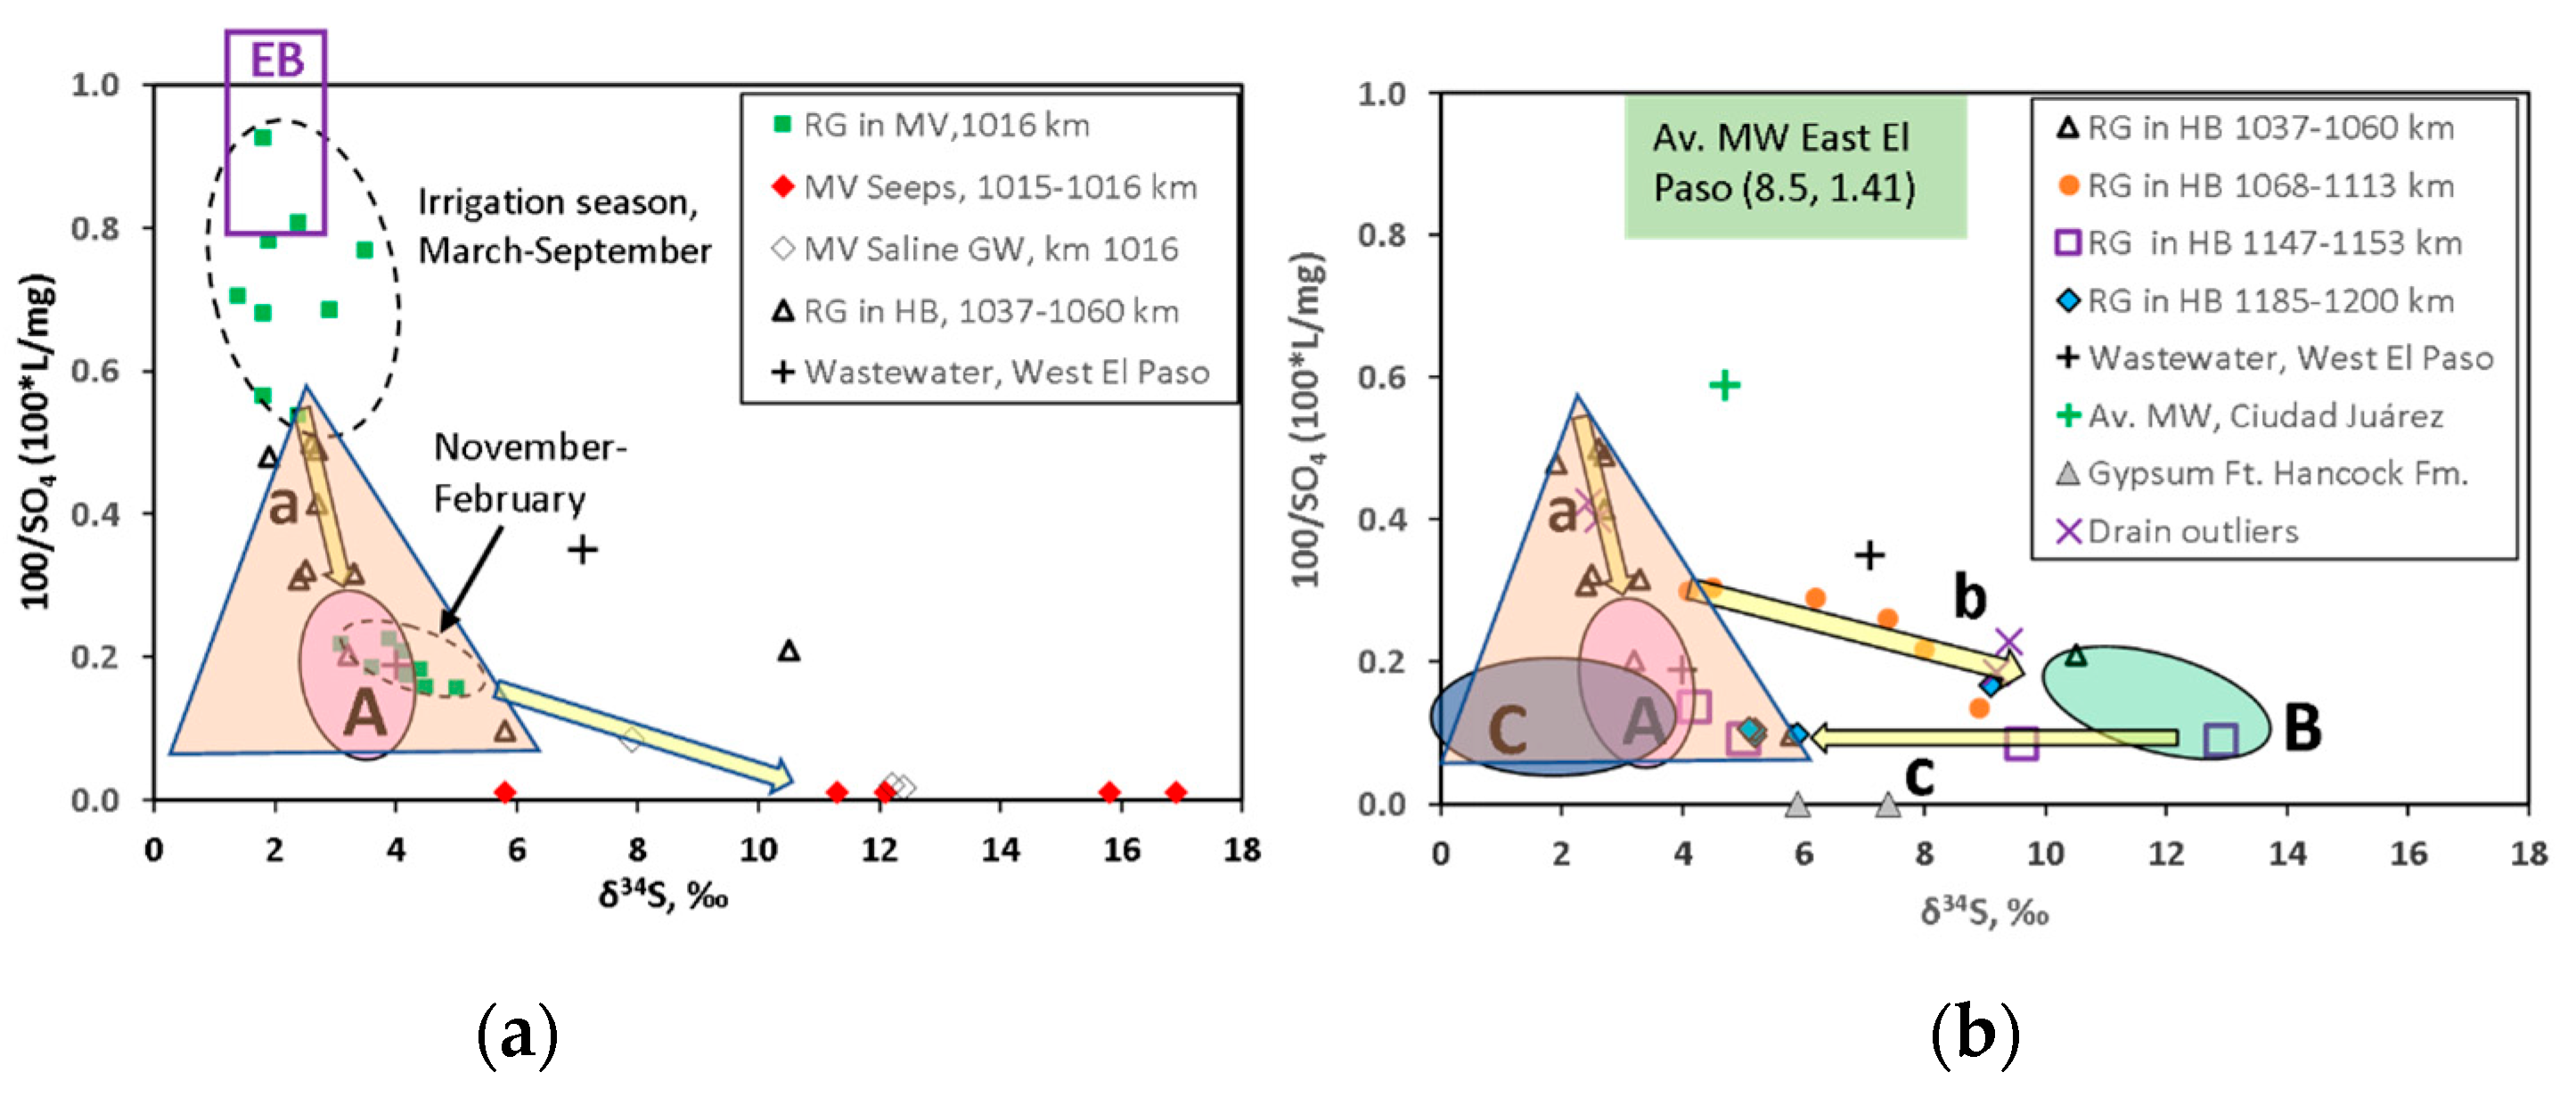
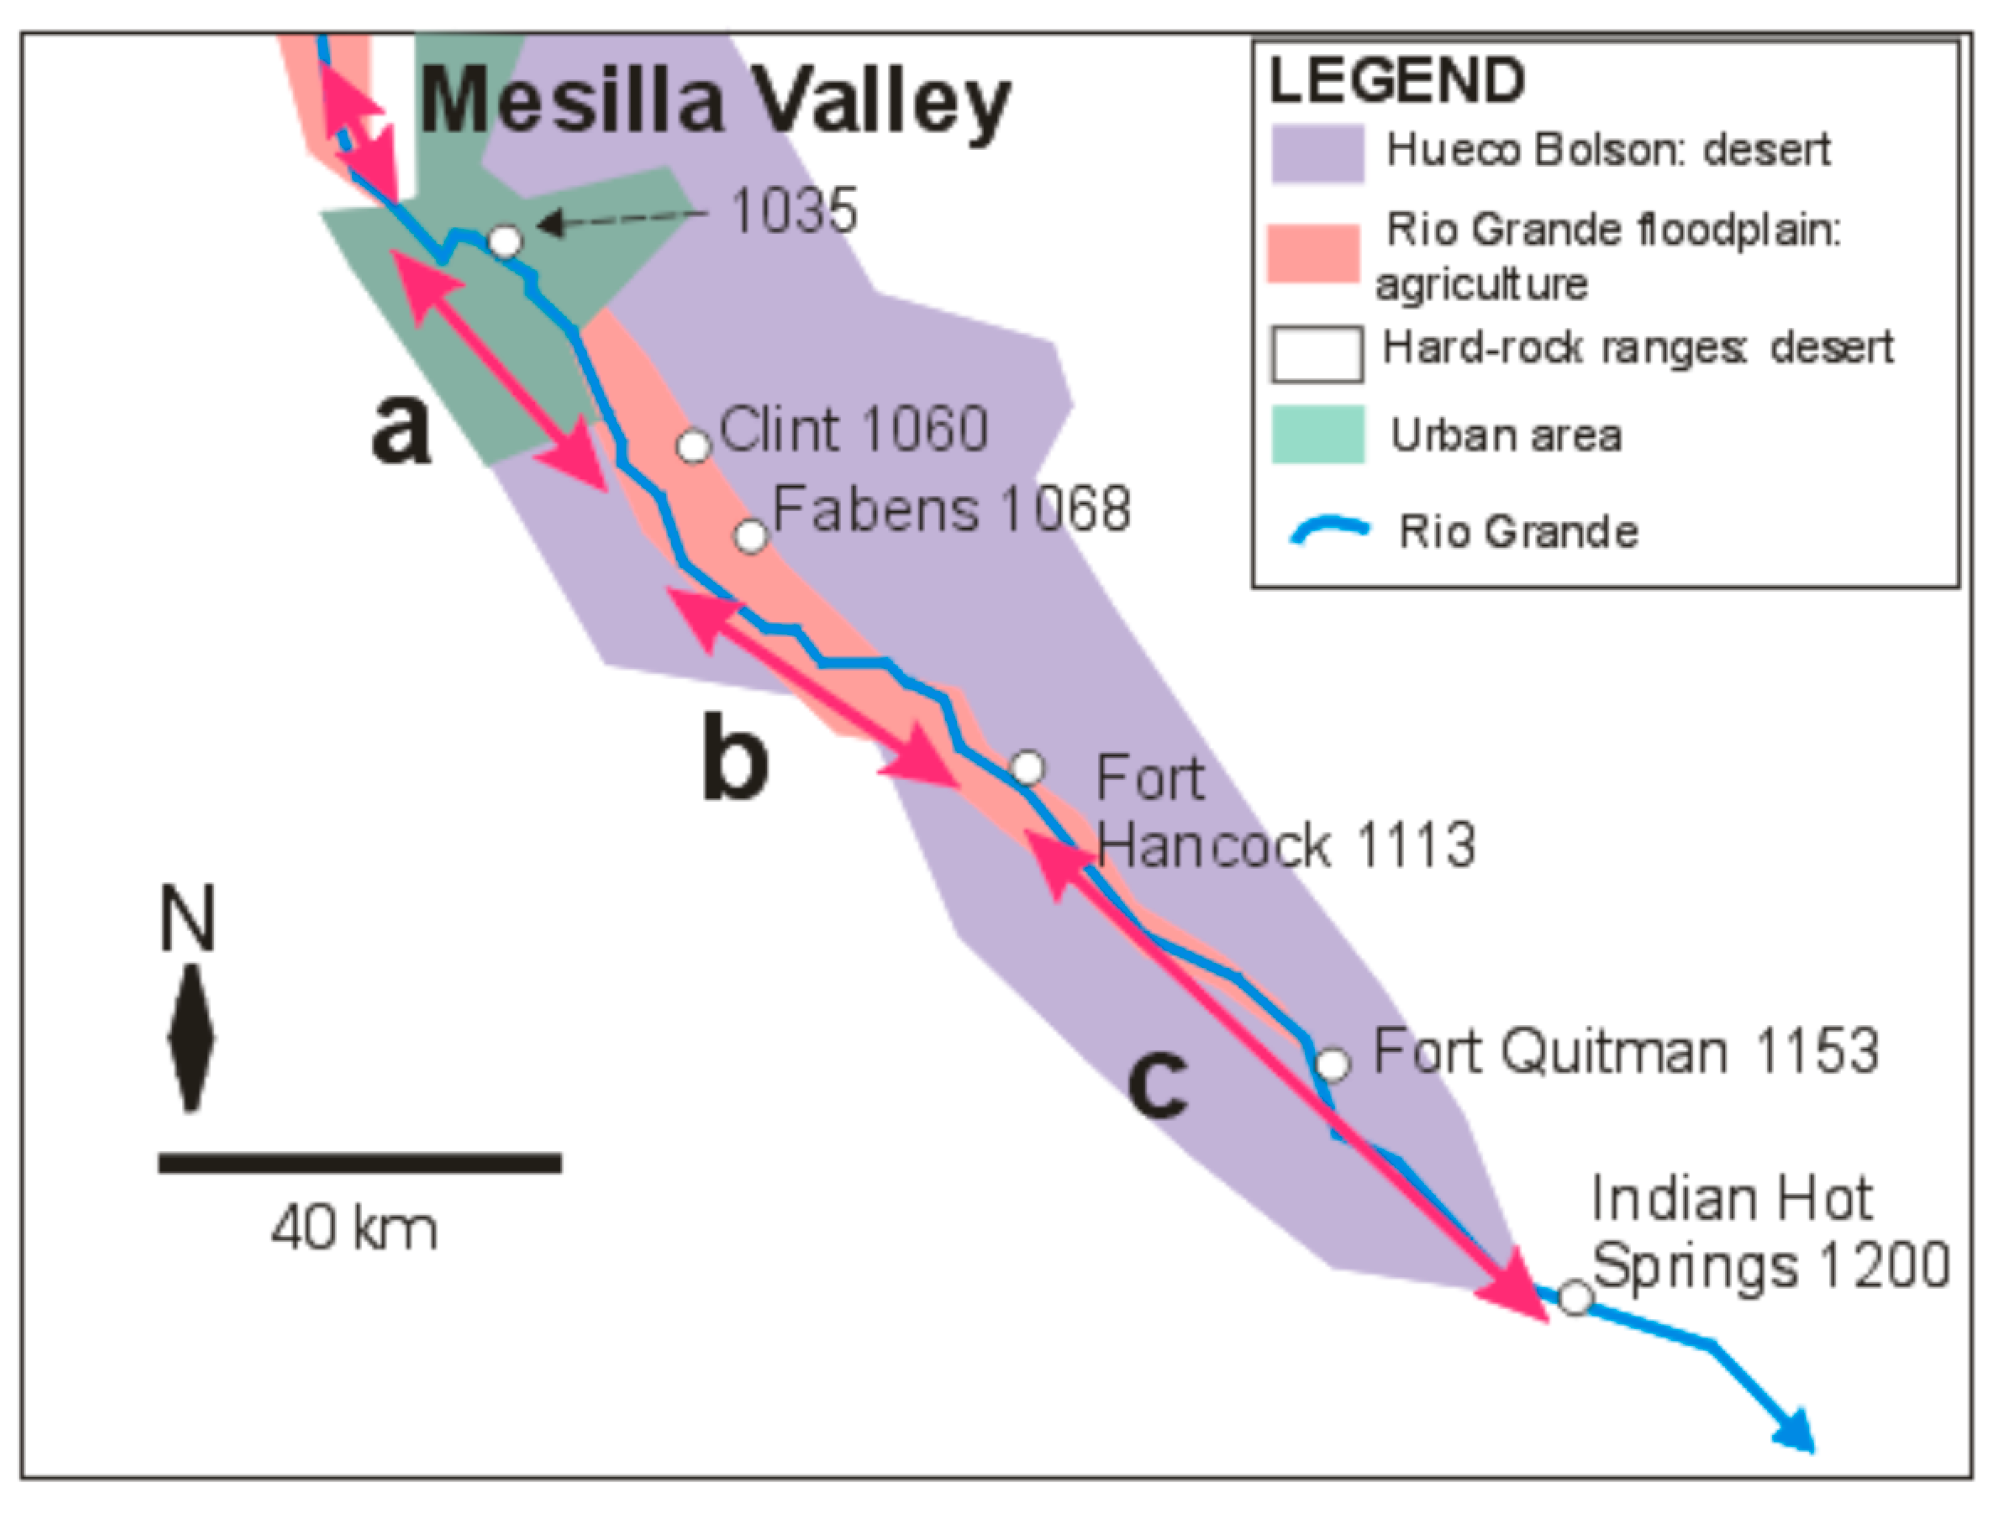
- In the reach of the river from El Paso to Clint, river processes in Mesilla Valley control sulfate mixing, but soil amendment sulfate may also be present near Clint.
- In the reach from Fabens to Fort Hancock, discharge of native, saline groundwater with δ34S > +10‰, probably originating as Middle Permian marine sulfate, contributes to high sulfate concentrations in surface water. The mixing trend for such samples includes two drain sample outliers.
- In the reach from Fort Quitman to Indian Hot Springs, both native saline groundwater and river-derived groundwater discharge to the riverbed. Near Indian Hot Springs, the isotope signature of δ34S is dominantly like that of soil amendments.
- The δ18OSO4 dataset confirms sulfate origins indicated by the larger δ34S dataset.
Supplementary Materials
Author Contributions
Funding
Institutional Review Board Statement
Informed Consent Statement
Data Availability Statement
Acknowledgments
Conflicts of Interest
References
- Wang, H.; Zhang, Q. Research advances in identifying sulfate contamination sources of water environment by using stable isotopes. Int. J. Environ. Res. Public Health 2019, 16, 1914. [Google Scholar] [CrossRef] [PubMed] [Green Version]
- Moncaster, S.J.; Bottrell, S.H.; Tellam, J.H.; Lloyd, J.W.; Konhauser, K.O. Migration and attenuation of agrochemical pollutants: Insights from isotopic analysis of groundwater sulphate. J. Contam. Hydrol. 2000, 43, 147–163. [Google Scholar] [CrossRef]
- Otero, N.; Soler, A. Sulphur isotopes as tracers of the influence of potash mining in groundwater salinisation in the Llobregat Basin (NE Spain). Water Res. 2002, 36, 3989. [Google Scholar] [CrossRef]
- Nakano, T.; Igeta, A. Impact of fertilizer on a small watershed of Lake Biwa: Use of sulfur and strontium isotopes in environmental diagnosis. Sci. Total Environ. 2007, 384, 342. [Google Scholar] [CrossRef]
- Hosono, T.; Siringan, F.; Yamanaka, T.; Yu, U.; Onodera, S.I.; Nakano, T.; Taniguchi, M. Application of multi-isotope ratios to study the source and quality of urban groundwater in Metro Manila, Philippines. Appl. Geochem. 2010, 25, 900. [Google Scholar] [CrossRef] [Green Version]
- Hosono, T.; Wang, C.H.; Umezawa, Y.; Nakano, T.; Onodera, S.I.; Nagata, T.; Yoshimizu, C.; Tayasu, I.; Taniguchi, M. Multiple isotope (H, O, N, S and Sr) approach elucidates complex pollution causes in the shallow groundwaters of the Taipei urban area. J. Hydrol. 2011, 397, 23. [Google Scholar] [CrossRef]
- Szynkiewicz, A.; Rangel Medina, M.; Modelska, M.; Monreal, R.; Pratt, L. Sulfur isotopic study of sulfate in the aquifer of Costa de Hermosillo (Sonora, Mexico) in relation to upward intrusion of saline groundwater, irrigation pumping and land cultivation. Appl. Geochem. 2008, 23, 2539. [Google Scholar] [CrossRef]
- Eastoe, C.J.; Gu, A.; Long, A. The origins, ages and flow paths of groundwater in Tucson Basin: Results of a study of multiple isotope systems. In Groundwater Recharge in a Desert Environment: The Southwestern United States; Water Science and Applications Series; Hogan, J.F., Phillips, F.M., Scanlon, B.R., Eds.; American Geophysical Union: Washington, DC, USA, 2004; Volume 9, pp. 217–234. [Google Scholar] [CrossRef]
- Gu, A. Stable Isotope Geochemistry of Sulfate in Groundwater of Southern Arizona: Implications for Groundwater Flow, Sulfate Sources, And Environmental Significance. Ph.D. thesis, University of Arizona, Tucson, AZ, USA, 2005. [Google Scholar]
- Szynkiewicz, A.; Borrok, D.M.; Ganjegunte, G.K.; Skrzypek, G.; Ma, L.; Rearick, M.S.; Perkins, G.B. Isotopic studies of the Upper and Middle Rio Grande. Part 2—Salt loads and human impacts in south New Mexico and west Texas. Chem. Geol. 2015, 411, 336. [Google Scholar] [CrossRef] [Green Version]
- Druhan, J.L.; Hogan, J.F.; Eastoe, C.J.; Hibbs, B.; Hutchison, W.R. Hydrogeologic controls on groundwater recharge and salinization: A geochemical analysis of the northern Hueco Bolson Aquifer, El Paso, Texas. Hydrogeol. J. 2008, 16, 281. [Google Scholar] [CrossRef]
- Eastoe, C.J.; Artiola, J. Sulfur and carbon cycling in a flue gas desulfurization sludge disposal site. J. Air Waste Man. Assoc 2003, 53, 417. [Google Scholar] [CrossRef] [Green Version]
- Gu, A.; Gray, F.; Eastoe, C.J.; Norman, L.; Duarte, O.; Long, A. Tracing ground water input to base flow using sulfate (S, O) isotopes. Ground Water 2008, 46, 502. [Google Scholar] [CrossRef] [PubMed]
- Phillips, F.M.; Hogan, J.; Mills, S.; Hendrickx, J.M.H. Environmental tracers applied to quantifying causes of salinity in arid-region rivers: Preliminary results from the Río Bravo, southwestern USA. In Water Resources Perspectives: Evaluation, Management and Policy; Alsharhan, A.S., Wood, W.W., Eds.; Elsevier Science: Amsterdam, The Netherlands, 2003; pp. 327–334. [Google Scholar]
- Scalapino, R.A. Ground-Water Resources of the el Paso Area, Texas; Progress Report No. 919; Texas Board of Water Engineers: Austin, TX, USA, 1949. [Google Scholar]
- Alvarez, H.J.; Buckner, A.W. Ground-Water Development in the El Paso Region, Texas, with Emphasis on the Resources of the Lower El Paso Valley; Texas Department of Water Resources Report: Austin, TX, USA, 1980; p. 246. [Google Scholar]
- Hibbs, B.J.; Merino, M. A geologic source of salinity in the Rio Grande Aquifer. N. M. J. Sci. 2006, 44, 165–181. [Google Scholar]
- Dadakis, J.S. Isotopic and Geochemical Characterization of Recharge and Salinity is a Shallow Floodplain Aquifer Near El Paso, Texas. Master’s Thesis, The University of Arizona, Tucson, AZ, USA, 2004. [Google Scholar]
- Eastoe, C.J.; Granados Olivas, A.; Hibbs, B. Isotopes and anion chemistry as indicators of groundwater mixing in the Hueco Bolson aquifer, Ciudad Juárez, Chihuahua, Mexico. Environ. Eng. Geosci. 2016, 22, 195. [Google Scholar] [CrossRef]
- Fenneman, N.M. Physiography of Western United States, 1st ed.; McGraw-Hill: New York, NY, USA, 1931. [Google Scholar]
- Ricketts, J.W.; Amato, J.M.; Gavel, M.M. The origin and tectonic significance of the Basin and Range–Rio Grande Rift boundary in southern New Mexico, USA. GSA Today 2021, 31, 4. [Google Scholar] [CrossRef]
- Western Regional Data Center. El Paso Intl Ap. 2022. Available online: https://wrcc.dri.edu/cgi-bin/cliMAIN.pl?tx2797 (accessed on 15 February 2022).
- Stuart, C.J.; Willingham, D.L. Late Tertiary and Quaternary fluvial deposits in the Mesilla and Hueco Bolsons, El Paso area, Texas. Sed. Geol. 1984, 38, 1. [Google Scholar] [CrossRef]
- Langford, R.P. Segmentation of the Rio Grande alluvial surface and evolution of the Rio Grande rift. In Proceedings of the 53rd Annual Meeting of the Rocky Mountain Section of the Geological Society of America, Boulder, CO, USA, 29 April–3 May 2001. [Google Scholar]
- Collins, E.W.; Raney, J.A. Tertiary and Quaternary tectonics of the Hueco Bolson, Trans-Pecos Texas and Chihuahua, Mexico. In Basins of the Rio Grande Rift Structure, Stratigraphy and Tectonic Setting; Keller, G.R., Cather, S.M., Eds.; Geological Society of America: Boulder, CO, USA, 1994; Volume 291, p. 265. [Google Scholar] [CrossRef]
- Hawley, J.W.; Kernodle, J.M. Overview of the hydrology and geohydrology of the northern Rio Grande basin—Colorado, New Mexico and Texas. In The Rio Grande Compact: It’s the Law! Proceedings of the 44th Annual New Mexico Water Conference, New Mexico Water Resources Research Institute Report, Santa Fe, New Mexico, 2–3 December 1999; Ortega Klett, C.T., Ed.; New Mexico Water Resources Research Institute: Las Cruces, NM, USA, 2000; Volume 312, pp. 79–102. [Google Scholar]
- Strain, W.S. Blancan Mammalian Fauna and Pleistocene Formations, Hudspeth County, Texas. Texas Memorial Museum Bulletin. 1996, p. 10. Available online: https://repositories.lib.utexas.edu/handle/2152/29933 (accessed on 2 March 2022).
- United States Census Bureau. Quick facts: El Paso County, Texas. Available online: https://www.census.gov/quickfacts/elpasocountytexas (accessed on 2 March 2022).
- DataMéxico, Juárez. Available online: https://datamexico.org/en/profile/geo/juarez-8037#:~:text=The%20total%20population%20of%20Ju%C3%A1rez,woman%2C%20and%2050%25%20men (accessed on 15 March 2022).
- Hutchison, W.R.; Hibbs, B.J. Ground-water budget analysis and crossformational leakage in an arid basin. Ground Water 2008, 46, 384. [Google Scholar] [CrossRef] [PubMed]
- Meinzer, O.E.; Hare, F.R. Geology and Water Resources of Tularosa Basin, New Mexico; U.S. Geological Survey Water-Supply Paper 343; U.S. Government Printing Office: Washington, DC, USA, 1915; p. 317.
- Hibbs, B.J.; Boghici, R.N.; Hayes, M.E.; Ashworth, J.B.; Hanson, A.N.; Samani, Z.A.; Kennedy, J.F.; Creel, R.J. Transboundary Aquifers of the El Paso/Ciudad Juárez/Las Cruces Region; Contract Report, Texas Water Development Board; Austin & New Mexico Water Resources Research Institute: Las Cruces, NM, USA, 1997; p. 148. [Google Scholar]
- White, D.E.; Baker, E.T., Jr.; Sperka, R. Hydrology of the Shallow Aquifer and the Uppermost Semiconfined Aquifer Near El Paso, Texas; Water-Resources Investigation Report 97-4263; U.S. Geological Survey: Reston, VA, USA, 1997. [CrossRef]
- Eastoe, C.J.; Hibbs, B.J.; Granados Olivas, A.; Hogan, J.; Hawley, J.; Hutchison, W.R. Isotopes in the Hueco Bolson aquifer, Texas (USA) and Chihuahua (Mexico): Local and general implications for recharge sources in alluvial basins. Hydrogeol. J. 2008, 16, 737. [Google Scholar] [CrossRef]
- Hibbs, B.J.; Merino, M. Reinterpreting models of slope front recharge in a desert basin. Geosci. J. 2020, 10, 297. [Google Scholar] [CrossRef]
- Eastoe, C.J.; Hutchison, W.R.; Hibbs, B.J.; Hawley, J.; Hogan, J.F. Interaction of a river with an alluvial basin aquifer: Stable isotopes, salinity and water budgets. J. Hydrol. 2010, 395, 67. [Google Scholar] [CrossRef]
- Craig, H. Isotopic variation in meteoric waters. Science 1961, 133, 1702. [Google Scholar] [CrossRef]
- Pfaff, J.D. Method 300.0, Determination of Inorganic Anions by Ion Chromatography; Revision 2; United States Environmental Protection Agency: Washington, DC, USA, 1993. [Google Scholar]
- Moore, S.J.; Bassett, R.L.; Liu, B.; Wolf, C.P.; Doremus, D. Geochemical tracers to evaluate hydrogeologic controls on river salinization. Ground Water 2008, 46, 489. [Google Scholar] [CrossRef] [PubMed]
- Synkiewicz, A.; Ewing, R.C.; Moore, C.H.; Glamoclija, M.; Bustos, D.; Pratt, L.M. Origin of terrestrial gypsum dunes—Implications for Martian gypsum-rich dunes of Olympia Undae. Geomorphology 2010, 121, 69. [Google Scholar] [CrossRef]
- Texas Water Development Board. Geologic Atlas of Texas—Van Horn El Paso Sheet; Bureau of Economic Geology: Austin, TX, USA, 1967.


Publisher’s Note: MDPI stays neutral with regard to jurisdictional claims in published maps and institutional affiliations. |
© 2022 by the authors. Licensee MDPI, Basel, Switzerland. This article is an open access article distributed under the terms and conditions of the Creative Commons Attribution (CC BY) license (https://creativecommons.org/licenses/by/4.0/).
Share and Cite
Eastoe, C.; Hibbs, B.; Merino, M.; Dadakis, J. Origins of Sulfate in Groundwater and Surface Water of the Rio Grande Floodplain, Texas, USA and Chihuahua, Mexico. Hydrology 2022, 9, 95. https://0-doi-org.brum.beds.ac.uk/10.3390/hydrology9060095
Eastoe C, Hibbs B, Merino M, Dadakis J. Origins of Sulfate in Groundwater and Surface Water of the Rio Grande Floodplain, Texas, USA and Chihuahua, Mexico. Hydrology. 2022; 9(6):95. https://0-doi-org.brum.beds.ac.uk/10.3390/hydrology9060095
Chicago/Turabian StyleEastoe, Christopher, Barry Hibbs, Mercedes Merino, and Jason Dadakis. 2022. "Origins of Sulfate in Groundwater and Surface Water of the Rio Grande Floodplain, Texas, USA and Chihuahua, Mexico" Hydrology 9, no. 6: 95. https://0-doi-org.brum.beds.ac.uk/10.3390/hydrology9060095