Article

Modelling Mixed Microbial Culture Polyhydroxyalkanoate Accumulation Bioprocess towards Novel Methods for Polymer Production Using Dilute Volatile Fatty Acid Rich Feedstocks

1
Promiko AB, Briggatan 16, 23442 Lomma, Sweden
2
School of Chemical Engineering, The University of Queensland, Brisbane, QLD 4072, Australia
3
Department of Chemistry, Sapienza University of Rome, Piazzale Aldo Moro 5, 00185 Rome, Italy
4
Department of Environmental Sciences, Informatics and Statistics, Cà Foscari University of Venice, Via Torino 155, 30172 Venice, Italy
*
Author to whom correspondence should be addressed.
Submission received: 9 February 2022 / Revised: 8 March 2022 / Accepted: 16 March 2022 / Published: 21 March 2022
(This article belongs to the Special Issue Advances in Polyhydroxyalkanoate (PHA) Production, Volume 3)

Abstract

:
Volatile fatty acid (VFA) rich streams from fermentation of organic residuals and wastewater are suitable feedstocks for mixed microbial culture (MMC) Polyhydroxyalkanoate (PHA) production. However, many such streams have low total VFA concentration (1–10 gCOD/L). PHA accumulation requires a flow-through bioprocess if the VFAs are not concentrated. A flow through bioprocess must balance goals of productivity (highest possible influent flow rates) with goals of substrate utilization efficiency (lowest possible effluent VFA concentration). Towards these goals, dynamics of upshift and downshift respiration kinetics for laboratory and pilot scale MMCs were evaluated. Monod kinetics described a hysteresis between the upshift and downshift responses. Substrate concentrations necessary to stimulate a given substrate uptake rate were significantly higher than the concentrations necessary to sustain the attained substrate uptake rate. A benefit of this hysteresis was explored in Monte Carlo based PHA accumulation bioprocess numerical simulations. Simulations illustrated for a potential to establish continuous flow-through PHA production bioprocesses even at a low (1 gCOD/L) influent total VFA concentration. Process biomass recirculation into an engineered higher substrate concentration mixing zone, due to the constant influent substrate flow, enabled to drive the process to maximal possible PHA production rates without sacrificing substrate utilization efficiency.

1. Introduction

Polyhydroxyalkanoates (PHAs) are a family of semi-crystalline polyesters that are naturally accumulated by many species of bacteria, for carbon and energy intermediate storage [1]. Accumulated polymer is stored in bacteria as intracellular granules. The recoverable pure polymers are biodegradable and have thermoplastic properties of interest for bioplastics and chemical industries [2]. PHA properties can be manipulated based on monomer composition, monomer distribution, and polymer molecular mass distribution. As such, PHAs are tagged as a biobased renewable resource with broad potential for services and products of value for society [3].
Limited types and amounts of PHAs are available commercially today [4], with supplies principally generated by pure culture production methods and refined feedstocks. PHAs can also be produced as a by-product of organic residual (waste) management using pure microbial cultures, as well as with open cultures of bacterial biomass that are enriched with the PHA-storing phenotype [5,6]. Open culture bioprocess environments can generate selection pressures. These selection pressures can favour preferred survival of populations of species of PHA-accumulating microorganisms due to competitive advantage with rapid substrate uptake and metabolism via PHA storage. Bioprocesses by design, or by coincidence, will generate selection pressures, for PHA-accumulating microorganisms, related to factors such as substrate type and feeding methods [7], operating temperature [8], and/or the process environments engineered for wastewater contaminant removal [9,10]. Significant storage capacities of PHAs in open or so-called mixed microbial cultures (MMCs) have been accomplished in the laboratory and up to pilot scale in the range from 40 to 90% gPHA per gram of biomass volatile solids [11,12]. The present work concerns bioprocess challenges for industrial scale PHA production using MMCs. Specifically, this work addresses the idea to develop bioprocess methods which allow producing PHA in MMCs with continuous influent flow constant volume bioprocesses using moderate to low concentration volatile fatty acid (VFA) rich feedstocks as substrate.
MMCs can be made to accumulate PHA with VFA rich feedstocks. Effluents of suspended solids separated acidogenic fermentation liquors from wastewater and sludges, dominated by (C2 to C5) VFAs, are typically found to result in co-polymer blends of poly(3-hydroxybutyrate-co-3-hydroxyvalerate) [13]. Other types of more complex MMC co-polymer blends have also been reported [14,15,16]. The VFA composition strongly influences the accumulated co-polymer monomer distribution and, thereby, resultant co-polymer blend crystallinity. Even full-scale waste municipal activated sludge has been shown to be directly applicable to produce commercial quality PHAs [17]. Evidence was given for engineering polymer properties and maintaining quality control with VFA feedstocks produced from fermented sludge and industrial waste at pilot scale. Extent of maximum polymer crystallinity was steered predictably over a wide range by the feedstock composition for consistently applied accumulation methods. Crystallinity influences microstructure with concomitant influence on thermal, physical, and mechanical properties to suit many kinds of applications.
Pilot scale projects have repeatedly demonstrated technical feasibility for commercial scale PHA production based on direct accumulation of surplus biomass treating wastewater or using biomass produced with selection pressures specifically for MMC PHA production [11]. Notwithstanding, specific considerations to address underlying expected challenges of bioprocess methods for industrial scale MMC PHA production are lacking in the research literature. Considerations of upscaled process have been given for acclimation towards augmented polymer storage [18], for mitigating influence of autotrophic flanking populations [19] and for influences of changes in process temperature [20] during the PHA accumulation, for examples. Robust industrial scale mixed culture PHA accumulation processes will be needed wherein methods are specifically independent, or at least insensitive, to feedstock VFA concentration. This independence would allow the same facility to have flexibility to produce polymers with “direct accumulation” [11] biomass fed with available regional VFA-rich feedstock. Such a facility would need to accommodate variability of feedstock VFA composition and concentration. Consideration of approach for industrial scale continuous flow through PHA accumulation, especially for cases with substrates of lower VFA concentrations (<10 gCOD/L), have not been found to be addressed in the research literature.
Pure culture methods for PHA production classically rely on fed-batch fermentation processes with concentrated feedstocks. A mass of organic substrate is to be delivered to a microbial biomass to achieve as high a titre of PHA containing bacteria as possible, in the shortest possible time, and within the limits of the available bioprocess volume [21]. Batch systems for pure culture PHA production methods may often be with starting broth organic substrate concentrations of between 10 and 20 g/L. The source feedstocks have an order of magnitude higher concentration. In this way, a high mass of substrate can be added with small additions of liquid volume. Ideas and methods for continuous production are evolving [22]. These continuous methods are applied to achieve gains in volumetric productivity if batch to batch down times are reduced. Higher concentrated feedstocks are nevertheless still desirable towards facilitating pure culture PHA process operations.
MMC PHA production methods must similarly strive to achieve as high a productivity as possible in mass polymer produced per unit volume and time. Acidogenic fermentation effluents can be sourced from commonly available regional sources of municipal and/or industrial organic wastewater and sludge. However, a challenge is that these typically available fermentation feedstocks do not often have high total VFA concentrations. VFA rich feedstocks from fermented organic waste streams from industrial and municipal sources may often, and in own direct experience with examples over 20 years, be in the low VFA concentration range between 0.5 to 10 g/L [23]. Higher VFA concentrations are possible with fermentations in selected limited cases such as dairy [24,25] and fishing [26] industry residues. However, these examples may not be sufficiently large enough VFA sources to promote wide generic implementation of MMC PHA production at industrial scale. For broad implementation of MMC PHA production, one must consider to exploit commonly available surplus organic residues that societies generate, collect and process. Bioprocess methods that are applicable over a wide range of VFA concentration are anticipated to offer greater flexibility to source a wider diversity of regionally available MMC feedstocks to produce PHA within the same generic industrial facility.
If VFAs are the product for transport and sale, then innovations in methods of VFA up concentration as part of recovery are required [27]. VFA extraction during acidogenic fermentation is furthermore reported to improve yields in acidogenic fermentation [28]. However, when PHA is the end product, MMC PHA accumulation processes are the up concentration unit process due to biochemical conversion (soluble VFA to PHA granules) and biomass separability. Therefore, so long as the dilute VFA rich feedstock supplies do not require undue transportation, it is only necessary that a sufficient VFA mass is available, even if it is in a dilute form. A sufficient VFA mass is to be delivered in a volumetric flow at industrial scale to exploit the PHA storing potential of a MMC biomass such as surplus municipal activated sludge [17]. Activated sludge thickened (concentrated) biomass solids, with at least 5 to 10% dry solids content, may be brought within reasonable distance to the site of PHA production where available VFA sources exist. In the present work, MMC biomass respiration has been investigated for development of industrial scale PHA production methods with dilute VFA-rich feedstocks.
With dilute VFA-rich feedstocks it is anticipated that the feed volumes will be larger than the available bioprocess working volume. The feed volume must flow through the process, and it is required that the biomass is retained in the process by, for example, membranes [29] or gravity settling [17]. The effluent from the accumulation process should have as low a VFA concentration as possible to limit waste of substrate and effluent management costs. However, substrate uptake rate depends on substrate concentration. Therefore, high productivity, with high volumetric rates of PHA production, supposes high sustained process substrate concentrations with reference to the modelled process using Monod kinetics [30]. Higher steady state concentrations of substrate in the effluent, for flow through accumulation processes, trade-off the goal of greater substrate utilization efficiency with the goal of greater volumetric productivity.
In previous research, it was observed that traditional Monod kinetics could not adequately describe the dynamics of response of a MMC biomass during fed-batch PHA accumulation [31]. Consequently, methods of process for industrial scale accumulation were anticipated based on replicated observations of an interpreted hysteresis in the biomass dynamics of respiration with pulse wise substrate additions. Industrial methods were introduced, and these included mixing zones with higher substrate concentration for stimulating high substrate uptake rates, while maintaining these higher rates in mixing zones of significantly lower substrate concentrations. However, these previous observations were not systematically evaluated for enrichment MMCs from different sources. They were also not brought into a frame of a predictive process model.
The objective in the present work was to systematically evaluate and confirm a model for stimulation and attenuation of substrate uptake rates during PHA accumulation. Specifically, it was of interest to assess if a common model framework could be applied to two distinctly different MMCs enriched for PHA accumulation. The goal was to refine insight for conditions and principles of bioprocess engineering to maintain both high substrate utilization efficiency and optimal volumetric productivity during continuous feed mixed culture PHA production. The approach is intended to be flexible and to work well in cases for PHA production with low VFA concentration feedstock at industrial scale.
Dynamics of respiration for laboratory and pilot scale MMC enrichment cultures were characterized by oxygen and chemical oxygen demand (COD) mass balances as a function of initial substrate concentration. Acetic acid and acetate mixtures were used as the model substrate. The dynamic response of the biomass was translated into a process model that was applicable to both cultures. This process model was then applied by means of Monte Carlo numerical simulations to experiment with ideas of a constant volume, flow through, PHA production bioprocess design. The numerical simulations expressed how stimulation and maintenance mixing zones could, in principle, be applied for achieving high rates of PHA production while still maintaining low effluent substrate concentrations.

2. Materials and Methods

2.1. Biomass from a Lab-Scale SBR

A PHA-storing mixed microbial culture was produced in a 1.0 L working volume aerobic sequencing batch reactor (SBR) at room temperature (20 to 25 °C). A mechanical stirrer provided complete mixing of the culture medium without any settling, and oxygen was delivered through air pumps connected to an array of ceramic diffusors. The SBR was inoculated with activated sludge from the “Roma Nord” (Rome, Italy) full-scale municipal wastewater treatment plant (WWTP). At the time of the present study, the enrichment culture was established under steady state conditions for 3 months (12 h cycle and organic loading rate (OLR) of 8.5 gCOD/L/d). The biomass was characterized with a PHA accumulation potential in the range from 0.63 to 0.70 gPHA/gVSS. Full details of the SBR operations and performances are reported elsewhere [32].
The SBR cycle program sequence with timer controlled peristaltic pumps was as follows: (a) feast substrate feeding (10 min; 0.42 L), (b) feast reaction phase (150 min), (c) surplus biomass (mixed liquor) withdrawal (3 min; 0.50 L), (d) famine substrate feeding (5 min; 0.08 L), (e) famine reaction phase (552 min). The 1-day sludge retention time (SRT) was equal to the hydraulic retention time (HRT) due to no applied settling phase. The feast substrate was an 85:15 mixture (COD basis) of acetic and propionic acids in a mineral medium at 10.12 gCOD/L. The substrate was trimmed to pH 6.0 with NaOH from a 3.0 M stock solution. The famine substrate comprised ammonium sulphate at 7.33 g/L, and with 80 mL addition per cycle, giving a nitrogen loading of 249 mgN/d. A net excess nitrogen loading was established per cycle given a C/N balance of 34 gCOD/gN. The mineral medium composition was (mg/L): K2HPO4 (334), KH2PO4 (259), MgSO4· 7H2O (100), CaCl2· 2H2O (50), thiourea (20), Na2EDTA (3), FeCl3· 6H2O (2), H3BO3 (0.3), CoCl2· 6H2O (0.2), ZnSO4· 7H2O (0.1), MnCl2· 4H2O (0.03), NaMoO4· 2H2O (0.03), NiCl2· 6H2O (0.02) and CuCl2· 2H2O (0.01). Stability of feast and famine selection conditions were routinely monitored from dissolved oxygen (DO) trends (WTW Cell Oxi 3310).
The biomass source for replicate respiration response experiments in the present work was the withdrawn surplus biomass (c) after feast reaction (b) as described above. The 500 mL withdrawn mixed liquor was directed to an aerated vessel with the added nitrogen rich famine substrate that the wasted biomass would otherwise have experienced for the remaining cycle segments (d and e). Famine conditions were maintained for at least 8 h before the biomass was then used for replicate respiration experiments. Experiments were conducted at room temperature after the applied famine period and these experiments were completed within 26 h of the biomass withdrawal from the SBR. The famine condition for the biomass was confirmed from measured nitrogen uptake during famine, and consistent performance in PHA content cycling (Fourier transform infrared spectroscopy (FTIR) measurements). Famine biomass in the present work refers to the biomass after famine conditions were applied for at least 8 h.

2.2. Biomass from a Pilot-Scale SBR

The pilot scale biomass was produced in an SBR (120 L working volume) operated with automatic control (Labview, National Instruments, Austin, TX, USA). The SBR was inoculated with activated sludge from Treviso full-scale WWTP (northeast Italy). The PHA-accumulating biomass exhibited typical accumulating potential between 0.40 to 0.46 gPHA/gVSS. Full details of the pilot SBR operations and performances are reported elsewhere [33].
The selection SBR was fed with filtrate coming from fermentation of a 33:67 (%v/v) mixture of the organic fraction of municipal solid waste (OFMSW) and excess waste activated sludge (WAS). Both organic input streams were produced and managed within the Treviso municipality. The fermentate used to produce the biomass was characterized with 75% soluble COD as VFA, and a VFA composition dominated by butyric and acetic acids followed by propionic and other organic acids. The SBR was operated continuously (6-h cycle and 1 d HRT and SRT) with no biomass settling phase. Aeration, with linear membrane blowers (Bibus EL-S-250), provided oxygen and mixing. The 6-h aerobic cycle was as follows: (a) surplus biomass (mixed liquor) withdrawal (0.5 min), (b) delay (10 min), (c) feed (0.5 min), and (d) reaction (349 min). Temperature (22–25 °C, maintained with immersion heater) and pH (8.0–8.5) trends were monitored, but not controlled. OLR with VFA was 3.3 ± 0.7 gCOD/L/d with variations due to VFA level and composition fluctuations from the feedstock fermentation process [33].
Two-liter grab samples from the withdrawn surplus biomass were sent chilled by overnight courier from the pilot plant in Treviso to the laboratory of the present work at La Sapienza in Rome. The received biomass was stored at 4 °C and used for experiments within 24 h after its arrival. Prior to experiments, the stored famine biomass was acclimated by warming to room temperature (23 °C) over a few hours with continuous aeration and mixing. The famine condition for the biomass was confirmed with assessment for negligible biomass PHA content (FTIR measurements).

2.3. Pulse-Stimulation Respiration Experiments

A stock of mixed liquor with the famine biomass was maintained aerated and well-mixed at constant temperature (24 ± 1 °C). For each pulse-stimulation experiment a grab sample of mixed liquor of defined dilution and volume (50 to 100 mL) was mixed to target a biomass suspended solids concentration measured as VSS (volatile suspended solids). Dilutions were made with the same media (laboratory scale MMC) or matrix (pilot scale MMC) of the mixed liquor, containing no or negligible biomass and no added organic substrate. pH was at the level established in the respective SBRs and not adjusted. For the pilot scale mixed liquor, biomass suspended solids were separated by gravity separation and decantation to generate dilution media with the same matrix. The source of dilution media was maintained similarly to the famine biomass source with constant aeration and at the same temperature. Respiration experiments were conducted with and without constant aeration, and initial substrate concentrations over a range from 5 to 500 mgCOD/L. Biomass concentrations were in the order of 1 and 2 gVSS/L for the laboratory and pilot biomass experiments, respectively.
For each experiment, the defined mixed liquor volume containing famine biomass was disposed directly to a vessel with magnetic coupled stirrer (600 rpm). This vessel was maintained with a pre-set level of constant aeration (0 to 1 mL/min air). Air flow from standard aquarium pumps was regulated through a Dwyer Series VF flowmeter. DO and pH trends were logged starting upon mixed liquor addition to the vessel and for a period of pre-aeration lasting at least 2-min. Then, a defined volume (pulse) of substrate (0.20 to 2 mL) from a concentrated stock solution was injected as an impulse to the defined mixed liquor volume. The time point of substrate injection was tagged to the log file. DO and pH trends were followed until dissolved oxygen concentration increased again asymptotically upon substrate consumption. Such a pulse-stimulation experiment lasted anywhere from a few minutes to the better part of 1 h. This duration was expected to be dependent on the biomass source, the mass of substrate added, and the concentration of the biomass. The added aliquots of substrate stock solutions were defined mixtures of acetic acid and/or sodium acetate generated from 2 M stock solutions of acetic acid and sodium acetate trihydrate (Sigma-Aldrich > 99%), respectively.

2.4. Analytical Methods

Suspended solids from selected famine mixed liquor samples (1.5 mL Eppendorf) having negligible soluble COD were separated by microcentrifugation (RCF of 12,000× g for 10 min). The supernatant was decanted to another Eppendorf tube by a single inversion, and residual hanging liquid was carefully wicked out of the tube with tissue. The pellet was either resuspended back to 1.5 mL with deionized water, or it was dried overnight at 105 °C. The suspended solids concentration was evaluated based on chemical oxygen demand (COD), for the resuspended pellet solution. The mixed liquor supernatant was stored at 4 °C pending ammonia analysis. COD measurements were with Spectroquant® (Merck, Milano, Italy) 25–1500 and 300–3500 mg/L kits and procedure in combination with a Spectroquant® NOV60A spectrophotometer (Merck, Milano, Italy). Calibration was based on an acetic acid stock solution dilution series. The COD of the famine biomass was converted to volatile suspended solids (VSS) based on the assumed biomass composition of C5H7O2N with 1.42 mgCOD/mgVSS. Ammonium ions were measured on supernatant samples spectrophotometrically at 420 nm by the direct Nessler method [34]. PHA content for the laboratory (feast and famine) and pilot (famine) biomass was evaluated qualitatively by FTIR on the dried pellet. FTIR measurements were performed on ground dried biomass pellets with an Alpha ATR-FTIR (Bruker, Lund, Sweden) with diamond crystal as previously reported [35].
Dissolved oxygen and pH-millivolt signals were measured continuously during experiments and logged at 0.1 Hz (HQ40d, LDO101, PHC201, Hach Lange, Solna, Sweden). The pH-millivolt signal was 4-point calibrated (pH 4, 7, 9 and 10). Probe dynamic response characteristic was based on measured instantaneous shift-up and shift-down changes: pH was logged for the trends in shifts between 0.01 molar phosphate buffer solutions. Phosphate buffer solutions were prepared with KH2PO4 and K2HPO4 at pH 5 and 9. In a similar way, DO probe dynamics were estimated from trends by moving the probe between mixed non-aerated and mixed aerated SBR media solutions. The media solutions were at low (DO ≈ 0 mg/L, mixed, non-aerated, with biomass suspended solids) and high (DO = 8.3 mg/L mixed, aerated, without biomass suspended solids) steady state DO levels. Shift up and down trends were evaluated in triplicate, and the first order response time constants were estimated for the pH and DO probes from least squares non-linear regression analysis of the first order exponential asymptotic trends (Prism, Version 9, Graphpad Software, San Diego, CA, USA). The probe first order time constants were found to be 0.35 ± 0.02 s 1 (pH), and 0.14 ± 0.02 s 1 (DO). The logged pH and DO signals were processed by a Savitsky-Golay [36] second order 7-point filter for signal smoothing and the first derivatives. The interpreted actual trends of DO and pH were the measured signal values, corrected for probe response dynamics based on the empirically determined first order probe response time constants [37].

2.5. Dissolved Oxygen and Chemical Oxygen Demand Mass Balance

The model for the data analysis was based on a mass balance for dissolved oxygen and chemical oxygen demand concentrations. It considered a defined impulse addition of substrate to a defined amount of active biomass (VSS), in a constant volume system with constant aeration. The initial biomass was a famine biomass meaning that the biomass existed with a low background level of endogenous aerobic respiration after being subjected to a long period without exogenous organic substrate supply. The mass balance assumed that the famine biomass would exhibit a feast response. A feast response means a sudden increase in aerobic respiration levels due to the added organic substrate. This increased level of aerobic respiration was assumed to be due to substrate uptake for PHA storage only (no active biomass growth). In particular, exogenous supplied acetic acid is converted into intracellular stored polyhydroxybutyrate granules (PHB) during the feast response. DO concentration changes in the control volume were linked to processes of aeration, endogenous aerobic respiration, aerobic respiration in substrate consumption, and aerobic respiration on stored PHA:
d C o d t = Q o a Q o e + Q o s + Q o p
where Co is the DO concentration (mgO2/L) as a function of time (t in minutes), Qos is the DO uptake rate (mgO2/L/min) due to substrate consumption, Qop is the DO uptake rate (mgO2/L/min) due to activity on stored polymer, Qoe is the biomass endogenous respiration rate (mgO2/L/min), and Qoa is the DO supply rate (mgO2/L/min) due to constant air flow with coarse bubble aeration.
The specific substrate uptake rate (qs, mgCOD/gVSS/min) was assumed to be coupled to oxygen uptake rate by a constant (average) yield (Yos) for oxygen consumed per amount of substrate consumed (mgO2/mgCOD):
q s = q o s Y o s = Q o s Y o s · X a
where qos is specific oxygen uptake rate (mgO2/gVSS/min), and Xa is the initial (active) biomass concentration (gVSS/L). DO supply rate, governed by the conditions of volume, aeration, and mixing, was:
Q o a = k a C o * C o
where ka is the estimated aeration oxygen mass transfer rate (1/min) with constant air flow and volume, and C o * is the apparent maximum oxygen (saturation) concentration (mgO2/L). Aerobic respiration activity on stored polymer was assumed to ensue upon depletion of exogenous substrate. As substrate supply becomes exhausted, respiration shifts rapidly to famine and the subsequent consumption of stored polymer [30]. A switching function was used to describe this shift from aerobic respiration on exogenous substrate to the initial level of respiration activity on the amount of stored PHA as endogenous substrate:
Q o p = X a · q o p k s k s + C s , C o k o + C o min
where ks is the Monod apparent affinity constant on substrate concentration (mgCOD/L), ko is the Monod apparent affinity constant on oxygen concentration (mgO2/L), Cs is the exogenous substrate concentration (mgCOD/L) as a function of time, q o p is the initial specific aerobic respiration rate on stored polymer (mgO2/gVSS/min), and (a,b)min is minimum of a and b. Thus, maximum aerobic respiration levels required that DO concentration was not limiting.
Aerobic respiration rate (DO consumption rate) on polymer was expected to be a function of the amount of polymer stored by the biomass [30]. Respiration on stored polymer results in a decrease of the stored polymer content. However, it was only the initial respiration rate on stored polymer that was estimated as the exogenous substrate supply became depleted. Therefore, any decrease in polymer content directly after substrate consumption was neglected and it is only the initial estimated level of respiration on the maximum amount of polymer stored directly after substrate depletion represented by Qop.
For the COD mass balance, amount of polymer produced was determined from the average yield on substrate given polymer storage and assuming no active growth following similar previous model developments [38]:
X p = 1 Y o s · C s i C s
where Xp is the PHA concentration as function of time (mgCOD/L), and Csi is the initial substrate concentration (mgCOD/L).
Specific substrate consumption rate was represented by Haldane-Monod kinetics given sufficient dissolved oxygen concentration:
q s = q s e · C s k s + C s + C s 2 k h , C o k o + C o m i n
where kh is the apparent Haldane substrate inhibition factor (mgCOD/L), and q s e is the extant maximum specific substrate uptake rate (mgCOD/gVSS/min). Directly after substrate addition, a transient phase was observed. An extant maximum specific rate was used because of this lag period before the biomass responded in its upshift to the full extent of respiration and substrate uptake rates due to Csi. The biomass extant maximum substrate uptake rate is a function of the stimulating (upshift) substrate concentration (Csi) and time. The transient phase could be described explicitly as a function of time [39]. However, in the model development it was found to be simpler to maintain a time implicit representation for all equations, including the upshift lag phase kinetics:
q s e = q s m · 1 f i k i k i + C s i C s
where q s m is the maximum specific substrate uptake rate (mgCOD/gVSS/min), fi represents the initial respiration level with respect to the maximum reached substrate uptake rate (0 < fi < 1), and ki is the respiration induction substrate concentration constant (mgCOD/L). The initial substrate uptake ( q s i ) is therefore:
q s i = q s m · 1 f i
ki relates to the amount of substrate consumed by the biomass to reach q s m with respiration rate initially starting from q s i at time, t = 0. The maximum expressed substrate uptake rate q s m was interpreted to be dependent on the initial substrate concentration (Csi):
q s m = q s r + q s u · C s i k u + C s i
where q s r is an inherent biomass capacity for substrate uptake, q s u is a capacity for increase in substrate uptake rate, and ku is an apparent half-saturation constant (mgCOD/L) for an upshift in substrate uptake rate given Csi as the peak (initial) exogenous substrate concentration.
Specific uptake rates were estimated based on the measured stock biomass (gVSS/L) and substrate (gCOD/L) concentrations that were corrected for the known media dilutions that were used for each respiration experiment. Model exploration for assessing the mass balance with measured DO concentration trends was performed with Berkeley Madonna (Version 10, Berkeley, CA, USA). Data analysis for estimation of model parameters, by nonlinear least squares regression analyses, was performed with custom scripts written in MATLAB (Version 2020b, Mathworks, Kista, Sweden), or with model equations defined and fitted by non-linear regression analyses in Prism (Version 9, Graphpad Software, San Diego, CA, USA).

2.6. Monte Carlo Accumulation Process Simulation

A Monte Carlo model was developed wherein a population of biomass suspended solid elements were modelled for PHA accumulation with no active microbial growth. Substrate concentration change as a function of time was calculated based on volumetric flow and mass balance differential equations for two connected well-mixed control volumes (Figure 1). This configuration represented a subsection of an idealised module for an industrial scale constant volume accumulation process. The process implements zones for stimulation and maintenance of biomass aerobic respiration levels as previously discussed [31]; biomass mixed liquor was continuously recirculated from a maintenance volume Vm to a stimulation mixing zone Vs receiving influent substrate. In Vs, the influent substrate, and recirculated biomass mixed liquor, are mixed in proportions to reach elevated substrate concentrations to stimulate a maximal substrate uptake rate (Equation (9)). In Vm, high substrate uptake rates are to be maintained at low substrate concentration (Equation (6)). The model represented a process subsection because in practice multiple parallel stimulation zones could be applied to service one larger, or several parallel, maintenance volumes in a larger volume industrial process.
In Figure 1, a feedstock with substrate concentration Csf is disposed to Vs at a flow rate of Qf and the flow Qm maintains a defined continuous exchange and recirculation of the mixed liquor from the main volume Vm to the mixing zone of Vs and back again. This recirculation generates the concentration Css in Vs. The Vm hydraulic residence time is HRTm = Vm/Qm. Similarly, the maximum HRTs is Vs/Qm.
Biomass suspended solids are retained in Vm by an ideal separator. Process effluent from Vm is at the influent flow rate of Qf. Effluent has substrate concentration Csm. Concentration Css of substrate in Vs is a function of Qf, Qm, Csm and Csf based on the flow and mass balances. Oxygen uptake rates were calculated and oxygen was assumed to be maintained at levels that were not limiting for microbial activity in Vm. Influent flow rate was set to achieve a target organic loading rate with respect to the process theoretically maximum possible substrate uptake rate (Equation (9)).
The model applied the system of equations according to the above presented oxygen and chemical oxygen demand mass balances. Model parameters in Equations (1)–(9) used for the process simulations were determined as part of the biomass characterizations reported in the first part of the present investigation.
The respiration and substrate uptake rates for each individual biomass element was dependent on its history of exposure to dissolved substrate concentration. The capacity for substrate uptake rate for each biomass element was therefore determined by the highest most recently experienced substrate concentration (Equation (9)) in combination with the history of conditions of substrate concentration after that maximum substrate exposure (Equation (6)). The total process substrate uptake rate was determined by the sum of uptake rates for all the elements in the maintenance zone. Thus, substrate uptake rates in Vs were assumed to be negligible due to anticipated DO limitation.
Uptake rates were driven with ku dependent up-shift kinetics (Equation (9)) for biomass elements seeing a history of constant or progressively increasing substrate concentrations. Substrate uptake rates were driven by ks dependent downshift kinetics (Equation (6)) for elements seeing a decrease in substrate concentration from a recent maximum value. For numerical stability, but also for practical representation based on previous work, the biomass elements were given a first order transient response time constant of 5 s. This meant that 95% of the expected response in respiration rate would be reached for a sustained change in substrate concentration after 15 s.
Numerical integration of governing differential equations was made for each time step to update stimulation “s” and maintenance “m” control volume substrate concentrations:
d C s s d t = Q f · C s f + Q m · C s m Q m + Q f · C s s V s
d C s m d t = Q m + Q f · C s s Q m · C s m Q f · C s m i = 1 n m x a · q s i V m
The element specific substrate uptake rates, q s i (mgCOD/gVSS/min), were according to Equation (2) and with respect to the element mass x a (gVSS/element) for the elements found in V m at each time step. Haldane kinetics ( k h ) and induction kinetics ( k i ) were neglected due to the modelled process time scales and anticipated low substrate concentrations in Vm.
The biomass elements were assumed to be ideally mixed in respective control volumes. Transport of biomass elements between V m and V s was made at each time step by random element selection and in proportion to flow rate and suspended solids concentrations. The biomass element statistics of residence time, respiration, polymer storage, and substrate uptake rate were estimated and evaluations of the process performance were made. The model and simulations were made with MATLAB (Version 2020b, Version 2020b, Mathworks, Kista, Sweden). Numerical integration of differential equations was with the ode45 solver, using a relative tolerance of 10 3 , and a maximum time step of 0.05 s. The random number generator was uniquely seeded for each simulation run.
In keeping with previous work modelling MMC PHA production, the biomass maximum element specific substrate uptake rate q s i m (mgCOD/gVSS/min) was adjusted for PHA content [30]:
q s i m = q s m · 1 f P H A i f P H A m α
where f P H A i is the average PHA to active biomass mass ratio for the ith biomass element, and f P H A m is the maximum possible PHA to active biomass ratio for the biomass. The inhibition exponent α is reported to range [30]. A value of 1.24 [40] was applied for these model simulations. The influent flow Qf was adjusted to provide a mass input rate of substrate based on Csf to give a constant substrate organic loading rate with respect to the maximum biomass uptake capacity (Equation (12)). Thus, the applied substrate organic loading rate was set to a relative constant level:
Q f · C s f = f L · i = 1 n m x a · q s i m
where f L is the applied fraction of the maximum possible organic loading rate (0 < f L < 1) with respect to the system maximum capacity in substrate uptake rate.

3. Results and Discussion

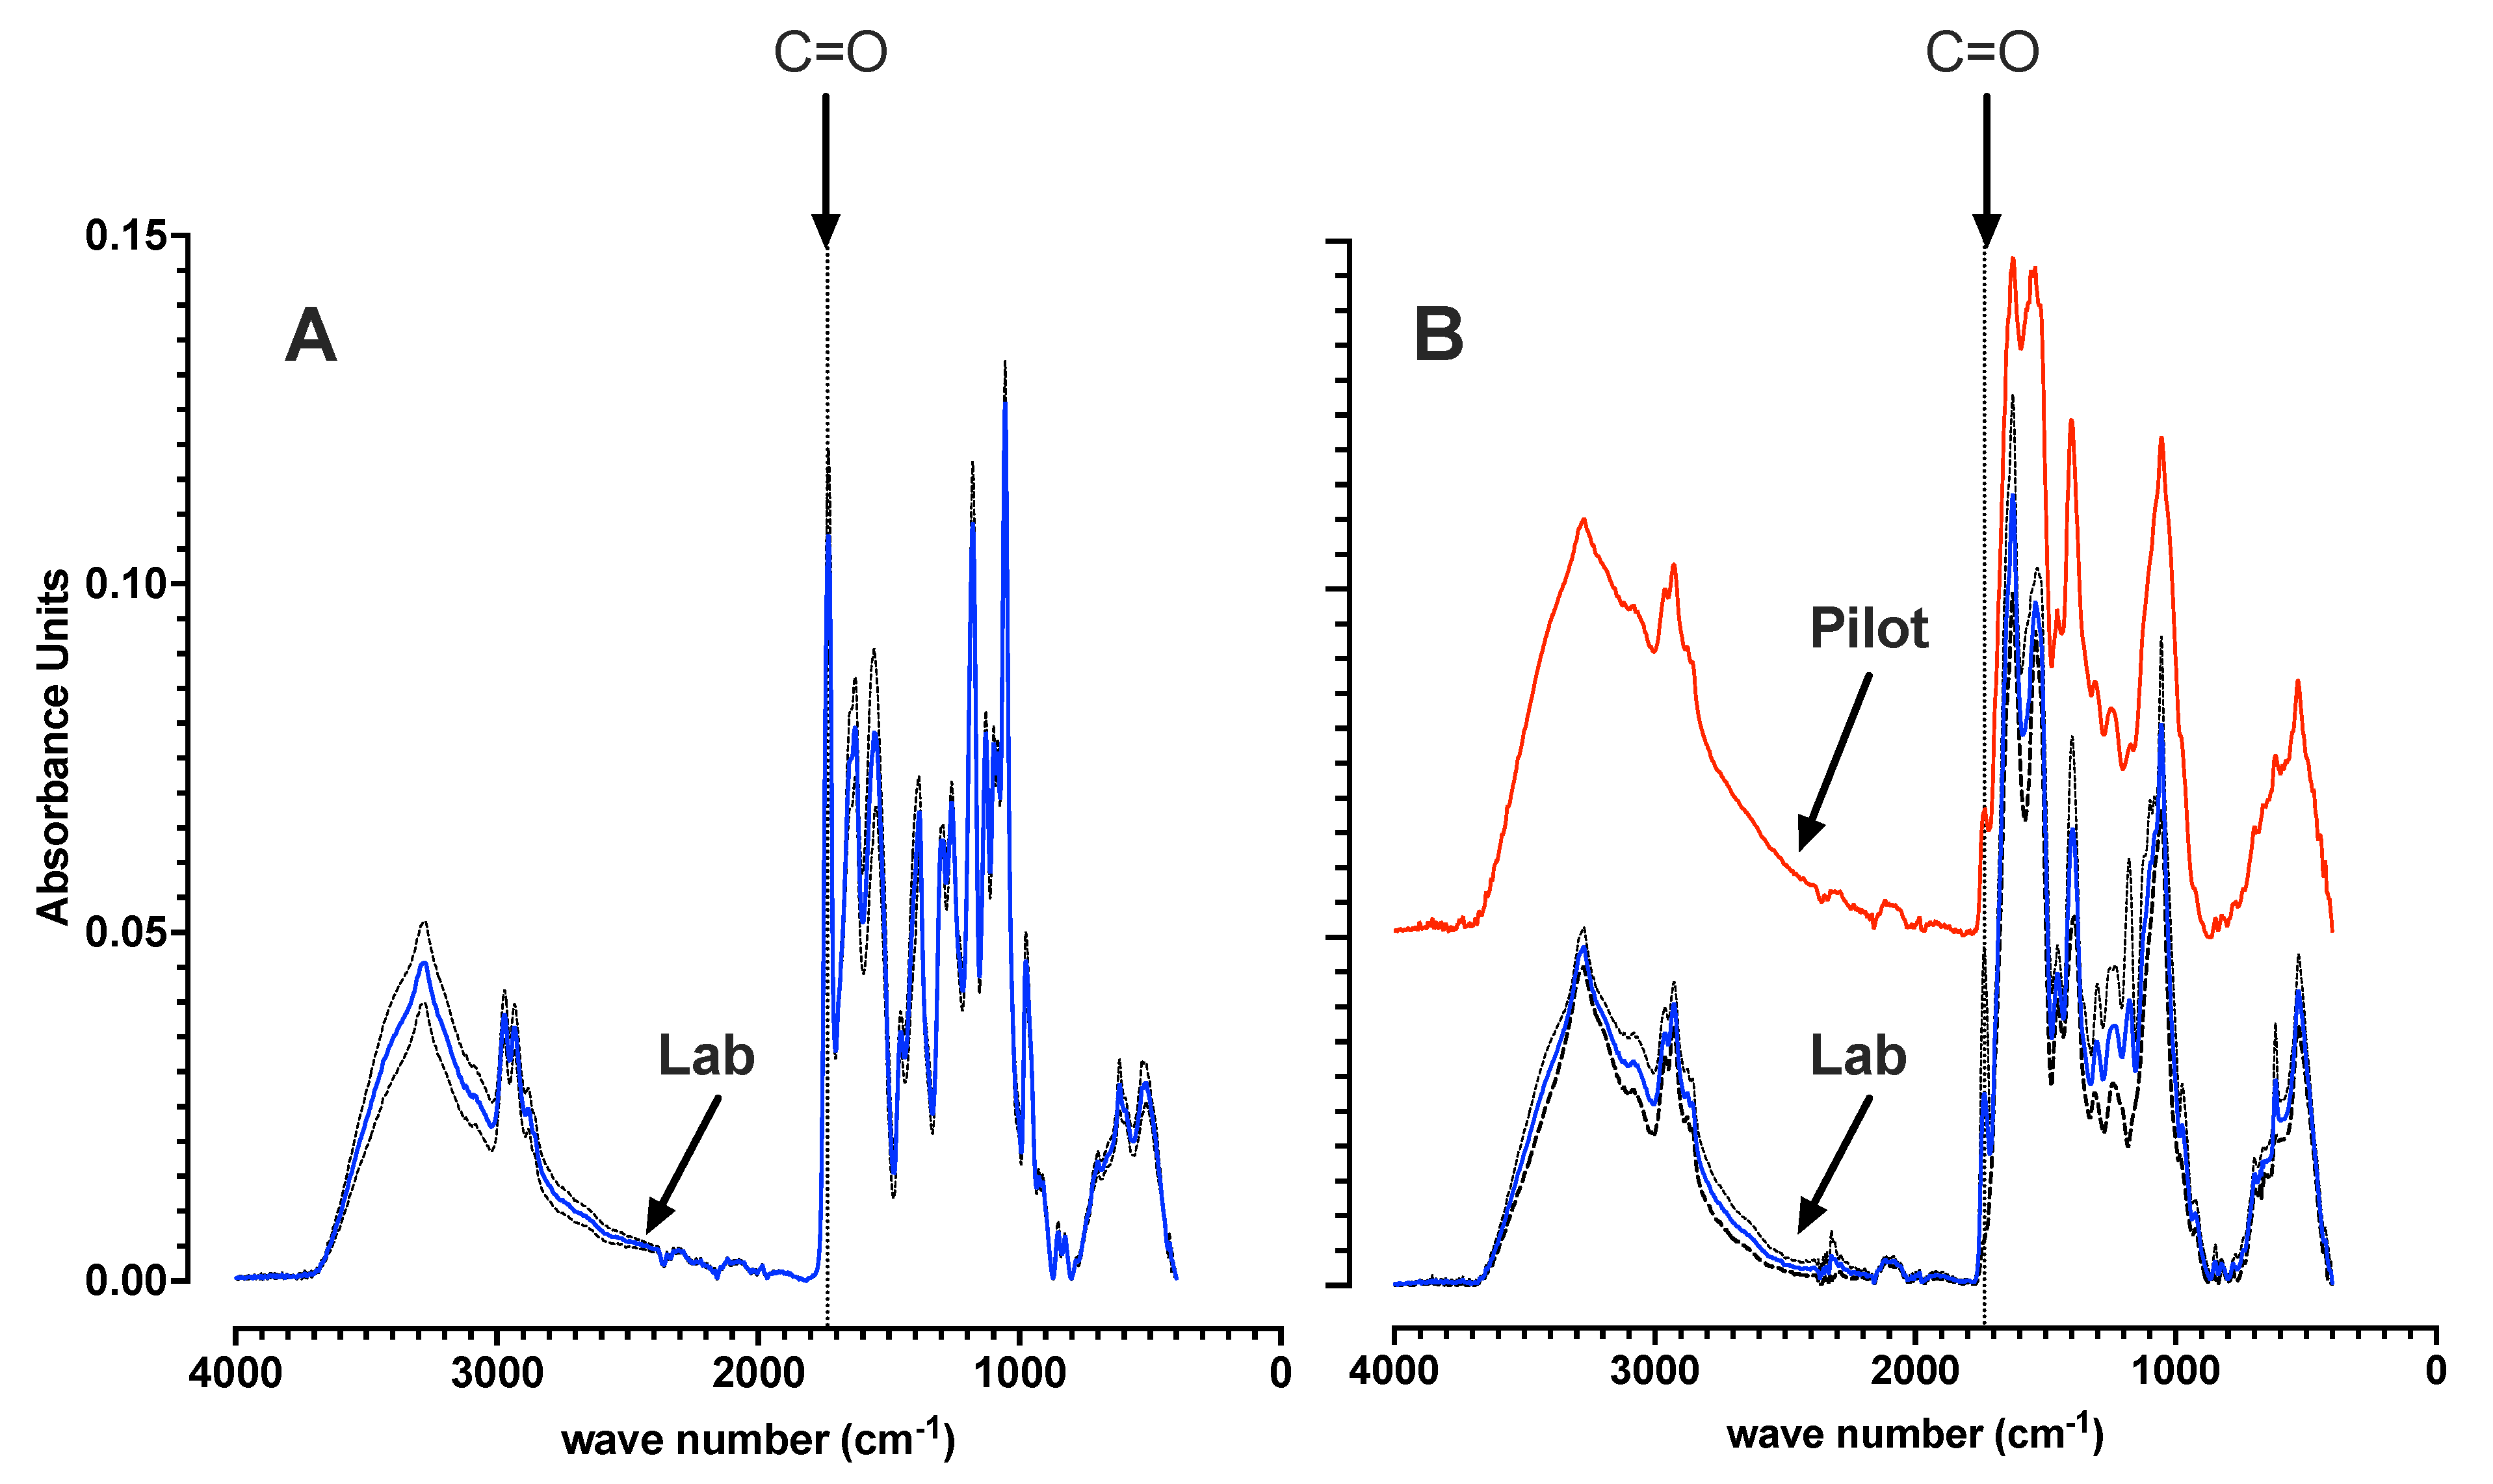
3.1. Laboratory and Pilot MMC Enrichment Biomass Characterization

Ten sets of experiments were performed with the laboratory scale SBR biomass harvested after the feast phase with a subsequent applied period of famine. All the respiration experiments on the laboratory scale famine biomass were spread over 3 months of steady state SBR operations. Two sets of replicate experiments were performed for the pilot scale MMC biomass harvested after famine. Consistency of the biomass condition before experiments was evaluated. FTIR measurements were performed on dried biomass samples from the laboratory biomass directly after feast harvesting. The laboratory and pilot famine biomass were also assessed by FTIR before experiments. Consistency of added ammonia uptake after laboratory feast biomass harvesting was confirmed.
Based on the experience from previously reported studies [35,41], FTIR measurements qualitatively confirmed a consistency of laboratory SBR operations with respect to post feast significant biomass PHA content, and a famine biomass with low to negligible PHA content (Figure 2). For the harvested laboratory biomass, progression to famine aerobic respiration by consumption of stored polymer was facilitated with added ammonia-nitrogen during 8 h of famine. Levels of ammonia after famine were 26.0 ± 3.5 mgNH4-N/L down from 62 mgNH4-N/L added just after feast harvesting. The pilot scale biomass was harvested after the famine cycle on site. Pilot scale famine biomass was similarly confirmed by FTIR to contain negligible PHA content before the start of the respiration experiments (Figure 2).

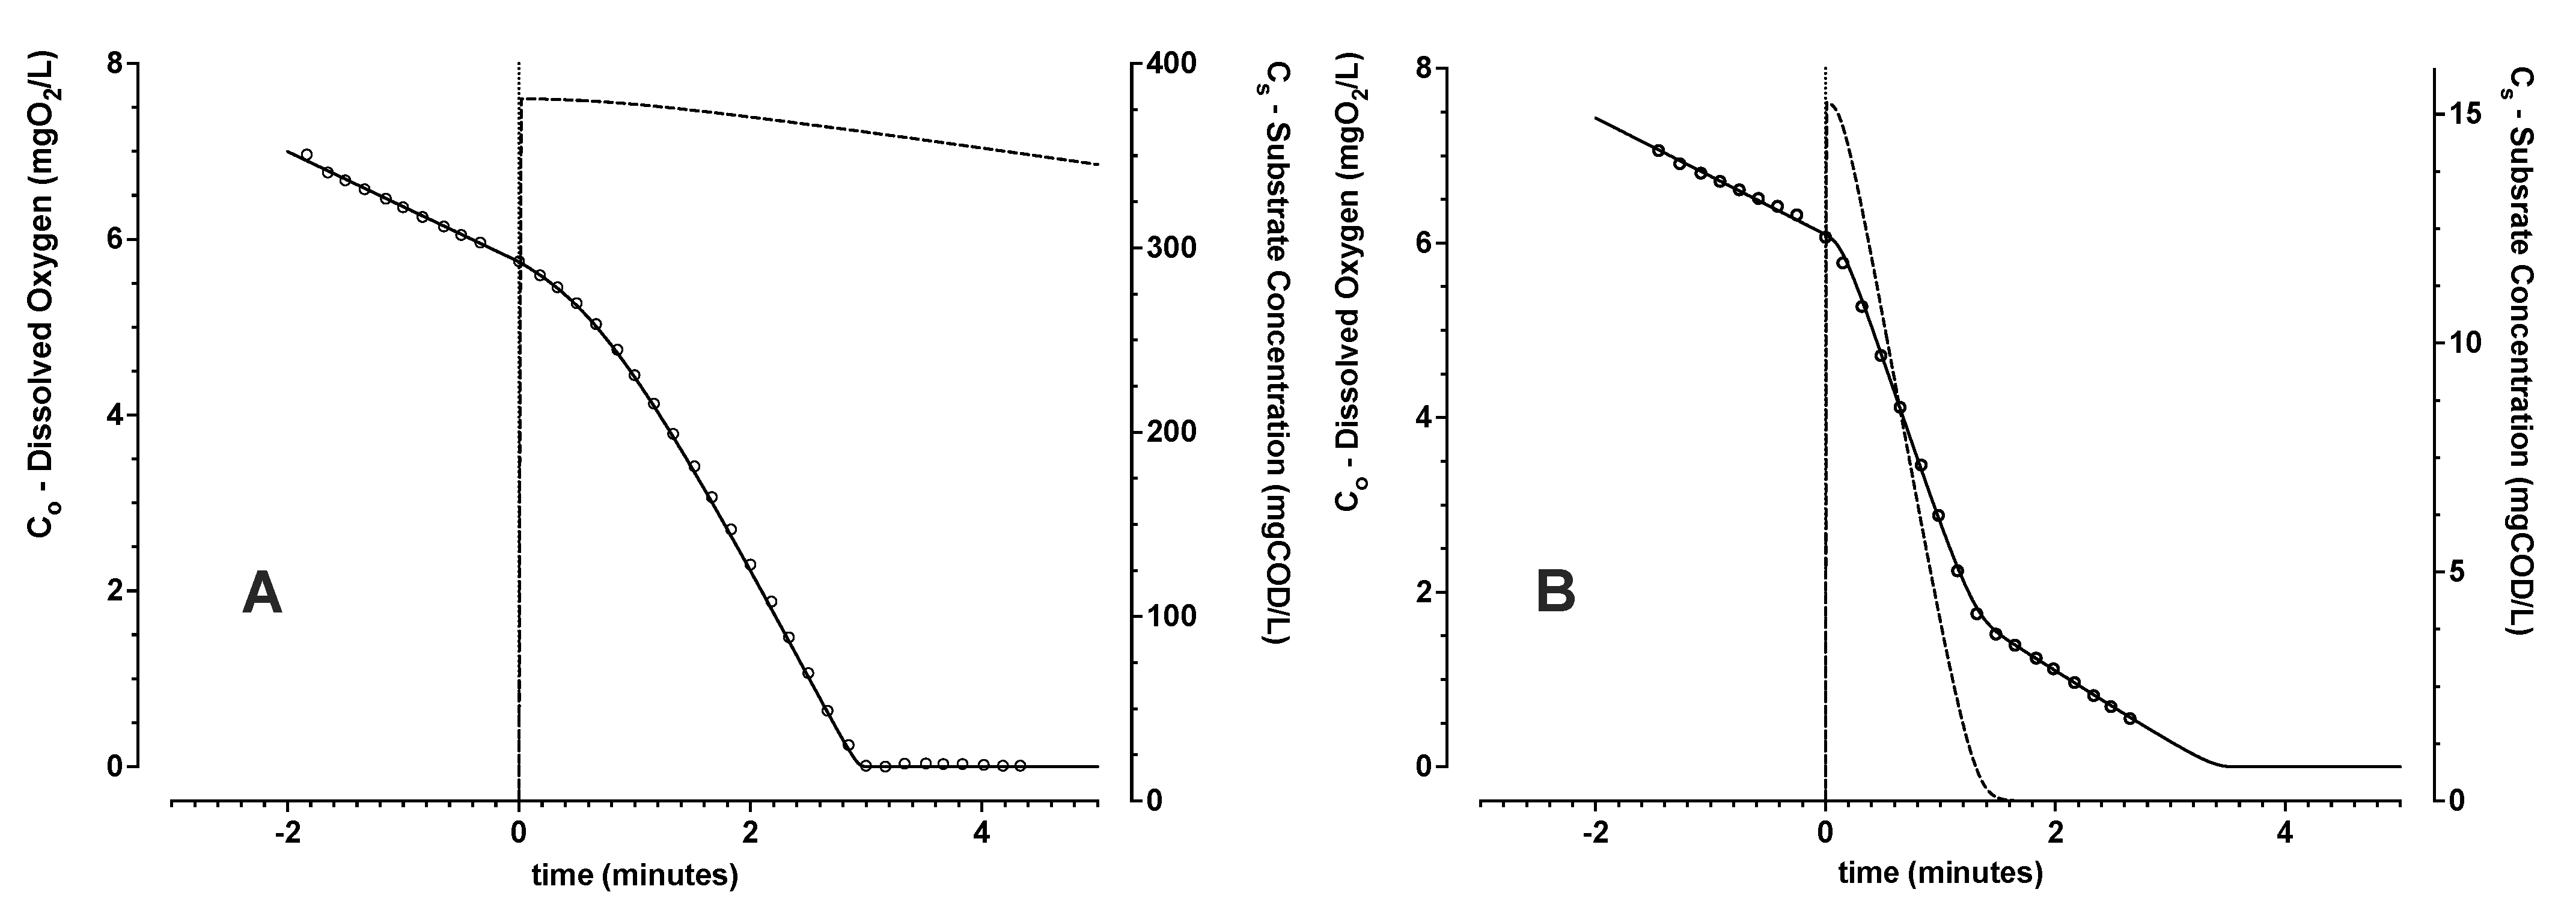
3.1.1. Model Evaluation with No Active Aeration

The oxygen and COD mass balance model was first evaluated with the laboratory scale SBR biomass in experiments with no active aeration (ka ≈ 0) (Figure 3). Respiration rates were always referenced to the initial observed endogenous respiration rate. Any minor contribution of passive oxygen transfer would introduce a slight negative bias to the estimation of the reference background level of endogenous respiration rate.
For initial substrate concentrations (Csi) larger than about 20 mgCOD/L, dissolved oxygen levels were insufficient for complete removal of added substrate (Figure 3A). For these larger starting substrate COD levels, a progressively increasing respiration rate from an initial starting level was observed. This induction of increase in respiration rates above the reference endogenous levels, could be described implicitly in time by applying respective parameter constants of fi and ki given in Equations (7) and (8). Further, it was possible to establish that ko was negligible (<0.1 mgO2/L) for this MMC biomass dominated by finely dispersed suspended solids. A non-readily settling biomass was expected because enrichment was applied without requirement for settling as part of the selection pressure (HRT = SRT).
For lower starting Csi levels (<20 mgCOD/L), initial dissolved oxygen concentrations were high enough to support complete added substrate COD removal (Figure 3B). Parameters describing the trends of respiration on the added substrate mass and kinetics for complete substrate removal could be readily estimated. Experiments replicated with 3 distinct batches of surplus biomass for Csi concentrations of 5, 10 and 15 mgCOD/L gave an average oxygen yield on substrate Yos of 0.23 ± 0.03 (n = 7) gO2/gCOD. This estimated yield coincides with the previously reported theoretical Yos level of 0.26 gO2/gCOD [42] for PHA storage. Therefore, the resultant estimated yield of oxygen consumed for substrate removed supported the assumption of polymer storage without active biomass growth. This interpreted polymer storage dominating response was notwithstanding availability of ammonia-nitrogen and ortho-phosphate in the medium.
Transport of acetate into the cell and its activation is estimated to cost 1 ATP per Cmol of acetate [43]. Acetate transport into the cell can be both passive and active depending on substrate concentration and/or external conditions of pH [44]. Thus, conditions that promote for greater extent of passive transport would result in reduced oxygen demand for PHA accumulation, and consequently Yos values can also be lower than the estimated theoretical level of 0.26 gO2/gCOD.
A consistently low ks value of 0.110 ± 0.004 mgCOD/L was estimated for the cases with low starting substrate concentrations. A low apparent substrate affinity constant (ks) was expected. In previous work [40], an arbitrarily low ks value of 0.2 Cmmol/L (6.2 mgCOD/L) was selected, and not estimated explicitly to avoid numerical problems in other parameter determination. The present work suggests an affinity constant for acetate in the substrate consumption (Equation (6)) that is an order of magnitude lower.

3.1.2. Model Evaluation with Active Aeration

Assessment of biomass respiration response over a wider range of initial substrate concentration required oxygen supply. Constant aeration maintained dissolved oxygen levels greater than 1 mgO2/L, and, thereby, they were significantly greater than the estimated ko. The model represented observed trends of dissolved oxygen, for an initial substrate concentration (Figure 4). Even if substrate concentration as a function of time was not measured explicitly, the endpoint of substrate consumption was implicitly determined according to the model by the maximum in the rate of change (inflection point) of dissolved oxygen concentration given constant air flow rate. When substrate becomes exhausted, oxygen levels will increase first rapidly and then asymptotically to a higher dissolved oxygen level due to the shift to lower respiration rates.
Each experimental data set was divided into 3 zones for the model parameter estimation (see Figure 4A): Zone 1—pre-aeration before substrate addition, Zone 2—substrate consumption after its sudden pulse wise addition, and Zone 3—post aeration after the above mentioned inflection point. Only the first 4 min of Zone 3 were included in the data analysis. In this way, the re-aeration trend with the average (approximately constant) respiration rate on the maximum level of stored polymer was estimated. To avoid a risk for uncertainty in parameter value prediction, a progressive approach towards robust step-wise parameter estimation was applied. The 8 parameters (ka, fi, ki, ks, kh, Yos, Qop, q s m ) were estimated in 6 steps:
  • From Zone 3, the re-aeration Co trend (Equations (1) and (3)) was fit by non-linear least squares regression with assumption of constant Qoe and Qop. From the fitted trend, the oxygen mass transfer coefficient ka was estimated;
  • From Zone 1, the average reference level of endogenous respiration, Qoe (Equations (1) and (3)), was then estimated assuming negligible Qop;
  • From Zone 3, Qop, the average respiration rate on stored polymer directly after substrate depletion, was then calculated (Equations (1) and (3));
  • From Zone 2, the trend of respiration rate on substrate, Qos, was then estimated (Equations (1) and (3));
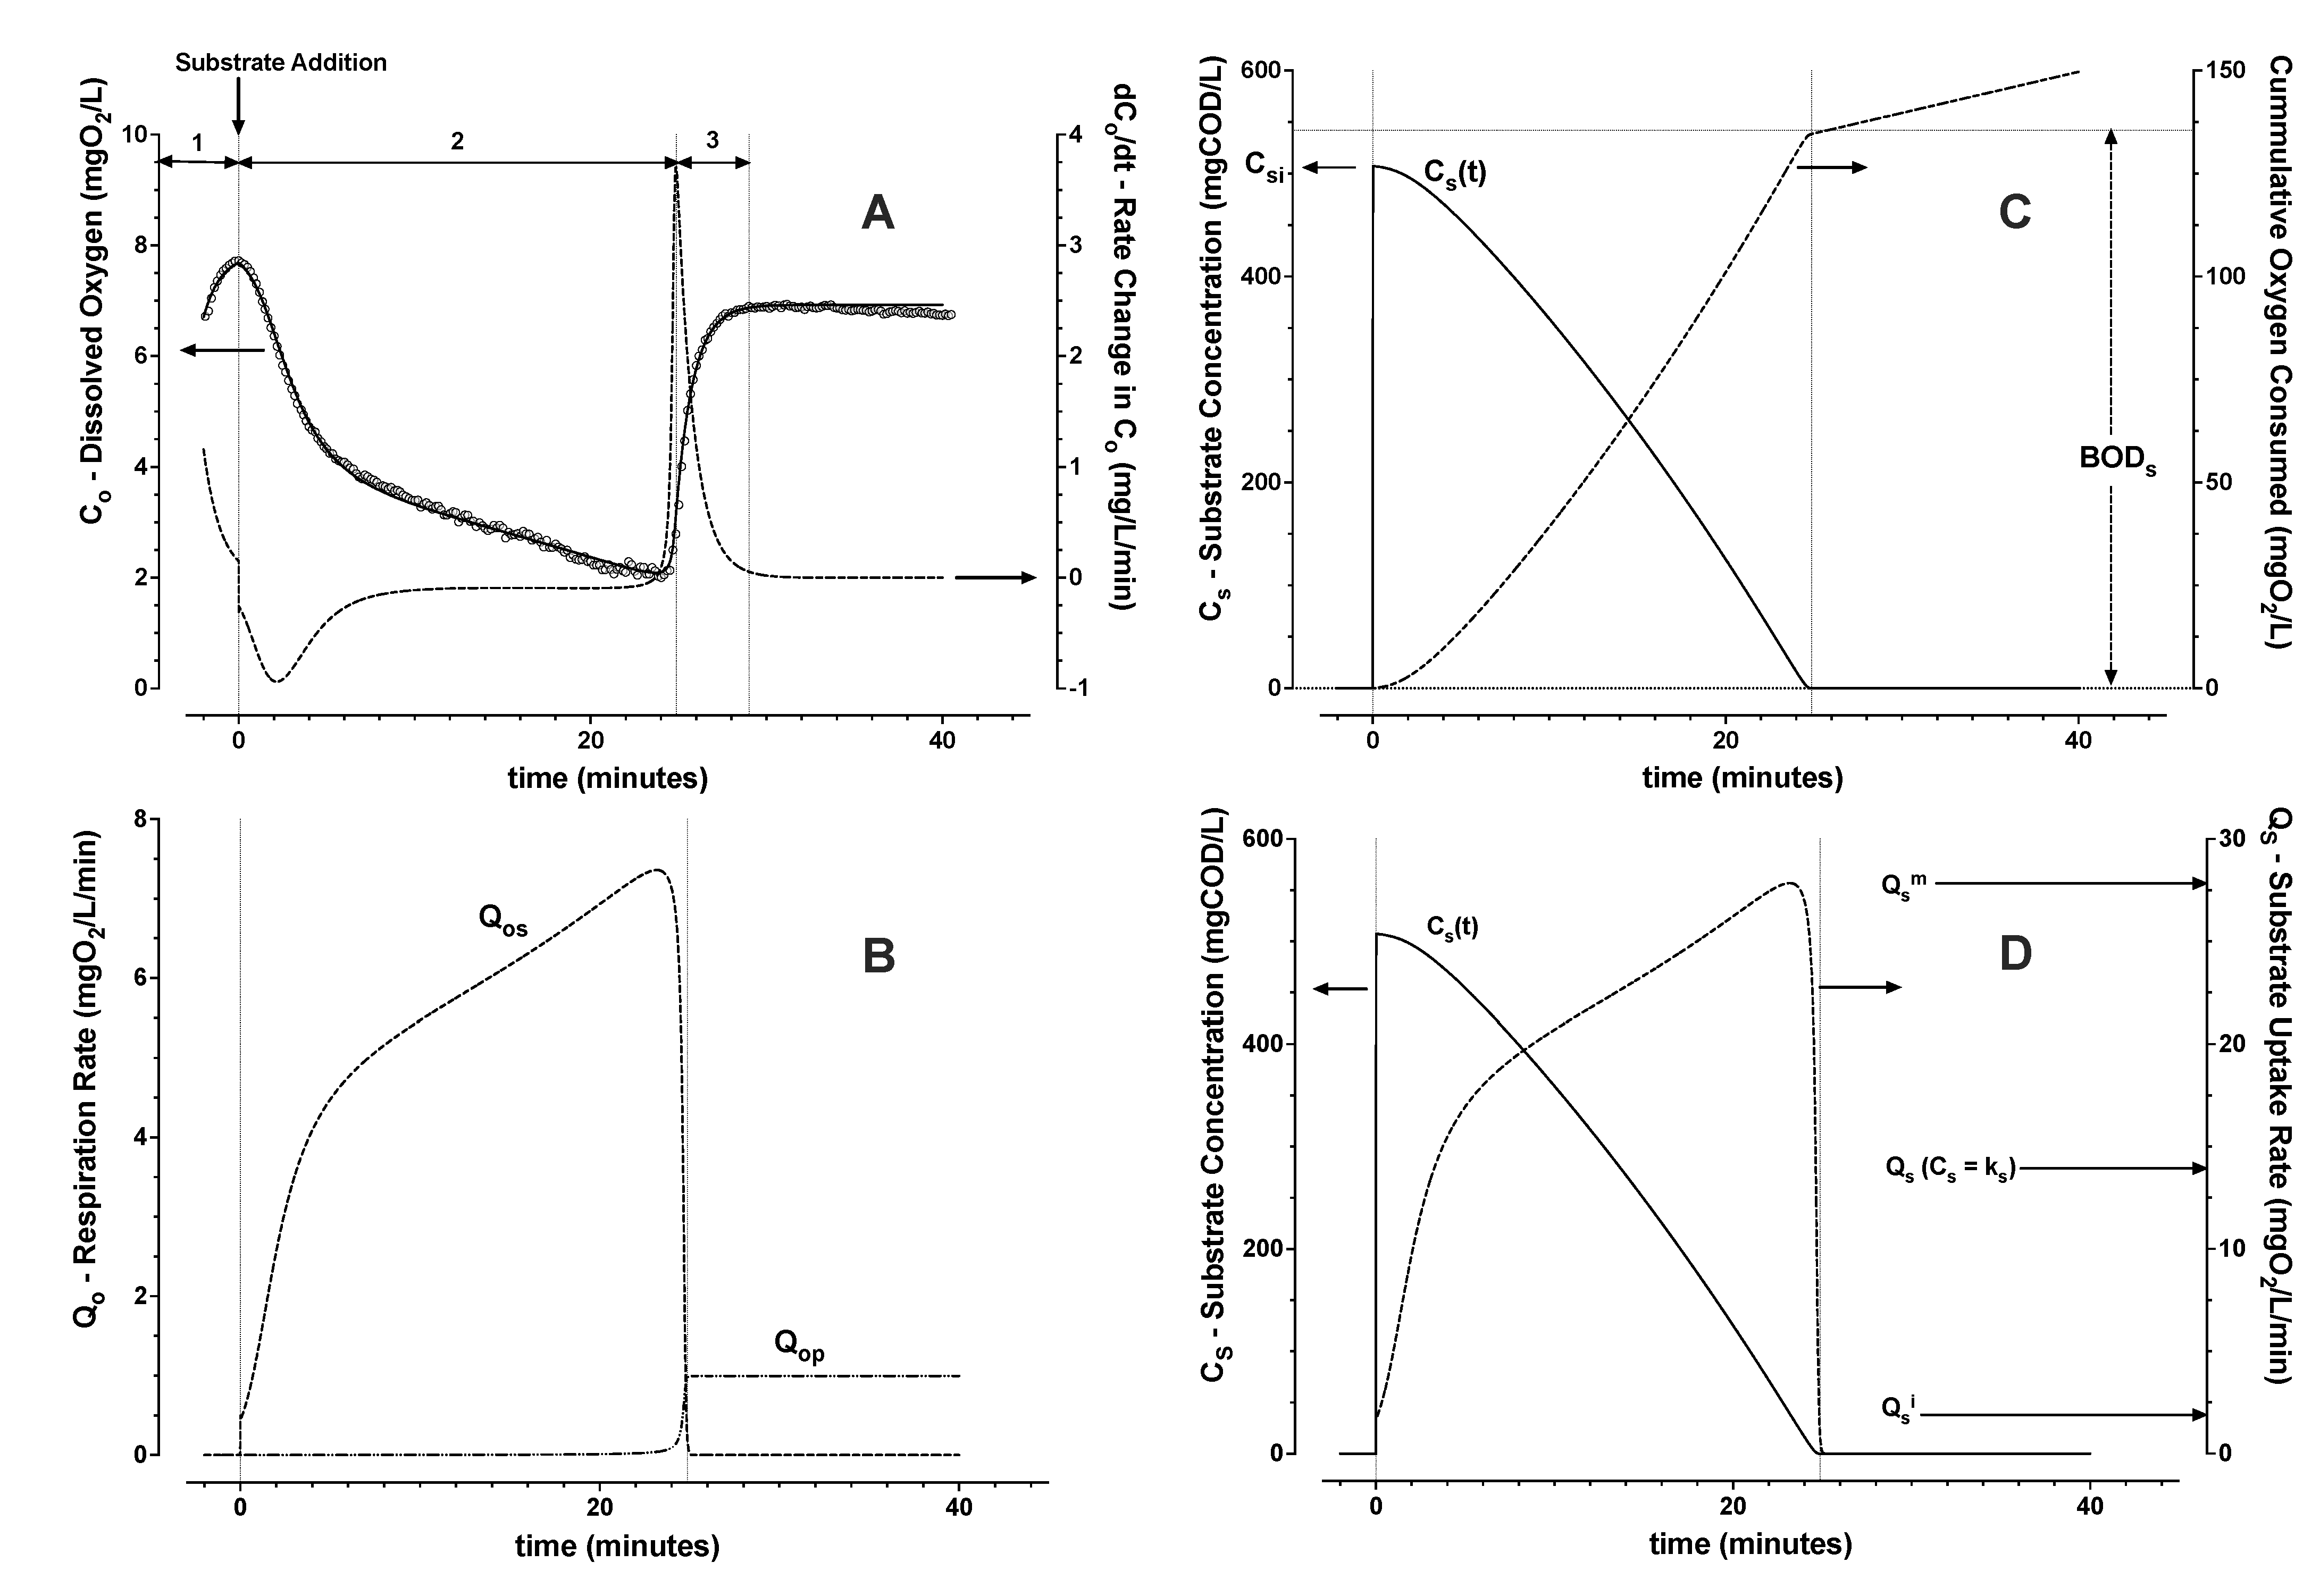
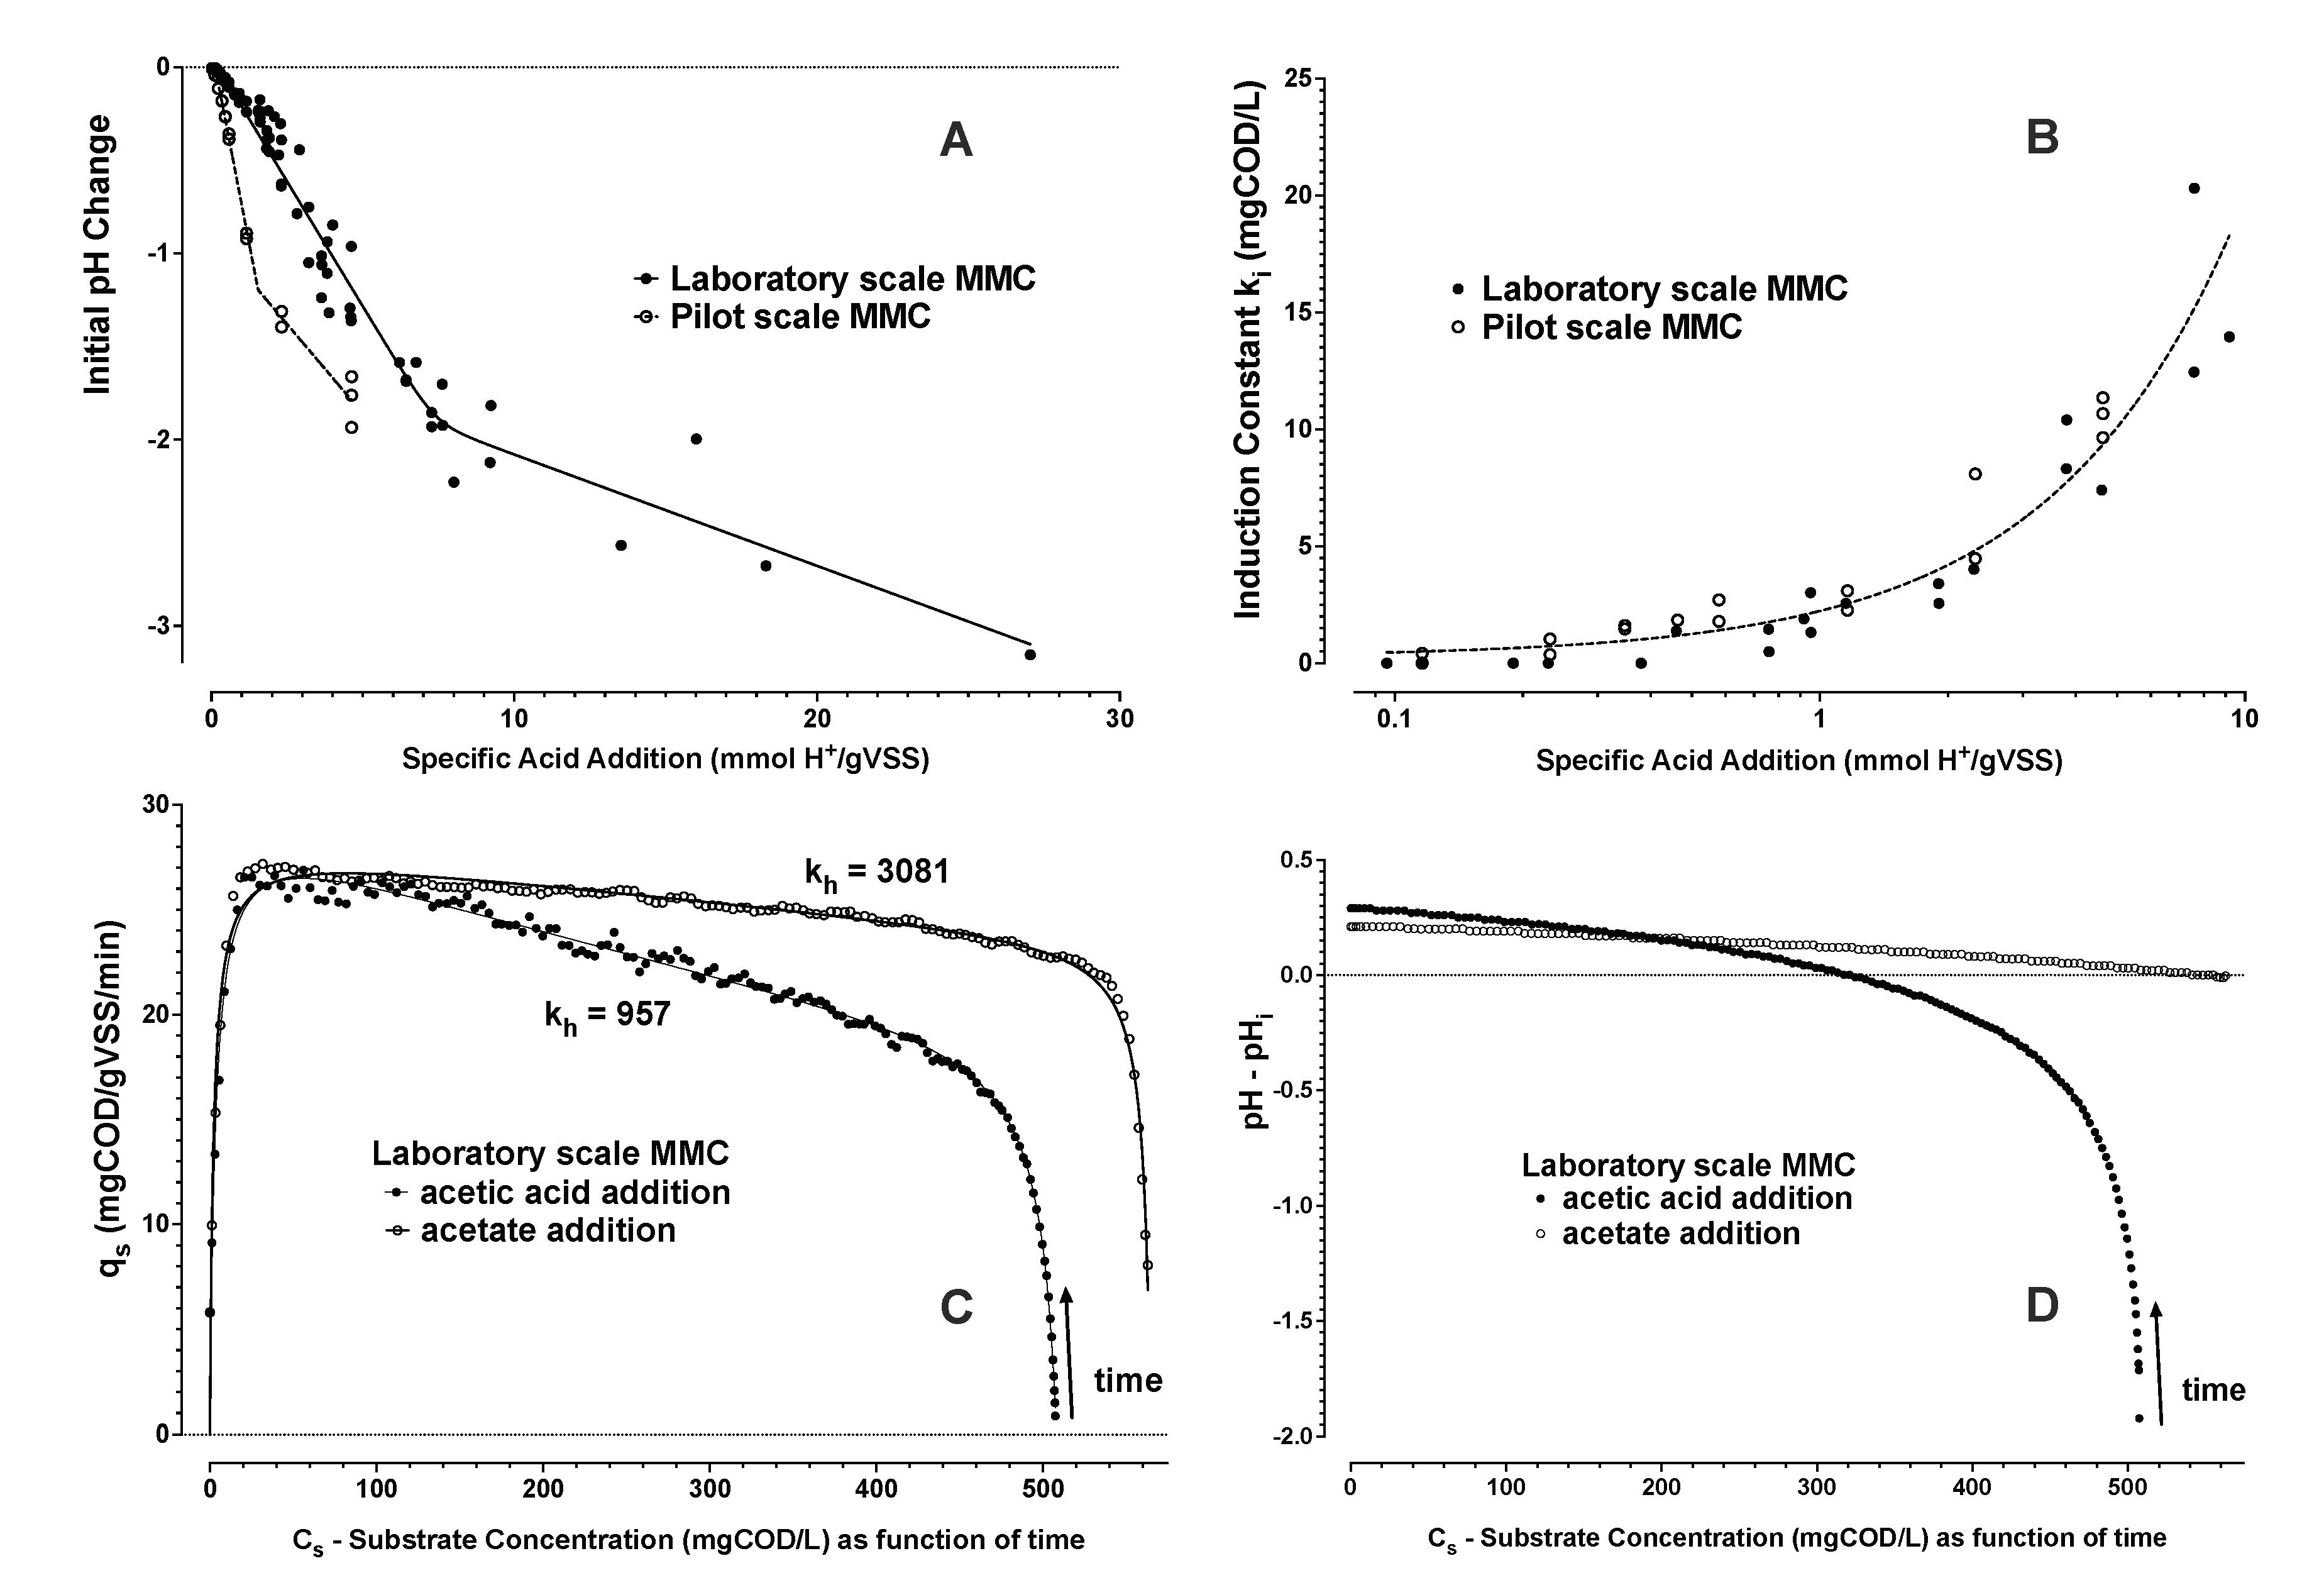
  • From Zone 2, the integral of Qos, the cumulative biochemical oxygen demand (BODs) due to substrate removal, was estimated. Then the average yield Yos and the trend of substrate concentration were calculated (Equation (2));
  • From Zone 2, the trend of substrate uptake rate as a function of estimated substrate concentration was then used to determine remaining parameters (Equations (6)–(8)). The induction and downshift substrate affinity constants (ki and ks, respectively) were interpolated from the derived trend of substrate uptake rate as a function of interpreted substrate concentration. Remaining parameters were estimated by nonlinear least squares regression analysis (see Figure 4 and Figure 5).
The laboratory scale SBR biomass was characterised in triplicate with distinct famine biomass batches over a week of steady SBR operations (Figure 5A,C). The pilot scale SBR biomass was similarly characterized with replicate evaluations from one grab sample of the pilot surplus activated sludge (Figure 5B,D). Summary of experiments and outcomes for the biomass evaluations with respect to the parameters of the model (Equations (1)–(9)) are given in Table 1 and depicted in Figure 5.
The estimated average yield of oxygen on substrate Yos (Table 1) reproduced outcomes reported above for cases without active aeration. Yos for the pilot biomass was also found to be close to theoretical predictions for microbial activity due to polymer storage only [42]. The assumption to neglect active growth in the model evaluation was therefore supported also for the pilot scale biomass. The oxygen mass transfer coefficient (ka) was determined independently for each experiment with consistent outcomes. A lower air flow rate was applied for the pilot scale biomass experiments due to lower levels of respiration rate.
A reproducible low substrate affinity constant (ks) was observed for both biomass sources. The ks value, about 2 mgCOD/L, was higher than the value estimated for experiments reported above without active aeration at low initial Csi values. The ks (without active aeration) was reproducible and estimated by non-linear least squares regression model analysis. The ks (with active aeration) was estimated pragmatically as the interpolated concentration at half the maximum substrate uptake rate from the 6-step derived trend of Cs with time. The value of about 2 mgCOD/L was considered to be a conservative estimate of what may actually be a lower affinity constant in reality. A ks of 2 mgCOD/L is still much lower than previously assumed [40]. ks has significant bearing on the performance of a flow through PHA accumulation bioprocess. A lower ks means, with all other parameters being equal, that similarly high polymer production rates can be maintained with lower substrate concentrations. Lower substrate concentration means less substrate lost in the effluent of a flow-through process giving a better substrate utilisation efficiency.
As expected, the maximum observed substrate uptake rates were dependent on the initial applied substrate concentration. Contrary to trends of substrate consumption, the affinity constant for stimulating an upshift to a maximum substrate uptake rate (ku) was found to be significantly larger than ks (Table 1). Thus, the hysteresis that was anticipated from previous work [31] was confirmed from the model that could be similarly applied for two distinct MMC cultures. Levels of substrate concentration that are necessary to stimulate to a maximum rate of substrate uptake are predicted to be higher than the concentration levels that are necessary to maintain a substrate uptake rate once it has been established. The upshift kinetics (Equation (9)) and downshift kinetics (Equation (6)) both similarly follow a Monod model but they did not follow the same path.
Enrichment MMC biomass sourced from laboratory and pilot SBRs revealed a similar behaviour, but the pilot MMC exhibited about one third the specific maximum rate to assimilate substrate. The trends of maximum substrate uptake rate further suggested an inherent starting (resting) capacity for substrate uptake rate ( q s r ). This capacity can be seen in the trends shown in Figure 5C,D. The maximum substrate uptake rates approached the initial inherent rates with decreasing Csi. However, when dosing with acetic acid, Figure 5 also shows how the initial levels of substrate uptake rate ( q s i ) decreased below the estimated q s r in direct proportion to added amounts of acetic acid.
Higher initial levels of acetic acid suggested apparent substrate inhibition during substrate uptake, as depicted in Figure 5A,B and this inhibition could be described by applying a Haldane inhibition constant kh (Equation (6)). Since, the acetic acid addition included both organic substrate and acid addition, it was unclear if COD levels, and/or acid addition were causative factors to observed substrate inhibition. Additional respiration experiments were performed with the laboratory SBR biomass using acetic acid and acetate blends. These experiments suggested that, in the range of conditions tested, it was the amount of acid addition and not the initial COD concentration that promoted the decrease in q s i with respect to q s r (Figure 6B,C).
The buffer capacity of the mixed liquor involves contribution from dissolved solids as well as the biomass suspended solids. Initial pH change due to acid addition could be characterized with respect to the specific acid addition. The buffer capacity for mmol/L H + added with respect to Xa concentration is shown in Figure 6A. Results suggested that even if the pilot SBR biomass exhibited lower buffer capacity (higher pH change for the same specific acid addition), similar levels of specific acid addition resulted in a similar induction lag phase described by ki (Figure 6B). Thus, the amount of specific acid addition causing sudden pH change may be of more direct influence on the initial biomass response to organic acid dosing rather than the absolute initial pH change. An influence of the amount of acid addition on uptake rate was also inferred by comparison of pH and uptake rate trends (Figure 6C,D). A lower kh (higher apparent Haldane substrate inhibition) was observed for acetic acid versus acetate additions in experiments for approximately the same starting COD concentration.
The relatively small increment in PHA content that accumulated in the biomass after a small pulse of substrate was not measured directly as part of the study. The median applied substrate pulse for the experiments was 57 mgCOD/L acetic acid concentration. From Table 1, and the COD mass balance (Equation (5)), the expected increment of biomass polyhydroxybutyrate content can be estimated. Assuming an active biomass concentration (Xa) of 1 gVSS/L, 57 mgCOD/L of acetic acid would result in about 2.5 percent gPHA/gVSS. Even though the biomass PHA content was not measured explicitly, it was of interest to evaluate if the independently determined level of biomass respiration after substrate consumption corresponded to the model predicted level of PHA produced (Xp). Directly after substrate consumption the residual elevated respiration rate Qop was estimated from Equations (1) and (3). Qop should be directly related to aerobic metabolism on stored PHA [30,38]. The residual respiration rate levels were found to follow an expected two-thirds power law trend (Figure 7) as a function of the estimated specific polymer concentration (Xp/Xa). This outcome suggests an internal model consistency and supports previous research findings for microbial activity during famine [30].

3.1.3. Monte Carlo Simulation of PHA Accumulation in MMC Enrichment Biomass

Sets of PHA accumulation numerical simulations were performed to explore the implication of the interpreted stimulation-maintenance hysteresis due to upshift and downshift substrate affinities given by:
  • the stimulation of respiration rates due to the highest most recent substrate concentration as influenced by ku in Equation (9), and
  • the maintenance of an attained respiration rate with decreasing substrate concentrations as influenced by ks in Equation (6).
Simulations comprised an aerated maintenance volume Vm of 500 L, containing 5000 mgVSS/L active biomass with PHA accumulation potential of 0.6 gPHA/gVSS. The biomass suspended solids were divided into 10 5 individually followed floc elements ( x a = 25 mgVSS active biomass per element). The estimated average kinetic parameters of the laboratory scale biomass were applied (Table 1). An influent feedstock with a low Csf of 1000 mgCOD/L was supplied continuously with adjusted flow Qf to maintain a targeted fraction of the biomass maximum substrate uptake rate ( f L ). Qm flow rates were set to a defined HRTm, and Vs was adjusted to ensure an HRTs of 30 s based on Qm in all cases. Simulations were maintained for up to 1 h modelled time by which time steady trends were well-developed and polymer content approached levels in the order of 0.3 gPHA/gVSS.
An influence of stimulation-maintenance hysteresis is illustrated in Figure 8 for cases of HRTm equal to 10, 40, and 640 min and a constant relative substrate loading rate of f L equal to 0.7 in all three cases. For increasing HRTm, the frequency that any given floc element recirculates to the Vs influent mixing zone, decreases progressively. At longer HRTm the system approaches limiting conditions of Qf effectively flowing directly into Vm. For influent flowing directly to Vm, biomass respiration rates will initially increase due to increase of Csm in Vm and the active biomass will respond with a corresponding increase in respiration rate (Equation (9)). Csm will increase and approach a steady state value when the substrate mass inflow rate matches the sum of the effluent mass outflow rate plus the biological mass uptake rate for PHA storage. Loading the modelled laboratory biomass at f L equal to 0.7 resulted in such a predicted steady state effluent substrate concentration of about 50 mgCOD/L with longer HRTm. In these cases, the process dynamics are driven only by Equation (9). The system settles, in this example, at “A” in Figure 8.
For reduced HRTm, flocs of biomass are more frequently and repeatedly stimulated to a higher respiration rate due to exposure to Css in Vs. Over a period of about 3 × HRTm, essentially all the biomass suspended solids should have been disposed to respiration stimulation in Vs. Increasing Qm to give a 10-min HRTm, f L equal to 0.7, resulted in Css in the order of 500 mgCOD/L in Vs. This level is significant for stimulating maximal respiration rates for the laboratory scale biomass (Table 1). Initially, Csm substrate concentrations increased in Vm, and two populations of biomass activity developed in parallel. Some flocs were respiring at a level due exposure to the increasing Csm levels in Vm (Equation (9)). However, a second population of flocs developed increasingly over 3 × HRTm. These flocs had passed through Vs. This population respired at higher levels due to contact to Css in Vs (Equation (9)), and subsequent Csm in Vm (Equation (6)). In this way, the system settled at an order of magnitude lower steady state Csm in Vm of 6 mgCOD/L (“B” in Figure 8). This lower effluent concentration was approached as all biomass elements passed through Vs at least once. A similar overall level of substrate uptake rate resulted at “B” as for “A”, but with a significantly improved substrate utilization efficiency. By floc element exposure to respiration stimulation to near maximal rates in Vs a higher respiration was maintained down to lower substrate concentrations (Figure 5A,C). For increasing HRTm, it takes longer for the system to reach steady state due a longer Vm volumetric turnover time (“C” in Figure 8). Thus, lower HRTm served to stimulate all process biomass as quickly as possible.

3.1.4. Future Research Perspectives and Challenges

This strategy for engineering accumulation bioprocess with internal, or external, recirculation and contact to elevated substrate concentrations that exist in the influent mixing zone(s) becomes increasingly more relevant the lower the influent substrate concentration becomes. Stimulation of respective biomass elements is asynchronous in time because not all biomass elements experience “stimulation” at the same time. Monte Carlo modelling can be applied as a way to understand the nature of the distribution of activities for discrete floc elements. In contrast, the typical approach for PHA accumulation with laboratory and pilot scale systems in the reviewed research literature [11,12] has been by dosing often concentrated substrate directly into a well-mixed aerated vessel containing PHA accumulating biomass. This is a synchronous strategy for stimulating high respiration rates because all the process biomass is subject to the same substrate concentration history at the same time.
Typically, dissolved oxygen [25,45,46], redox conditions [47], or pH [48] can be used with feedback control for timing the frequency of pulse feeding events. When substrate is concentrated, the process may be fed-batch and initiated with lower starting volume with a more concentrated biomass [49]. Furthermore, when the feedstock is concentrated then small pulse wise volume inputs can be added to bring the entire working volume quickly to substrate levels that result in maximum substrate uptake rates. Even in such cases, the process volume may not be sufficiently large to be able to supply enough VFA mass to reach saturation of PHA content in the process biomass. Intermittent settling and decanting cycles have been suggested as one strategy to extend the process capacity to enable delivery of more substrate [50]. However, periodic batch decanting of excess volume introduces a dead time to the accumulation process. This added time for intermittent settling and decanting is a disadvantage because it reduces volumetric productivity. Continuous feed MMC PHA production methods therefore need further attention for the industrial developments.
Additions of substrate in MMC accumulation cannot be too large due to a risk for inhibition [46]. Larger additions of substrate also increase the availability of substrate. Availability of substrate (without other limiting factors) can stimulate for active growth of the accumulating as well as flanking heterotrophic biomass populations [51]. Methods for dosing substrate based on pH control results in sustained elevated substrate concentrations [52] that are anticipated to contribute to stimulate for unwanted flanking growth. Continuous feeding methods for MMC production methods require to be developed and undertaken in ways that do not unduly reduce the yield of product formation by promoting unwanted flanking biomass growth.
Smaller pulse-wise substrate additions can be made in a fed-batch process with peak substrate concentrations that are just sufficient to stimulate high average substrate uptake rates [17]. This semi-continuous feeding approach can be performed with fed-batch or flow through process methods. However, fed-batch methods with many smaller pulses also introduce a dwell time between successive inputs. The dwell time between onset of substrate depletion from one pulse, and the control system triggering for the next pulse of substrate, has been observed in own developments to introduce a significant accumulated dead time with lower substrate uptake rate. This dead time decreases process volumetric productivity. More frequent interruption of substrate addition leading to punctuation of loss in respiration rate has been observed to furthermore risk to result in PHA of lower average molecular weight [31]. Therefore, the most optimal approach for MMC PHA accumulation is a process with continuous feeding that maintains the highest possible substrate uptake rate with the lowest possible effluent substrate concentration.
Methods supporting the development of industrial MMC PHA accumulation with continuous feed supply and as a flow through bioprocess have not been found to be reported in the research literature. Initial outcomes in published work for fed-batch methods applying constant feed based on predetermined rates without feedback control were not found to be satisfactory [46]. Since then pulse-wise feeding methods have become the standard practice in approach for MMC PHA production. Notwithstanding, continuous flow methods are desirable for continued advancements because they offer an optimal sustained volumetric productivity.
As an example, numerical simulations were performed to explore how the application of a stimulation zone could influence substrate utilisation efficiency while pushing the system towards theoretical limits of maximum PHA production rates with a feedstock VFA concentration of 1000 mgCOD/L (Figure 9). Higher applied organic loading rates drive the system biomass to maximum possible substrate uptake and polymer production rates (volumetric productivity). Without benefit of the stimulation effect (case of HRTm = 250 min in Figure 9), higher volumetric productivity results in a direct trade-off with loss of substrate utilisation efficiency. Increasing amounts of substrate are discharged in the effluent. With all other things begin equal, substrate losses are significantly mitigated if the biomass has been stimulated to higher respiration rate (case of HRTm = 5 min in Figure 9). For the modelled process scenario, a targeted organic loading rate of greater than about f L equal to 0.9 was a break point. Progressive losses in substrate utilisation efficiency result without further gains in volumetric productivity beyond the break point.
The stochastic modelling of the observed MMC biomass response in stimulation of respiration and substrate uptake rates suggests potential to understand and develop optimal operational conditions for robust continuous feed methods at industrial scale. Characteristics for any biomass may be readily determined by the methods of the respiration experiments that were replicated for both the laboratory and pilot scale SBR enrichment biomass sources in the present investigation. This kind of characterisation of the biomass dynamic response is recommended towards innovation in the bioprocess that can address challenges for maximising productivity and for avoiding growth of flanking populations.
In the present work, the dynamic response characterisation for two biomass sources revealed a similar inhibition effect of specific acid dosing (Figure 6B,C). This suggests a benefit of dosing substrate to higher concentrations of biomass. If biomass retention is by gravity separation, then recirculation and stimulation could be achieved by influent mixing with the return thickened biomass suspended solids coming from the clarifier. Higher suspended solids concentration brings added buffer capacity to the stimulation mixing zone.
Recirculation to Vs using as low a HRTm as possible helps to initially stimulate all the process biomass as quickly as possible. Feeding exclusively to the stimulation zone becomes less critical to maintain if all the process biomass has been “stimulated”. Once all the process biomass is stimulated the process control objective is to ensure a feeding rate to sustain sufficient but still relatively low substrate concentration levels (ca. 5 to 25 mgCOD/L, based on the estimated Ks of about 2 mgCOD/L). Thus a challenge is to establish feedback control for optimum feeding rate without over or under feeding the process.
In the model simulations, the required influent flow rate was calculated. In practice, the feeding rate must be determined from the process monitoring. Recirculating to the stimulation zone with known flows, mixing ratios and characteristic time constants, can serve needs for monitoring and feed rate feedback control [31]. Vs and Vm zones can be monitored in parallel with sensor signals (dissolved oxygen, pH, ORP, IR-spectroscopy, and so forth) that are related directly or indirectly to substrate concentrations, biomass respiration levels, and/or PHA content. The Vs zone provides a dynamic reference measurement because water quality parameters, including but not limited to, buffer capacity, and ionic composition will change in time. Changes will be due to the feedstock water quality and also the intense PHA accumulation biological activity in Vm. So-called soft-sensing process control strategies [53] are anticipated to become necessary. The process modelling methods applied in the present work can be adapted to test principles of control strategies for the polymer production. Addressing the challenges of developing robust and relevant strategies for the MMC accumulation process monitoring and control will be essential for successful industrial scale process implementations.

4. Conclusions

There are three main outcomes as conclusions from this study and with novelty in contributions from the investigation efforts to characterize and model dynamics of substrate uptake rate for MMCs during PHA accumulation:
  • A property of hysteresis in the dynamic response of MMCs storing PHA could be demonstrated for two distinct enrichment cultures using dissolved oxygen and chemical oxygen demand mass balance experiments.
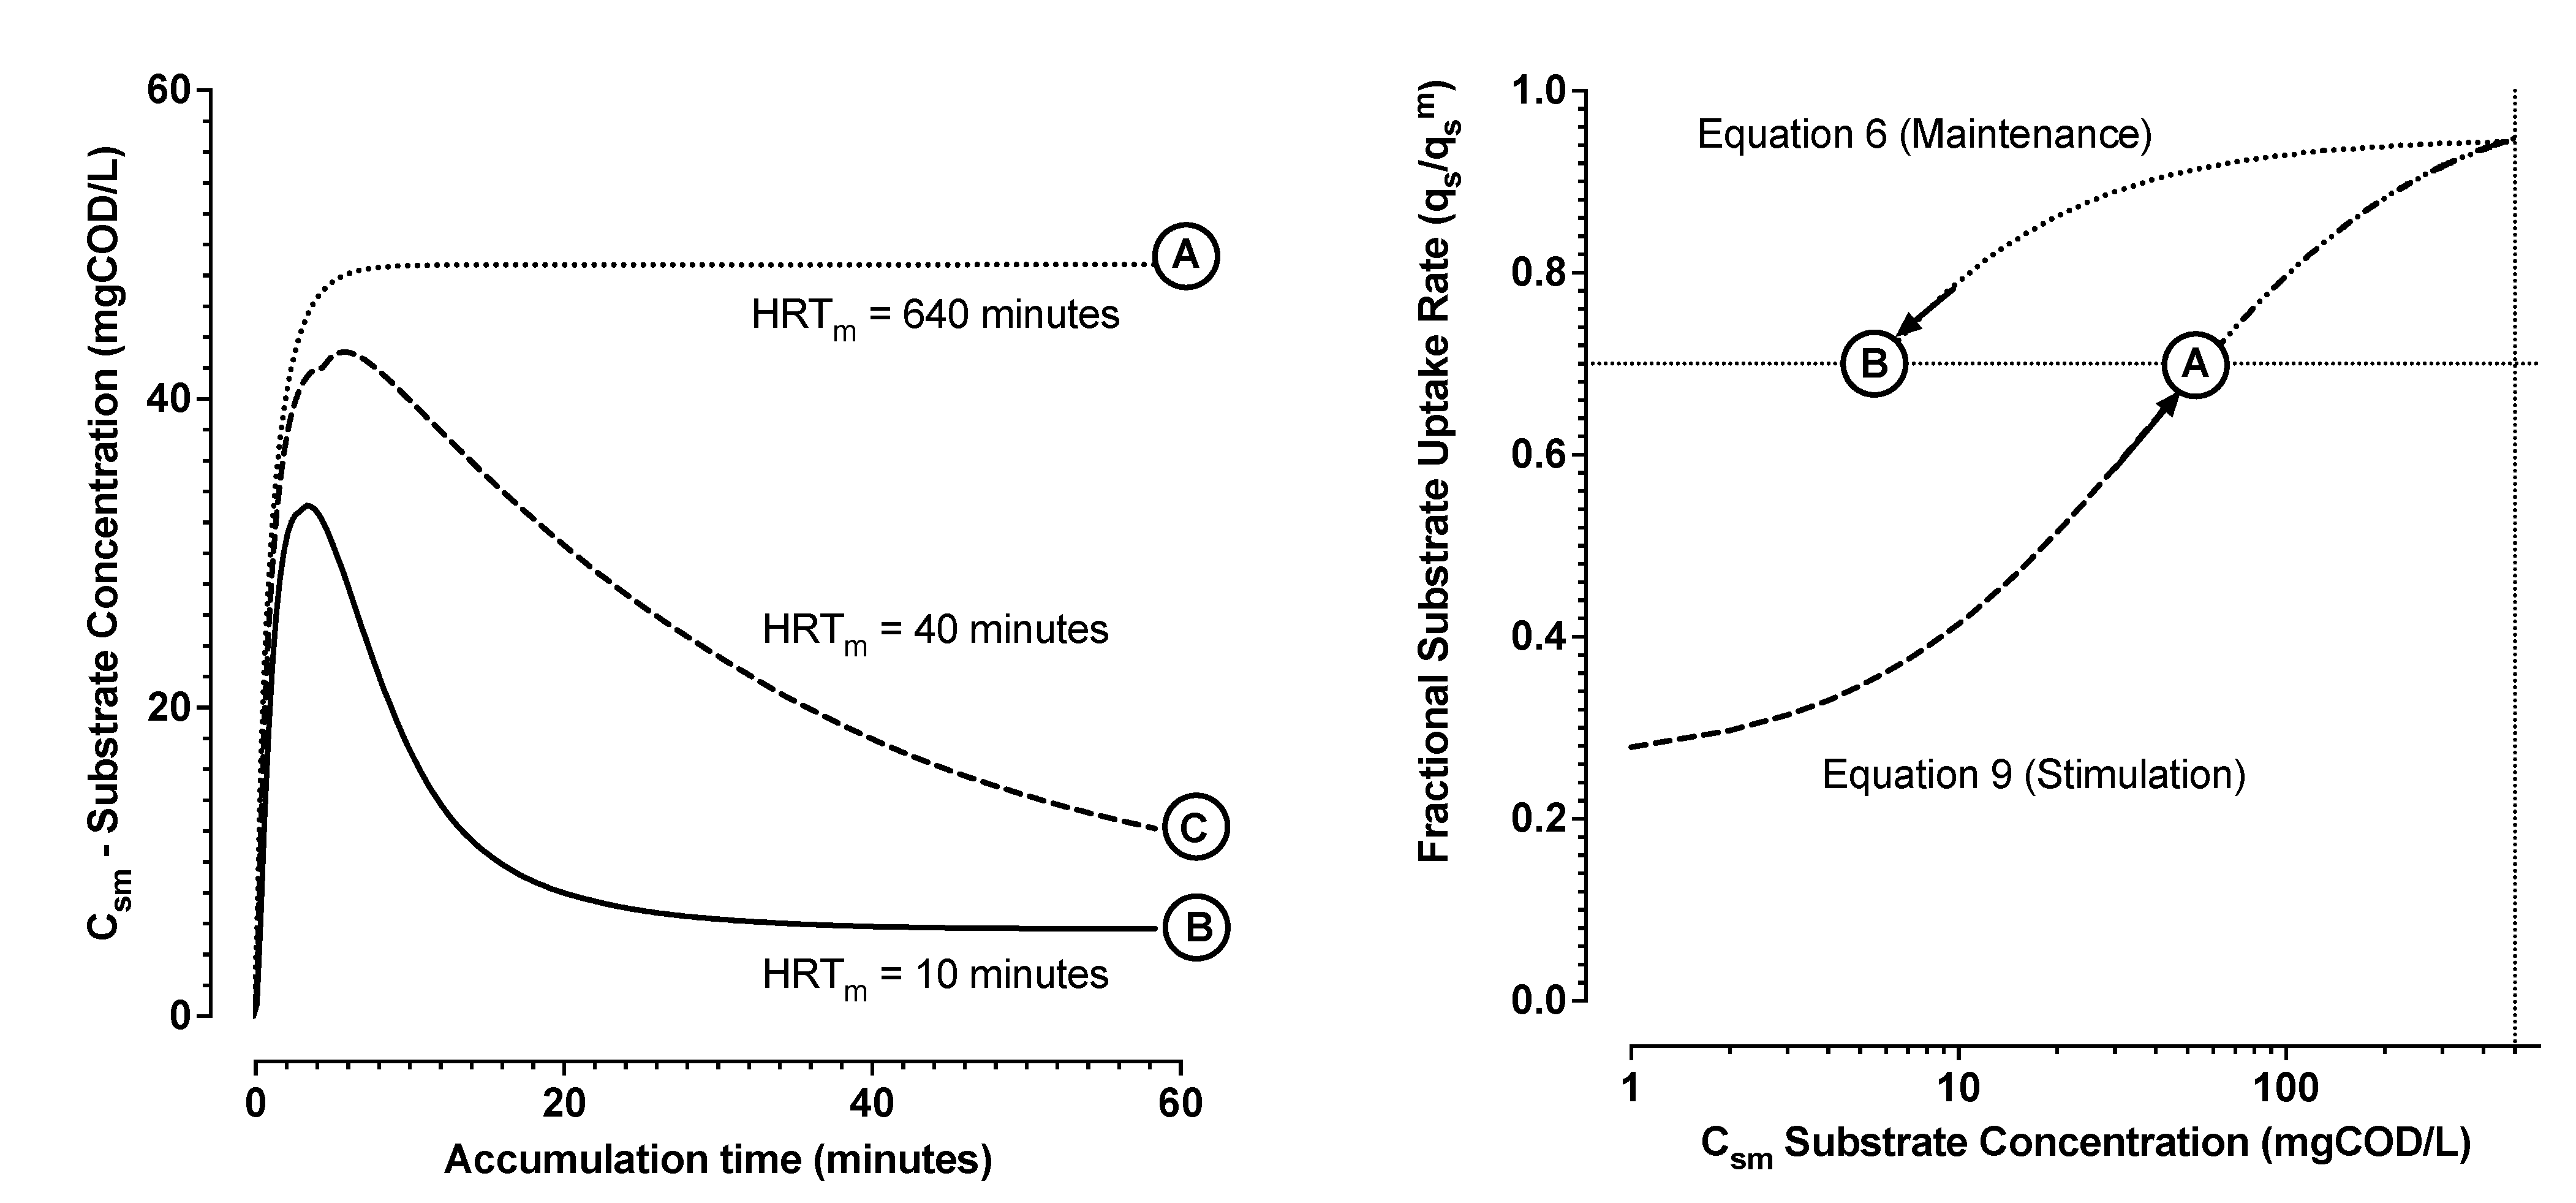
  • This hysteresis could be modelled with readily identifiable parameters using Monod equations describing the distinct upshift and downshift dynamics in substrate uptake rates as a function of substrate concentrations and as a function of time. It was found that the substrate concentration, required to stimulate a substrate uptake rate, was higher than the substrate concentration required to maintain an attained substrate uptake rate.
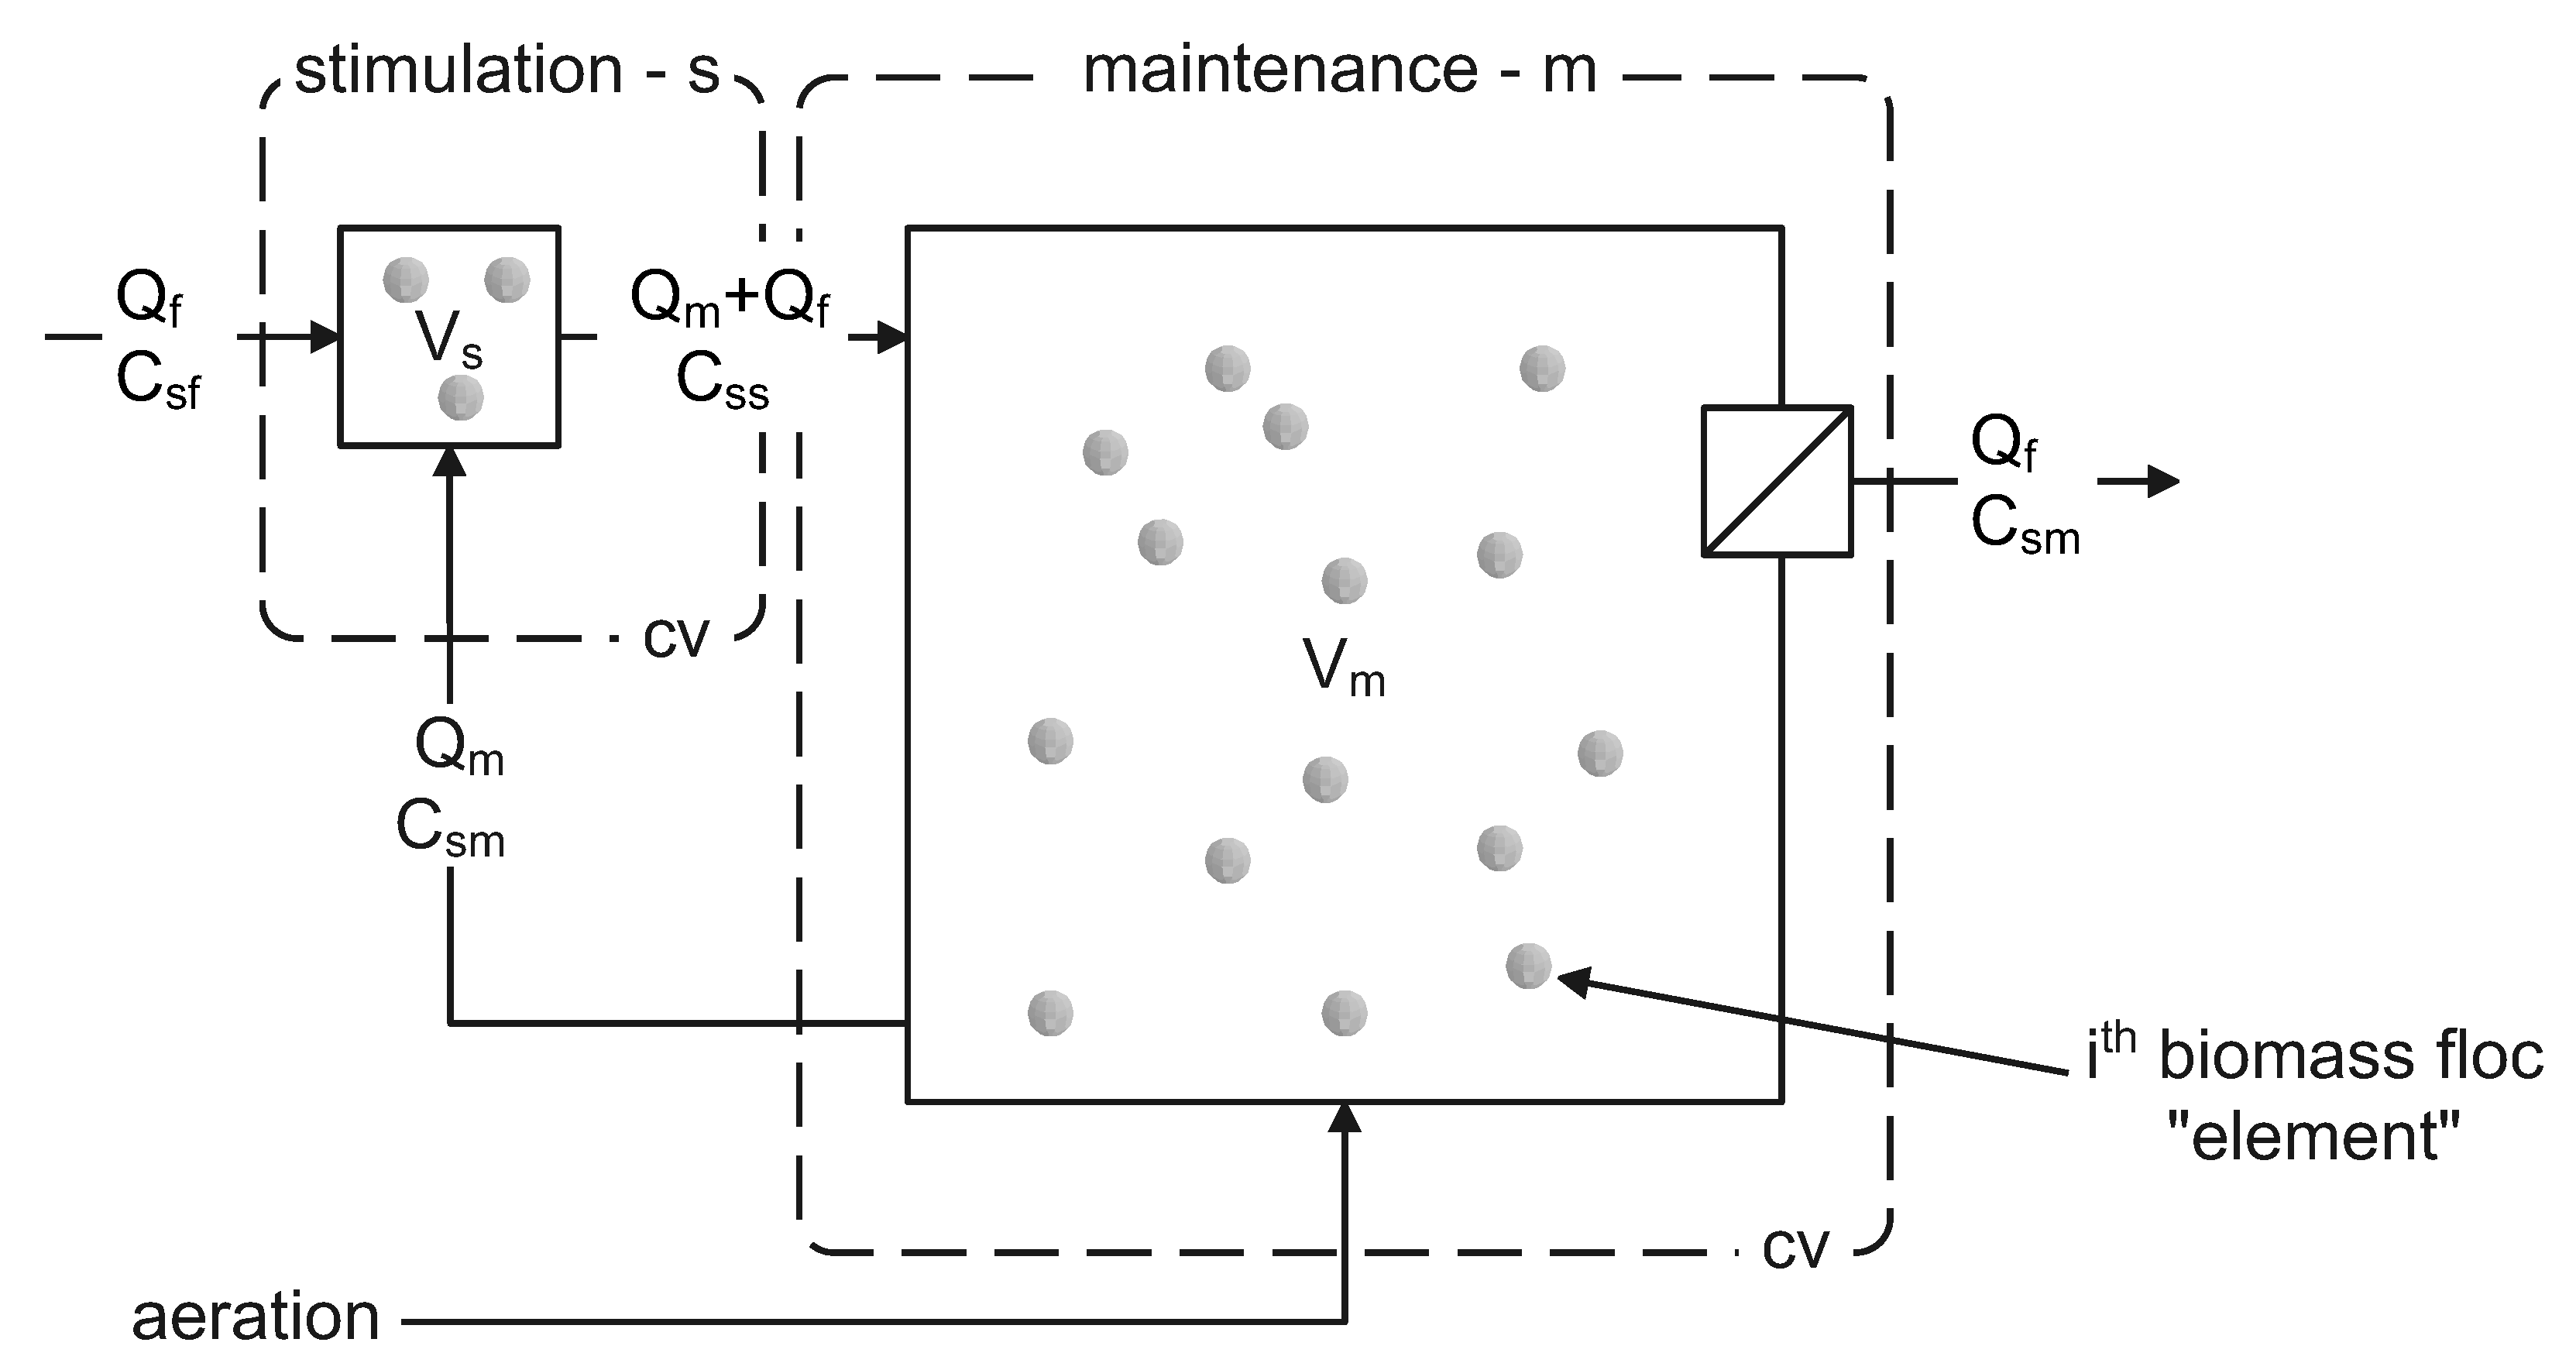
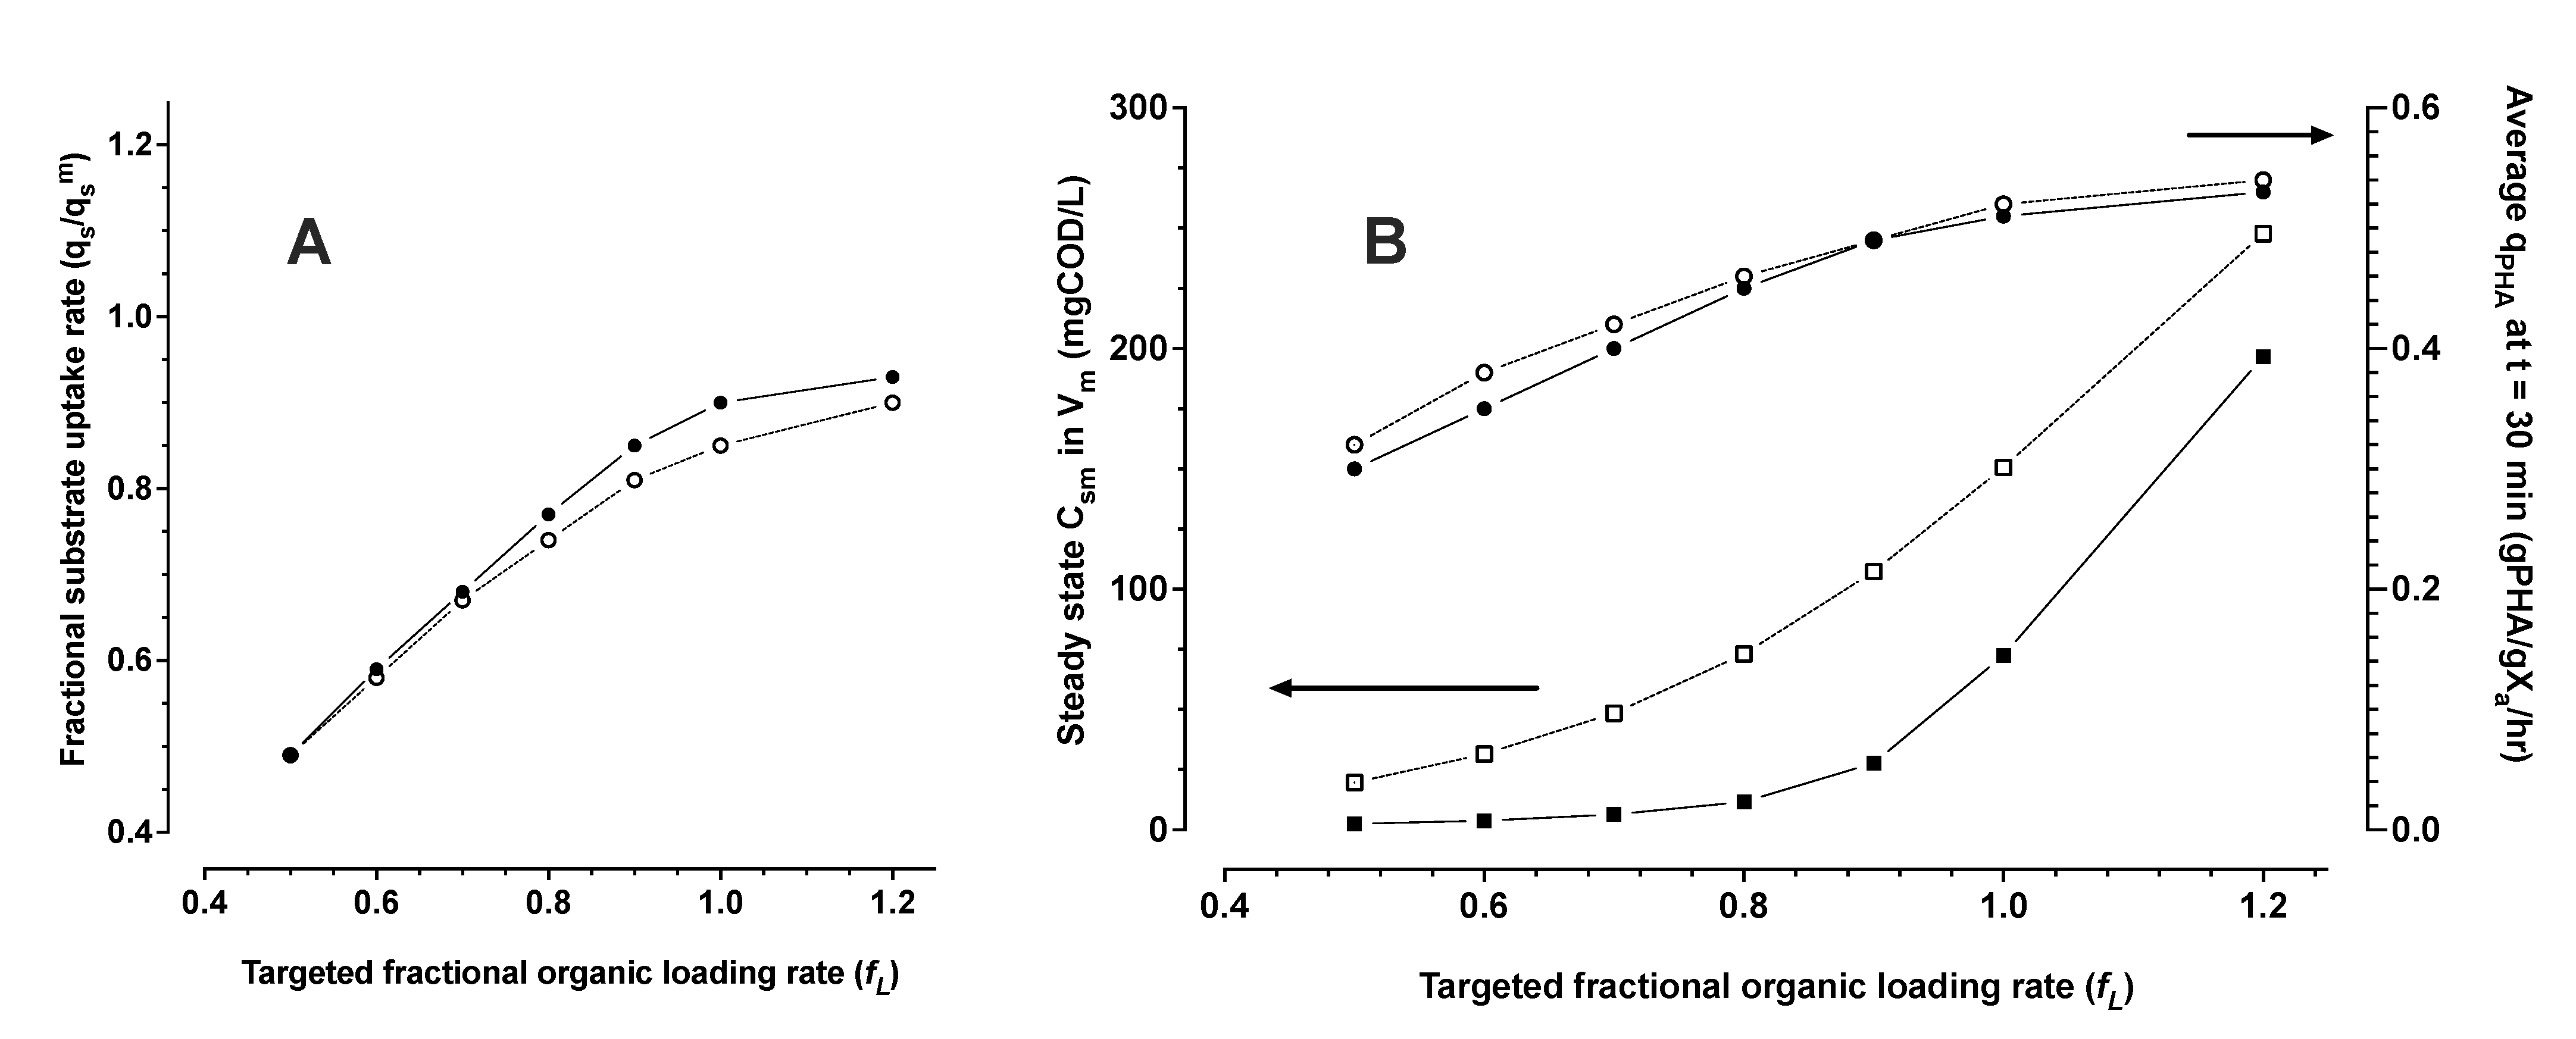
  • The system of equations in numerical simulations suggest for an opportunity to exploit this property of hysteresis in industrial scale bioprocesses for PHA production. MMC PHA production processes can be operated with continuous feeding strategies, even with low concentration feedstocks. The model simulations found that engineered stimulation zones can be applied in continuous flow PHA production bioprocesses as a strategy to reach maximum possible performance in volumetric productivity without sacrificing performance in substrate utilization efficiency.
Applying ideas and principles revealed by the model simulations is a future challenge with applications in practice. Methods for process monitoring are required in combination with feedback control to maintain optimal organic loading rates during the PHA accumulation process.

Author Contributions

Conceptualization, A.W.; methodology, A.W., L.L., F.V. and M.M.; software, A.W.; validation, A.W.; formal analysis, A.W.; investigation, A.W., L.L., F.V., M.V. and M.M.; resources L.L., F.V. and M.M.; data curation, A.W.; writing—original draft preparation, A.W.; writing—review and editing, A.W., M.V. and M.M.; visualization, A.W.; supervision, A.W. and M.M.; project administration, M.M.; funding acquisition, M.M. All authors have read and agreed to the published version of the manuscript.

Funding

Funding support that facilitated the availability of laboratory and pilot scale enrichment MMC for PHA production was due to the REsources from URban BIo-waSte”-RESURBIS (GA 7303499) project in the European Horizon2020 (Call CIRC-05-2016) program. Alan Werker was funded as a Visiting Professor at Sapienza University of Rome from 13 March 2018 to 15 June 2018.

Institutional Review Board Statement

Not applicable.

Informed Consent Statement

Not applicable.

Data Availability Statement

The data presented in this study are available on request from the corresponding author.

Acknowledgments

Alan Werker is grateful for the opportunity and kind support from Mauro Majone, and Sapienza University of Rome, to be a visiting Professor in the spring of 2018 enabling undertaking the practical experiments used for the presented study.

Conflicts of Interest

The authors declare no conflict of interest.

Abbreviations

The following abbreviations and symbols are used in this manuscript:
ATR-FTIRattenuated total reflection-FTIR
BODbiochemical oxygen demand
CODchemical oxygen demand
DOdissolved oxygen
FTIRFourier transform infrared spectroscopy
HRThydraulic retention time
MMCmixed microbial culture
PHApolyhydroxyalkanoate
PHBpolyhydroxybutyrate
SBRsequencing batch reactor
SRTsolids retention time
VFAvolatile fatty acid
VSSvolatile suspended solids
WWTPwastewater treatment plant
α PHA accumulation inhibition exponent
C o DO concentration (mgO2/L)
C o * apparent maximum DO (saturation) concentration (mgO2/L)
C s exogenous dissolved substrate concentration (mgCOD/L)
C s i initial or peak upshift C s (mgCOD/L)
1 f i q s i / q s m
k a aeration oxygen mass transfer coefficient (1/min)
k h Haldane substrate inhibition constant (mgCOD/L)
k i substrate induction constant (mgCOD/L)
k o Monod apparent affinity constant on DO concentration (mgO2/L)
k s Monod apparent downshift affinity constant on substrate concentration (mgCOD/L)
k u Monod apparent upshift affinity constant on peak substrate concentration (mgCOD/L)
Q o a DO supply rate due to aeration (mgO2/L/min)
Q o e DO consumption rate due to endogenous respiration (mgO2/L/min)
Q o p DO consumption rate due to stored PHA (mgO2/L/min)
Q o s DO consumption reate due to substrate consumption (mgO2/L/min)
q o p specific Q o p (mgO2/gVSS/min)
q o s specific Q o s (mgO2/gVSS/min)
q s r biomass resting specific substrate uptake rate (mgCOD/gVSS/min)
q s specific substrate uptake rate (mgCOD/gVSS/min)
q s e maximum extant specific substrate uptake rate (mgCOD/gVSS/min)
q s i initial maximum extant specific substrate uptake rate (mgCOD/gVSS/min)
q s m maximum specific substrate uptake rate (mgCOD/gVSS/min)
ttime (minutes)
q s r biomass maximum upshift in specific substrate uptake rate (mgCOD/gVSS/min)
X a active biomass concentration (gVSS/L)
X p PHA concentration (gCOD/L)
Y o s yield of oxygen consumed with substrate (mgO2/mgCOD)
C s f influent feedstock substrate concentration (mgCOD/L)
C s m maintenance volume substrate concentration (mgCOD/L)
C s s stimulation volume substrate concentration (mgCOD/L)
f L applied fraction of maximum possible organic loading rate
f P H A i ith-active biomass element specific PHA level ( x p / x a )
f P H A m active biomass maximum PHA level for x p / x a
H R T m HRT in V m due to Q m (min)
H R T s HRT in V s due to Q m (min)
n m number of biomass elements in V m
Q f substrate feed (and effluent) flow rate (L/min)
Q m recirculation flow rate (L/min)
q s i m ith-biomass element maximum specific substrate uptake rate (mgCOD/gVSS/min)
V m maintenance volume (L)
V s stimulation volume (L)
x a element specific active biomass (gVSS/element)
x p element specific PHA content (gPHA/element)

References

  1. Anderson, A.J.; Dawes, E.A. Occurrence, Metabolism, Metabolic Role, and Industrial Uses of Bacterial Polyhydroxyalkanoates. Microbiol. Rev. 1990, 54, 450–472. [Google Scholar] [CrossRef] [PubMed]
  2. Laycock, B.; Halley, P.; Pratt, S.; Werker, A.; Lant, P. The chemomechanical properties of microbial polyhydroxyalkanoates. Prog. Polym. Sci. 2014, 39, 397–442. [Google Scholar] [CrossRef]
  3. Hatti-Kaul, R.; Nilsson, L.J.; Zhang, B.; Rehnberg, N.; Lundmark, S. Designing Biobased Recyclable Polymers for Plastics. Trends Biotechnol. 2020, 38, 50–67. [Google Scholar] [CrossRef]
  4. Vandi, L.J.; Chan, C.M.; Werker, A.; Richardson, D.; Laycock, B.; Pratt, S. Wood-PHA Composites: Mapping Opportunities. Polymers 2018, 10, 751. [Google Scholar] [CrossRef] [PubMed] [Green Version]
  5. Nikodinovic-Runic, J.; Guzik, M.; Kenny, S.T.; Babu, R.; Werker, A.; O’Connor, K.E. Carbon-rich wastes as feedstocks for biodegradable polymer (polyhydroxyalkanoate) production using bacteria. Adv. Appl. Microbiol. 2013, 84, 139–200. [Google Scholar] [CrossRef]
  6. Saratale, R.G.; Cho, S.K.; Saratale, G.D.; Kadam, A.A.; Ghodake, G.S.; Kumar, M.; Bharagava, R.N.; Kumar, G.; Kim, D.S.; Mulla, S.I.; et al. A comprehensive overview and recent advances on polyhydroxyalkanoates (PHA) production using various organic waste streams. Bioresour. Technol. 2021, 325, 124685. [Google Scholar] [CrossRef]
  7. Marang, L.; van Loosdrecht, M.C.; Kleerebezem, R. Enrichment of PHA-producing bacteria under continuous substrate supply. New Biotechnol. 2018, 41, 55–61. [Google Scholar] [CrossRef]
  8. Stouten, G.R.; Hogendoorn, C.; Douwenga, S.; Kilias, E.S.; Muyzer, G.; Kleerebezem, R. Temperature as competitive strategy determining factor in pulse-fed aerobic bioreactors. ISME J. 2019, 13, 3112–3125. [Google Scholar] [CrossRef]
  9. Anterrieu, S.; Quadri, L.; Geurkink, B.; Dinkla, I.; Bengtsson, S.; Arcos-Hernandez, M.; Alexandersson, T.; Morgan-Sagastume, F.; Karlsson, A.; Hjort, M.; et al. Integration of biopolymer production with process water treatment at a sugar factory. New Biotechnol. 2014, 31, 308–323. [Google Scholar] [CrossRef]
  10. Bengtsson, S.; Karlsson, A.; Alexandersson, T.; Quadri, L.; Hjort, M.; Johansson, P.; Morgan-Sagastume, F.; Anterrieu, S.; Arcos-Hernandez, M.; Karabegovic, L.; et al. A process for polyhydroxyalkanoate (PHA) production from municipal wastewater treatment with biological carbon and nitrogen removal demonstrated at pilot-scale. New Biotechnol. 2017, 35, 42–53. [Google Scholar] [CrossRef]
  11. Estevez-Alonso, A.; Pei, R.; Loosdrecht, M.C.M.V.; Kleerebezem, R.; Werker, A. Scaling-up microbial community-based polyhydroxyalkanoate production: Status and challenges. Bioresour. Technol. 2021, 327, 124790. [Google Scholar] [CrossRef] [PubMed]
  12. Valentino, F.; Morgan-Sagastume, F.; Campanari, S.; Villano, M.; Werker, A.; Majone, M. Carbon recovery from wastewater through bioconversion into biodegradable polymers. New Biotechnol. 2017, 37, 9–23. [Google Scholar] [CrossRef] [PubMed] [Green Version]
  13. Lemos, P.C.; Serafim, L.S.; Reis, M.A.M. Synthesis of polyhydroxyalkanoates from different short-chain fatty acids by mixed cultures submitted to aerobic dynamic feeding. J. Biotechnol. 2006, 122, 226–238. [Google Scholar] [CrossRef] [PubMed]
  14. Bengtsson, S.; Pisco, A.R.; Johansson, P.; Lemos, P.C.; Reis, M.A. Molecular weight and thermal properties of polyhydroxyalkanoates produced from fermented sugar molasses by open mixed cultures. J. Biotechnol. 2010, 147, 172–179. [Google Scholar] [CrossRef]
  15. Mel, B.; Torres-giner, S.; Reis, M.A.M.; Silva, F.; Matos, M.; Cabedo, L. Blends of Poly(3-Hydroxybutyrate-co-3-Hydroxyvalerate) with Fruit Pulp Biowaste Derived Poly(3-Hydroxybutyrate-co-3-Hydroxyvalerate-co-3-Hydroxyhexanoate) for Organic Recycling Food Packaging. Polymers 2021, 13, 1155. [Google Scholar]
  16. Silva, F.; Matos, M.; Pereira, B.; Ralo, C.; Pequito, D.; Marques, N.; Carvalho, G.; Reis, M.A. An integrated process for mixed culture production of 3-hydroxyhexanoate-rich polyhydroxyalkanoates from fruit waste. Chem. Eng. J. 2022, 427, 131908. [Google Scholar] [CrossRef]
  17. Werker, A.; Bengtsson, S.; Johansson, P.; Magnusson, P.; Gustafsson, E.; Hjort, M.; Anterrieu, S.; Karabegovic, L.; Karlsson, A.; Morgan-Sagastume, F.; et al. Production Quality Control of Mixed Culture Poly(3-hydroxbutyrate-co-3-hydroxyvalerate) blends using full-scale municipal activated sludge and non-chlorinated solvent extraction. In The Handbook of Polyhydroxyalkanoates: Kinetics, Bioengineering, and Industrial Aspects, 1st ed.; Koller, M., Ed.; CRC Press: Boca Raton, FL, USA, 2020; pp. 329–386. [Google Scholar]
  18. Morgan-Sagastume, F.; Valentino, F.; Hjort, M.; Zanaroli, G.; Majone, M.; Werker, A. Acclimation Process for Enhancing Polyhydroxyalkanoate Accumulation in Activated-Sludge Biomass. Waste Biomass Valorization 2019, 10, 1065–1082. [Google Scholar] [CrossRef]
  19. Estévez-Alonso, Á.; van Loosdrecht, M.C.; Kleerebezem, R.; Werker, A. Simultaneous nitrification and denitrification in microbial community-based polyhydroxyalkanoate production. Bioresour. Technol. 2021, 337, 125420. [Google Scholar] [CrossRef]
  20. Grazia, G.D.; Quadri, L.; Majone, M.; Morgan-Sagastume, F.; Werker, A. Influence of temperature on mixed microbial culture polyhydroxyalkanoate production while treating a starch industry wastewater. J. Environ. Chem. Eng. 2017, 5, 5067–5075. [Google Scholar] [CrossRef] [Green Version]
  21. Koller, M. A review on established and emerging fermentation schemes for microbial production of polyhydroxyalkanoate (PHA) biopolyesters. Fermentation 2018, 4, 30. [Google Scholar] [CrossRef] [Green Version]
  22. Koller, M.; Braunegg, G. Potential and prospects of continuous polyhydroxyalkanoate (PHA) production. Bioengineering 2015, 2, 94–121. [Google Scholar] [CrossRef] [PubMed] [Green Version]
  23. Silva, F.C.; Serafim, L.S.; Nadais, H.; Arroja, L.; Capela, I. Acidogenic Fermentation towards Valorisation of Organic Waste Streams into Volatile Fatty Acids. Chem. Biochem. Eng. Q. 2013, 27, 467–476. [Google Scholar]
  24. Lagoa-Costa, B.; Kennes, C.; Veiga, M.C. Cheese whey fermentation into volatile fatty acids in an anaerobic sequencing batch reactor. Bioresour. Technol. 2020, 308, 123226. [Google Scholar] [CrossRef] [PubMed]
  25. Valentino, F.; Karabegovic, L.; Majone, M.; Morgan-Sagastume, F.; Werker, A. Polyhydroxyalkanoate (PHA) storage within a mixed-culture biomass with simultaneous growth as a function of accumulation substrate nitrogen and phosphorus levels. Water Res. 2015, 77, 49–63. [Google Scholar] [CrossRef] [PubMed]
  26. Bermúdez-Penabad, N.; Kennes, C.; Veiga, M.C. Anaerobic digestion of tuna waste for the production of volatile fatty acids. Waste Manag. 2017, 68, 96–102. [Google Scholar] [CrossRef]
  27. Atasoy, M.; Owusu-Agyeman, I.; Plaza, E.; Cetecioglu, Z. Bio-based volatile fatty acid production and recovery from waste streams: Current status and future challenges. Bioresour. Technol. 2018, 268, 773–786. [Google Scholar] [CrossRef] [PubMed]
  28. Jones, R.J.; Fernández-Feito, R.; Massanet-Nicolau, J.; Dinsdale, R.; Guwy, A. Continuous recovery and enhanced yields of volatile fatty acids from a continually-fed 100 L food waste bioreactor by filtration and electrodialysis. Waste Manag. 2021, 122, 81–88. [Google Scholar] [CrossRef]
  29. Burniol-Figols, A.; Pinelo, M.; Skiadas, I.V.; Gavala, H.N. Enhancing polyhydroxyalkanoate productivity with cell-retention membrane bioreactors. Biochem. Eng. J. 2020, 161, 107687. [Google Scholar] [CrossRef]
  30. Tamis, J.; Marang, L.; Jiang, Y.; van Loosdrecht, M.C.M.; Kleerebezem, R. Modeling PHA-producing microbial enrichment cultures-towards a generalized model with predictive power. New Biotechnol. 2014, 31, 324–334. [Google Scholar] [CrossRef]
  31. Werker, A.; Bengtsson, S.; Karlsson, A. Method for Accumulation of Polyhydroxyalkanoates in Biomass with On-Line Monitoring for Feed Rate Control and Process Termination. U.S. Patent US8748138B2, 10 June 2014. [Google Scholar]
  32. Lorini, L.; di Re, F.; Majone, M.; Valentino, F. High rate selection of PHA accumulating mixed cultures in sequencing batch reactors with uncoupled carbon and nitrogen feeding. New Biotechnol. 2020, 56, 140–148. [Google Scholar] [CrossRef]
  33. Valentino, F.; Moretto, G.; Lorini, L.; Bolzonella, D.; Pavan, P.; Majone, M. Pilot-Scale Polyhydroxyalkanoate Production from Combined Treatment of Organic Fraction of Municipal Solid Waste and Sewage Sludge. Ind. Eng. Chem. Res. 2019, 58, 12149–12158. [Google Scholar] [CrossRef]
  34. APHA. Standard Methods for the Examination of Water and Wastewater; American Public Health Association: Washington, DC, USA, 1998. [Google Scholar]
  35. Chan, C.M.; Johansson, P.; Magnusson, P.; Vandi, L.J.L.J.; Arcos-Hernandez, M.; Halley, P.; Laycock, B.; Pratt, S.; Werker, A. Mixed culture polyhydroxyalkanoate-rich biomass assessment and quality control using thermogravimetric measurement methods. Polym. Degrad. Stab. 2017, 144, 110–120. [Google Scholar] [CrossRef] [Green Version]
  36. Savitzky, A.; Golay, M.J. Smoothing and Differentiation of Data by Simplified Least Squares Procedures. Anal. Chem. 1964, 36, 1627–1639. [Google Scholar] [CrossRef]
  37. Spanjers, H.; Olsson, G. Modelling of the dissolved oxygen probe response in the improvement of the performance of a continuous respiration meter. Water Res. 1992, 26, 945–954. [Google Scholar] [CrossRef]
  38. Krishna, C.; Loosdrecht, M.C.V. Substrate flux into storage and growth in relation to activated sludge modeling. Water Res. 1999, 33, 3149–3161. [Google Scholar] [CrossRef]
  39. Panikov, N.S. Microbial Growth Kinetics; Chapman & Hall: London, UK, 1995. [Google Scholar]
  40. Johnson, K.; Kleerebezem, R.; van Loosdrecht, M.C. Model-based data evaluation of polyhydroxybutyrate producing mixed microbial cultures in aerobic sequencing batch and fed-batch reactors. Biotechnol. Bioeng. 2009, 104, 50–67. [Google Scholar] [CrossRef]
  41. Arcos-Hernandez, M.V.; Gurieff, N.; Pratt, S.; Magnusson, P.; Werker, A.; Vargas, A.; Lant, P. Rapid quantification of intracellular PHA using infrared spectroscopy: An application in mixed cultures. J. Biotechnol. 2010, 150, 372–379. [Google Scholar] [CrossRef]
  42. Beun, J.J.; Dircks, K.; Loosdrecht, M.C.V.; Heijnen, J.J. Poly-beta-hydroxybutyrate metabolism in dynamically fed mixed microbial cultures. Water Res. 2002, 36, 1167–1180. [Google Scholar] [CrossRef]
  43. van Aalast-van Leeuwen, M.A.; Pot, M.A.; van Loosdrecht, M.C.; Heijnen, J.J. Kinetic Modeling of Poly (beta-hydroxybutyrate) Production and Consumption by Paracoccus pantotrophus under Dynamic Substrate Supply. Biotechnol. Bioeng. 1997, 55, 773–782. [Google Scholar] [CrossRef]
  44. Jolkver, E.; Emer, D.; Ballan, S.; Krämer, R.; Eikmanns, B.J.; Marin, K. Identification and characterization of a bacterial transport system for the uptake of pyruvate, propionate, and acetate in Corynebacterium glutamicum. J. Bacteriol. 2009, 191, 940–948. [Google Scholar] [CrossRef] [Green Version]
  45. Gurieff, N. Production of Biodegradable Polyhydroxyalkanoate Polymers Using Advanced Biological Wastewater Treatment Process Technology; The University of Queensland: Brisbane, Australia, 2007. [Google Scholar]
  46. Serafim, L.S.; Lemos, P.C.; Oliveira, R.; Reis, M.A. Optimization of polyhydroxybutyrate production by mixed cultures submitted to aerobic dynamic feeding conditions. Biotechnol. Bioeng. 2004, 87, 145–160. [Google Scholar] [CrossRef] [PubMed]
  47. Moretto, G.; Russo, I.; Bolzonella, D.; Pavan, P.; Majone, M.; Valentino, F. An urban biorefinery for food waste and biological sludge conversion into polyhydroxyalkanoates and biogas. Water Res. 2020, 170, 115371. [Google Scholar] [CrossRef] [PubMed]
  48. Tamis, J.; Lužkov, K.; Jiang, Y.; van Loosdrecht, M.C.M.; Kleerebezem, R. Enrichment of Plasticicumulans acidivorans at pilot-scale for PHA production on industrial wastewater. J. Biotechnol. 2014, 192, 161–169. [Google Scholar] [CrossRef] [PubMed]
  49. Morgan-Sagastume, F.; Bengtsson, S.; Grazia, G.D.; Alexandersson, T.; Quadri, L.; Johansson, P.; Magnusson, P.; Werker, A. Mixed-culture polyhydroxyalkanoate (PHA) production integrated into a food-industry effluent biological treatment: A pilot-scale evaluation. J. Environ. Chem. Eng. 2020, 8, 104469. [Google Scholar] [CrossRef]
  50. Albuquerque, M.G.; Concas, S.; Bengtsson, S.; Reis, M.A. Mixed culture polyhydroxyalkanoates production from sugar molasses: The use of a 2-stage CSTR system for culture selection. Bioresour. Technol. 2010, 101, 7112–7122. [Google Scholar] [CrossRef]
  51. Marang, L.; van Loosdrecht, M.C.M.; Kleerebezem, R. Modeling the competition between PHA-producing and non-PHA-producing bacteria in feast-famine SBR and staged CSTR systems. Biotechnol. Bioeng. 2015, 112, 2475–2484. [Google Scholar] [CrossRef]
  52. Mulders, M.; Tamis, J.; Stouten, G.R.; Kleerebezem, R. Simultaneous growth and poly(3-hydroxybutyrate) (PHB) accumulation in a Plasticicumulans acidivorans dominated enrichment culture. J. Biotechnol. 2020, 8, 100027. [Google Scholar] [CrossRef]
  53. Haimi, H.; Mulas, M.; Corona, F.; Vahala, R. Data-derived soft-sensors for biological wastewater treatment plants: An overview. Environ. Model. Softw. 2013, 47, 88–107. [Google Scholar] [CrossRef]
Figure 1. Model system for PHA accumulation comprising 2 process zones as completely mixed biomass stimulation and maintenance control volumes (cv), V s and V m respectively.
Bioengineering 09 00125 g001
Figure 2. Background corrected and vector normalized FTIR spectra. Spectra are shown for the laboratory scale SBR dried biomass directly after biomass harvesting at the end of feast (A). Low PHA content was confirmed for laboratory and pilot famine biomass before start of respiration experiments (B). For the laboratory biomass, average spectra (solid line) are shown with standard deviation (dashed line) from biomass samples taken over the course of 10 distinct experiments carried out over 3 months. Significant or low PHA content is qualitatively represented by a characteristic large or small C=O absorbance peak (≈1735 cm 1 ). See [41] for further explanation.
Bioengineering 09 00125 g002
Figure 3. Trends of measured (∘) and modelled (solid line) dissolved oxygen concentration, as a function of time for Csi levels starting (t = 0) at 381 (A) and 15 (B) mgCOD/L. Modelled trends of COD concentration Cs (dashed line) from the mass balance are shown. These batch respiration experiments were conducted without active aeration using laboratory scale SBR enrichment biomass.
Bioengineering 09 00125 g003
Figure 4. Typical example for trends of measured (∘) and modelled (—) dissolved oxygen (A) with Zone 1 (pre-aeration), Zone 2 (substrate consumption), and Zone 3 (re-aeration). From estimated oxygen mass transfer rate (ka, Zone 3), and endogenous respiration Qoe (Zone 1), respiration rates on substrate and polymer were calculated (B). Average yield Yos was given by estimated oxygen demand (BODs) for added substrate removal (C). Trends of substrate uptake rate could thereby be estimated from the mass balance (D).
Bioengineering 09 00125 g004
Figure 5. Figures show typical results for the laboratory (A) and pilot (B) scale MMCs experiments with respective trends of interpreted specific substrate uptake rate (qs) as a function of Csi, and with substrate concentration changing implicitly in time. Points (•) correspond to the rates and concentrations derived from DO concentration data and the trend lines are the curves fit by least squares regression analysis to Equation (6). Results of estimated initial (∘, q s i ) and maximum (•, q s m ) specific substrate uptake rates for laboratory (C) and pilot (D) scale MMCs are shown as a function of initial acetic acid substrate concentrations (Csi). The trend of maximum substrate uptake rate follows Equation (9) by least squares regression analysis. The initial specific substrate uptake rate decreased linearly with increasing initial acetic acid concentration.
Bioengineering 09 00125 g005
Figure 6. Initial pH changes are shown due to specific acid addition with the substrate (A). Corresponding to this acetic acid and/or acetate addition, the linear trend of influence (shown on a log scale) for the induction (lag phase) constant (ki) is similarly shown as a function of the specific acid addition (B). An example for the dynamics of substrate uptake rate during COD consumption as an implicit function of time for addition of acetic acid or acetate is given (C) with information of the measured trend in pH (D) with respect to the initial pH level (pHi) during the same time.
Bioengineering 09 00125 g006
Figure 7. Estimated levels of biomass specific respiration rate after substrate consumption with respect to the estimated levels of PHA calculated from added substrate and yield of oxygen on substrate assuming no active biomass growth. The trend line is the least squares regression estimate for combined laboratory (•) and pilot (∘) data.
Bioengineering 09 00125 g007
Figure 8. Simulation results for a fractional substrate loading rate of f L equal to 0.7 while varying the recirculation flow rate for higher and lower HRTm levels. Higher HRTm levels approach conditions of effective substrate feed directly into Vm (A). For lower HRTm, influence of Css uptake rate stimulation in Vs enables for higher uptake rates maintained at lower Csm concentration (B). Moderate HRTm levels require longer times for all the biomass to be exposed to Css in Vs (C).
Bioengineering 09 00125 g008
Figure 9. The targeted fraction of the system maximum possible substrate uptake rate (fL—see Equation (13)), versus the actual fraction of maximum uptake rate achieved in the process (A). Maintenance volume (Vm) steady state substrate concentration Csm (squares), and average specific PHA production rates after 30 min accumulation (circles) as a function of the targeted fraction of the system maximum possible substrate uptake rate (B). Closed and open symbols are for HRTm of 5 and 250 min, respectively.
Bioengineering 09 00125 g009
Table 1. Characterization of laboratory and pilot scale SBR MMC enrichment biomass with data from respiration experiments with oxygen and chemical oxygen demand mass balance modelling when active constant aeration was applied. Values in the brackets give the number of measurements or experiments used in estimation of means with standard deviations.
ParameterUnitsLaboratory ScalePilot Scale
Temperature°C24.6 ± 0.3 (24)23.8 ± 0.6 (17)
pH (t = 0)-9.2 ± 0.1 (24)9.0 ± 0.1 (17)
XagVSS/L1.0 ± 0.1 (11)1.71 ± 0.04 (2)
ka1/min1.11 ± 0.14 (24)0.60 ± 0.15 (17)
qoemgO2/gVSS/min0.64 ± 0.12 (24)0.25 ± 0.07 (17)
YosgO2/gCOD0.26 ± 0.02 (24)0.23 ± 0.05 (17)
ksmgCOD/L2.0 ± 0.7 (24)1.8 ± 0.4 (17)
kumgCOD/L38 ± 7 (24)20 ± 2 (17)
q s r mgCOD/gVSS/min7.4 ± 0.1 (24)2.5 ± 0.2 (17)
q s u mgCOD/gVSS/min21.1 ± 1.1 (24)6.8 ± 0.2 (17)
Publisher’s Note: MDPI stays neutral with regard to jurisdictional claims in published maps and institutional affiliations.

