Influence of Various Drying Conditions on Phytochemical Compounds and Antioxidant Activity of Carrot Peel


1
Department of Food Technology, Faculty of Food Technology, Nha Trang University, No. 2 Nguyen Dinh Chieu, Nha Trang, Khanh Hoa 57000, Vietnam
2
Department of Agriculture and Rural Development, Bac Lieu 97000, Vietnam
*
Author to whom correspondence should be addressed.
Beverages 2018, 4(4), 80; https://0-doi-org.brum.beds.ac.uk/10.3390/beverages4040080
Submission received: 20 September 2018
/
Revised: 26 October 2018
/
Accepted: 30 October 2018
/
Published: 1 November 2018
(This article belongs to the Special Issue Valorization of Beverage Industry By-products)
Abstract
:(1) Background: Drying is an important process in the research of bioactive compounds. The aim of this study was to identify an optimal condition to dry carrot peel. (2) Methods: In this study, various drying conditions including hot-air (50 °C and 100 °C), vacuum (50 °C and 100 °C), microwave (600 W and 1200 W) and freeze dying (−45 °C) were applied, and the phytochemical yield and antioxidant activity of carrot peel were then assessed. (3) Results: The results showed that the highest amount of phytochemical compounds was achieved by microwave drying at 1200 W, followed by microwave drying at 600 W and freeze drying at −45 °C. In contrast, hot-air drying resulted in the lowest level of phytochemical compounds. Regarding the antioxidant activity of carrot peel, microwave drying at 1200 W was an optimal condition as it possessed the best antioxidant activity whereas hot-air, vacuum and freeze drying were not effective methods for retaining antioxidant activity. (4) Conclusions: Based on the results obtained from this study, microwave drying at 1200 W is recommended to dry carrot peel for potential application in the nutraceutical, beverage and/or functional food industries.
1. Introduction
Drying is a crucial step to prepare dried samples for further investigation and application. This process has a great impact on the retention of bioactive compounds and production costs. Particularly, drying temperature directly influences the changes in the physicochemical properties of foods. Current drying methods include: (1) conventional drying, for example hot-air/oven drying [1,2,3,4,5,6], conventional/low temperature-air drying [6,7,8], vacuum/vacuum oven drying [5,6,9,10,11], sun drying [6,9,12], under shade drying [9,13], heat pump-dehumidified air drying [2], low-pressure superheated steam drying [1], and freeze drying [2,5,9]; (2) radiation drying such as microwave drying [2,6,12,14,15,16], infrared drying [3,4,6]; and (3) combined drying or novel drying, for instance, microwave-assisted hot-air drying [3], infrared-combined hot air drying [1,4], hot air-assisted radio frequency drying [3], vacuum-microwave drying [10,17], combined infrared-vacuum drying [18], and combined low-pressure superheated steam drying and far-infrared radiation [19]. Among these drying techniques, conventional drying is simpler, has lower production costs, but is less effective (except for freeze drying), while radiation and novel drying are effective but are more complicated, and have higher production costs. Recently, microwave drying was found to be the best method for drying the Paramignya trimera root and banana peel, with the lowest energy consumption [15,16].
The biological oxidation process leads to the formation of active oxygen and free radicals species, resulting in oxidative stress-originated diseases, such as cardiovascular, diabetic and neurodegenerative diseases, and cancer [20,21]. To prevent the radical chain reactions of oxidation or to inhibit the initiation and propagation step, leading to the termination of the reaction and delaying the oxidation process, natural antioxidants have been exploited and widely used [22].
Carrot is a popular root vegetable, which contains a significant amount of carotenoids, anthocyanidins and saponins [23,24]. These compounds have been linked to the prevention of serious diseases by improving the immunology system. A major by-product obtained during the processing of carrot root is carrot peel, which is considered as a huge source of waste (approximately 5.28 million tonnes per year) [24] that increases the risk of pollution to the environment. Hence, there is potential to recycle carrot peel from the carrot processing industry as a rich source of bioactive compounds and pigments [25].
To date, there has been few reports on the optimal drying condition for the preparation of dried samples from carrot peel for further investigation and application. With this in mind, this study aimed to investigate the influence of various drying conditions on the phytochemical compounds and antioxidant activity of carrot peel for potential application in the nutraceutical, beverage and/or functional food industries.
2. Materials and Methods
2.1. Materials and Chemicals
Ten kg of carrot roots (Scarlet Nantes) were purchased from a post-harvest market in Westfield, Tuggerah, Central Coast, New South Wales, Australia (March 2016) and immediately transported to the laboratories at the University of Newcastle, Ourimbah Campus, New South Wales, Australia. Carrot peel was then separated from carrot root using a manual peeler and stored at −20 °C in the freezer until required for further investigation.
The chemicals used in this study were analytical grade and include: Folin-Ciocalteu reagent, trolox, neocuproine, 2,4,6-tris(2-pyridyl)-s-triazine (TPTZ), iron (III) chloride, 2,2′-Azino-bis(3-ethylbenzothiazoline-6-sulphonic acid) (ABTS), and 2,2-diphenyl-1-picryl-hydrazil (DPPH) were purchased from Sigma-Aldrich Pty Ltd. (Castle Hill, Sydney, Australia). Sulfuric acid and hydrochloric acid were obtained from Ajax Finechemicals (Sydney, NSW, Australia). Acetic acid was purchased from BDH Laboratory Supplies (Poole, UK). Sodium acetate trihydrate was obtained from Government Stores Department (Sydney, NSW, Australia). Ammonium acetate was purchased from BDH Chemicals (Boronia, Victoria, Australia). Aluminium chloride was obtained from Acros (Morris Plains, NJ, USA). Copper (II) chloride was purchased from Standard Laboratories (Maribyrnong, Victoria, Australia). Vanillin, potassium persulfate, sodium nitrite, methanol, and acetonitrile were obtained from Merck (Darmstadt, Germany). Sodium hydroxide was purchased from Ajax Chemicals (Sydney, NSW, Australia). Sodium carbonate anhydrous was obtained from Chem-supply (Gillman, South Australia).
2.2. Preparation of Dried Carrot Peel
Fresh carrot peel was dried to a constant weight at various drying conditions based on the previously described methods in [6,15] with some modifications as follows.
Firstly, 50 g of fresh sample was weighed before drying for each experiment.
Hot-air Drying: Drying was performed in a hot-air oven (Anax Pty Ltd., Sydney, Australia) at 50 °C (HAD50) and 100 °C (HAD100).
Vacuum Drying: Fresh samples were dried in a vacuum oven (Thermoline, Sydney, New South Wales, Australia) at 50 °C (VCD50) and 100 °C (VCD100).
Microwave Drying: Fresh samples were placed in the middle of a microwave oven (Sharp Carousel, Sharp Corporation, Bangkok, Thailand) and dried at power levels of 600 W (MWD600) and 1200 W (MWD1200).
Freeze Drying: Drying was conducted in a freeze drier (Rietschle Thomas Australia Pty Ltd., Seven Hills, NSW, Australia) at −45 °C and 83 kPa.
After drying, the samples were reweighed to determine their drying yield as shown in Equation (1) [15]:
Here, DY (g dried sample/100 g fresh sample) is drying yield, DS (g) is the weight of the dried sample after drying, and FS (g) is the weight of the fresh sample before drying.
The drying time was recorded for each experiment using a timer. The energy consumption of the various drying methods were estimated in Equation (2) [26] as follows:
Here, Wi is the consumed electrical energy of the drying method (i) (kWh), Pi is the electrical power supplied in the drying method (i) (kW), and ti is the time taken for the drying method (i) (h).
The initial moisture of the fresh sample and the residual moisture of dried samples following drying were determined according to the AOAC official methods of analysis [27] using the hot-air drying method at 100 °C overnight. The dried samples were then ground to a fine powder using an electric blender (Hamilton Beach Brands, Inc., Shenzhen, China), screened through a stainless-steel mesh with a particle size of ≤1.4 mm (Endecotts, London, UK), then packed in the sealed polyamide bags, and stored at −20 °C in the freezer until used for further investigation.
2.3. Preparation of Methanol Extract from Dried Carrot Peel
The methanol extracts of the dried carrot peel were prepared based on the previously reported method in [15,24]. 0.2 g of dried sample was extracted with 20 mL of methanol at room temperature (20 ± 1 °C) for 30 min, then the microwave-assisted extraction method was applied for 60 min using a microwave oven (Sharp Carousel; Sharp Corporation, Bangkok, Thailand) at power of 360 W and the irradiation time was 5 s per 2 min period (total irradiation time of 150 s).
After extraction, carrot peel extracts were immediately cooled down to room temperature using an ice water bath and then filtered to obtain the extracts for analysis of their bioactive compounds and antioxidant activity. To determine the extraction yield, 2 mL of extract was dried in a hot-air oven (Anax Pty Ltd., Sydney, Australia) at 90 °C for 4 h to a constant weight. The extraction yield is shown in Equation (3) [15]:
Here, EY (g dried extract/100 g dried sample) is the extraction yield, DE (g) is the weight of the dried extract after extraction, and DS (g) is the weight of the dried sample before extraction.
2.4. Determination of Phytochemical Compounds of Carrot Peel Extracts
2.4.1. Total Phenolic Content (TPC)
The TPC of carrot peel extracts was determined using the Folin-Ciocalteu reagent based on the previously described method in [15,28]. 0.5 mL of the extract was thoroughly mixed with 2.5 mL of 10% (v/v) Folin-Ciocalteu reagent in distilled water. The mixture was kept for 6 min, then 2 mL of 7.5% (w/v) Na2CO3 solution was added to the mixture and incubated for 1 h in the dark at room temperature. The absorbance of the mixture was measured at 765 nm using a UV-VIS spectrophotometer (Cary 50 Bio, Mulgrave, VIC, Australia). Methanol and gallic acid were used as a control and standard. TPC was expressed as mg of gallic acid equivalents (GAE)/g dried sample.
2.4.2. Total Flavonoid Content (TFC)
The TFC of carrot peel extracts was estimated using the formerly established method in [15,28]. 0.5 mL of extract was thoroughly mixed with 2 mL of distilled water and 0.15 mL of 5% (w/v) NaNO2 solution and left for 6 min. 0.15 mL of 10% (w/v) AlCl3 solution was then added and kept for a further 6 min. Finally, 2 mL of 4% (w/v) NaOH solution and 0.7 mL of distilled water were added and incubated for 15 min in the dark at room temperature. The absorbance of the mixture was measured at 510 nm using a UV-VIS spectrophotometer. Methanol and rutin were used as a control and standard, respectively. TFC was expressed as mg of rutin equivalents (RE)/g dried sample.
2.4.3. Proanthocyanidin Content (PC)
The PC of carrot peel extracts was determined using the previously described method in [15,28]. 0.5 mL of extract was thoroughly mixed with 3 mL of 4% (w/v) vanillin solution, then 1.5 mL of concentrated HCl (37% w/v) was added and the mixture was incubated for 15 min in the dark at room temperature. The absorbance of the mixture was measured at 500 nm using a UV-VIS spectrophotometer. Methanol and catechin were used as a control and standard, respectively. PC was expressed as mg of catechin equivalents (CE)/g dried sample.
2.4.4. Saponin Content (SC)
The SC of carrot peel extracts was determined according to the formerly described method in [15,28]. 0.5 mL of the extract was thoroughly mixed with 0.5 mL of 8% (w/v) vanillin solution, then 5 mL of 72% (v/v) H2SO4 solution was added to the mixture, incubated at 70 °C for 10 min in the dark at room temperature and rapidly cooled in an ice water bath to room temperature. The absorbance of the mixture was measured at 560 nm using a UV-VIS spectrophotometer. Methanol and escin were used as a control and standard, respectively. SC was expressed as mg of escin equivalents (EE)/g dried sample.
2.4.5. Identification of Phytochemical Compounds in the Dried Carrot Peel
Phytochemical compounds remaining in the dried carrot peel extracts were identified using an HPLC system (Shimadzu, Tokyo, Japan) based on the previously established method in [24]. The external standard solutions were prepared by dissolving standard compounds in methanol at 200 µg/mL, and 200 µL of each standard solution was then taken to make a mixed standard solution. The extracts and standard solutions were filtered through 0.45 μm nylon membranes (Phenex syringe filters) and 20 μL of extracts or standard solutions were then individually injected by an auto injector (SIL-10AV VP, Kyoto, Japan) onto a column (Synergi 4u Polar-RP 80A (250 × 4.6 mm 4 μm), which was maintained at 35 °C by a column oven (CTO-10A VP, Kyoto, Japan). The mobile phase included 0.2% orthophosphoric acid in distilled water (A) and 100% acetonitrile (B). Flow rate was set at 1 mL/min with the gradient as follows: 0–5 min, 0% B; 5–20 min, 20% B; 20–30 min, 30% B; 30–55 min, 30% B; and 55–65 min, 0% B. Phytochemical compounds were detected at 340 nm using a UV-VIS detector (SPD-10AV VP, Kyoto, Japan). Identification of individual phytochemicals was achieved by comparing retention times (tR) of compounds in the carrot peel extracts with those of standard compounds include: flavonoids (rutin, (±)-naringenin, myricetin, apigenin, (−)-epigallocatechin gallate), phenolic acids (gallic acid, p-coumaric acid, caffeic acid, protocatechuic acid, 5,7-dimethoxycoumarin), and saponin (escin).
2.5. Determination of Antioxidant Activity of Carrot Peel Extracts
2.5.1. ABTS Radical Scavenging Capacity (ARSC)
The ARSC of carrot peel extracts was determined using the ABTS assay according to the previously described method in [15,28]. A stock solution was prepared by mixing 7.4 mM ABTS●+ (2,2′-Azino-bis-3-ethylbenzothiazoline-6-sulphonic acid) and 2.6 mM K2S2O8 solutions (1:1 ratio) and then incubating for 12 h in the dark at room temperature; then, they were stored at −18 °C until required. Before the ABTS reaction, a working solution was prepared by mixing 1 mL of stock solution with 60 mL of methanol to obtain an absorbance of 1.1 ± 0.02 at 734 nm. After that, 0.15 mL of the extract was thoroughly mixed with 2.85 mL of the working solution and incubated for 2 h in the dark at room temperature. The absorbance of the mixture was measured at 734 nm using a UV-VIS spectrophotometer. Methanol and trolox were used as a control and standard, respectively. The results were expressed as mg trolox equivalents (TE)/g dried sample.
2.5.2. DPPH Radical Scavenging Capacity (DRSC)
The DRSC of carrot peel extracts was measured based on the formerly reported method in [15,28]. A stock solution of 0.024% (w/v) DPPH (2,2-diphenyl-1-picryl-hydrazil) in methanol was prepared and stored at −18 °C until required. Prior to the DPPH reaction, a working solution was prepared by diluting 1.0 mL of stock solution with 45 mL of methanol to obtain an absorbance of 1.1 ± 0.02 at 515 nm. Next, 0.15 mL of the extract was thoroughly mixed with 2.85 mL of the working solution and incubated for 3 h in the dark at room temperature. The absorbance of the mixture was measured at 515 nm using a UV-VIS spectrophotometer. Methanol and trolox were used as a control and standard, respectively. The results were expressed as mg trolox equivalents (TE)/g dried sample.
2.5.3. Cupric Ion Reducing Antioxidant Capacity (CUPRAC)
The CUPRAC of carrot peel extracts was analyzed using the previously described method in [15,28]. Before the CUPRAC reaction, 1.0 mL of 10 mM CuCl2 solution was thoroughly mixed with 1.0 mL of 7.5 mM neocuproine and 1.0 mL of 7.7% (w/v) NH4Ac solutions. After that, 1.1 mL of the extract was added to the mixture and incubated for 1.5 h in the dark at room temperature. The absorbance of the mixture was measured at 450 nm using a UV-VIS spectrophotometer. Methanol and trolox were used as a control and standard, respectively. The results were expressed as mg trolox equivalents (TE)/g dried sample.
2.5.4. Ferric Reducing Antioxidant Power (FRAP)
The FRAP of carrot peel extracts was determined according to the formerly reported method in [15,28]. Firstly, three reagents were prepared including Reagent A: 300 mM acetate buffer solution, pH 3.6; Reagent B: 10 mM TPTZ (2,4,6-tripyridyl-s-triazine) solution in 40 mM HCl; and Reagent C: 20 mM FeCl3⋅6H2O solution. Prior to the FRAP reaction, the fresh FRAP solution was prepared by mixing reagents A, B and C at a ratio of 10:1:1. Next, 0.15 mL of the extract was thoroughly mixed with 2.85 mL of the fresh FRAP solution and incubated for 30 min in the dark at room temperature. The absorbance of the mixture was read at 593 nm using a UV-VIS spectrophotometer. Methanol and trolox were used as a control and standard, respectively. The results expressed as mg trolox equivalents (TE)/g dried sample.
2.6. Statistical Analysis
All experiments were carried out in triplicate. The data were analyzed using SAS software (Version 9.2, SAS Inst., Inc., Cary, NC, USA) and expressed as mean ± standard deviation (n = 3). One-way analysis of variance (ANOVA) and Tukey HSD tests were used for statistical comparisons. Significant differences were considered when p-values were less than 0.05 (p < 0.05).
3. Results
3.1. Effect of Drying Conditions on Physicochemical Properties of Carrot Peel
Table 1 describes the drying time, drying yield, residual moisture, extraction yield and energy consumption of carrot peel using various drying methods and conditions. Among them, the drying time was strongly affected by temperature and widely varied between four drying methods (from 0.08 to 70 h). Freeze drying took 70 h to dry carrot peel at the lowest temperature (−45 °C), while microwave drying at 1200 W took only 0.08 h. The drying time in this study was longer than that in the research of Nguyen et al. [6] on the P. amarus when using six drying methods including thermal and non-thermal drying (from 0.15 to 23.75 h). The drying yield was increased with an increase in the drying temperature. The highest drying yield was obtained by using vacuum drying at 100 °C (12.75 g dried sample/100 g fresh sample), which was significantly different from the other drying conditions, excepted for hot-air drying at 100 °C. The authors [6] indicated that the drying yield obtained from P. amarus was up to 23.84 g dried sample/100 g fresh sample. In regards to residual moisture, vacuum drying of carrot peel at 100 °C resulted in the lowest residual moisture in the product (3.13 g water/100 g dried sample), while freeze drying, vacuum drying at 50 °C, and hot-air drying at 50 °C were the least effective methods because of higher residual moisture (6.91, 7.0 and 6.86 g water/100 g dried sample, respectively). As a result, extraction yield obtained by vacuum drying at 100 °C was the highest (44.8 g dried extract/100 g dried sample), followed by vacuum drying at 50 °C and microwave drying at 600 W, whereas microwave drying at 1200 W resulted in the lowest extraction yield (27.6 g dried extract/100 g dried sample).
In comparison with other materials, the extraction yield of sea grape and P. amarus by hot-air drying was only 7.62 and 13.17 g dried extract/100 g dried sample, respectively [6,29]. Regarding energy consumption, freeze drying might seem to be the most expensive method because it uses the largest amount of energy (245 KWh), whereas microwave drying consumed the least energy due to the use of microwave radiation. Overall, the different drying conditions led to the differences in the drying time, drying yield, extraction yield and residual moisture of carrot peel as well as their energy consumption. Of these, microwave drying at 1200 W was the fastest and cheapest method for preparation of dried carrot peel for further investigation and application.
3.2. Effect of Drying Conditions on Phytochemical Compounds of Carrot Peel
3.2.1. Total Phenolic Content (TPC)
Table 2 indicates that the TPC of carrot peel was different for different drying conditions. Of these, TPC prepared by microwave drying at 1200 W (23.49 mg GAE/g dried sample) was significantly higher (p < 0.05) than those obtained from other drying conditions, while hot-air drying resulted in the lowest amount of TPC. An increase in the temperature in thermal drying methods caused a decrease in TPC (4.8 and 2.74 mg GAE/g dried sample at HAD50 and HAD100, respectively) or (3.77 and 3.11 mg GAE/g dried sample at VCD50 and VCD100, respectively). Interestingly, TPC in microwave drying at 1200 W was significantly higher than that at 600 W. The reason for these differences may be due to different drying conditions, particularly drying temperature and time. The same figure has been reported by Nguyen et al. [6], who indicated that the TPC of P. amarus was greatly affected by drying time and temperature. Other studies [14,15,16] have also indicated that microwave drying can maintain high TPC of P. trimera root, Vitex negundo tea and banana peel. However, Lim et al. [12] found that microwave drying resulted in reducing a great amount of the TPC from the P. amarus.
3.2.2. Total Flavonoid Content (TFC)
Table 2 illustrates the TFC of carrot peel achieved by four different drying methods. In general, TFC increased with a rise in drying temperature. Microwave drying at 1200 W (MWD1200) possessed the highest amount of TFC (28.09 mg RE/g dried sample), followed by MWD600 (20.29 mg RE/g dried sample) whereas the lowest TFC was obtained from hot-air drying, regardless of drying temperature. The reason for these results may be due to the faster drying time in MWD1200 (0.08 h) as compared to HAD50 (25 h). This finding is different from the results of Nguyen et al. [6], who indicated that the TFC of P. amarus dramatically decreased in microwave drying. On the other hand, other reports [15,16] showed that the higher TFC of P. trimera root and banana peel was obtained by microwave drying as compared to vacuum and hot-air drying methods.
3.2.3. Proanthocyanidin Content (PC)
The PC of carrot peel increased in the order of the drying methods as follows: hot-air drying > vacuum drying > freeze drying > microwave drying (Table 2). Carrot peel that was dried by microwave had the highest level of proanthocyanidins (6.89 and 4.59 mg CE/g dried sample at 1200 W and 600 W, respectively), which was significantly higher (p < 0.05) than that obtained from other drying conditions. Using hot-air to dry carrot peel significantly decreased (p < 0.05) the amount of proanthocyanidins (1.88 mg CE/g dried sample) as compared to that obtained by freeze drying (2.67 mg CE/g dried sample). Freeze drying and vacuum drying showed no significant difference in the content of proanthocyanidins (2.67 and 2.37 mg CE/g dried sample, respectively). This result is different from the studies of the authors in [6,15] on the P. amarus and P. trimera root, which showed that PC in hot-air drying was significantly higher (p < 0.05) than in microwave and vacuum drying. The data obtained from this study indicated that drying methods and drying time greatly affected the PC of carrot peel. Among the different drying methods and conditions tested, microwave drying seemed to be the most effective method for maintaining high PC from carrot peel.
3.2.4. Saponin Content (SC)
Table 2 shows that SC was maintained at the highest level in the carrot peel when it was dried by microwave at 1200 W (353.87 mg EE/g dried sample), followed by MWD600, freeze drying and vacuum drying at 50 °C (291.23, 283.58 and 262.11 mg EE/g dried sample, respectively). Hot-air drying resulted in the lowest amount of saponins (213.03 mg EE/g dried sample). The SC of carrot peel was higher than that of the P. amarus, which ranged from 121.18 to 250.34 mg EE/g dried sample [6]. The highest SC of the P. amarus was obtained by infrared drying [6] whereas low-pressure superheated steam drying at 50 °C achieved higher total triterpene saponin content from C. asiatica leaves than those obtained by combined infrared-hot air drying and hot-air drying [1]. Consequently, SC differs from species to species and is greatly affected by the drying method, and carrot peel is a rich source of saponins as compared to other plants like the P. amarus. Saponins have been shown to possess various biological effects, such as antiviral, antimicrobial, antioxidative, immunomodulatory, antiherbivore, anti-hyperglycaemic, hepatoprotective, cardioprotective, anti-HIV, cytotoxic, antitumor, anticancer, anti-inflammatory, and antihepatitis B and C activities [28,30,31]. Therefore, carrot peel is a promising source for the extraction of saponins for potential application in nutraceuticals and/or functional foods.
3.2.5. Phytochemical Compounds in the Dried Carrot Peel
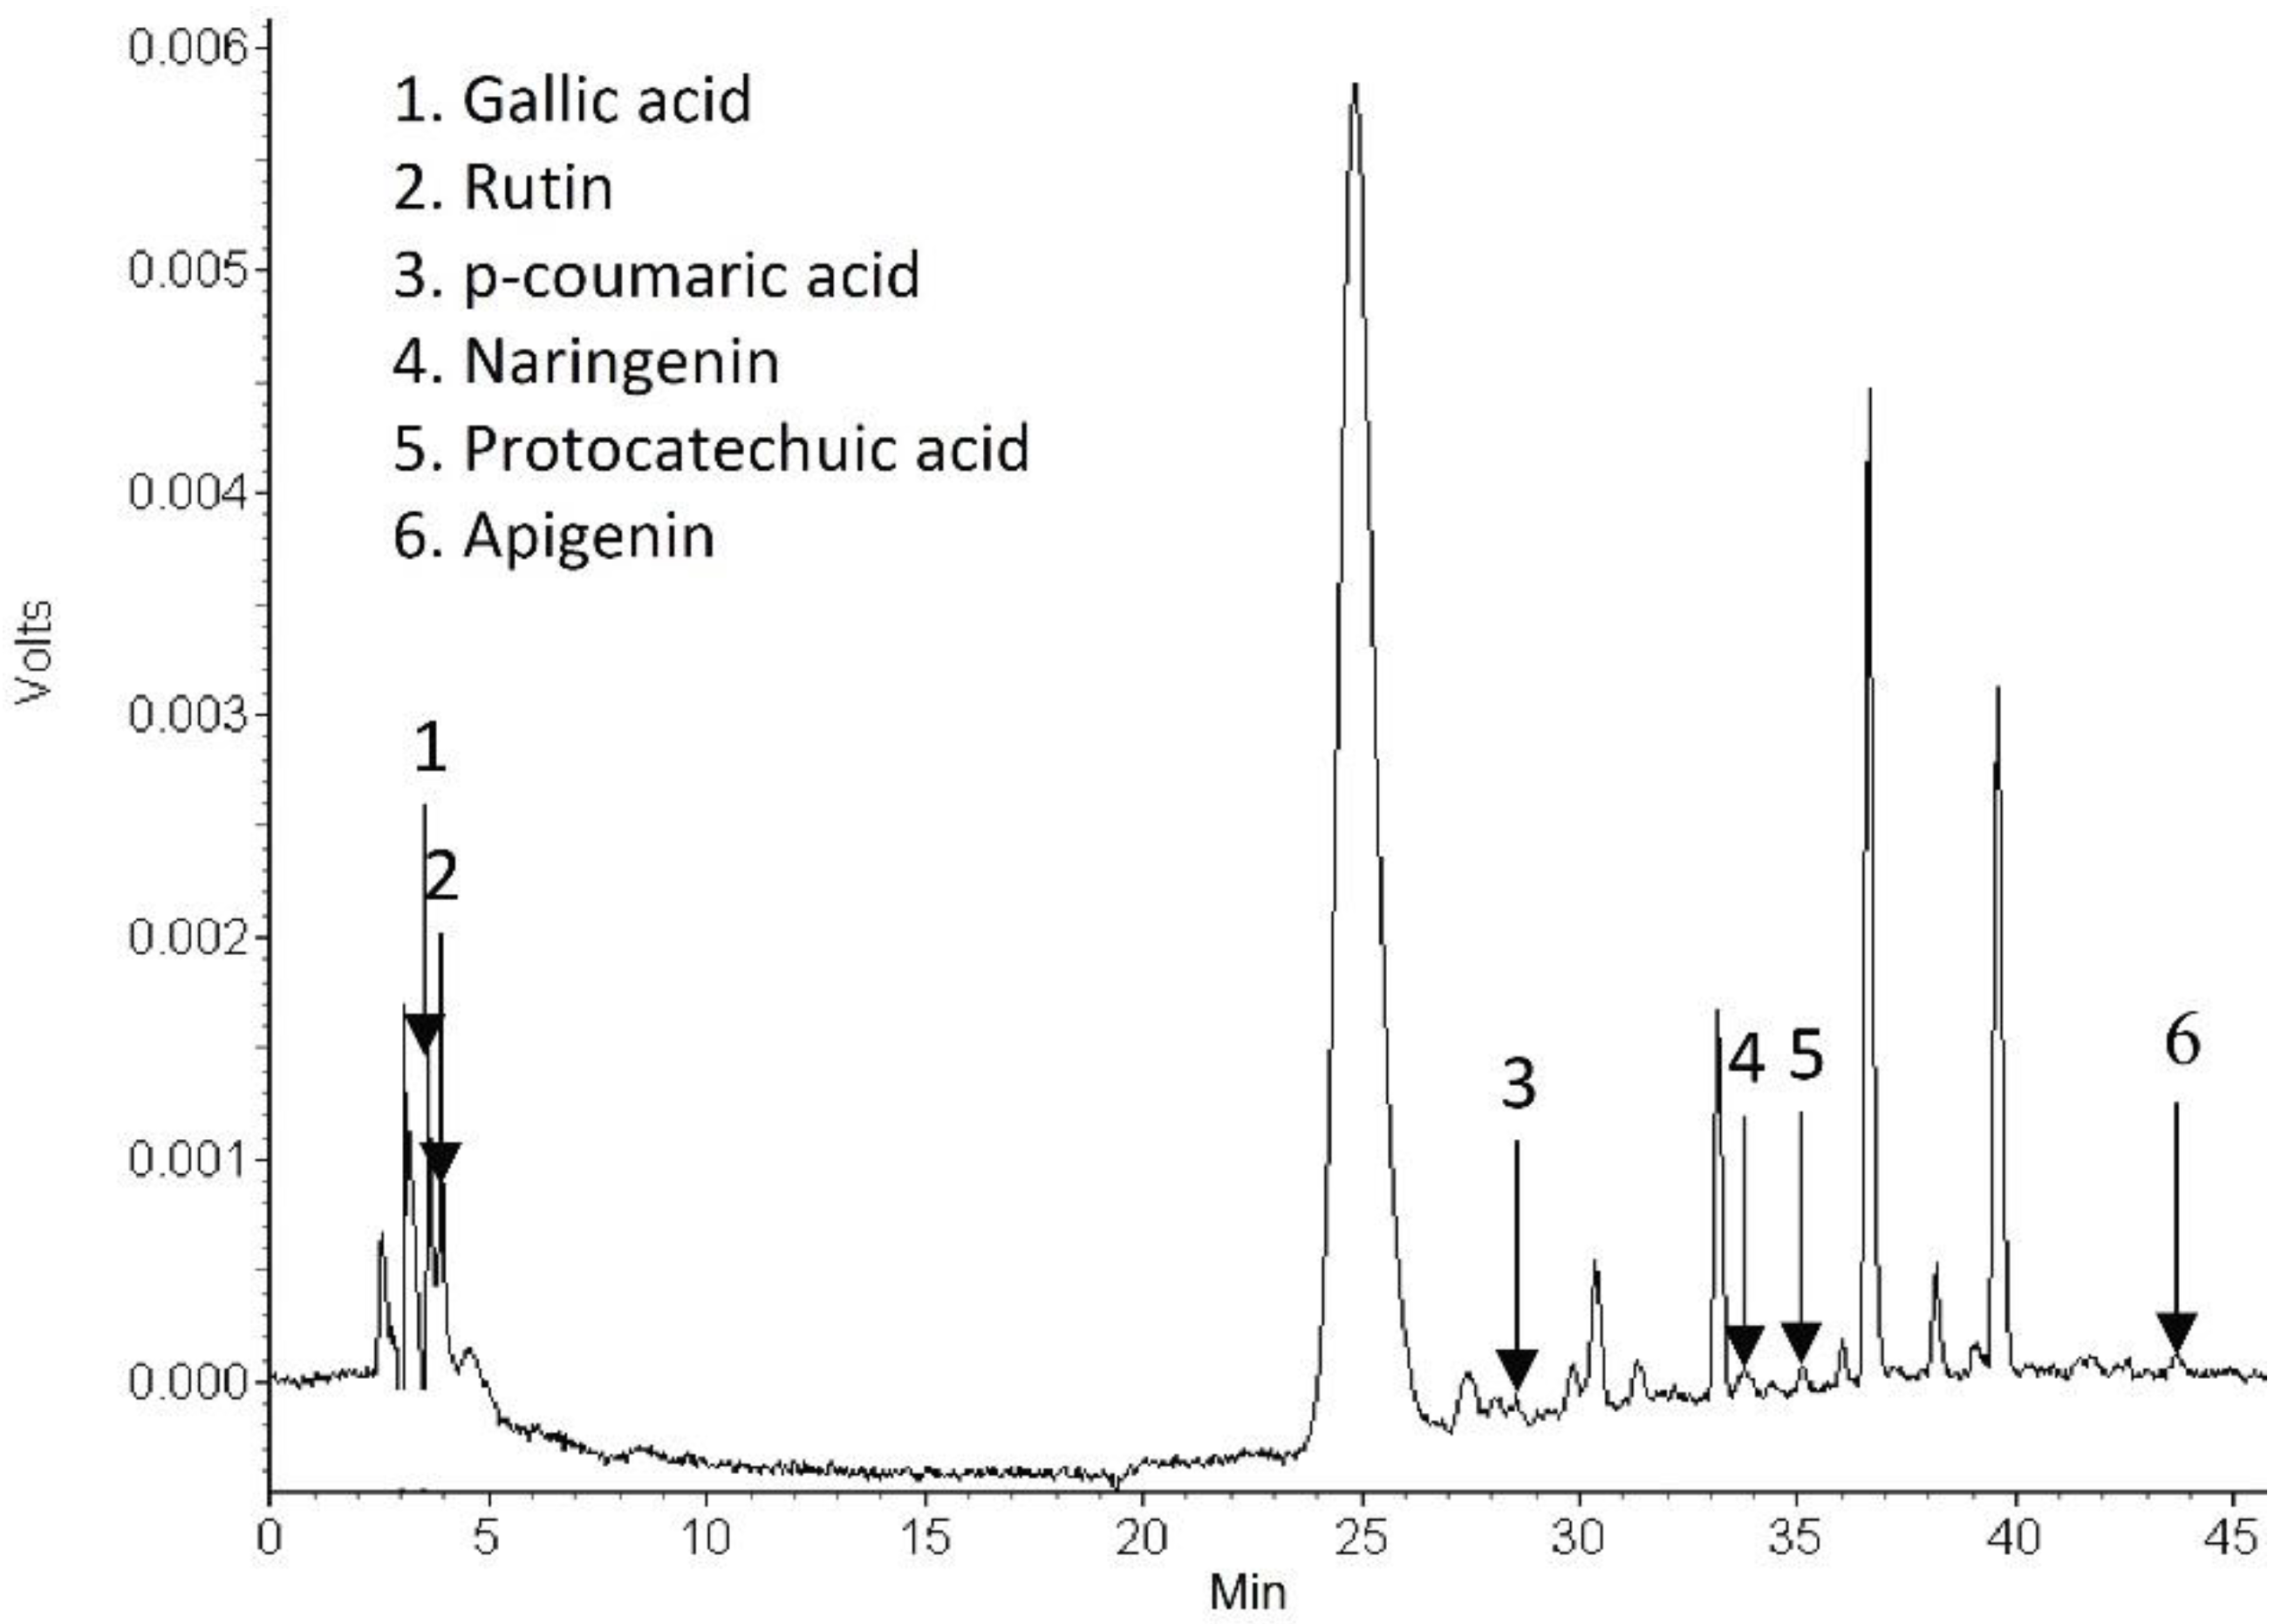
Figure 1 shows the representative HPLC chromatogram of methanol extract from the carrot peel prepared by microwave drying at 1200 W. Based on retention time, gallic acid was firstly identified, followed by rutin, p-coumaric acid, (±)-naringenin, protocatechuic acid, and apigenin (3.59, 3.93, 28.26, 32.73, 34.82, and 44.21 min, respectively). Some of the major phytochemicals in the carrot peel extract need to be identified in further studies. Gallic acid was also the first phytochemical in the extracts from the P. amarus and P. trimera root to be detected by HPLC [6,15].
3.3. Effect of Drying Conditions on Antioxidant Activity of Carrot Peel
3.3.1. ABTS Radical Scavenging Capacity (ARSC)
Table 3 shows that the ARSC of carrot peel varied depending on the drying method. The highest ARSC was achieved by microwave drying at 1200 W (166.35 mg TE/g dried sample), which was significantly higher (p < 0.05) than that dried by MWD600 and FD (85.70 and 23.81 mg TE/g dried sample, respectively). In contrast, hot-air and vacuum drying seemed to destroy all the ARSC of carrot peel. The same finding was reported by Vu et al. [16], who indicated that microwave drying at 1200 W maintained the greatest ARSC of banana peel as compared to other drying methods. The ARSC of carrot peel in this study is lower than that in the P. amarus using six different drying methods, which ranged from 384.86 to 860.16 mg TE/g dried sample [6]. Strong correlations were found between the ARSC and phytochemicals of carrot peel, especially TPC, TFC and proanthocyanidins (R2 = 0.99, 0.95 and 0.98, respectively; Table 4). This reveals that TPC, TFC and proanthocyanidins are key components for the ARSC of carrot peel.
3.3.2. DPPH Radical Scavenging Capacity (DRSC)
Table 3 shows that microwave drying was the most effective method for removing moisture from carrot peel because of its high DRSC retention, whereas vacuum drying had a negative influence on the DRSC. The highest ARSC was seen in microwave drying at 1200 W (97.41 mg TE/g dried sample) which differed significantly from other drying conditions. Microwave drying at 600 W resulted in a significantly lower ARSC (48.33 mg TE/g dried sample), followed by freeze drying (23.74 mg TE/g dried sample), and hot-air drying at 50 °C (17.99 mg TE/g dried sample). However, the DRSC of carrot peel was completely lost when using hot-air drying at 100 °C. Table 4 shows the correlation between the phytochemical compounds and antioxidant activity of carrot peel dried by different methods. The DRSC and TPC, TFC and proanthocyanidins had strong correlations (R2 = 0.98, 0.92 and 0.93, respectively), while a moderate correlation was observed for the DRSC and saponins (R2 = 0.79). This indicates that TPC, TFC and proanthocyanidins are major contributors to the DRSC of carrot peel. This outcome is supported by previous studies [16,32], which found that microwave drying of banana peel and sage plants resulted in the highest DRSC, whereas the lower DRSC was associated with hot-air and vacuum drying methods. However, the result obtained in this study is different from the findings of Nguyen et al. [6], who indicated that the DRSC of the P. amarus was only significantly affected by low-temperature-air drying, microwave drying at all power levels, and sun drying.
3.3.3. Cupric Ion Reducing Antioxidant Capacity (CUPRAC)
The same trend is observed for the CUPRAC of carrot peel (Table 3), in which microwave drying at 1200 W possessed the highest CUPRAC (24.03 mg TE/g dried sample), and it was significantly higher (p < 0.05) than other drying conditions. Freeze drying retained a limited CUPRAC of 6.48 mg TE/g dried sample, which was not significantly different from hot-air drying at 50 °C (4.73 mg TE/g dried sample). In contrast, vacuum drying achieved the lowest CUPRAC (2.36–2.87 mg TE/g dried sample). This result is similar to the outcome of Vu et al. [16], who showed that the highest CUPRAC of banana peel was obtained by microwave drying at 960 W (65 mg TE/g dried sample). Table 4 illustrates that there were strong correlations between TPC, TFC and proanthocyanidins and the CUPRAC of carrot peel (R2 = 1.00, 0.92 and 0.96, respectively), while a weaker correlation was found between saponins of carrot peel and its CUPRAC (R2 = 0.82). This reveals that TPC, TFC and proanthocyanidins are the main contributors for the CUPRAC of carrot peel.
3.3.4. Ferric Reducing Antioxidant Power (FRAP)
Table 3 indicates that the FRAP of carrot peel varied in a range from 9.56 to 95.19 mg TE/g dried sample. In general, the FRAP was decreased in order of microwave, freeze, hot-air and vacuum drying. Again, the highest FRAP was obtained from microwave drying at 1200 W, which was twice as high as that dried at 600 W (95.19 and 48.07 TE/g dried sample, respectively) and both were significantly different (p < 0.05) from other drying conditions. Freeze drying also possessed more than one fourth the FRAP of MWD1200 (21.67 TE/g dried sample). The strongest correlation was observed for the FRAP and TPC of carrot peel, followed by proanthocyanidins, TFC and saponins (R2 = 1.00, 0.98, 0.90 and 0.81, respectively; Table 4), implying that TPC, proanthocyanidins and TFC are key contributors for the FRAP of carrot peel. This finding is similar to the report of Vu et al. [16], who indicated that the FRAP of banana peel was achieved at the highest level by microwave drying, followed by freeze drying, vacuum drying, hot-air drying, dehumidified air drying, and sun drying methods.
4. Conclusions
This study indicated that different drying methods and conditions greatly influenced the amount of certain bioactive compounds and the antioxidant activity of carrot peel. Among the different drying methods used, microwave drying was the most effective method to dry carrot peel, while hot-air, vacuum and freeze drying were less effective methods. Microwave drying at 1200 W achieved the highest level of phytochemical compounds, while hot-air drying obtained the lowest content of bioactive compounds. Additionally, the antioxidant activity was also maximized when carrot peel was dried by microwave at 1200 W, but it was significantly reduced in hot-air, vacuum and freeze drying methods.
Author Contributions
V.T.N. conceived, designed and performed the experiments; V.T.N. analyzed the data; V.T.N. and M.D.L. prepared the paper.
Funding
This research received no external funding.
Acknowledgments
The authors would like to kindly acknowledge the support from the Faculty of Science, the University of Newcastle, the Australia and the Vietnamese Government. The National Foundation for Science and Technology Development (NAFOSTED) is also gratefully acknowledged.
Conflicts of Interest
The authors declare no conflict of interest.
References
- Niamnuy, C.; Charoenchaitrakool, M.; Mayachiew, P.; Devahastin, S. Bioactive compounds and bioactivities of Centella asiatica (L.) urban prepared by different drying methods and conditions. Dry. Technol. 2013, 31, 2007–2015. [Google Scholar] [CrossRef]
- Potisate, Y.; Phoungchandang, S.; Kerr, W.L. The effects of predrying treatments and different drying methods on phytochemical compound retention and drying characteristics of Moringa leaves (Moringa oleifera Lam.). Dry. Technol. 2014, 32, 1970–1985. [Google Scholar] [CrossRef]
- Roknul, A.S.M.; Zhang, M.; Mujumdar, A.S.; Wang, Y. A comparative study of four drying methods on drying time and quality characteristics of stem lettuce slices (Lactuca sativa L.). Dry. Technol. 2014, 32, 657–666. [Google Scholar] [CrossRef]
- Sui, Y.; Yang, J.; Ye, Q.; Li, H.; Wang, H. Infrared, convective, and sequential infrared and convective drying of wine grape pomace. Dry. Technol. 2014, 32, 686–694. [Google Scholar] [CrossRef]
- Karaman, S.; Toker, O.S.; Çam, M.; Hayta, M.; Doğan, M.; Kayacier, A. Bioactive and physicochemical properties of persimmon as affected by drying methods. Dry. Technol. 2014, 32, 258–267. [Google Scholar] [CrossRef]
- Nguyen, V.T.; Vuong, Q.V.; Bowyer, M.C.; van Altena, I.A.; Scarlett, C.J. Effects of different drying methods on bioactive compound yield and antioxidant capacity of Phyllanthus amarus. Dry. Technol. 2015, 33, 1006–1017. [Google Scholar] [CrossRef]
- Pham, H.N.T.; Nguyen, V.T.; Vuong, Q.V.; Bowyer, M.C.; Scarlett, C.J. Bioactive compound yield and antioxidant capacity of Helicteres hirsuta Lour. stem as affected by various solvents and drying methods. J. Food Proc. Preserv. 2016, 41, 1–9. [Google Scholar]
- Sadowska, U.; Kopeć, A.; Kourimska, L.; Zarubova, L.; Kloucek, P. The effect of drying methods on the concentration of compounds in sage and thyme. J. Food Proc. Preserv. 2017, 41, e13286. [Google Scholar] [CrossRef]
- Shitanda, D.; Wanjala, N.V. Effect of different drying methods on the quality of jute (Corchorus olitorius L.). Dry. Technol. 2006, 24, 95–98. [Google Scholar] [CrossRef]
- Wojdylo, A.; Figiel, A.; Oszmianski, J. Effect of drying methods with the application of vacuum microwaves on the bioactive compounds, color, and antioxidant activity of strawberry fruits. J. Agric. Food Chem. 2009, 57, 1337–1343. [Google Scholar] [CrossRef] [PubMed]
- Horszwald, A.; Julien, H.; Andlauer, W. Characterisation of Aronia powders obtained by different drying processes. Food Chem. 2013, 141, 2858–2863. [Google Scholar] [CrossRef] [PubMed]
- Lim, Y.Y.; Murtijaya, J. Antioxidant properties of Phyllanthus amarus extracts as affected by different drying methods. LWT Food Sci. Technol. 2007, 40, 1664–1669. [Google Scholar] [CrossRef]
- Kumaran, A.; Karunakaran, R.J. In vitro antioxidant activities of methanol extracts of five Phyllanthus species from India. LWT Food Sci. Technol. 2007, 40, 344–352. [Google Scholar] [CrossRef]
- Rabeta, M.S.; Vithyia, M. Effect of different drying methods on the antioxidant properties of Vitex negundo Linn. tea. Int. Food Res. J. 2013, 20, 3171–3176. [Google Scholar]
- Nguyen, V.T.; Pham, N.M.Q.; Vuong, Q.V.; Bowyer, M.C.; van Altena, I.A.; Scarlett, C.J. Phytochemical retention and antioxidant capacity of Xao tam phan (Paramignya trimera) root as prepared by different drying methods. Dry. Technol. 2016, 34, 324–334. [Google Scholar] [CrossRef]
- Vu, H.T.; Scarlett, C.J.; Vuong, Q.V. Effects of drying conditions on physicochemical and antioxidant properties of banana (Musa cavendish) peels. Dry. Technol. 2017, 1141–1151. [Google Scholar] [CrossRef]
- Jin, G.Y.; Zhang, M.; Fang, Z.X.; Cui, Z.W.; Song, C.F. Numerical study on spout elevation of a gas-particle spout fluidized bed in microwave-vacuum dryer. J. Food Eng. 2014, 143, 8–16. [Google Scholar] [CrossRef]
- Swasdisevi, T.; Devahastin, S.; Sa-Adchom, P.; Soponronnarit, S. Mathematical modeling of combined far-infrared and vacuum drying banana slice. J. Food Eng. 2009, 92, 100–106. [Google Scholar] [CrossRef]
- Nimmol, C.; Devahastin, S.; Swasdisevi, T.; Soponronnarit, S. Drying of banana slices using combined low-pressure superheated steam and far-infrared radiation. J. Food Eng. 2007, 81, 624–633. [Google Scholar] [CrossRef]
- Naumovski, N. Bioactive composition of plants and plant foods. In Plant Bioactive Compounds for Pancreatic Cancer Prevention and Treatment; Scarlett, C.J., Vuong, Q.V., Eds.; Nova Science Publishers: Hauppauge, NY, USA, 2014; pp. 81–115. [Google Scholar]
- Apak, R.; Gorinstein, S.; Böhm, V.; Schaich, K.M.; Özyürek, M.; Güçlü, K. Methods of measurement and evaluation of natural antioxidant capacity/activity (IUPAC technical report). Pure Appl. Chem. 2013, 85, 957–998. [Google Scholar] [CrossRef]
- Doughari, J.H. Phytochemicals—A global perspective of their role in nutrition and health. In Phytochemicals: Extraction Methods, Basic Structures and Mode of Action as Potential Chemotherapeutic Agents; Rao, V., Ed.; InTech Europe: Rijeka, Croatia, 2012; pp. 1–32. [Google Scholar]
- Sharma, K.D.; Karki, S.; Thakur, N.S.; Attri, S. Chemical composition, functional properties and processing of carrot—A review. J. Food Sci. Technol. 2012, 49, 22–32. [Google Scholar] [CrossRef] [PubMed]
- Nguyen, V.T.; Scarlett, C.J. Mass proportion, bioactive compounds and antioxidant capacity of carrot peel as affected by various solvents. Technologies 2016, 4, 36. [Google Scholar] [CrossRef]
- Nguyen, V.T. Potential, uses and future perspectives of agricultural wastes. In Recovering Bioactive Compounds from Agricultural Wastes; Nguyen, V.T., Ed.; John Wiley and Sons Ltd.: Chichester, UK, 2017; pp. 1–32. [Google Scholar]
- Xu, Y.Y.; Zhang, M.; Mujumdar, A.S.; Duan, X.; Jin-Cai, S. A two-stage vacuum freeze and convective air drying method for strawberries. Dry. Technol. 2006, 24, 1019–1023. [Google Scholar] [CrossRef]
- AOAC. Official Methods of Analysis, 16th ed.; Association of Official Analytical Chemists: Washington, DC, USA, 1998. [Google Scholar]
- Nguyen, V.T.; Sakoff, J.A.; Scarlett, C.J. Physicochemical, antioxidant and cytotoxic properties of Xao tam phan (Paramignya trimera) root extract and its fractions. Chem. Biodivers. 2017, 14, e1600396. [Google Scholar] [CrossRef] [PubMed]
- Nguyen, V.T.; Ueng, J.P.; Tsai, G.J. Proximate composition, total phenolic content, and antioxidant activity of Seagrape (Caulerpa lentillifera). J. Food Sci. 2011, 76, C950–C958. [Google Scholar] [CrossRef] [PubMed]
- Sparg, S.G.; Light, M.E.; Van Staden, J. Biological activities and distribution of plant saponins. J. Ethnopharmacol. 2004, 94, 219–243. [Google Scholar] [CrossRef] [PubMed]
- Nguyen, V.T.; Sakoff, J.A.; Scarlett, C.J. Physicochemical properties, antioxidant and cytotoxic activities of crude extracts and fractions from Phyllanthus amarus. Medicines 2017, 4, 42. [Google Scholar] [CrossRef] [PubMed]
- Ibtissem, H.S.; Fatma, Z.R.; Iness, B.R.; Soumaya, B.; Ferid, L.; Brahim, M. Total phenolics, flavonoids, and antioxidant activity of Sage (Salvia officinalis L.) plants as affected by different drying methods. Food Bioproc. Technol. 2013, 6, 806–817. [Google Scholar]
Figure 1.
HPLC chromatogram of methanol extract from the carrot peel prepared by microwave drying at 1200 W, with UV-VIS detector set at 340 nm.
Figure 1.
HPLC chromatogram of methanol extract from the carrot peel prepared by microwave drying at 1200 W, with UV-VIS detector set at 340 nm.

Table 1.
Physicochemical properties of carrot peel dried at various conditions (n = 3).
| Drying Method | Drying Time (h) | Drying Yield (g DS/100 g FS) | Residual Moisture (g water/100 g DS) | Extraction Yield (g DE/100 g DS) | Energy Consumption (kWh) |
|---|---|---|---|---|---|
| HAD50 | 25.0 | 9.60 ± 0.11 d | 6.86 ± 0.10 a | 35.13 ± 1.35 c | 30.0 |
| HAD100 | 5.5 | 11.78 ± 0.34 ab | 5.22 ± 0.22 b | 36.92 ± 2.24 bc | 6.6 |
| VCD50 | 21.0 | 9.94 ± 0.01 d | 7.00 ± 0.02 a | 42.11 ± 2.96 ab | 16.8 |
| VCD100 | 5.0 | 12.75 ± 0.70 a | 3.13 ± 0.46 c | 44.80 ± 2.24 a | 4.0 |
| MWD600 | 0.15 | 11.26 ± 0.45 bc | 5.02 ± 0.31 b | 42.11 ± 0.82 ab | 0.09 |
| MWD1200 | 0.08 | 10.76 ± 0.62 bcd | 4.91 ± 0.12 b | 27.60 ± 1.12 d | 0.1 |
| FD | 70.0 | 10.23 ± 0.23 cd | 6.91 ± 0.28 a | 31.72 ± 3.80 cd | 245.0 |
Different letters in the same column were significantly different (p < 0.05). DS: Dried sample; FS: Fresh sample; DE: Dried extract; HAD50/100: Hot-air drying at 50/100 °C; VCD50/100: Vacuum drying at 50/100 °C and 83 kPa; MWD600/1200: Microwave drying at 600/1200 W; FD: Freeze drying at −45 °C.
Table 2.
Phytochemical compounds of carrot peel dried at various conditions (n = 3).
| Drying Method | TPC (mg GAE/g DS) | TFC (mg RE/g DS) | PC (mg CE/g DS) | SC (mg EE/g DS) |
|---|---|---|---|---|
| HAD50 | 4.80 ± 0.32 cd | 10.81 ± 0.67 c | 1.88 ± 0.16 d | 213.03 ± 21.12 d |
| HAD100 | 2.74 ± 0.26 e | 11.94 ± 0.52 c | 2.06 ± 0.20 d | 222.88 ± 10.94 d |
| VCD50 | 3.77 ± 0.07 de | 12.33 ± 0.73 c | 2.37 ± 0.10 cd | 262.11 ± 12.16 bc |
| VCD100 | 3.11 ± 0.22 de | 13.16 ± 0.92 c | 2.27 ± 0.18 cd | 237.33 ± 1.83 cd |
| MWD600 | 12.54 ± 0.67 b | 20.29 ± 1.36 b | 4.59 ± 0.11 b | 291.23 ± 20.29 b |
| MWD1200 | 23.49 ± 1.73 a | 28.09 ± 2.56 a | 6.89 ± 0.35 a | 353.87 ± 7.55 a |
| FD | 6.00 ± 0.06 c | 17.89 ± 0.32 b | 2.67 ± 0.11 c | 283.58 ± 6.26 b |
Different letters in the same column were significantly different (p < 0.05). DS: Dried sample; TPC: Total phenolic content; TFC: Total flavonoid content; PC, Proanthocyanidin content; SC, Saponin content; GAE: Gallic acid equivalents; RE: Rutin equivalents; CE: Catechin equivalents; EE: Escin equivalents. HAD50/100: Hot-air drying at 50/100 °C; VCD50/100: Vacuum drying at 50/100 °C and 83 kPa; MWD600/1200: Microwave drying at 600/1200 W; FD: Freeze drying at −45 °C.
Table 3.
Antioxidant activity of carrot peel dried at various conditions (n = 3).
| Drying Method | ARSC (mg TE/g DS) | DRSC (mg TE/g DS) | CUPRAC (mg TE/g DS) | FRAP (mg TE/g DS) |
|---|---|---|---|---|
| HAD50 | nd | 17.99 ± 4.26 c | 4.73 ± 0.36 cd | 16.20 ± 0.94 cd |
| HAD100 | nd | nd | 1.88 ± 0.16 e | 9.56 ± 0.33 e |
| VCD50 | nd | 3.51 ± 0.24 d | 2.87 ± 0.04 e | 12.28 ± 1.06 de |
| VCD100 | nd | 1.16 ± 0.04 d | 2.36 ± 0.15 e | 10.77 ± 1.01 de |
| MWD600 | 85.70 ± 3.71 b | 48.33 ± 1.63 b | 12.06 ± 0.49 b | 48.07 ± 2.19 b |
| MWD1200 | 166.35 ± 5.11 a | 97.41 ± 6.90 a | 24.03 ± 3.08 a | 95.19 ± 4.55 a |
| FD | 23.81 ± 5.74 c | 23.74 ± 1.33 c | 6.48 ± 0.16 c | 21.67 ± 1.18 c |
Different letters in the same column were significantly different (p < 0.05). DS: Dried sample; ARSC: ABTS radical scavenging capacity; DRSC: DPPH radical scavenging capacity; CUPRAC: Cupric ion reducing antioxidant capacity; FRAP: Ferric reducing antioxidant power; TE: Trolox equivalents; nd: Not determined. HAD50/100: Hot-air drying at 50/100 °C; VCD50/100: Vacuum drying at 50/100 °C and 83 kPa; MWD600/1200: Microwave drying at 600/1200 W; FD: Freeze drying at −45 °C.
Table 4.
Correlations between phytochemical compounds and antioxidant activity of carrot peel dried at various conditions.
Table 4.
Correlations between phytochemical compounds and antioxidant activity of carrot peel dried at various conditions.
| Correlations * (R2) | ARSC | DRSC | CUPRAC | FRAP |
|---|---|---|---|---|
| TPC | 0.99 | 0.98 | 1.00 | 1.00 |
| TFC | 0.95 | 0.92 | 0.92 | 0.90 |
| PC | 0.98 | 0.93 | 0.96 | 0.98 |
| SC | 0.84 | 0.79 | 0.82 | 0.81 |
* Calculated based on values from various drying conditions. TPC, Total phenolic content; TFC, Total flavonoid content; PC, Proanthocyanidin content; SC, Saponin content; ARSC, ABTS radical scavenging capacity; DRSC, DPPH radical scavenging capacity; CUPRAC, Cupric ion reducing antioxidant capacity; FRAP, Ferric reducing antioxidant power.
© 2018 by the authors. Licensee MDPI, Basel, Switzerland. This article is an open access article distributed under the terms and conditions of the Creative Commons Attribution (CC BY) license (http://creativecommons.org/licenses/by/4.0/).
Share and Cite
MDPI and ACS Style
Nguyen, V.T.; Le, M.D. Influence of Various Drying Conditions on Phytochemical Compounds and Antioxidant Activity of Carrot Peel. Beverages 2018, 4, 80. https://0-doi-org.brum.beds.ac.uk/10.3390/beverages4040080
AMA Style
Nguyen VT, Le MD. Influence of Various Drying Conditions on Phytochemical Compounds and Antioxidant Activity of Carrot Peel. Beverages. 2018; 4(4):80. https://0-doi-org.brum.beds.ac.uk/10.3390/beverages4040080
Chicago/Turabian StyleNguyen, Van Tang, and Minh Duong Le. 2018. "Influence of Various Drying Conditions on Phytochemical Compounds and Antioxidant Activity of Carrot Peel" Beverages 4, no. 4: 80. https://0-doi-org.brum.beds.ac.uk/10.3390/beverages4040080
Note that from the first issue of 2016, this journal uses article numbers instead of page numbers. See further details here.