Sorghum Coffee–Lactose Stout Production and Its Physico-Chemical Characterization


1
Department of Process Engineering, National School of Agro-Industrial Sciences (ENSAI) of the University of Ngaoundere, P.O. Box 455 ENSAI, Ngaoundere, Cameroon
2
Department of Food Processing and Quality Control, University Institute of Technology (UIT), University of Ngaoundere, P.O. Box 455 UIT, Ngaoundere, Cameroon
*
Author to whom correspondence should be addressed.
Beverages 2019, 5(1), 20; https://0-doi-org.brum.beds.ac.uk/10.3390/beverages5010020
Submission received: 23 June 2018
/
Revised: 29 January 2019
/
Accepted: 2 February 2019
/
Published: 1 March 2019
(This article belongs to the Special Issue Brewing and Craft Beer)
Abstract
:Sorghum (Safrari) was valorized into sorghum coffee-lactose stouts using Vernonia amygdalina as a bittering ingredient. These sorghum grains and subsequent sorghum pale malt were tested for their acceptability in the brewing field. Results obtained were the germinative capacity of 99.29 ± 0.58%, a germinative energy of 98.56 ± 1.79%, a thousand corns weight 48.08 ± 0.02 g for the grains, and a diastatic power of 187.44 ± 7.89 WK for sorghum malt. The worts and beers produced were characterized and were found suitable. Moreover, alcohol content in stout beers obtained was between 8.8% and 9.4% ABV. Sensory evaluation was implemented on beers using 30 panellists and the best combination was the one using 50% lactose (250 g) and 50% coffee (250 g) in 5 L of wort during wort boiling.
1. Introduction
Sorghum is Africa’s fourth most important crop in terms of tonnage after maize, rice, and wheat [1]. In certain parts of Africa and India, sorghum grain has traditionally been used in the production of porridge, alcoholic beverages, and for bread making [2]. More than 300 million people in developing countries rely on sorghum as an energy source [3,4,5]. This is the case in Cameroon where sorghum is the largest energy source in the northern part [6,7,8] with a significant annual production of 1,102,000 tons [1]. Given the competition of multinational enterprises, sorghum appears to be the best alternative to lager beer production [8]. Barley has become the basic raw material for brewing for both barley and non-barley-producing countries like Cameroon. The process of brewing lager beer with cereals other than barley is growing to be a common practice, especially in non-barley-producing countries due to various drawbacks related to barley. Barley is a temperate cereal and the African climate is unsuitable for its cultivation. This presents a major problem; barley grain or barley malt must be imported, hence there are skyrocketing prices due to strong global demand and high shipping costs, meaning some valuable foreign exchange and increasing the price of the beer beyond the reach of most Africans. Importation also disadvantages local farmers as it denies them potential markets [9]. This occurs in Cameroon and these force a re-think by industries to invest in other cereals as a malting substitute. Sorghum can be well and efficiently utilized industrially in Cameroon for producing beer. The chemical composition of sorghum reassures it as an alternative cereal to barley in lager style beer production. It was previously believed that beer could not be produced without barley. However, it has been well-documented that cereals like sorghum have the potential to be an alternate substrate for conventional beer brewing. Research studies into sorghum are progressing rapidly and making a significant impact in brewing despite the earlier misunderstanding that malted sorghum developed insufficient hydrolytic enzymes [6,7,8,9,10]. Differences in malting and mashing temperatures employed in studies of sorghum in the past were an important contributory factor and complicated our understanding of the physiological behavior of sorghum during processing [6,7,8,9,10]. In recent times, the large body of work carried out on sorghum to understand the physiological behavior of sorghum has led to improved malting and mashing processes amongst other findings, such as improved varieties of sorghum suitable for beer brewing, which contributes in producing commercially acceptable sorghum beers both lager and stout [6,7,11,12,13,14,15]. Nigeria, South Africa, Uganda, Tanzania, Zambia, and Zimbabwe successfully brew commercial sorghum lager and stout beer [16]. The utilization of a locally grown crops as a brewing material is cost effective and can potentially boost the regional economy of Cameroon. It would benefit sorghum farmers with guaranteed income and thus reduce unemployment. In addition, the use of a native crop would reduce logistical costs for manufacturers resulting in reduced beer retail prices [17]. Manufacturers would be able to negotiate lower taxes with the government on sorghum-based beer, which would contribute to another significant cost reduction of particular benefit to the consumer. It would help create affordable lager beer for consumers for whom this type of beer is unaffordable. These factors would thus lead to an increased growth in the brewing industry [17]. Sorghum beer is gluten-free and can be used by celiacs [18,19]. In order to valorize sorghum, we came up with producing a coffee–lactose sorghum stout. The choice of coffee and lactose is not trivial. Beer customers showed interest in such a beer as they showed interest to give their impression. Bitter leaf (Vernonia amygdalina) was used as a substitute for hop. Bitter leaf has successfully served as a substitute to hop in lager beer. Its properties render it suitable for use [20,21,22,23,24]. We were interested in this paper to present how the production of the coffee–lactose stout from the malting process through and fermentation was undertaken. Thereafter, the results of the analyses conducted on worts and beers are discussed, ending up with discussing the sensory evaluation of the beers.
2. Materials and Methods
2.1. Acquisition of Materials
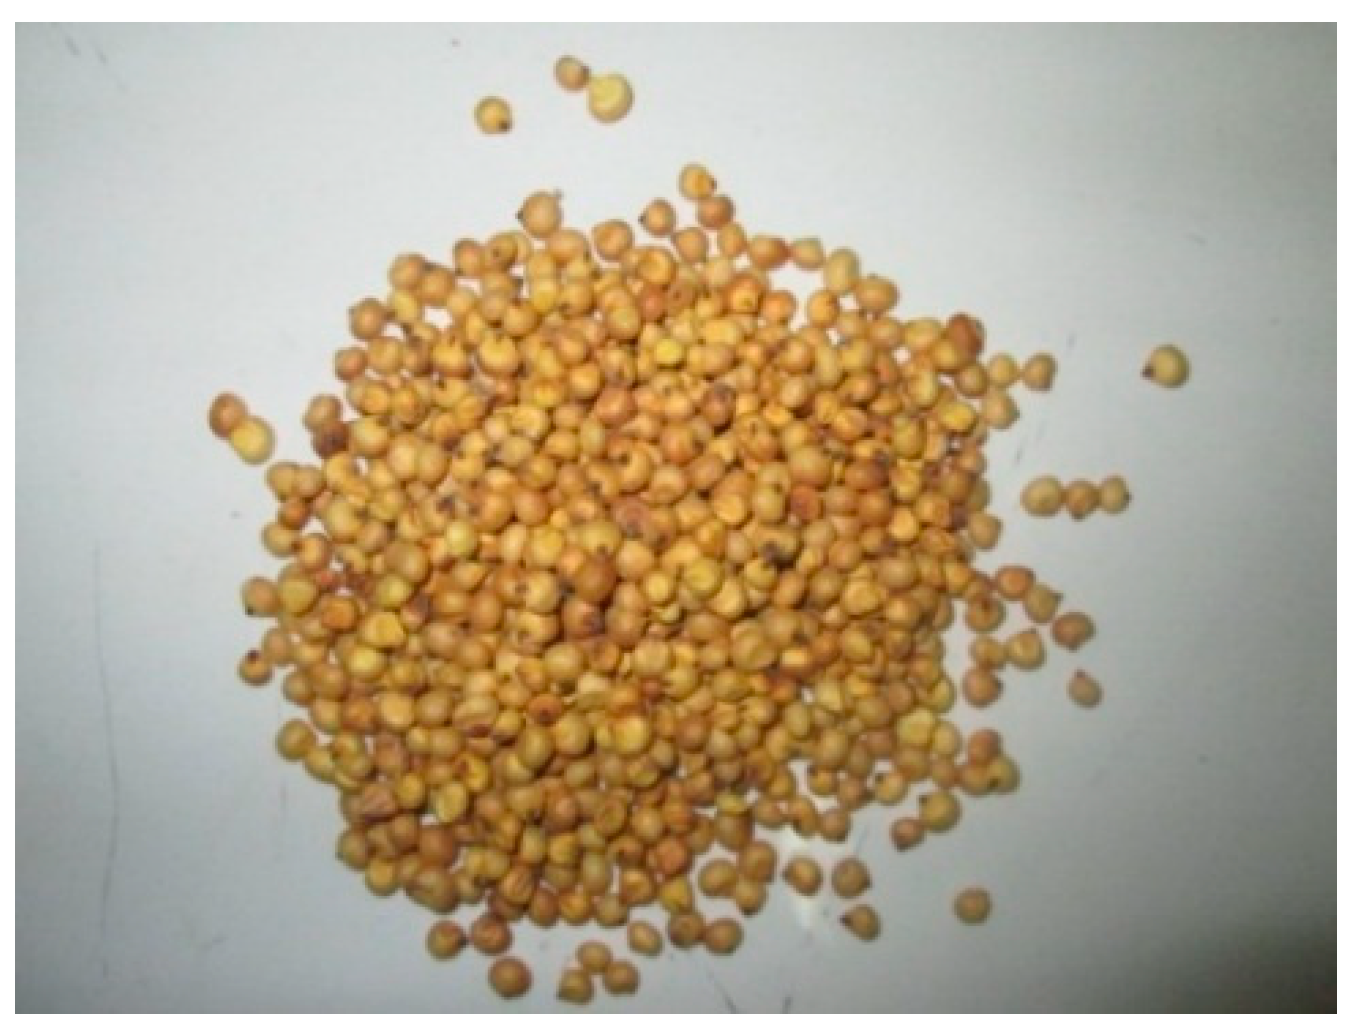
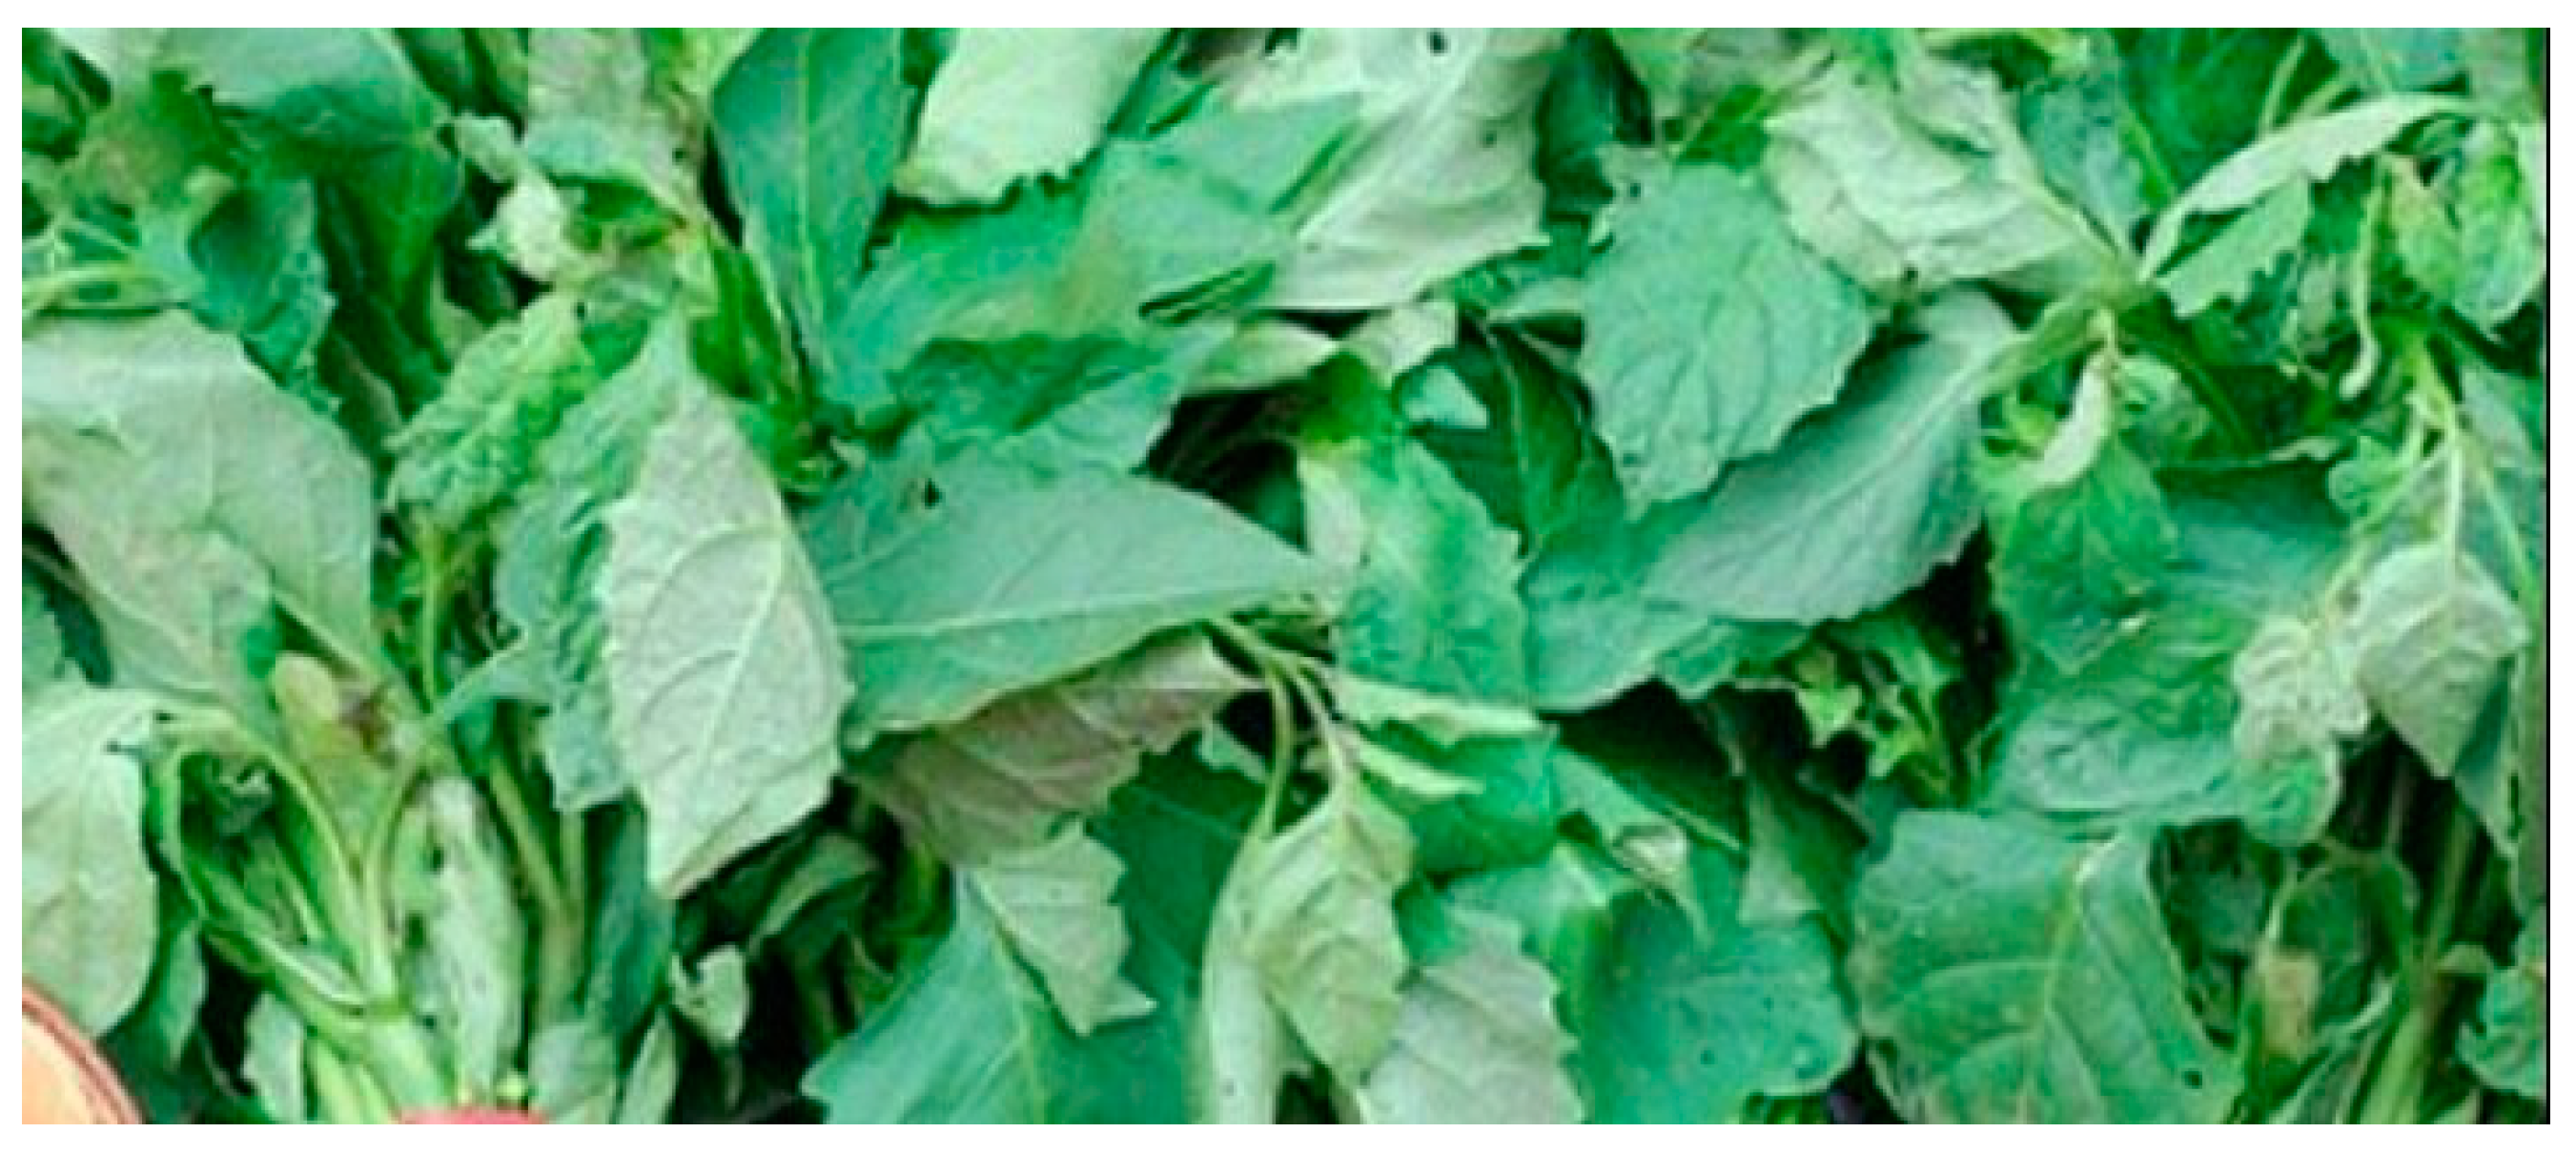
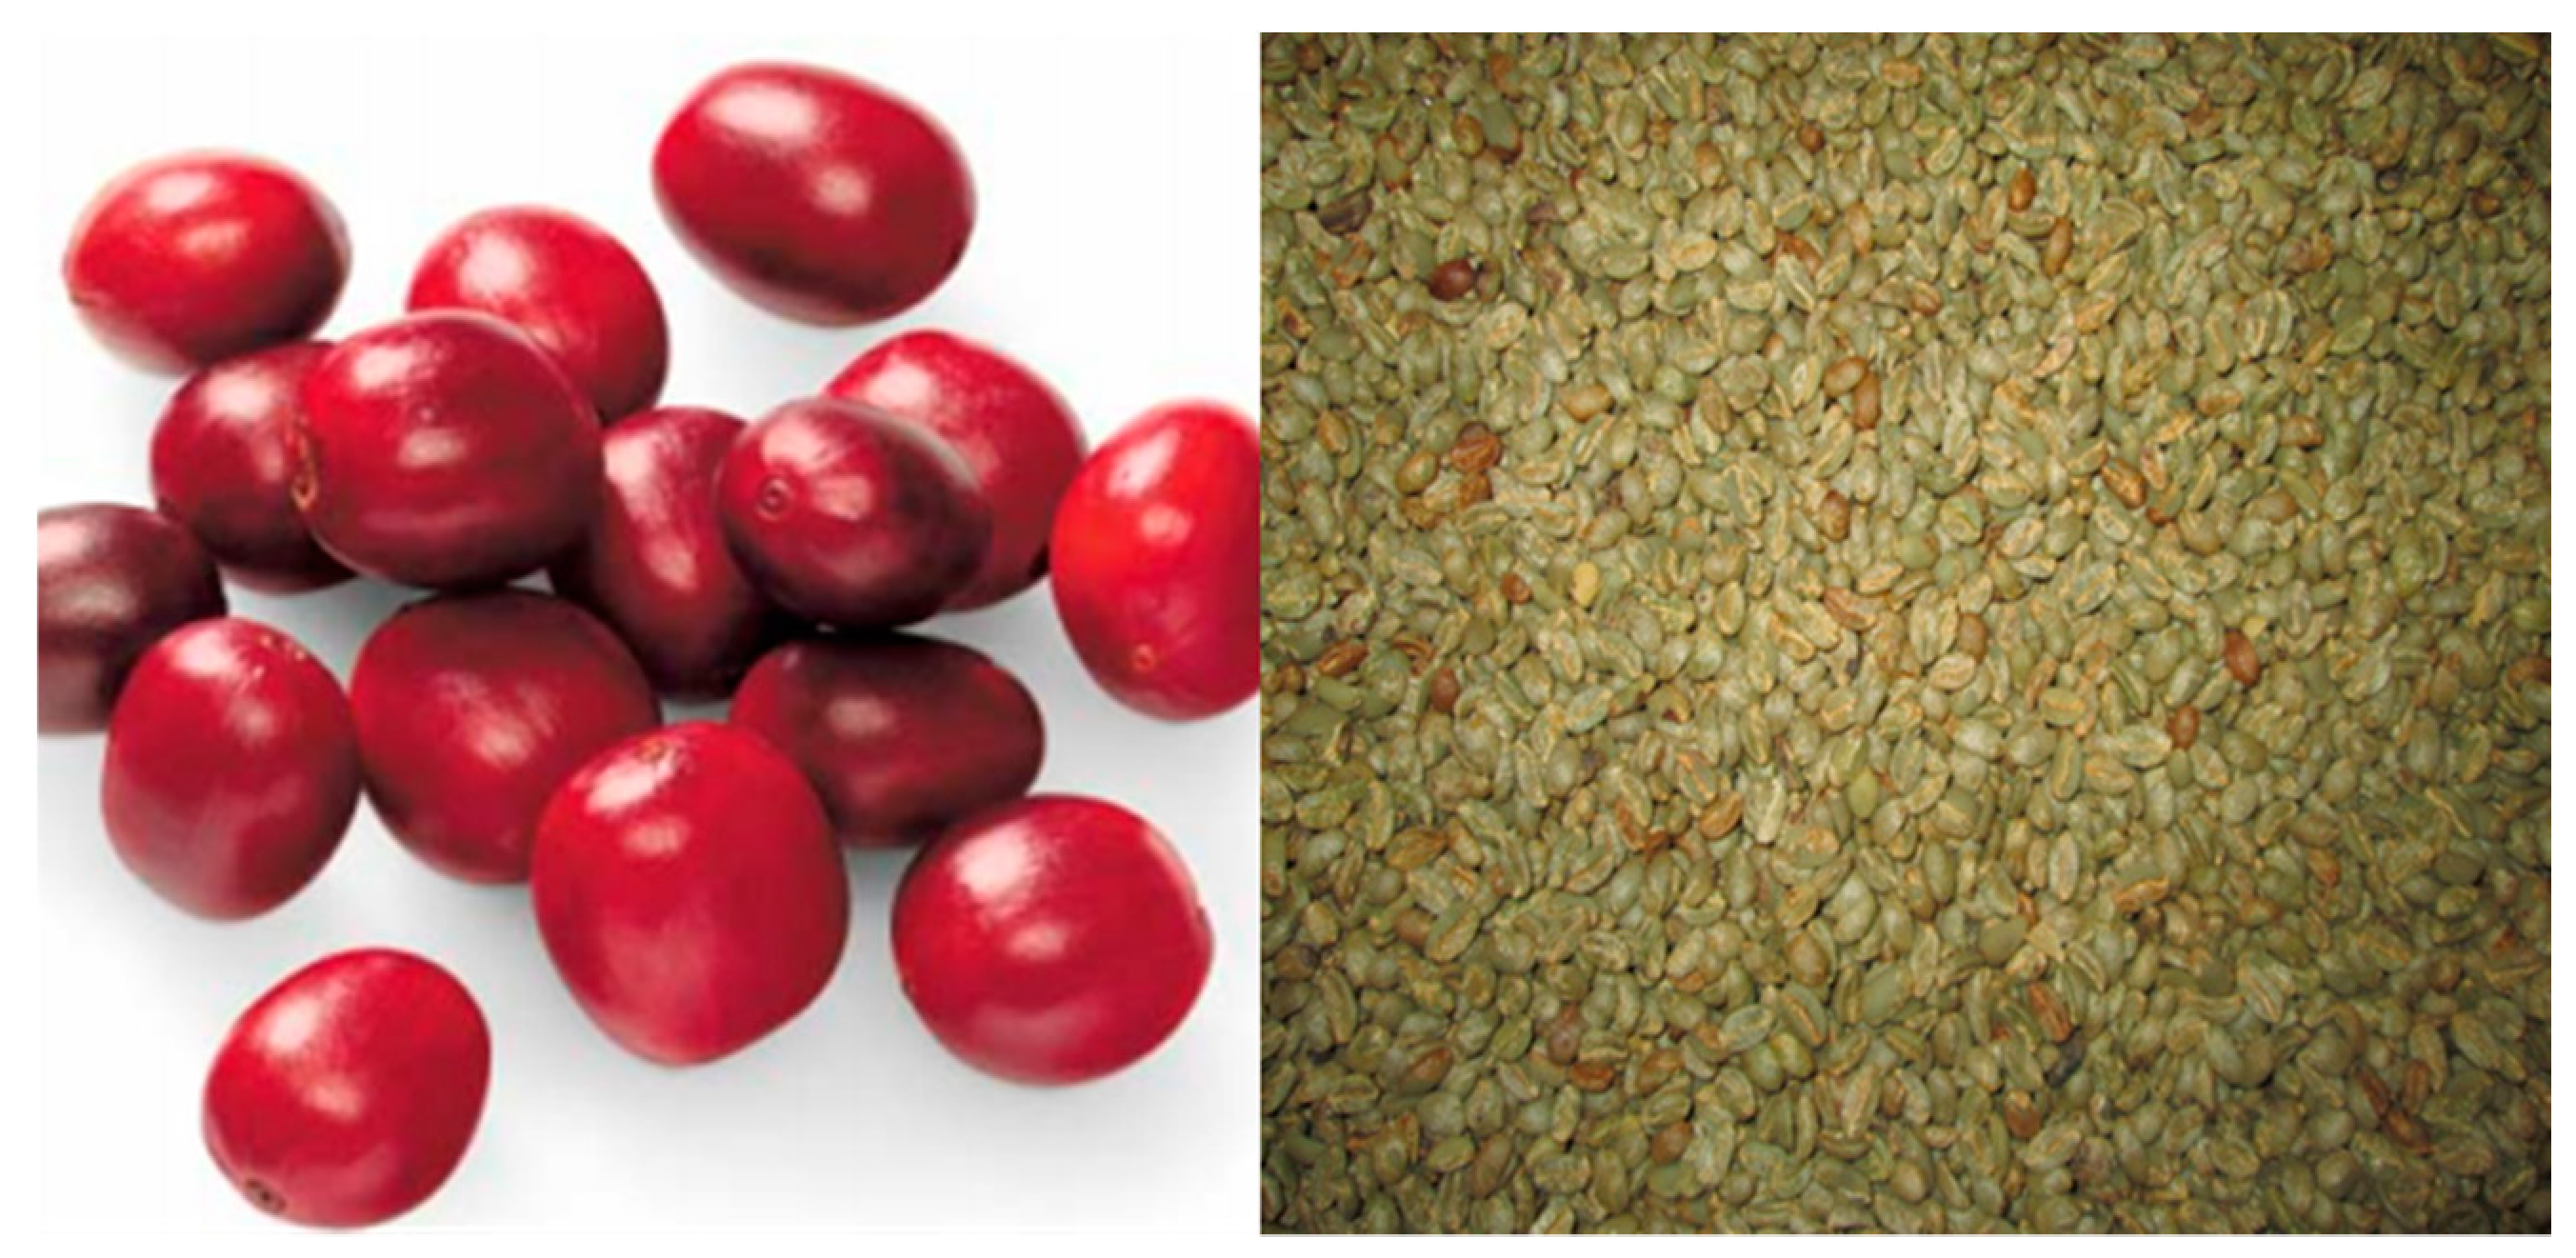
Safrari sorghum cultivar (Figure 1) used was obtained from the Institute of Research and Agronomic Development (IRAD), Maroua, Cameroon. The Vernonia amygdalina leaves (Figure 2) were harvested from farms in the Bini-dang neighborhood of Ngaoundere, Cameroon. Coffea arabica (Figure 3) beans used during this work were bought from a local cooperative society in Bafoussam, Cameroon.
The D-Lactose monohydrate was obtained from Sigma-Aldrich, Johannesburg, South Africa. Saccharomyces cerevisiae (Safbrew T-58) used for fermentation was obtained from “Malterie du Chateau”, Chemin du Couloury 1, 4800 Lambermont, Belgium. The characteristics of the commercial mashing enzymes used are: Hitempase 2XL®, a thermostable α-amylase from Bacillus licheniformis, and Bioglucanase TX, from an enzymatic composition of β-glucanase and hemicellulases from Trichoderma reesei and their sources, are presented in Table 1. Hitempase 2XL and Bioglucanase TX were obtained from Kerry Bioscience, Kilnagleary, Carrigaline, Co. Cork, Ireland.
2.2. General Work Overview
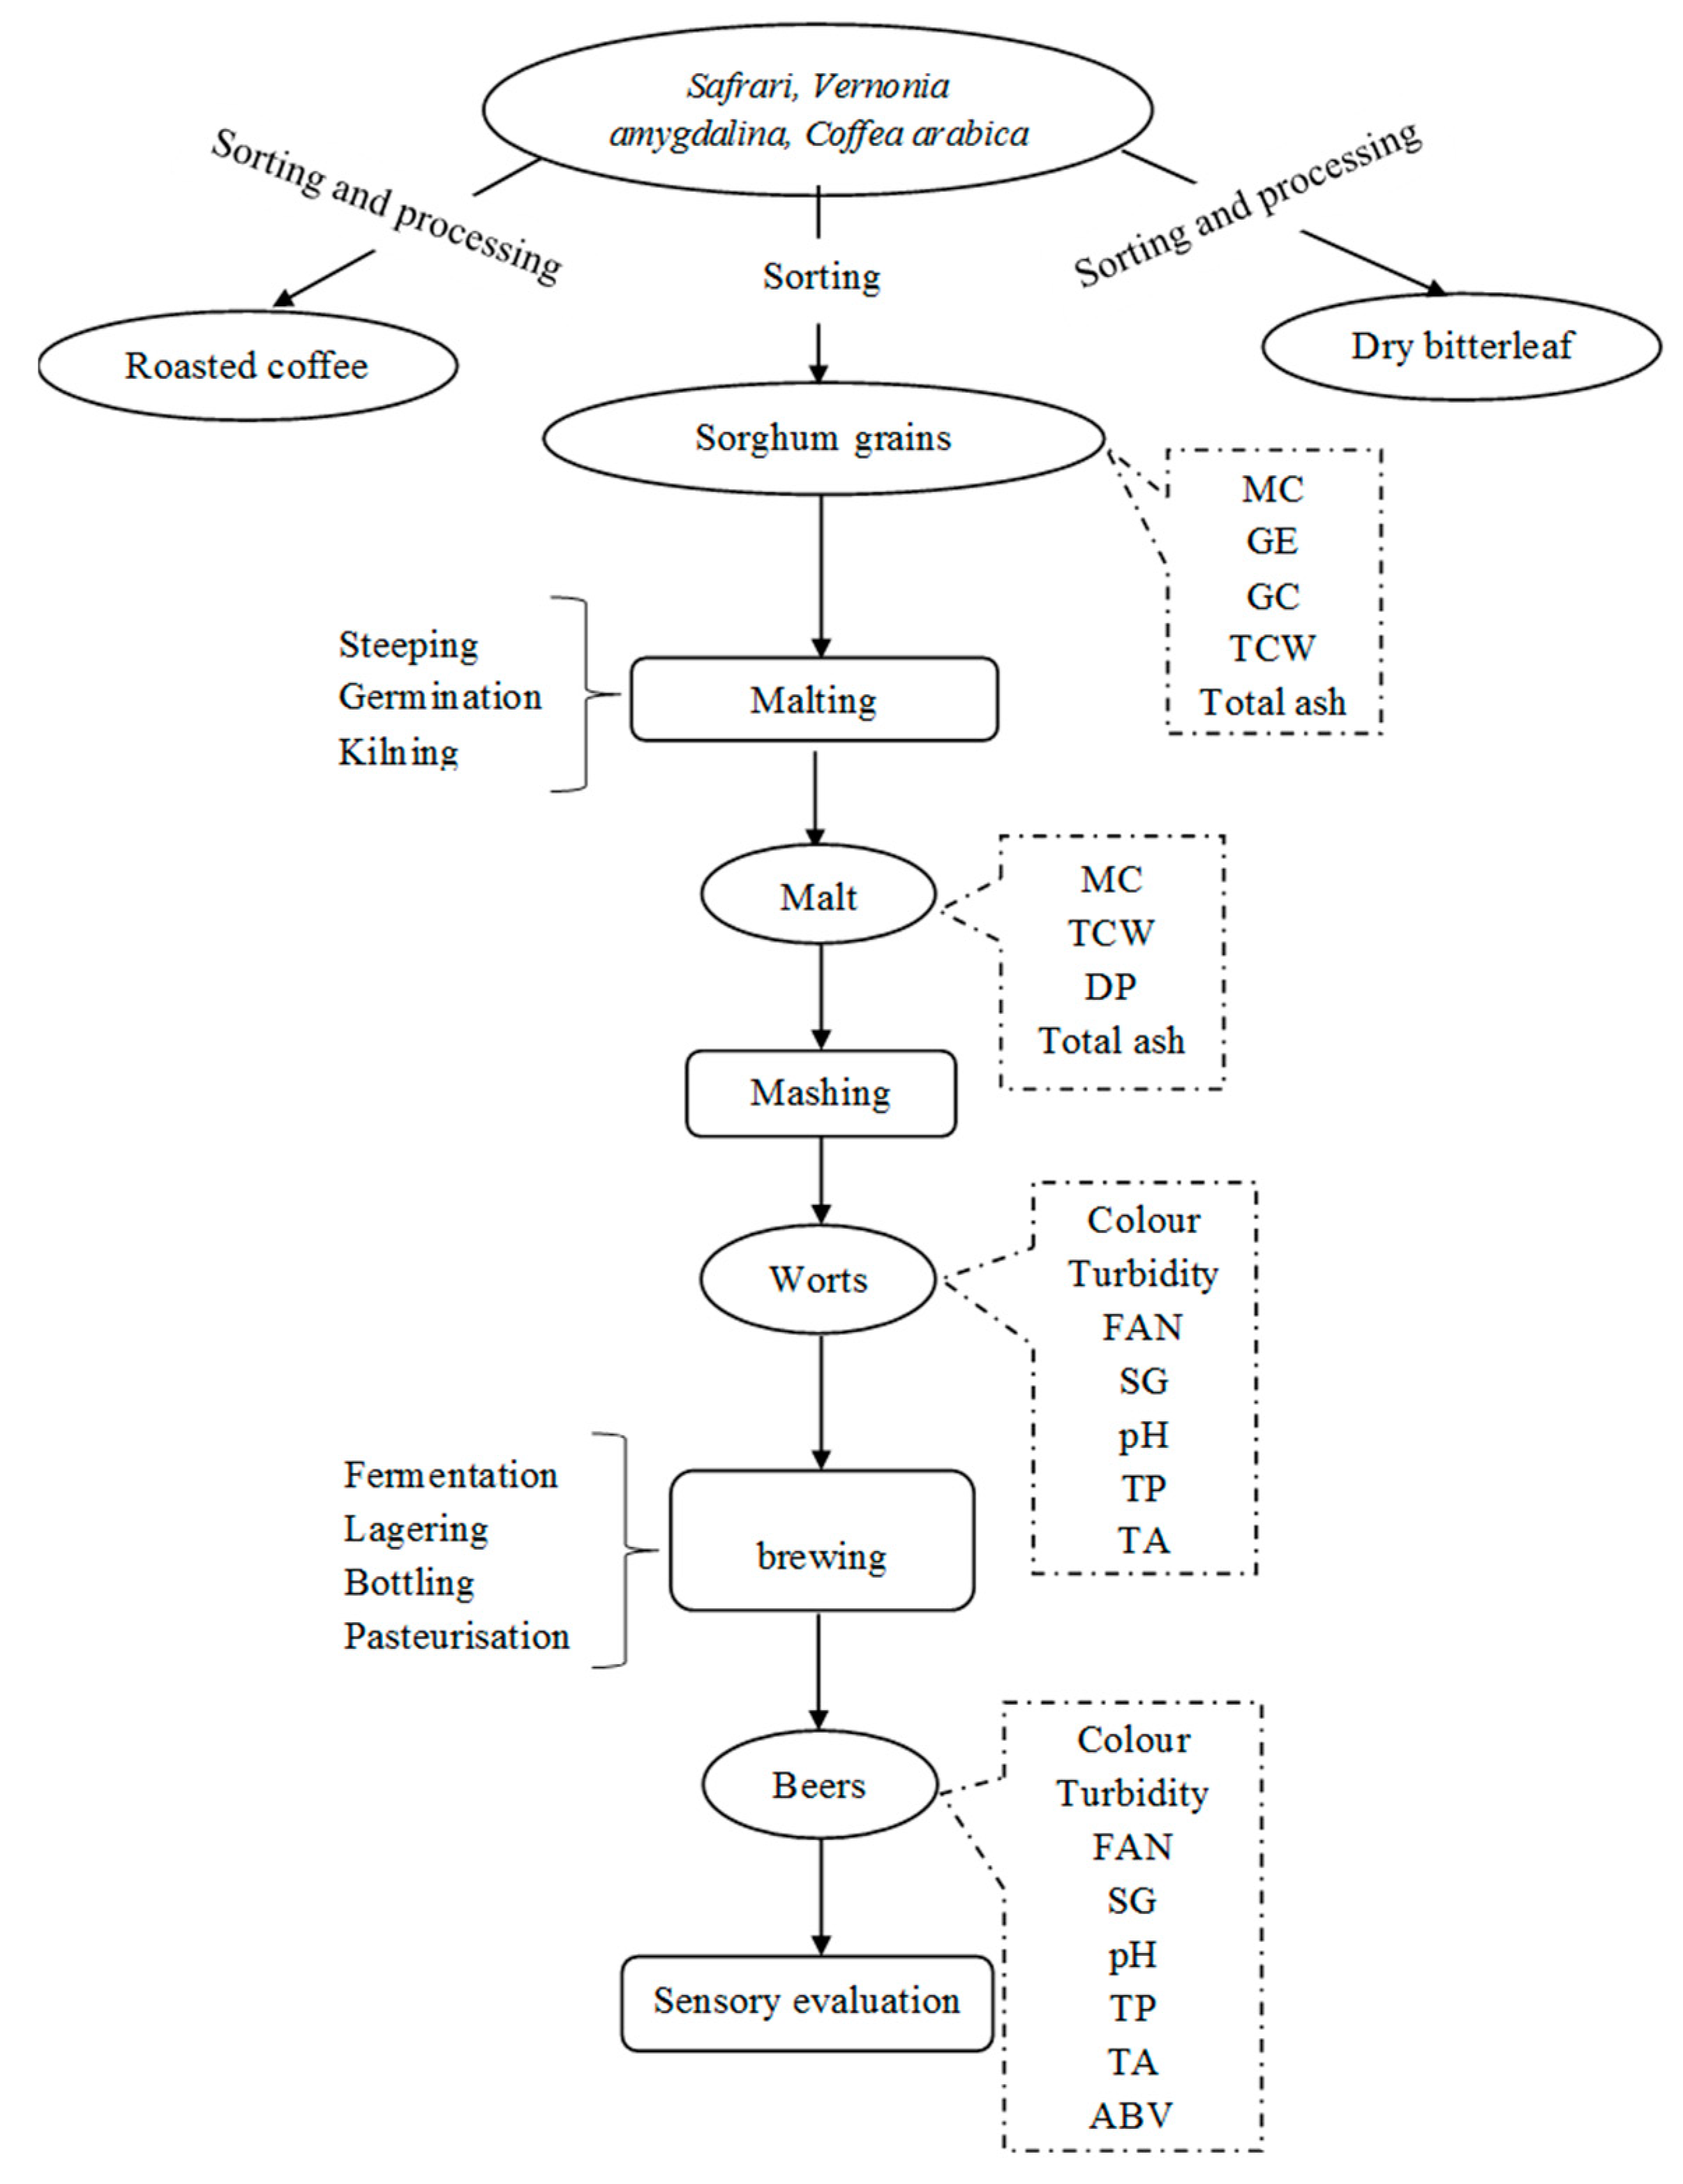
Safrari cultivar was sorted to obtain homogenous samples free from foreign materials, and broken and infected grains. The sorted grains were submitted to tests of acceptability and brewing potential, which included: the germinative capacity, germinative energy, moisture content, thousand corns weight, and total ash. The grains were then malted (Figure 4) and different malts were produced by varying the kilning program. Diastatic power of the pale malt was also determined. Malted grains were mashed with a supplement of exogenous enzymes (Hitempase 2XL and Bioglucanase TX). Coffee and D-Lactose monohydrate (lactose) were added during the boiling process of wort following a mixture design to produce worts of different formulations. Dry bitter leaves (Vernonia amygdalina) were used as a substitute to hops. Worts produced were fermented with Saccharomyces cerevisiae (Safbrew T-58) at ambient temperature (25 °C). Formulations of worts, as well as the corresponding beers produced, underwent physicochemical analyses. A sensory analysis of the beers was performed. It consisted of a hedonic nine-point verbal scale with 30 panellists.
2.3. Processing of Raw Bitter Leaves (Vernonia Amygdalina)
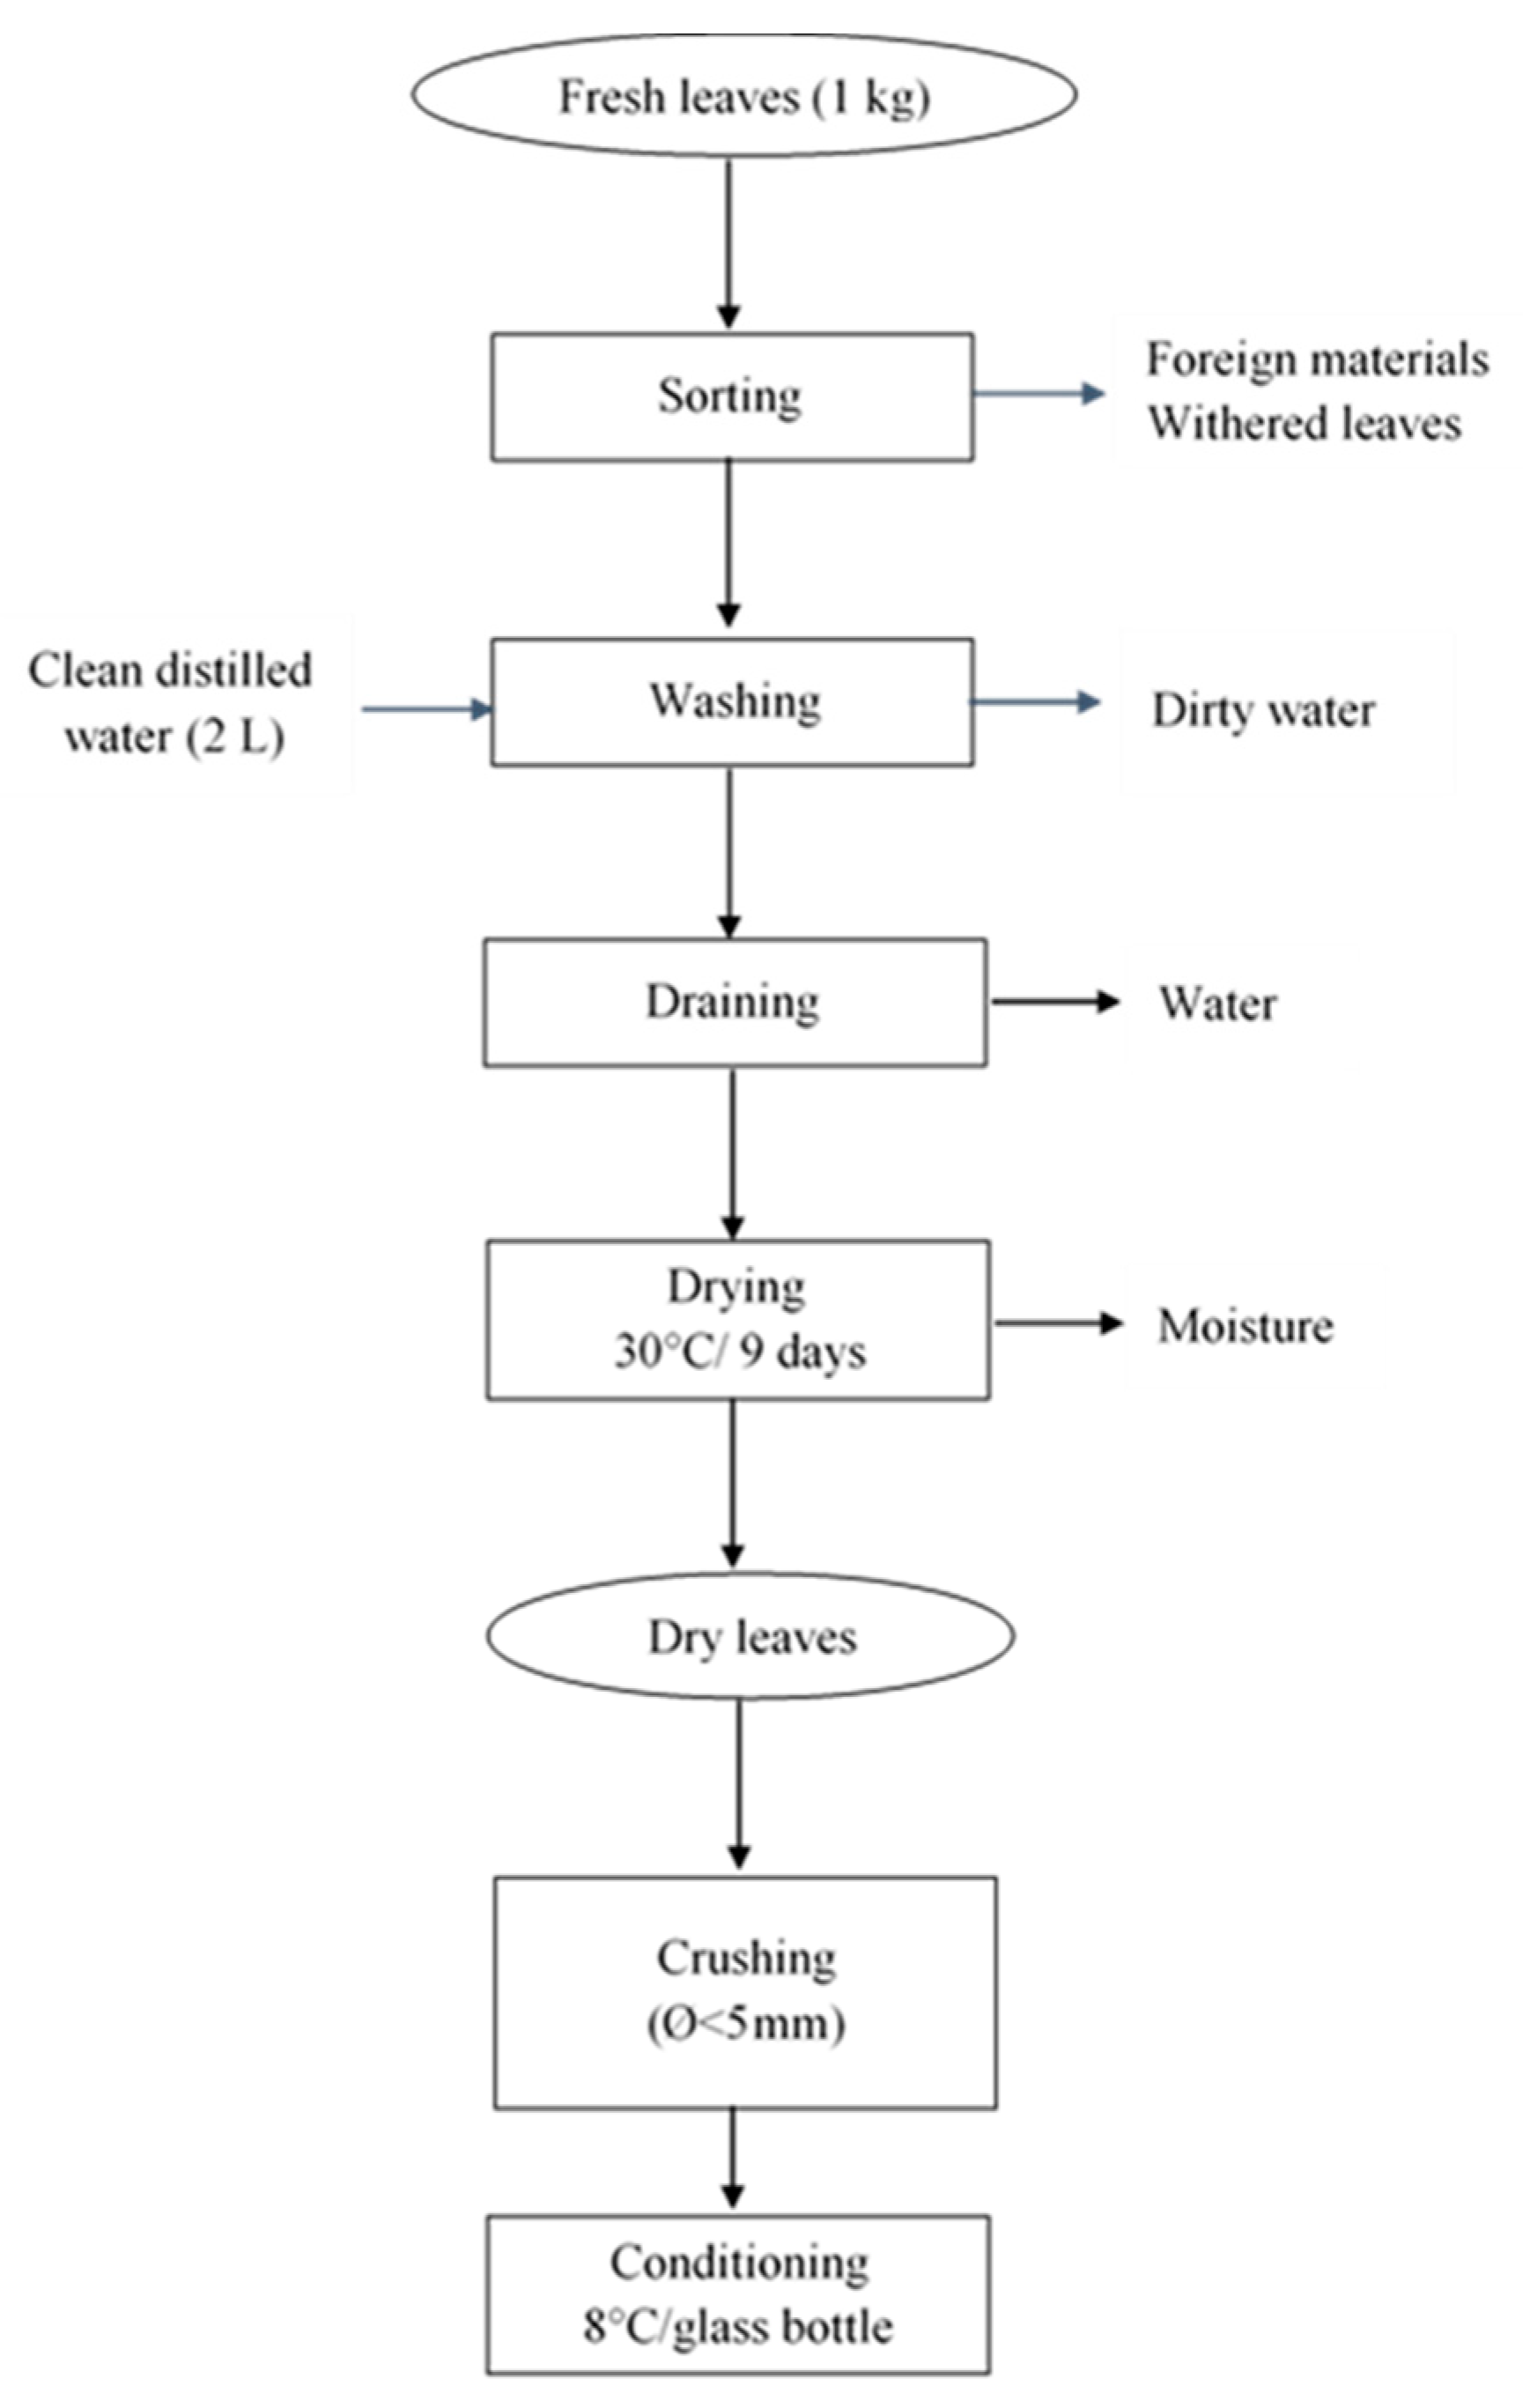
As showed in Figure 5, the leaves were screened to remove foreign bodies and withered leaves. They were thoroughly washed afterwards with tap water, rinsed, and oven-dried at 30 °C for 9 days. Dried leaves were hand crushed and conditioned in glass bottles, in a refrigerator at 4 °C.
2.4. Processing of Coffee Beans
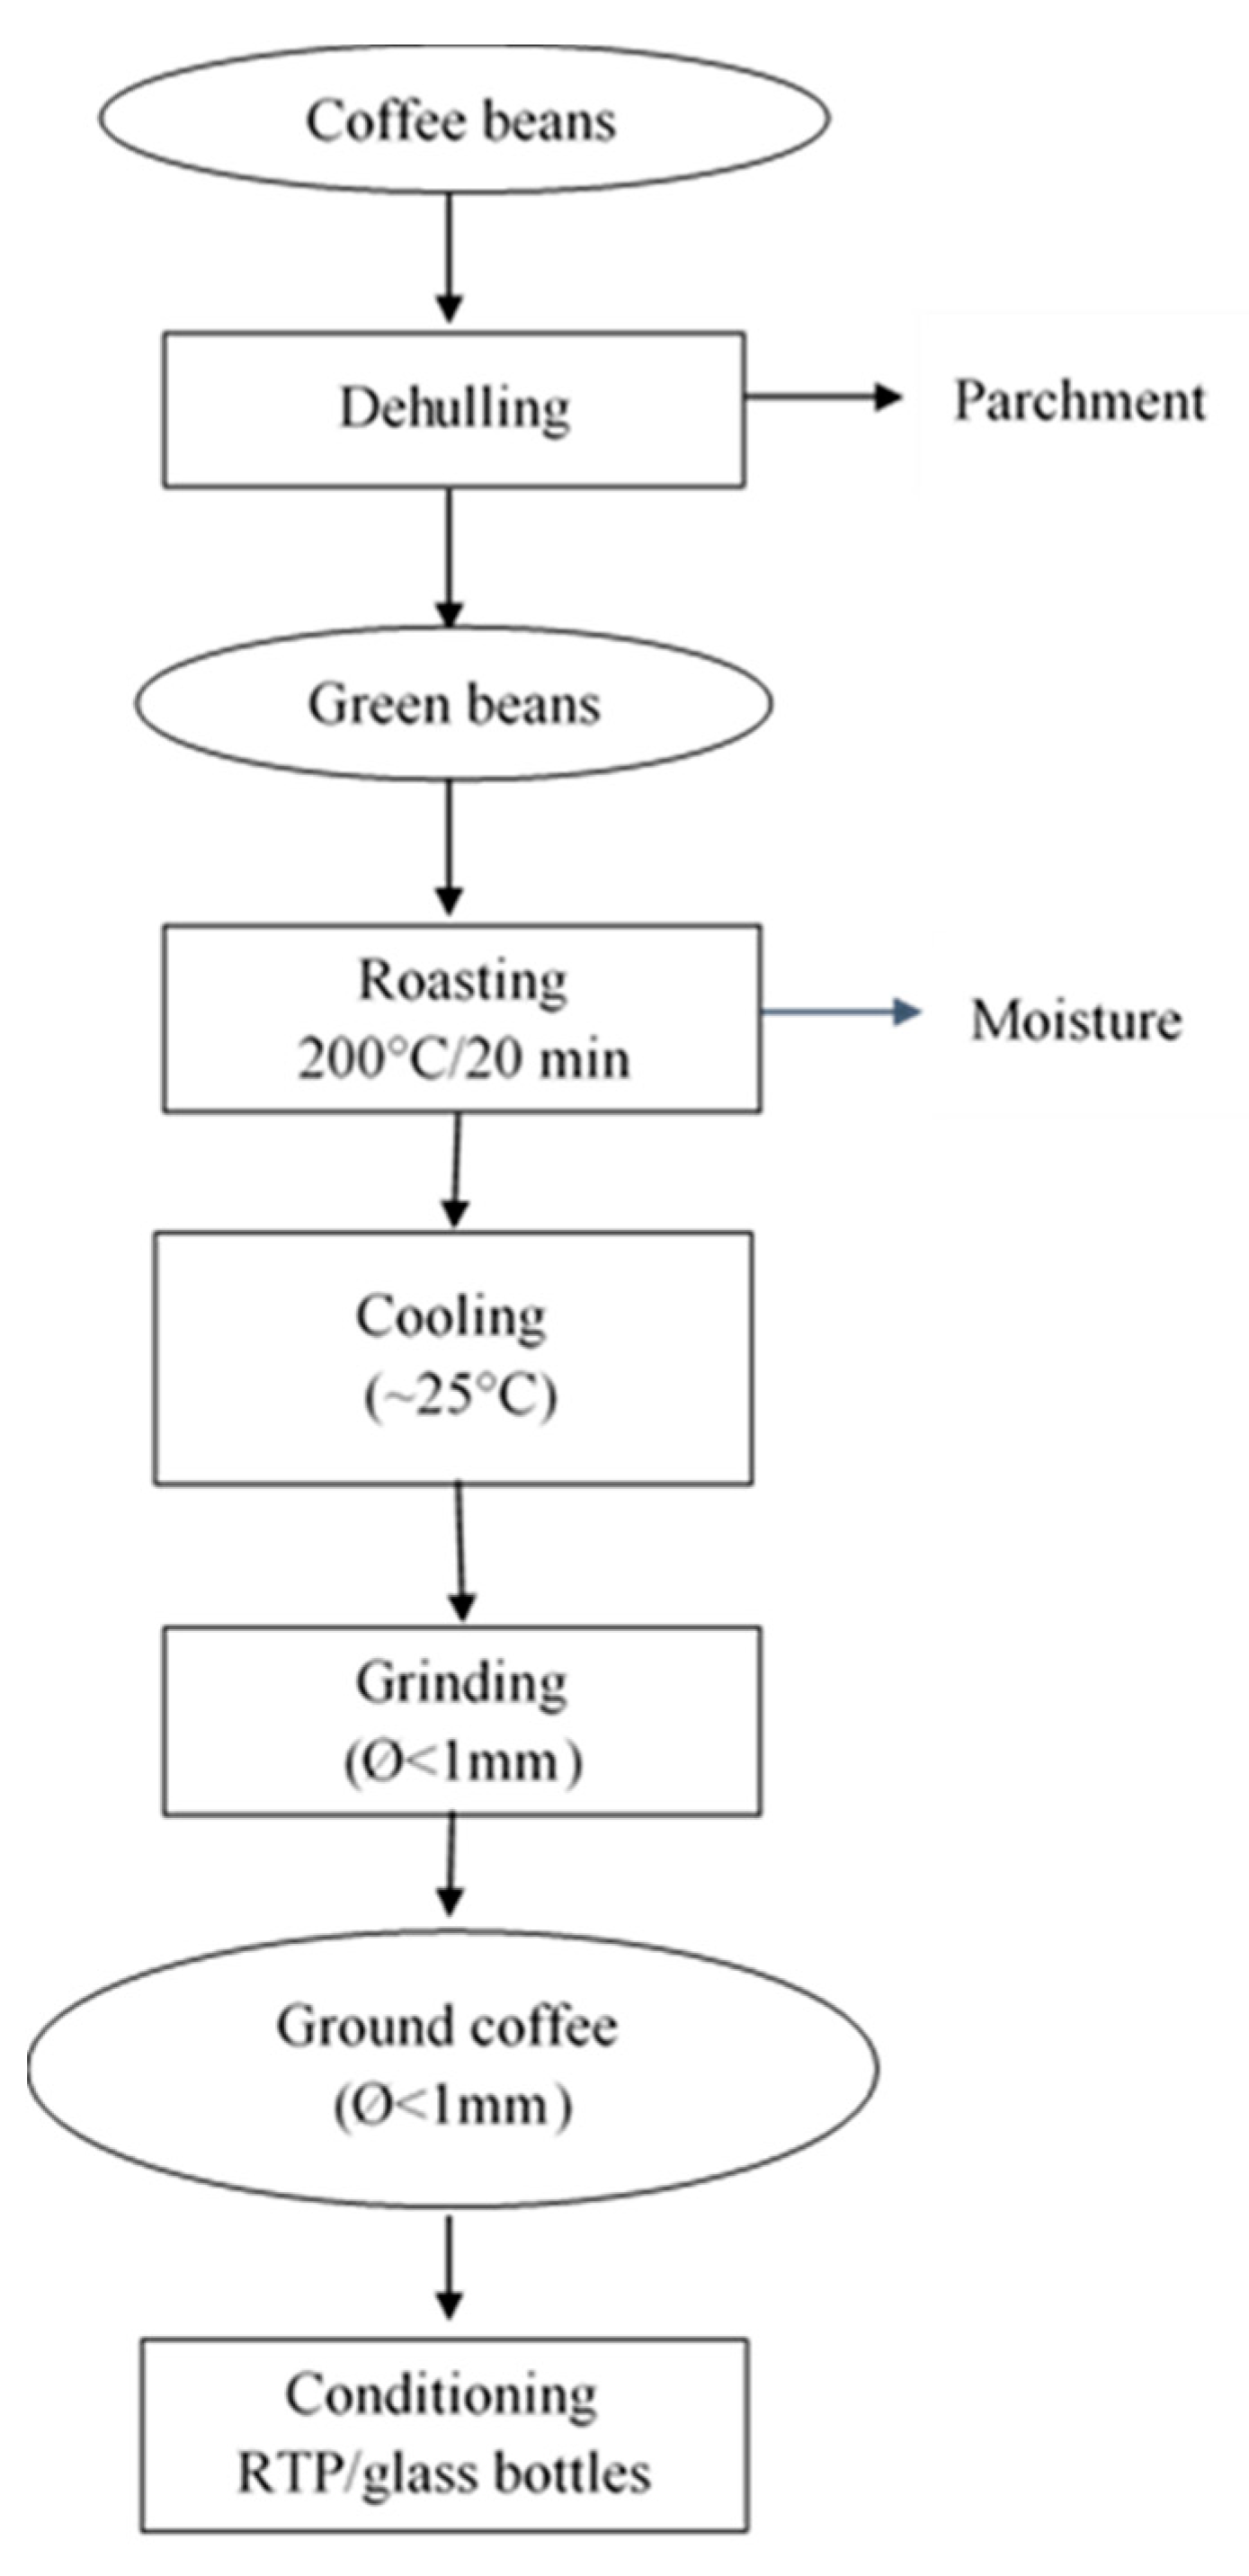
The coffee beans were bought with their parchment. They were thus dehulled manually to obtain the green beans. The green beans were roasted at 200 °C for 20 min in a Memmert ventilated oven (ULM/SLM 400–800), Germany. They were subsequently cooled before being ground and conditioned in glass bottles. Figure 6 depicts the process used.
2.5. Preparation of Sorghum Grains
Sorghum grains were cleaned by first manually sorting to remove deformed, small, broken, and immature kernels, dust, sand, stones, and other foreign materials.
2.6. Analysis of Sorghum Grain
2.6.1. Determination of the Germinative Energy of Sorghum
Two filter papers were placed at the bottom of two Petri dishes. A total of 4 mL and 8 mL of distilled water were accurately added [25].
Two lots of 100 corns were placed on the paper so that each made good contact without drowning the embryo by ensuring that the ventral side only touched the paper. After which, the dish was covered to prevent moisture loss, and placed in a dark cupboard. Chitted corns were removed after 24, 48, and 72 h from the beginning of steeping, thus avoiding excessive moisture uptake by those corns that germinated early. The germinative energy was calculated using the formula:
where is the germinative energy (%) and is the number of grains that had not chitted.
2.6.2. Determination of the Germinative Capacity of Sorghum
Three lots of 200 corns were obtained after removing foreign matter and half of the corns out of each of the lots of 200 corns was steeped in 200 mL of fresh H2O2 solution at a concentration of 7.5 g/L at room temperature (22–25 °C) for 2 days. After a day, the steep liquor was drained off and replaced with 200 mL of fresh H2O2 solution at room temperature. After 2 days of steeping the steep liquor was drained off and corns were separated and counted for those that had not developed both roots and acrospires [25]. The germinative capacity was calculated using the formula:
where is the germinative capacity (%) and is the number of grains that had not chitted.
2.6.3. Determination of the Thousand-Corn Weight of Sorghum
Three lots of 35 g of sorghum was sampled and weighed, and half of the corns and foreign matter was removed and the weight subtracted, after which the corns were counted in each lot. This experiment was repeated thrice to obtain a more precise and accurate value. The thousand-corn weight on the dry matter was calculated using a standard formula [25]:
where is the weight of a thousand corns of dry sorghum in g, is the weight of lot of sorghum taken in g, is the moisture% (m/m), and is the number of corns in each lot taken.
2.6.4. Determination of the Moisture Content
Twenty grams of sorghum was finely milled using a hand grinding machine and 5 g of the flour obtained was put in a clean dry dish and dried at of 105 °C for 24 h. The product was later removed from the oven and was immediately allowed to cool in a desiccator and weighed again. The moisture content percentage (%) of the sample was calculated using a standard formula [25]:
where is the moisture content (%), is the mass in g of the sample before drying, and is the mass in g after drying.
2.6.5. Determination of Total Ash
The sample was completely incinerated until obtaining white ash in a muffle furnace calibrated at 550 °C [26]. For that, the porcelain crucibles containing the samples resulting from drying at 105 ± 2 °C () were placed in the furnace. After incineration for 24 h, the crucibles were removed from the furnace by using grips, then cooled in the atmosphere of a desiccator and weighed (). The ash content per 100 g of DM (dry matter) was calculated using the formula:
where is the mass of the empty crucible.
2.7. Experimental Procedure for Malting Sorghum
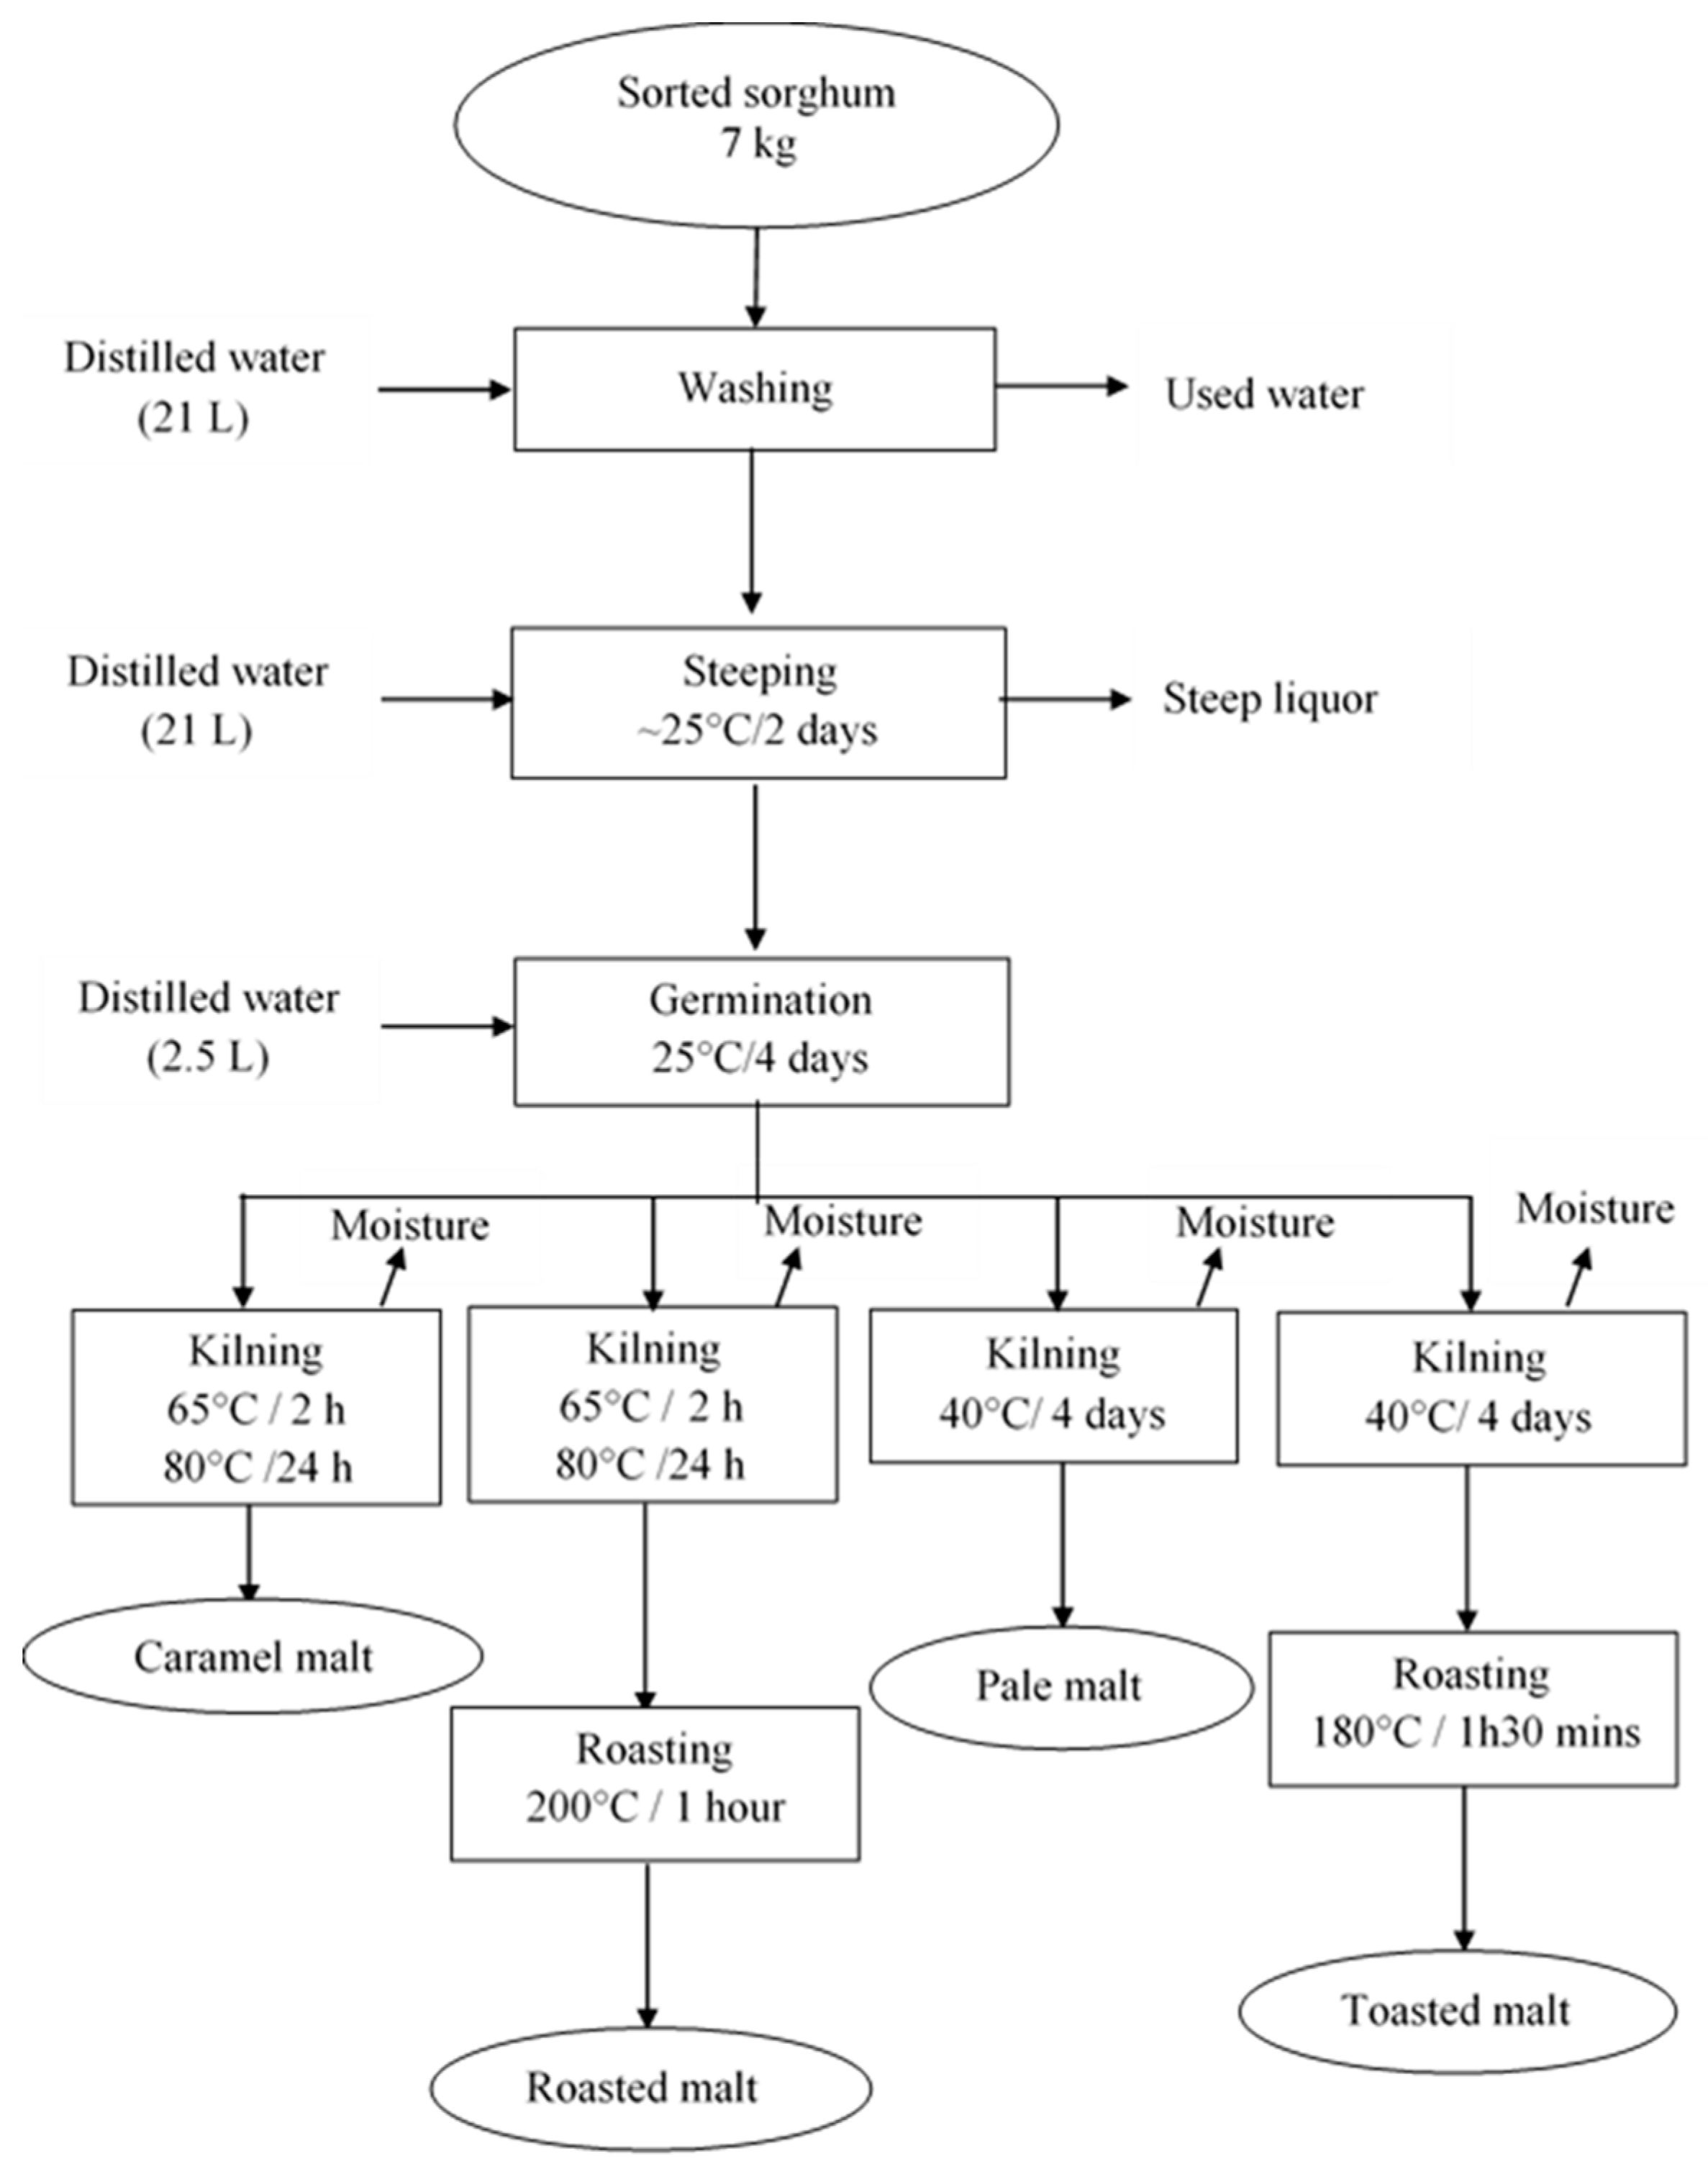
Seven kilograms of Safrari sorghum cultivar grains were washed three times using 21 L of distilled water to remove dirt and foreign bodies. Grains were steeped in 21 L of distilled water for 48 h at room temperature (≈25 °C) with three changes of water at intervals of 12 h before steep out. Germination was carried out for 4 days in a Heraeus type incubator (D-63450 Hanau, Germany) at a temperature of 25 °C with water sprinkled on the grains on a daily basis. The green malt was then kilned following different kilning programs to obtain characteristic malts used in the beer recipe. The malt was rubbed-off of its rootlets and stored until further use. Different malts were produced by varying the temperature and time for kilning the green malt [27]. Four malts were used in the course of this work: base malt, caramel malt, toasted malt, and roasted malt. Figure 7 shows the malting process.
2.8. Determination of the Diastatic Power of Pale Malt
For the enzyme extraction, a water bath was first set at 40 °C. Ten grams of flour was measured into a beaker and 480 mL of water added. The mixture was mixed to avoid balling. The beaker was placed in the water bath and mashed for 1 h while stirring continuously. The extraction solution was cooled to room temperature. The beaker contents were adjusted to 510 g. The contents of the beaker were stirred and transferred onto a filter. The first 200 mL were discarded and the next 50 mL immediately used for analysis. A hundred mililiters of starch solution was pipetted into a 200 mL volumetric flask. Five milliliters of sodium acetate buffer was added and the flask placed in the water bath at 20 °C and allowed to stand for 20 min. Five mililiters of the flour extract was added using a pipette, then the contents of the flask was shaken thoroughly and replaced in the bath for 30 min. Sodium hydroxide (4 mL) was added to the mix to inactivate the enzymes. The volume was made up to 200 mL with water and mixed well. The alkalinity of the solution was verified using a thymolphthalein solution. The blank was prepared by pipetting 100 mL of starch solution into a 200 mL volumetric flask. NaOH solution (2.35 mL) was then added and mixed thoroughly. The malt extract (5 mL) was then added and the volume made up to 200 mL. The alkalinity was also checked using the thymolphthalein solution. The determination of the reducing sugars was done by transferring a 50 mL aliquot of the digest into a 150 mL Erlenmeyer flask. Into this flask was added 25 mL of iodine solution and 3mL of sodium hydroxide, and was shaken. The flask was stoppered and allowed to stand for 15 min. Sulfuric acid (4.5 mL) was added and the unreacted iodine titrated with thiosulphate solution until the blue colour disappeared [25].
where, is the diastatic power on sample in Windisch–Kolbach (WK) units; is the diastatic power on dry malt in Windisch–Kolbach units; is the titration value of the unreacted iodine in the blank test, in mL; is the titration value of unreacted iodine in the test portion, in mL; is the correction factor to obtain the result per 100g of flour used for the extraction; and is the moisture content of the flour in percentage (m/m).
2.9. Experimental Procedure for Mashing Sorghum
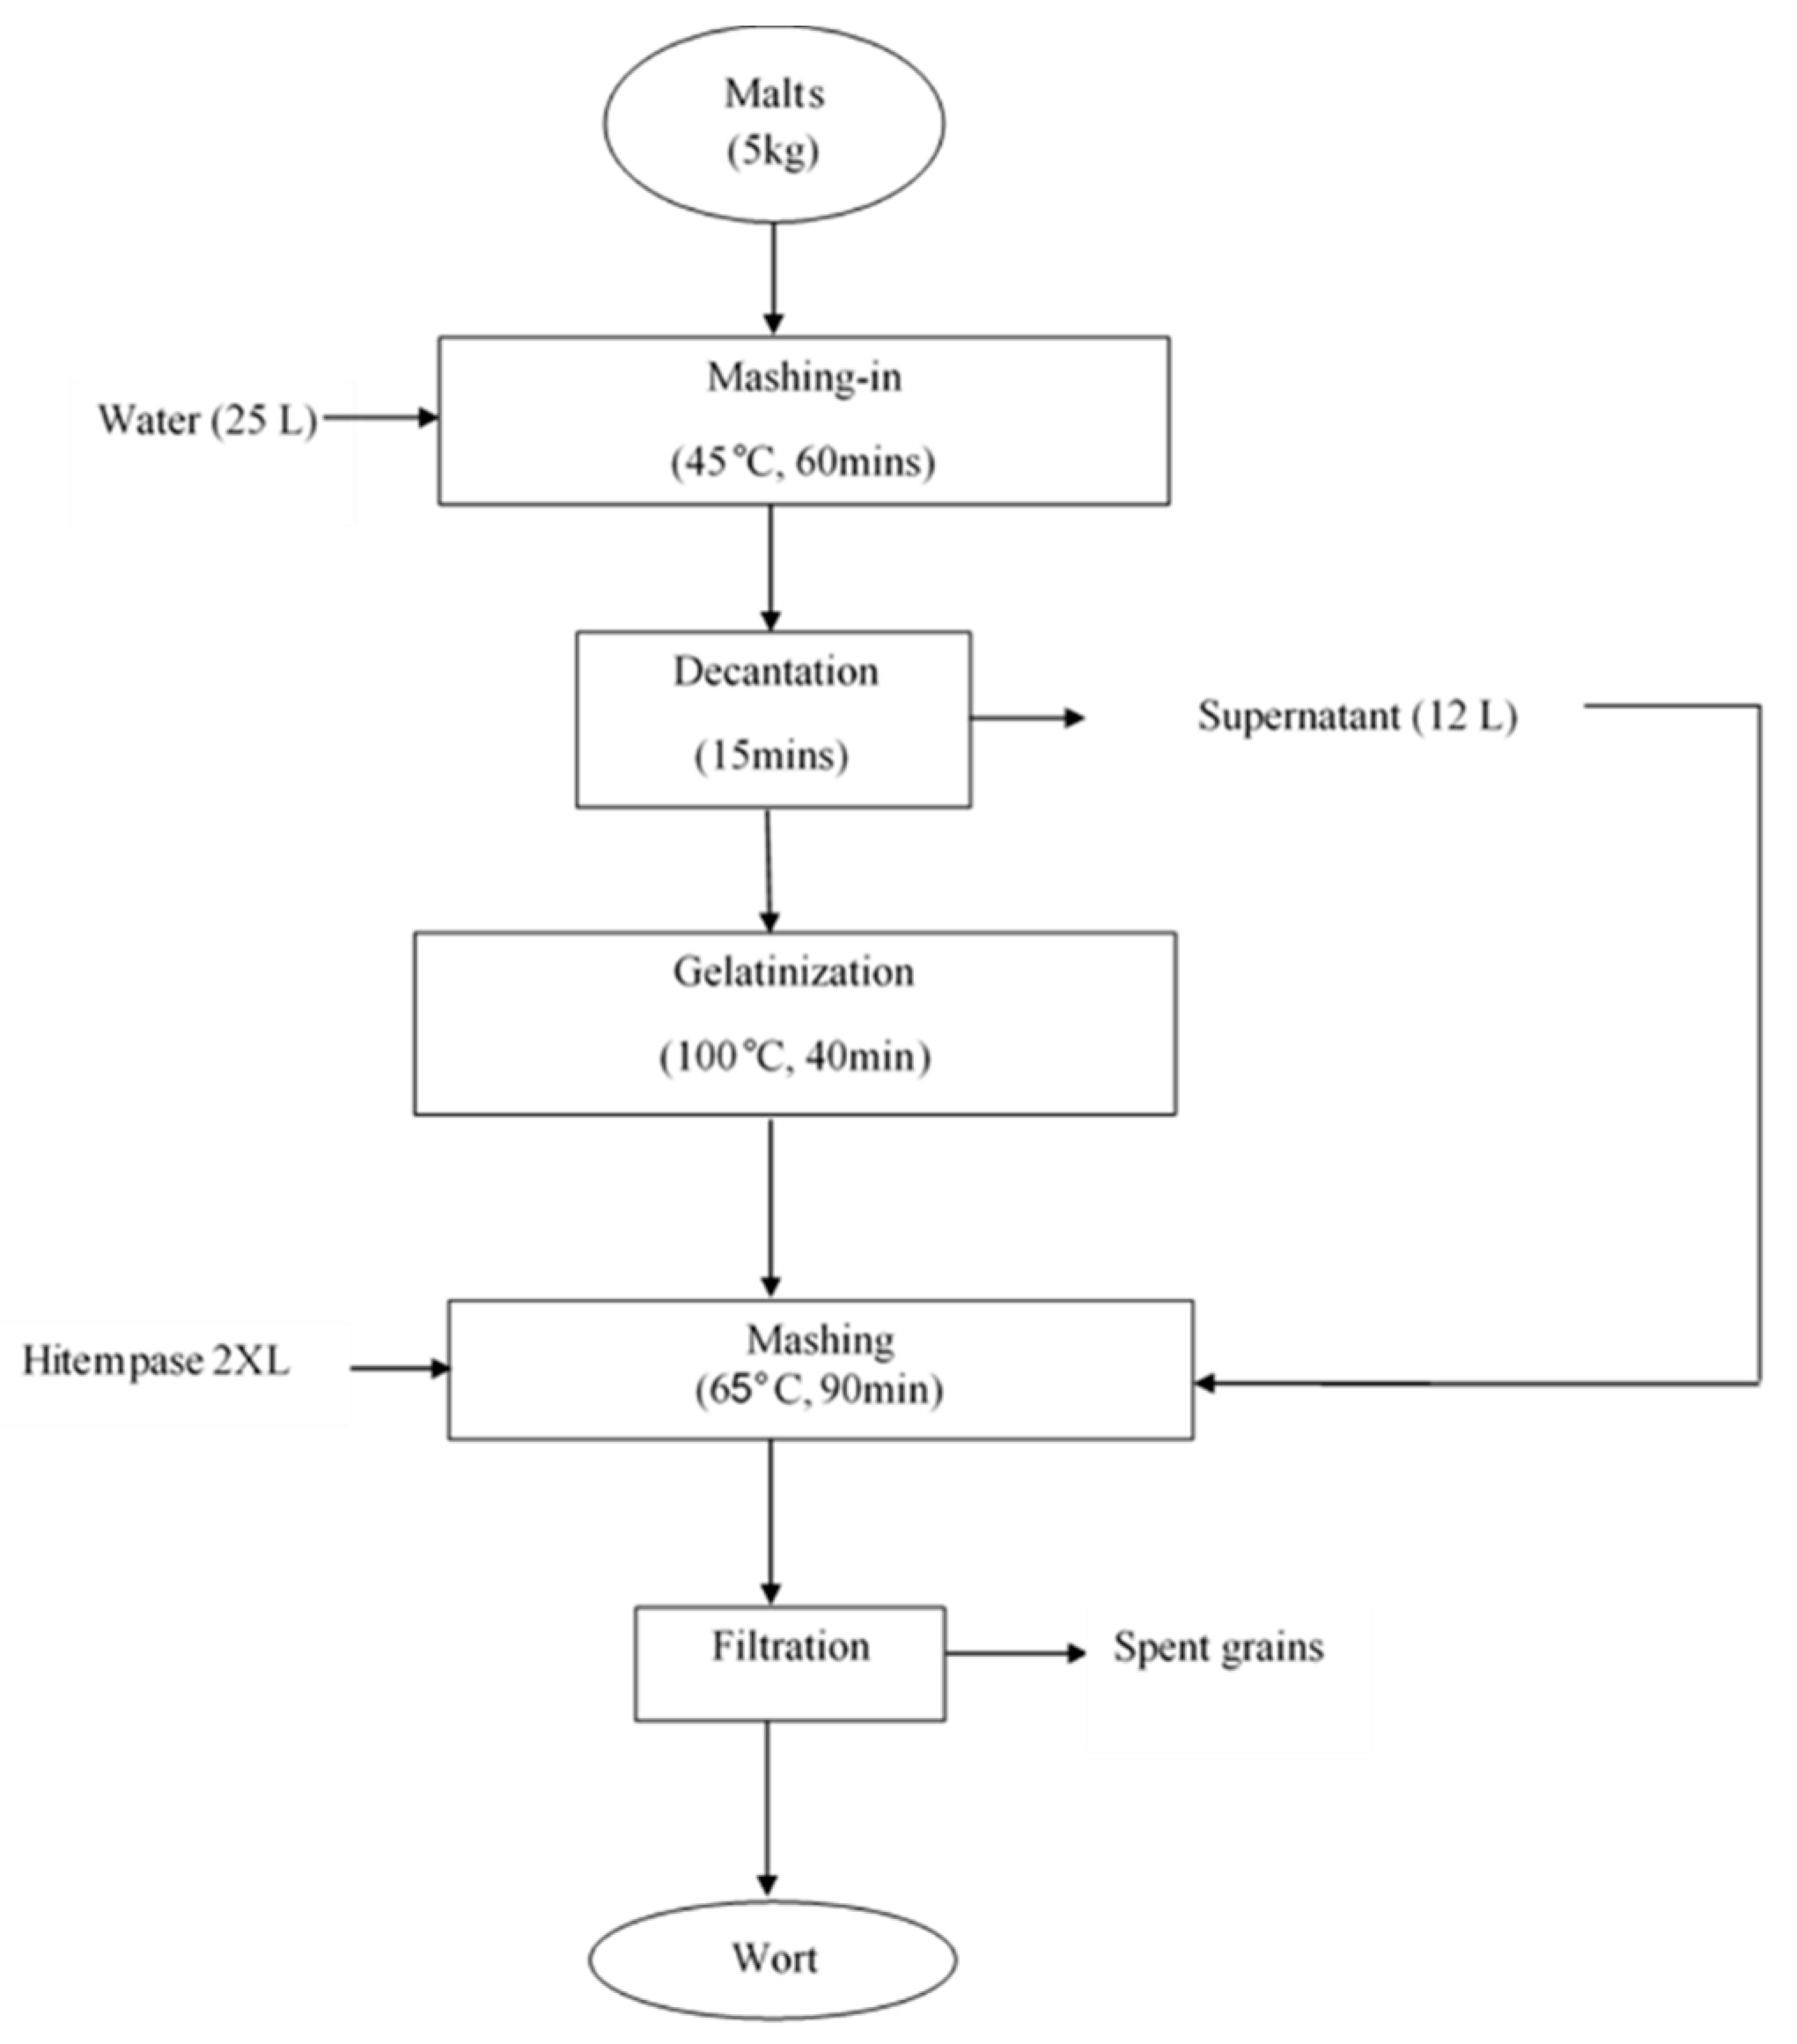
A decantation mashing program [7] for sorghum was adopted for the study (Figure 8). The quantities and types of malts used are given in Table 2 below. It was done according to preliminary studies.
Twenty-five litres of distilled water was put into a stainless-steel pot and 5 kg of a mixture of sorghum malts (flour Ø < 1 mm) as given in Table 2, added with continuous stirring until a homogenous mixture was obtained. This mixture was kept at 45 °C for 1 h with intermittent stirring at intervals of 5 min. The mixture was allowed to decant and 12 L of the supernatant was withdrawn and kept aside. The temperature of the mash was then raised to boiling so as to gelatinize the sorghum starch. This was done for 40 min with intermittent stirring at intervals of 5 min before cooling to 65 °C. The supernatant withdrawn together with the commercial enzymes (Hitempase 2XL) were added to the mash and held at 65 °C for 1 h 30 min with intermittent stirring at intervals of 10 min. The mash was filtered at 25 °C using Whatmann no. 4 paper to obtain the sweet wort.
2.10. Wort Boiling
The motherwort was divided into five portions of 5 L. Each portion (5 L) of wort was boiled for an hour. During boiling, 35 g of dry bitter leaves per 5 L was added as a substitute for hops. Coffee and lactose (lactose) in a proportion of 10% (w/v) was also added 5 min before the end of wort boiling following a mixture design generated by the software Design Expert ® Version 7.0.0 (Stat-Ease, Inc. 2021 East Hennepin Ave., Suite 480 Minneapolis, MN 55413) as showed in Table 3 below.
2.11. Clarification and Fermentation
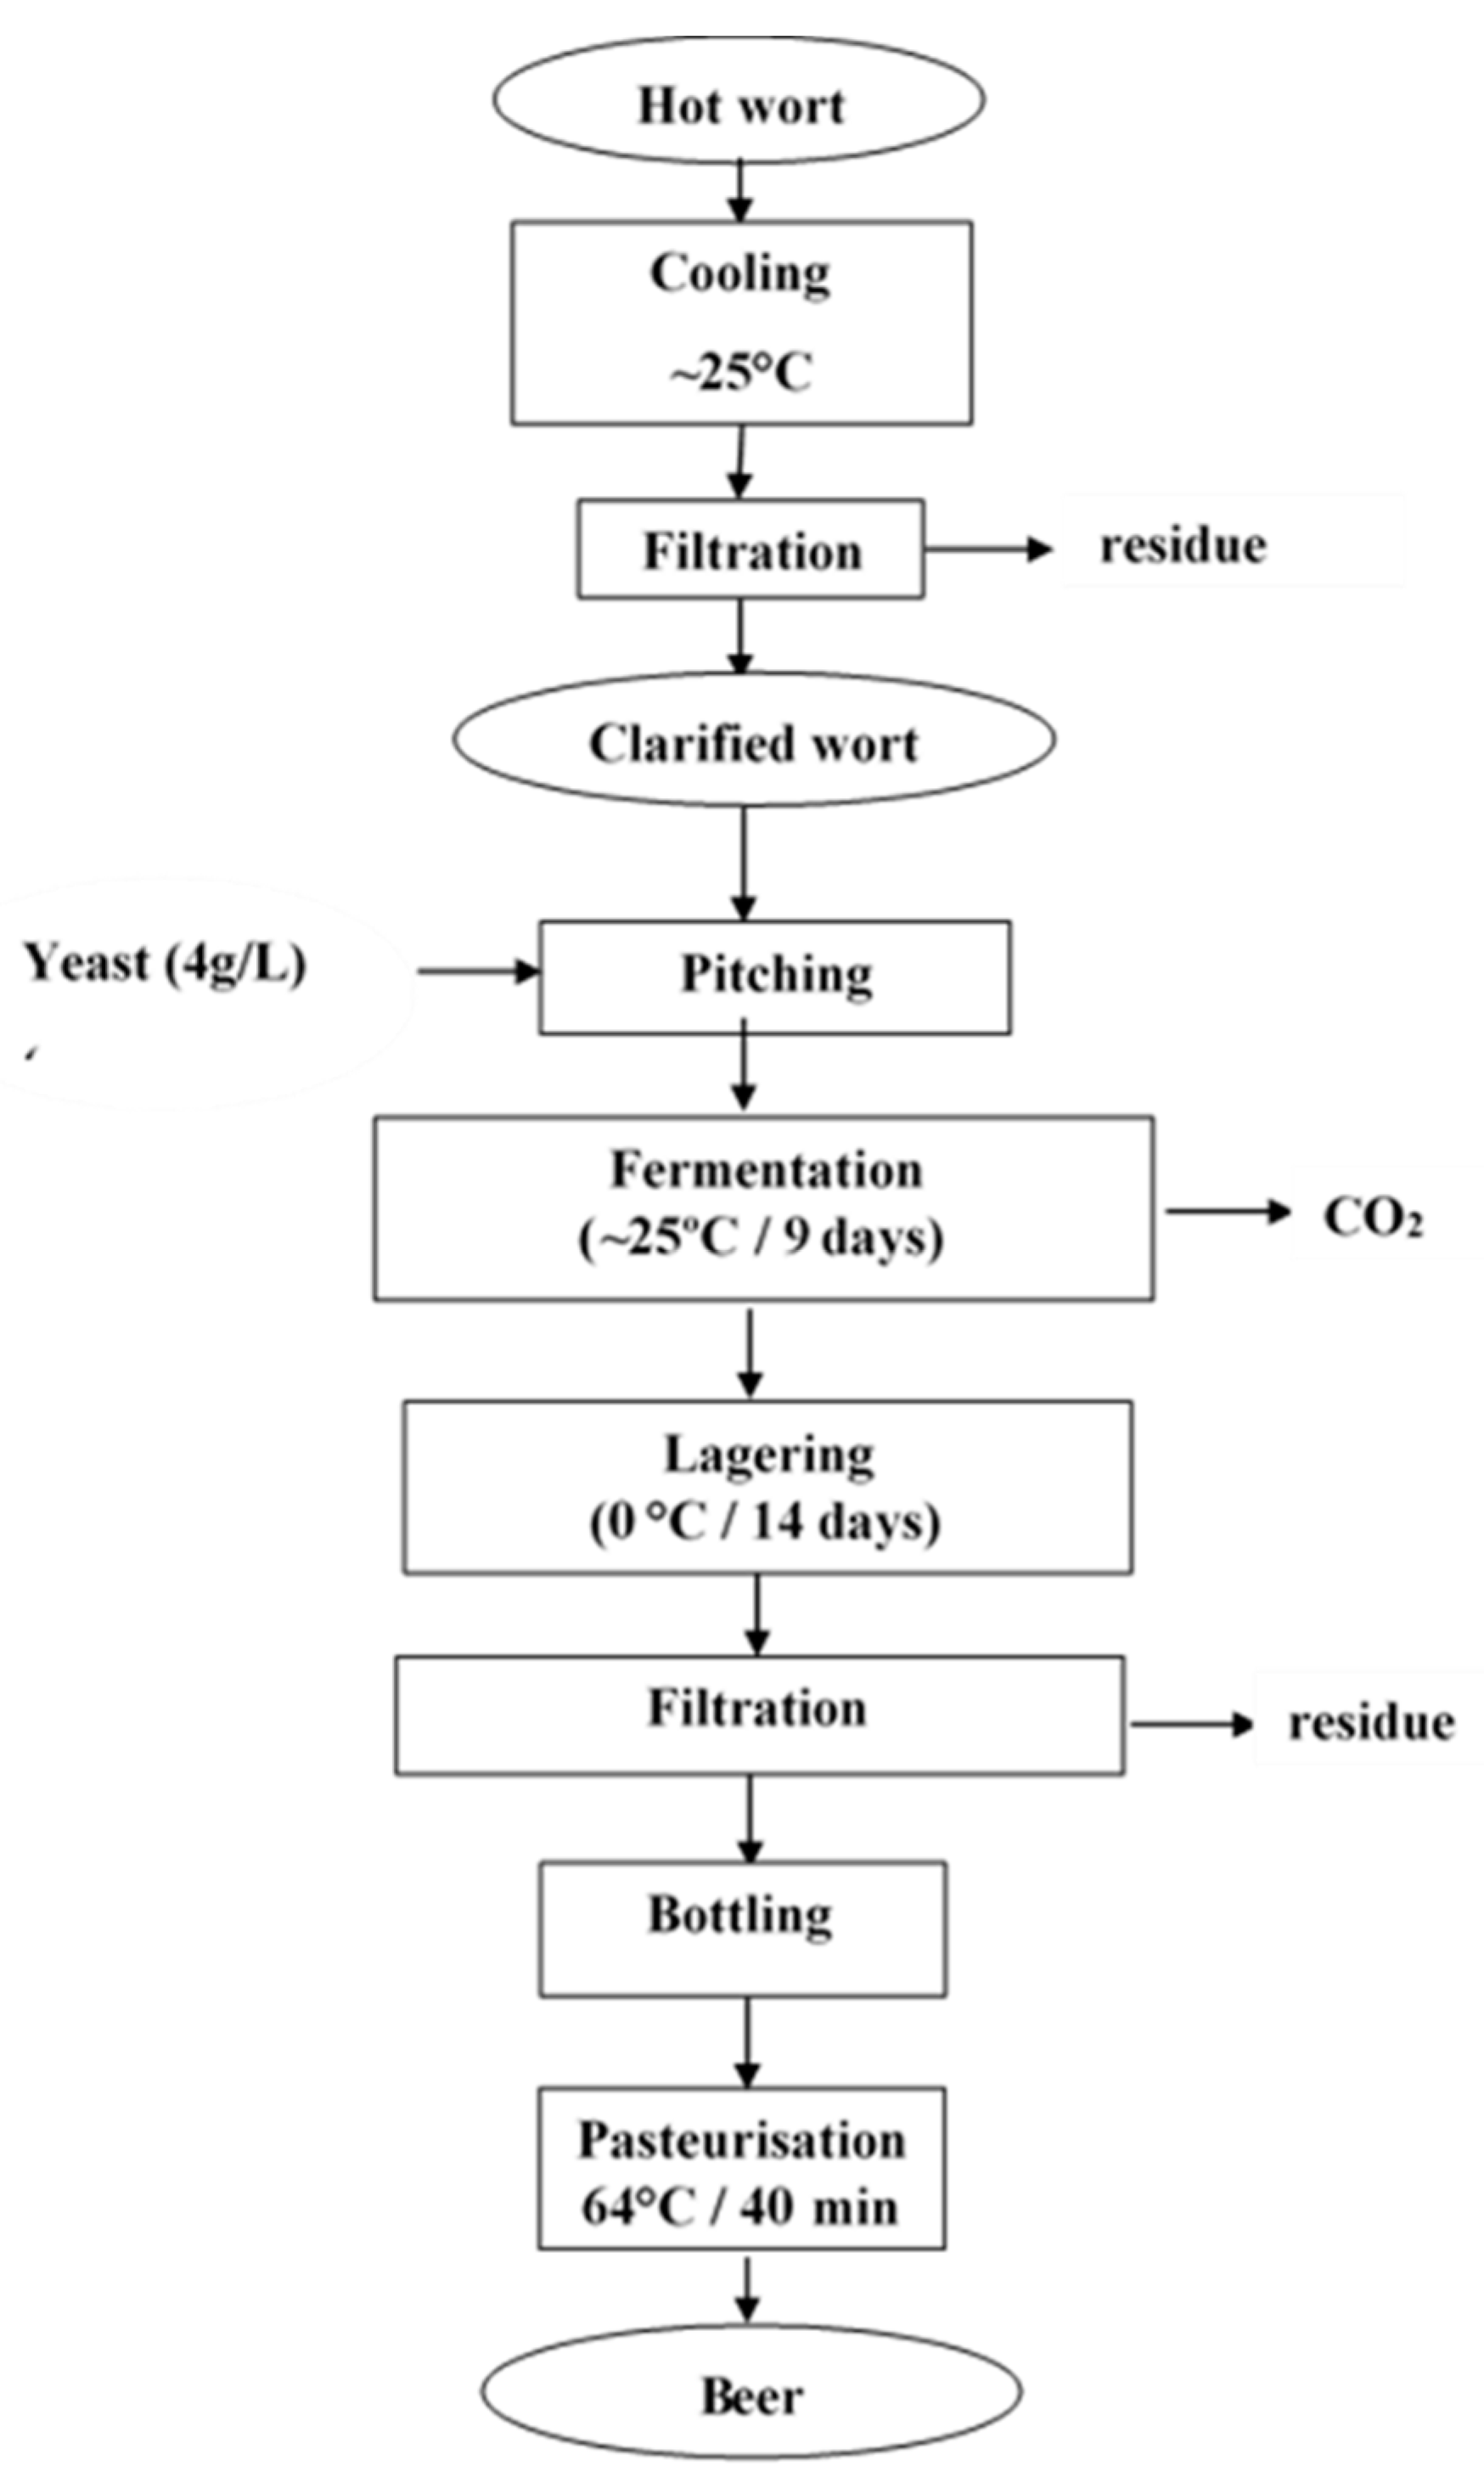
The bitter worts were then cooled to room temperature, filtered to clarify them, characterized, pitched, and then fermented at room temperature for 9 days. Figure 9 illustrates the fermentation scheme.
2.12. Physicochemical Analyses of Worts and Beers
2.12.1. Determination of Specific Gravity (Analytica-EBC, 1998)
A thoroughly cleaned pycnometer was washed and rinsed with distilled water. It was then dried in an oven set at 105 °C for 5 min and then cooled in a desiccator. The initial mass of the pycnometer was weighed and then filled with the sample (wort, beer). The difference in mass between the empty pycnometer and when it was filled with the sample was evaluated. This mass was used to calculate the specific gravity by dividing the value obtained by 25 mL, which corresponds to the volume of the calibrated pycnometer. The specific gravity thus calculated was checked across an extract table for the corresponding concentration in °Brix and °Plato. Results from tables are expressed as °Plato using the Goldiner and Klemann table.
2.12.2. Determination of Color Using Spectrophotometric Method
The wavelength was set at 430 nm. The cell was filled with water and the absorbance set to read 0.00. The cell was then rinsed and filled with the sample (wort and beer) and the absorbance read [25].
where is the absorbance at 430 nm in 10mm cell and is the dilution factor
2.12.3. Determination of pH
The electrode of the pH-meter was immersed into the wort and beer samples and the pH was read. The beer was degassed before the pH was read.
2.12.4. Determination of Turbidity
The tube was filled with the sample and wiped carefully and thoroughly. It was then placed in the turbidimeter, closed, and read immediately. Results are expressed in NTU (nephelometric turbidity unit).
2.12.5. Determination of Free Amino Nitrogen (FAN) Content
The samples (wort and beer) were diluted to 1% (v/v); 2 mL of the diluted sample was placed in a test tube into which was added 1 mL of coloured reagent. Tubes were stoppered with aluminium foil, thoroughly homogenized, and placed in a water bath (95 °C) for exactly 16 min and then cooled in cold water (20 °C) for 20 min. After this time, 5 mL of dilution solution was added, mixed, and the absorbance was read at 570 nm against a reference sample prepared from the reagents plus 2 mL of distilled water in place of diluted wort and beer [25]. The free amino nitrogen (FAN) was calculated according to the relation:
where is the absorbance of test solution at 570 nm, is the mean absorbance of standard solutions at 570 nm, and is the dilution factor.
2.12.6. Determination of Titratable Acidity
Titratable acidity was determined according to the standardized method, i.e., AFNOR (1982), with 0.1 N sodium hydroxide (NaOH) in the presence of phenolphthalein indicator. Ten milliliters of the sample was pipetted into a conical flask and 0.1 mL of phenolphthalein (0.05%) was added. Titration was stopped when the initial color changed to pink and persisted for at least 30 s. The burette reading was noted. The titratable acidity (TA) is expressed in g/L H2T:
where is the volume (mL) of the sodium hydroxide noted at endpoint, is the concentration of the base, and is the volume of titre.
2.12.7. Determination of Total Polyphenols
After haven prepared the reagents needed for this experiment, with the help of standard solutions of gallic acid, a scale of standardization was prepared and the samples are titrated.
The test tubes were again agitated and allowed to rest for 2 h at room temperature, after which their relative absorbance was read at 725 nm. The polyphenol mg/L content was obtained using the relationship given in the standard curve after plotting optical density against concentration [28].
2.12.8. Alcohol Determination Using Specific Gravity
The original gravity (OG) and final gravity (FG) were determined using a pycnometer as previously described in Section 2.12.1. The ABV was expressed as follows:
2.12.9. Sensory Evaluation of Beers
A hedonic test was conducted. Sensory evaluation was conducted by 30 ordinary consumers (20 males and 10 females) from the town of Ngaoundere. The consumers were selected from different age groups (21–35 years old). The prerequisites for participating in the study were that the individual consumed beer and showed an interest in participating in all test sessions. Evaluations were carried out at the Food Engineering and Technology Laboratory; the beer samples were served in a random way at temperatures of about 8 °C. All the beer samples were coded. Each participant received a series of five beers (30 mL of each formulation) served in opaque cups except when rating appearance, during which they were served in glasses. The degree of liking was rated using a nine-point hedonic scale for five main attributes i.e., smell, taste, bitterness, mouthfeel, and appearance; They were also asked to rate their overall liking for each beer. For each sample, participants were instructed to drink and swallow the beer when rating taste. Consumers were asked to drink mineral water to clean their mouth between tastings to avoid cross-contamination between samples. Also, they were asked not to smoke, eat, or drink anything, except water, 1 h before the tasting session. The panellists were invited to comment on the beers especially with respect to the attributes rated. After tasting, a purchase intent score sheet was filled by all the tasters.
3. Results
3.1. Physicochemical Characteristics of Unmalted and Malted Sorghum
The quality of beer was dictated by the nature of the raw materials. Sorghum (Safrari) utilized for this study was characterized in order to assess its brewing potentials. These tests (for acceptability in brewing) helped in determining the potentiality of the Safrari cultivar. Table 4 shows the results obtained for characterization of unmalted and malted sorghum.
3.1.1. Water Content
The values obtained for the water content of unmalted and malted sorghum were 8.50 ± 0.01% and 4.86 ± 0.56%, respectively (Table 4). In both cases, these values were in the range of those reported by the literature [29,30]. The samples produced were therefore considered to be suitable for storage since it was also reported that grains at a moisture content of up to 11.7% will keep safe without deterioration during storage [31].
3.1.2. Germinative Capacity and Energy
Results obtained for germinative capacity, germinative energy (4 mL), and germinative energy (8 mL), were 99.29 ± 0.58%, 98.56 ± 1.79%, and 97.00 ± 1.21%, respectively (Table 4). They all fell within the specifications of at least 95% [25]. These two properties had a direct bearing on the suitability of cereals for malting since it was mentioned in the literature that a GE ≥ 90% is appropriate for malting and brewing [31,32].
3.1.3. Thousand Corn Weight
3.1.4. Diastatic Power
The diastatic power (DP) of Safrari malt was 187.44 ± 7.89 WK (Table 4), less than the average value of 250 WK recorded in barley. This indicated a relatively low enzymatic activity, and thereafter, showed insufficient production of enzymes during malting when compared to barley. These relatively low levels of DP in sorghum may indicate the necessity of the addition of exogenous starch hydrolyzing enzymes since it was stated that the most important characteristics of good malt are high enzyme levels to degrade starch and obtain high extract yield [34].
3.1.5. Ash Content
The ash content of unmalted grains was 1.35 ± 0.01% (Table 4). It fell within the range indicated in the literature, which was between 0.3 and 1.7% [35,36]. A significant decrease in ash content was observed after malting. This was due to the removal of roots and shoots after kilning. Safrari malt had an ash content of 0.87 ± 0.22%. Despite the loss in ash content, Safrari malt was still within the 0.3 to 1.7% range reported in the literature [35,36]. This is beneficial for lager brewing as the yeast needs minerals for optimum function during wort fermentation [37].
3.2. Analysis of Worts and Beers
3.2.1. Specific Gravities
The specific gravity of the worts produced a range between 1.0508 and 1.0748 (Table 5). These values fall within the range as recorded in the literature [9,10,24]. The lowest value recorded was that of the motherwort. This increase could be explained, amongst other reasons, by the evaporation of water taking place during the boiling process. This evaporation should have contributed to wort concentration; thus, specific gravity increased in the boiled wort [18]. In the beer, specific gravity between 0.9923 and 1.0040 was obtained (Table 6). The lower final gravity could be explained by the fact that sugars were used up by yeast to convert the wort into beer; hence, the final gravity will be much lower as yeasts have consumed much of the sugar, which is denser than water, and have left alcohol in its place, which is less dense than water [18].
3.2.2. pH
The pH of all the worts studied was within the range 5.41 ± 0.00 to 5.79 ± 0.01 (Table 5). All the boiled wort had pH values higher than 5.41 ± 0.00, which was that of the motherwort. This increase could be explained by the fact that the pH of wort was dependent on the residual alkalinity of the water [37]. According to the literature, sorghum wort pH should range between 5.3–6.0 for optimum brewing [3,4,38]. All the worts produced were within this range. Equally, in the beer, pH ranged between 4.47 ± 0.02 and 4.68 ± 0.03 (Table 6). The lower pH values obtained in the beers could be explained by the fact that during fermentation, the pH continued to drop as a result of the yeast cells taking in ammonium ions (which are strongly basic) and excreting organic acids including lactic acid [37].
3.2.3. Turbidity
The proportion of lactose and coffee impacted the turbidity of wort by increasing it (Table 5). This could be due to the fact that coffee contains proteins, polyphenols, and carbohydrates [39], amongst other components that induce the formation of haze [7,8]. High turbidity values were recorded for all wort samples. The wort containing 100% coffee recorded a turbidity value of 91.00 ± 0.00 NTU (Table 5). A turbidity value of 606.00 ± 0.82 NTU was obtained in the sample containing 100% lactose (Table 5). Together with polyphenols, proteins are thought to cause haze formation during wort boiling (hot break) and wort cooling (cold break). The trub in both cases was as a result of the interaction between proteins and polyphenols which forms some complex that clumps. At the end of the boil, as the wort cooled it got more and more cloudy. The clumps of polyphenol and protein in the cold break were much smaller than the hot break. Therefore, they tended to stay in suspension longer, causing the wort to be turbid [7,8]. The lower turbidity values obtained in the beer (Table 6) could be explained by the fact that during maturation, clarification of the beer took place. This was due to natural sedimentation in the cold (lagering at 0 °C) of protein and polyphenol complexes. This ensured that turbidity owing to chemical precipitation or growth of microorganisms did not occur or, in the case of chemical precipitation, did not recur when the beer was clear and stable [7,8].
3.2.4. Total Polyphenols
Total polyphenols ranged between 416.00 ± 0.13 and 615.00 ± 0.06 mg GAE/L (Table 5). These values were higher than the 150 mg/L to 300 mg/L range from the literature [27,33,40]. The proportion of lactose and coffee impacted the total polyphenols of beer. This could be accounted for by the fact that coffee contains polyphenols in their composition [41,42]. Total polyphenols between 108 to 146 mg GAE/L were obtained in the beer (Table 6). Before the end of fermentation and maturation, a large amount of the polyphenolic material and protein had been removed by adhesion and coagulation, and it had then sunk to the bottom of the fermenter, hence the drop in total polyphenols of beer. However, they were still present in the final beer where they contributed in determining its quality since polyphenols contribute to flavor, astringency, the perception of bitterness, haze, oxidative effects, and antioxidative effects [43,44,45].
3.2.5. Free Amino Nitrogen (FAN)
The FAN of wort varied from 308.00 ± 0.23 mg/L to 339.00 ± 0.93 mg/L (Table 5). This could be explained by coffee, which contains proteins [41,42]. These proteins were broken down by proteases to FAN during mashing. It has been generally agreed that at least 120 mg/L of FAN is required to support proper yeast growth during brewing, though with the high gravity brewing processes employed in most modern breweries, recommended levels are at about 150 mg/L [46]. In beers, the FAN varied from 110.00 ± 0.23 mg/L to 140.00 ± 0.14 mg/L (Table 6). During fermentation, FAN provided nutritional support to the yeast, enabling the optimal yeast growth and efficient fermentation necessary for good head retention and foam quality. This further explained the decrease in FAN recorded compared to wort [47,48].
3.2.6. Color
The color values of the worts produced were within the range 146.75 ± 3.00 EBC to 242.50 ± 2.04 EBC (Table 5). This could be due to the fact that color depends on the grain used as raw materials and bitter leaf, as well as on the processes during the brewing. Color components were produced partly in the Maillard and caramelization reactions, and partly by the oxidation of polyphenols [7,49]. The color of beer ranged between 112.50 to 242.50 EBC (Table 6). The values obtained indicated that the beer produced was in the range of stout given that the appellation of stout with reference to colour starts as from 69 EBC as indicated on the beer colour chart based on the standard reference method.
3.2.7. Titratable Acidity (TA)
The proportion of lactose and that of coffee impact on the TA of beer. This could be accounted for by the fact that both lactose and coffee contained titratable acids in their composition as reported by Fox et al. (2015) and Wang and Ho (2009), respectively. Titratable acidity varied slightly comparatively in the formulation: between 2.58 ± 0.04 and 2.84 ± 0.01 g/L H2T (Table 5). Values of the TA of beer ranged between 3.92 to 4.38 g/L tartaric acid (Table 6).
3.2.8. Alcohol by Volume (ABV) Content of Beer
The ABV of the five beers were very high (Table 6). Three of beer formulations had ABV above 9%. They include formulations 1 to 3. A formulation with higher ABV means more fermentable sugars have been converted into ethanol during fermentation. Beers can contain up to about 12.5% ABV [10,24,37,50,51].
3.3. Sensory Evaluation Results
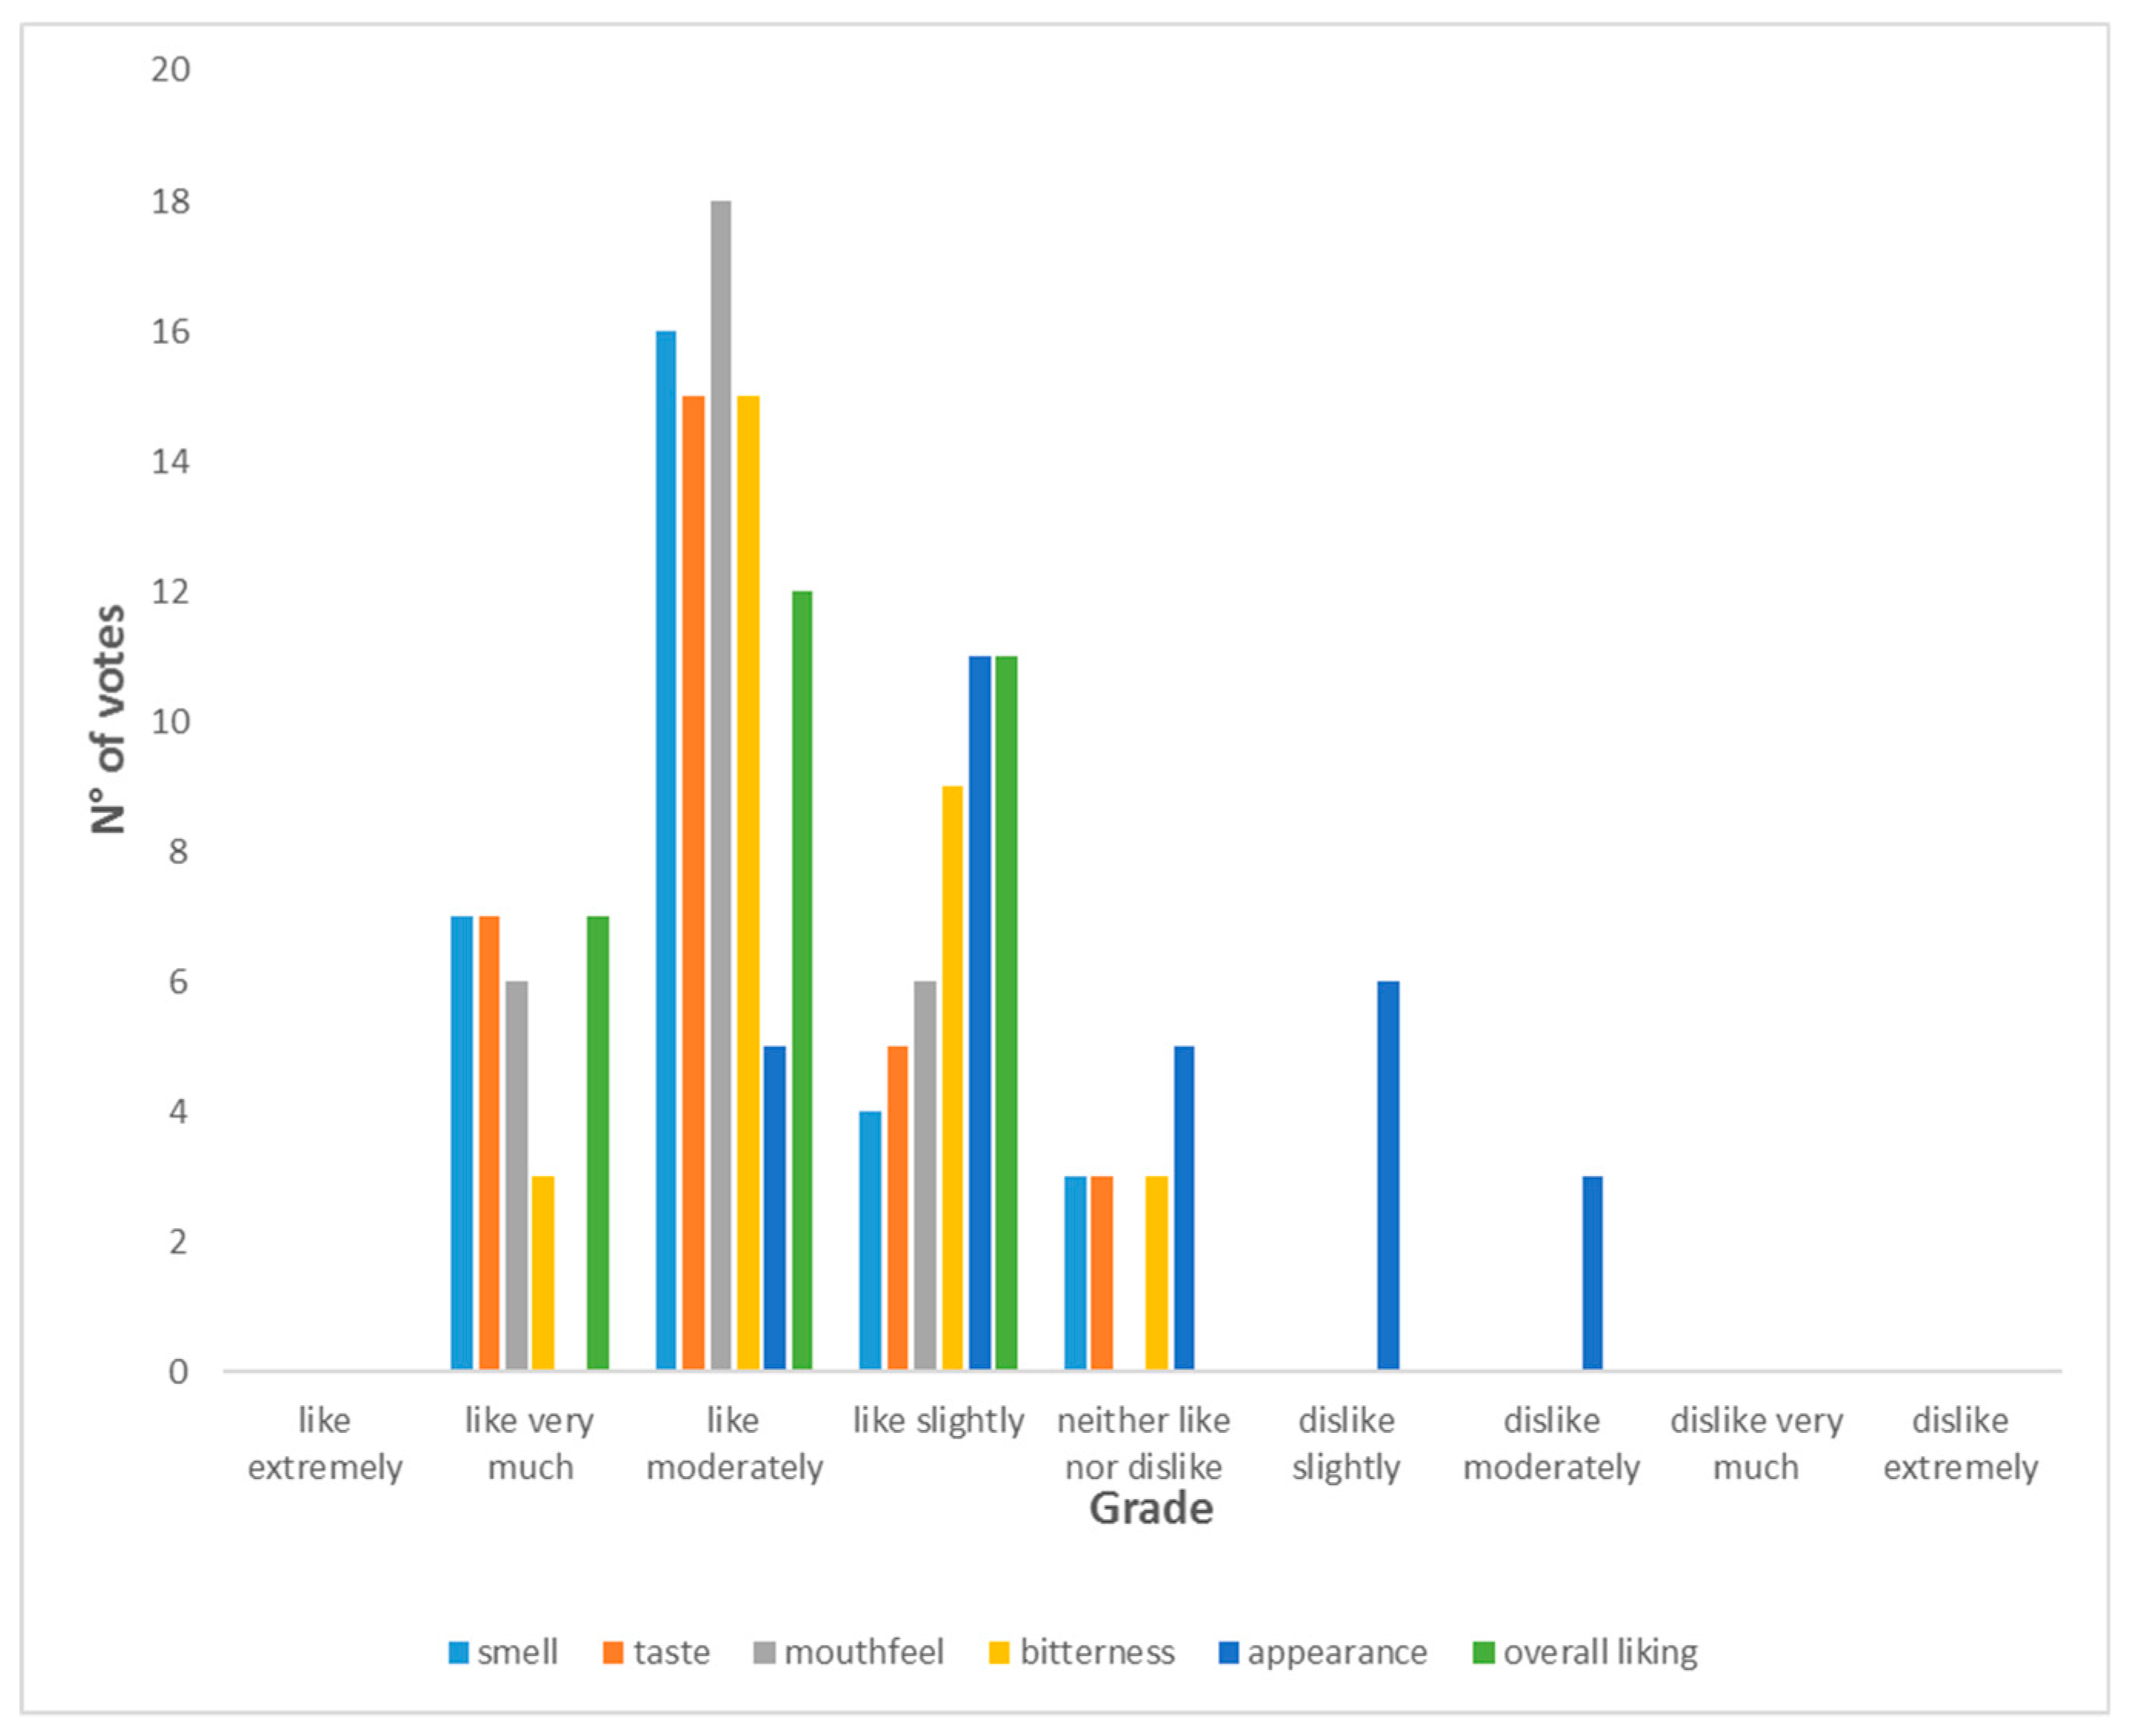
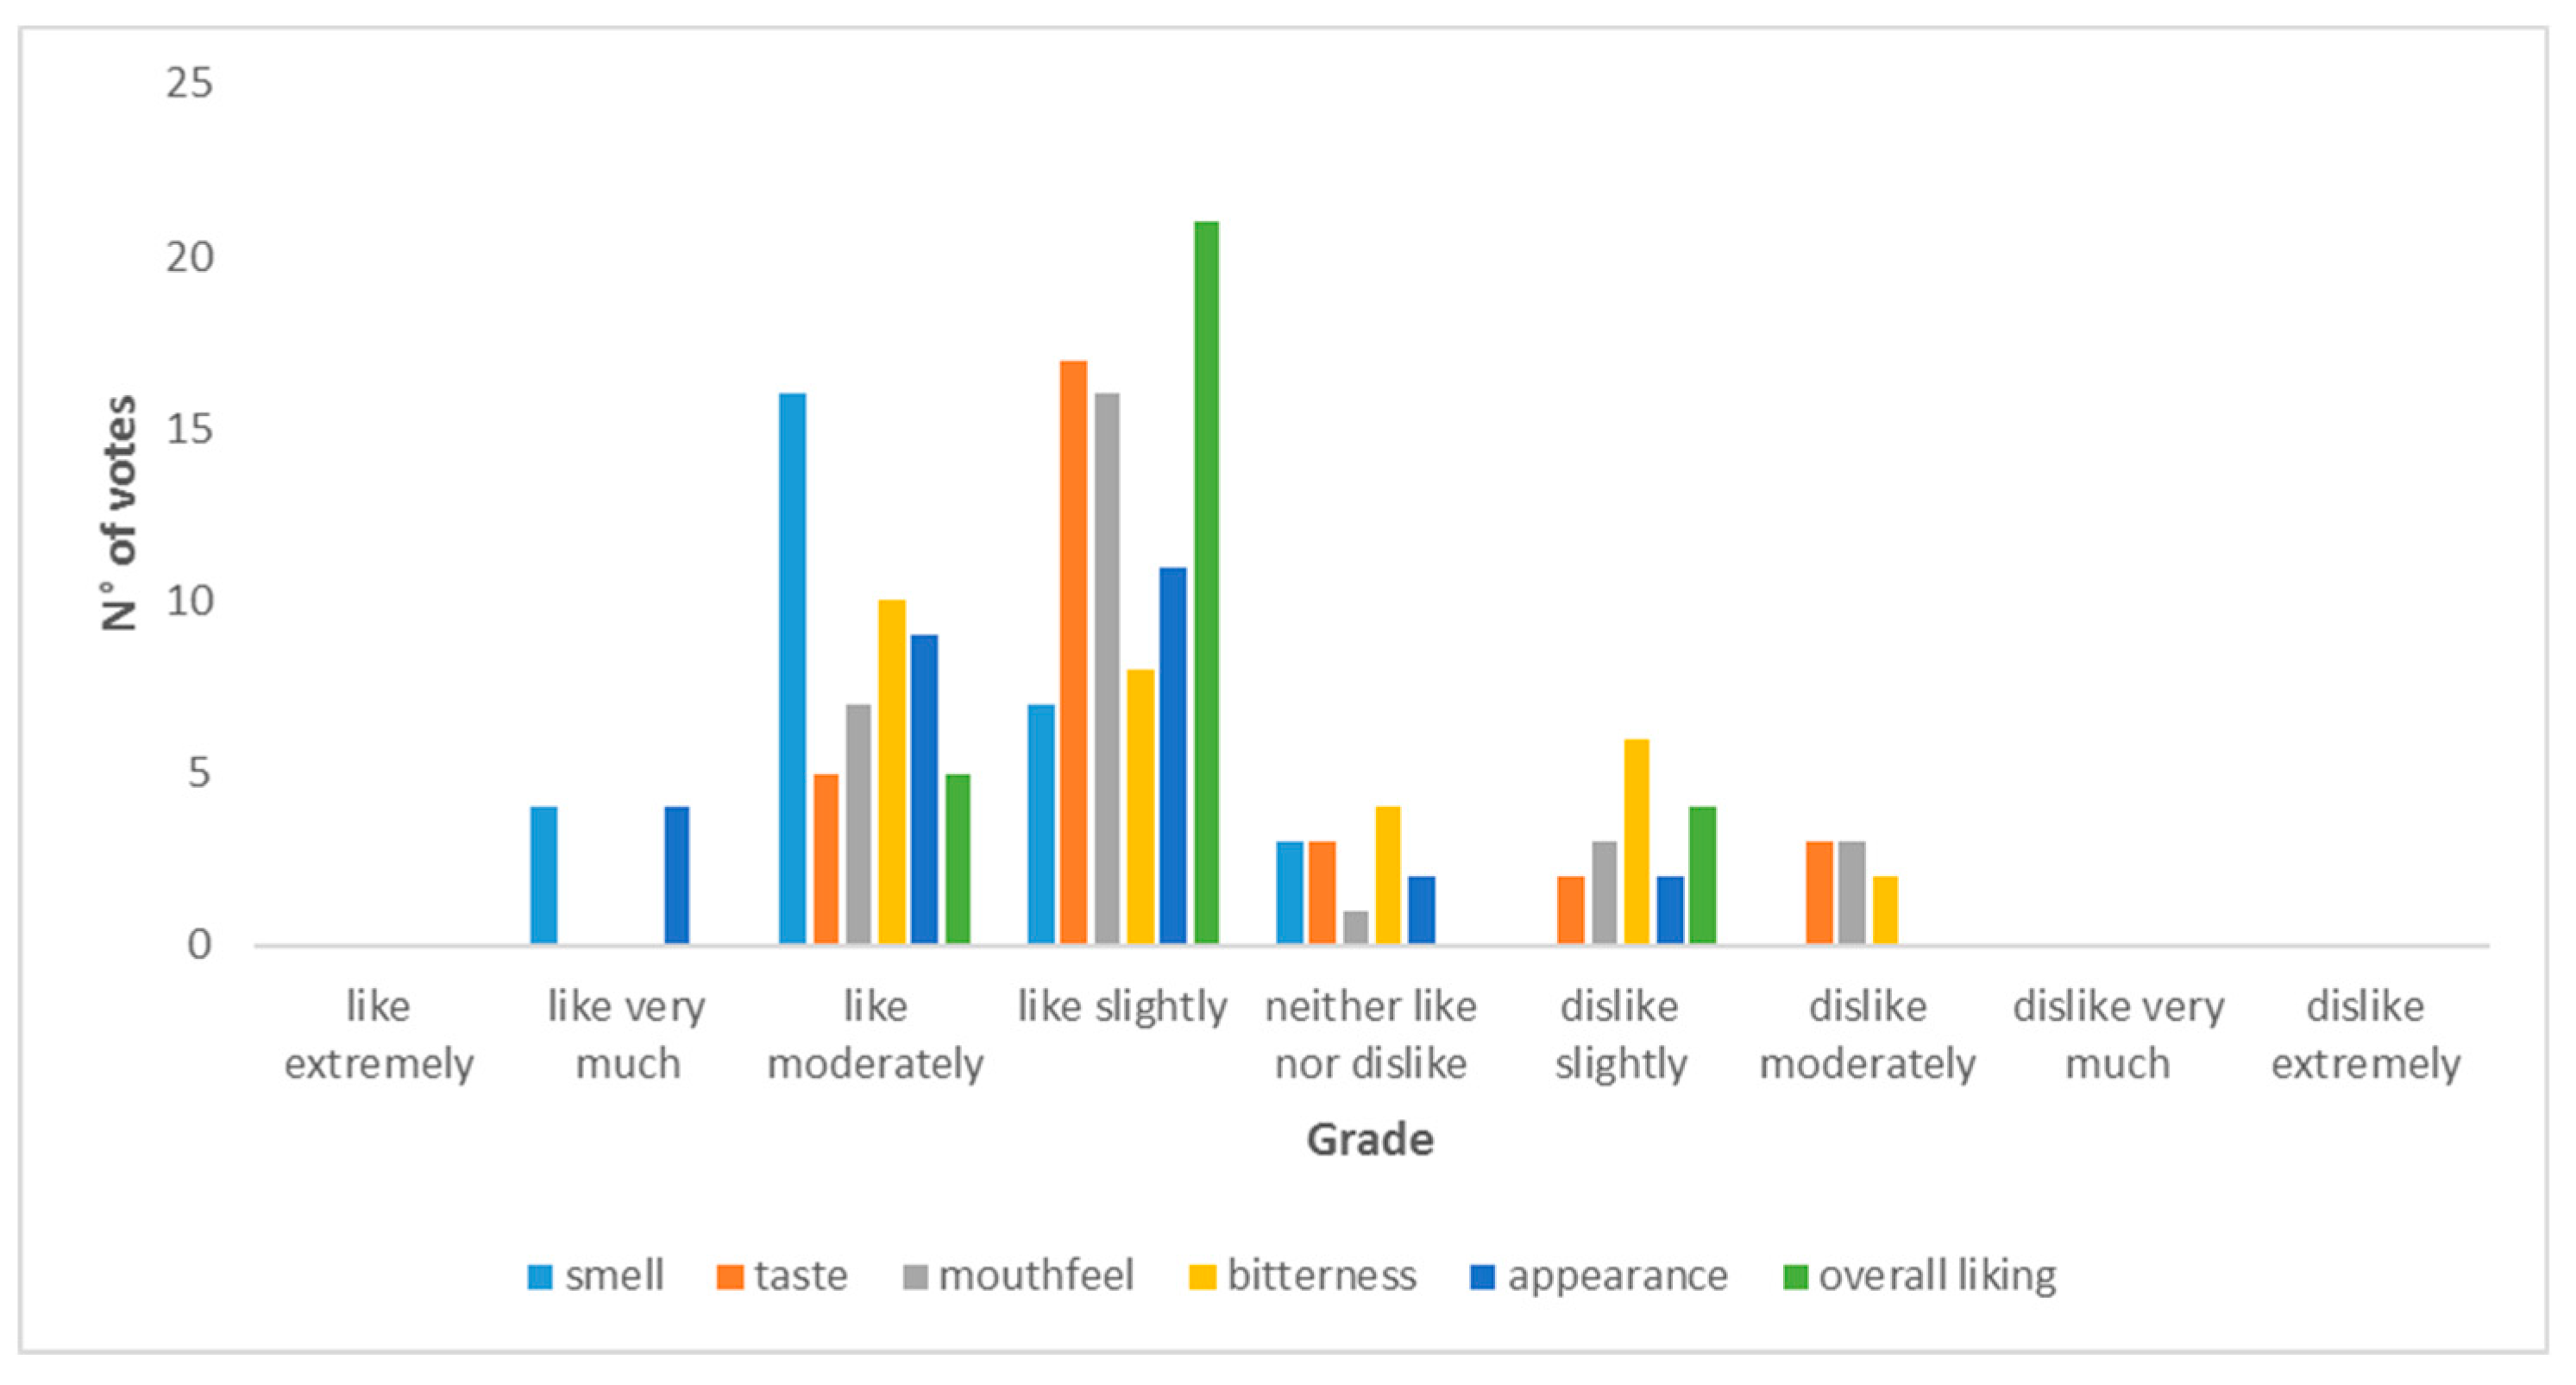
For beer 1 containing 100% lactose, all attributes had the majority of votes located in “the liking part” of the hedonic scale (Figure 10). Mouthfeel had the highest number of votes. Smell, taste, and bitterness scored high too. This could be the reason for the high score recorded for the overall liking. However, for this beer, some panellists commented on the appearance, saying it was hazy, making it less attractive. Some also mentioned that the colour was not bad but the haziness gave a poor appearance. They suggested that the beer be more brilliant.
The bitterness and overall liking scored the highest in beer 2. Likewise for beer 1, for beer 2 containing 75% lactose and 25% coffee, all attributes had the majority of votes located in “the liking part” of the hedonic diagram (Figure 11). Similar comments were made by the panellists with respect to appearance being hazy. According to them, the beer lacked brilliance. They also mentioned that the colour was not bad but the haziness gave a poor appearance. They suggested that the haziness should be removed to make the beer more attractive.
Concerning beer 3 containing equal proportions of lactose and coffee, all attributes had the majority of votes located in “the liking part” of the hedonic diagram (Figure 12). Though overall liking had the highest number of votes, a panellist said the beer could even taste better if the bitterness was reduced a little and carbonation increased. This explained the votes seen in the dislike part of the diagram. Smell, taste, and mouthfeel were, however, much appreciated in the comments made by panellists. Appearance scored higher than in the previous beer as haziness dropped.
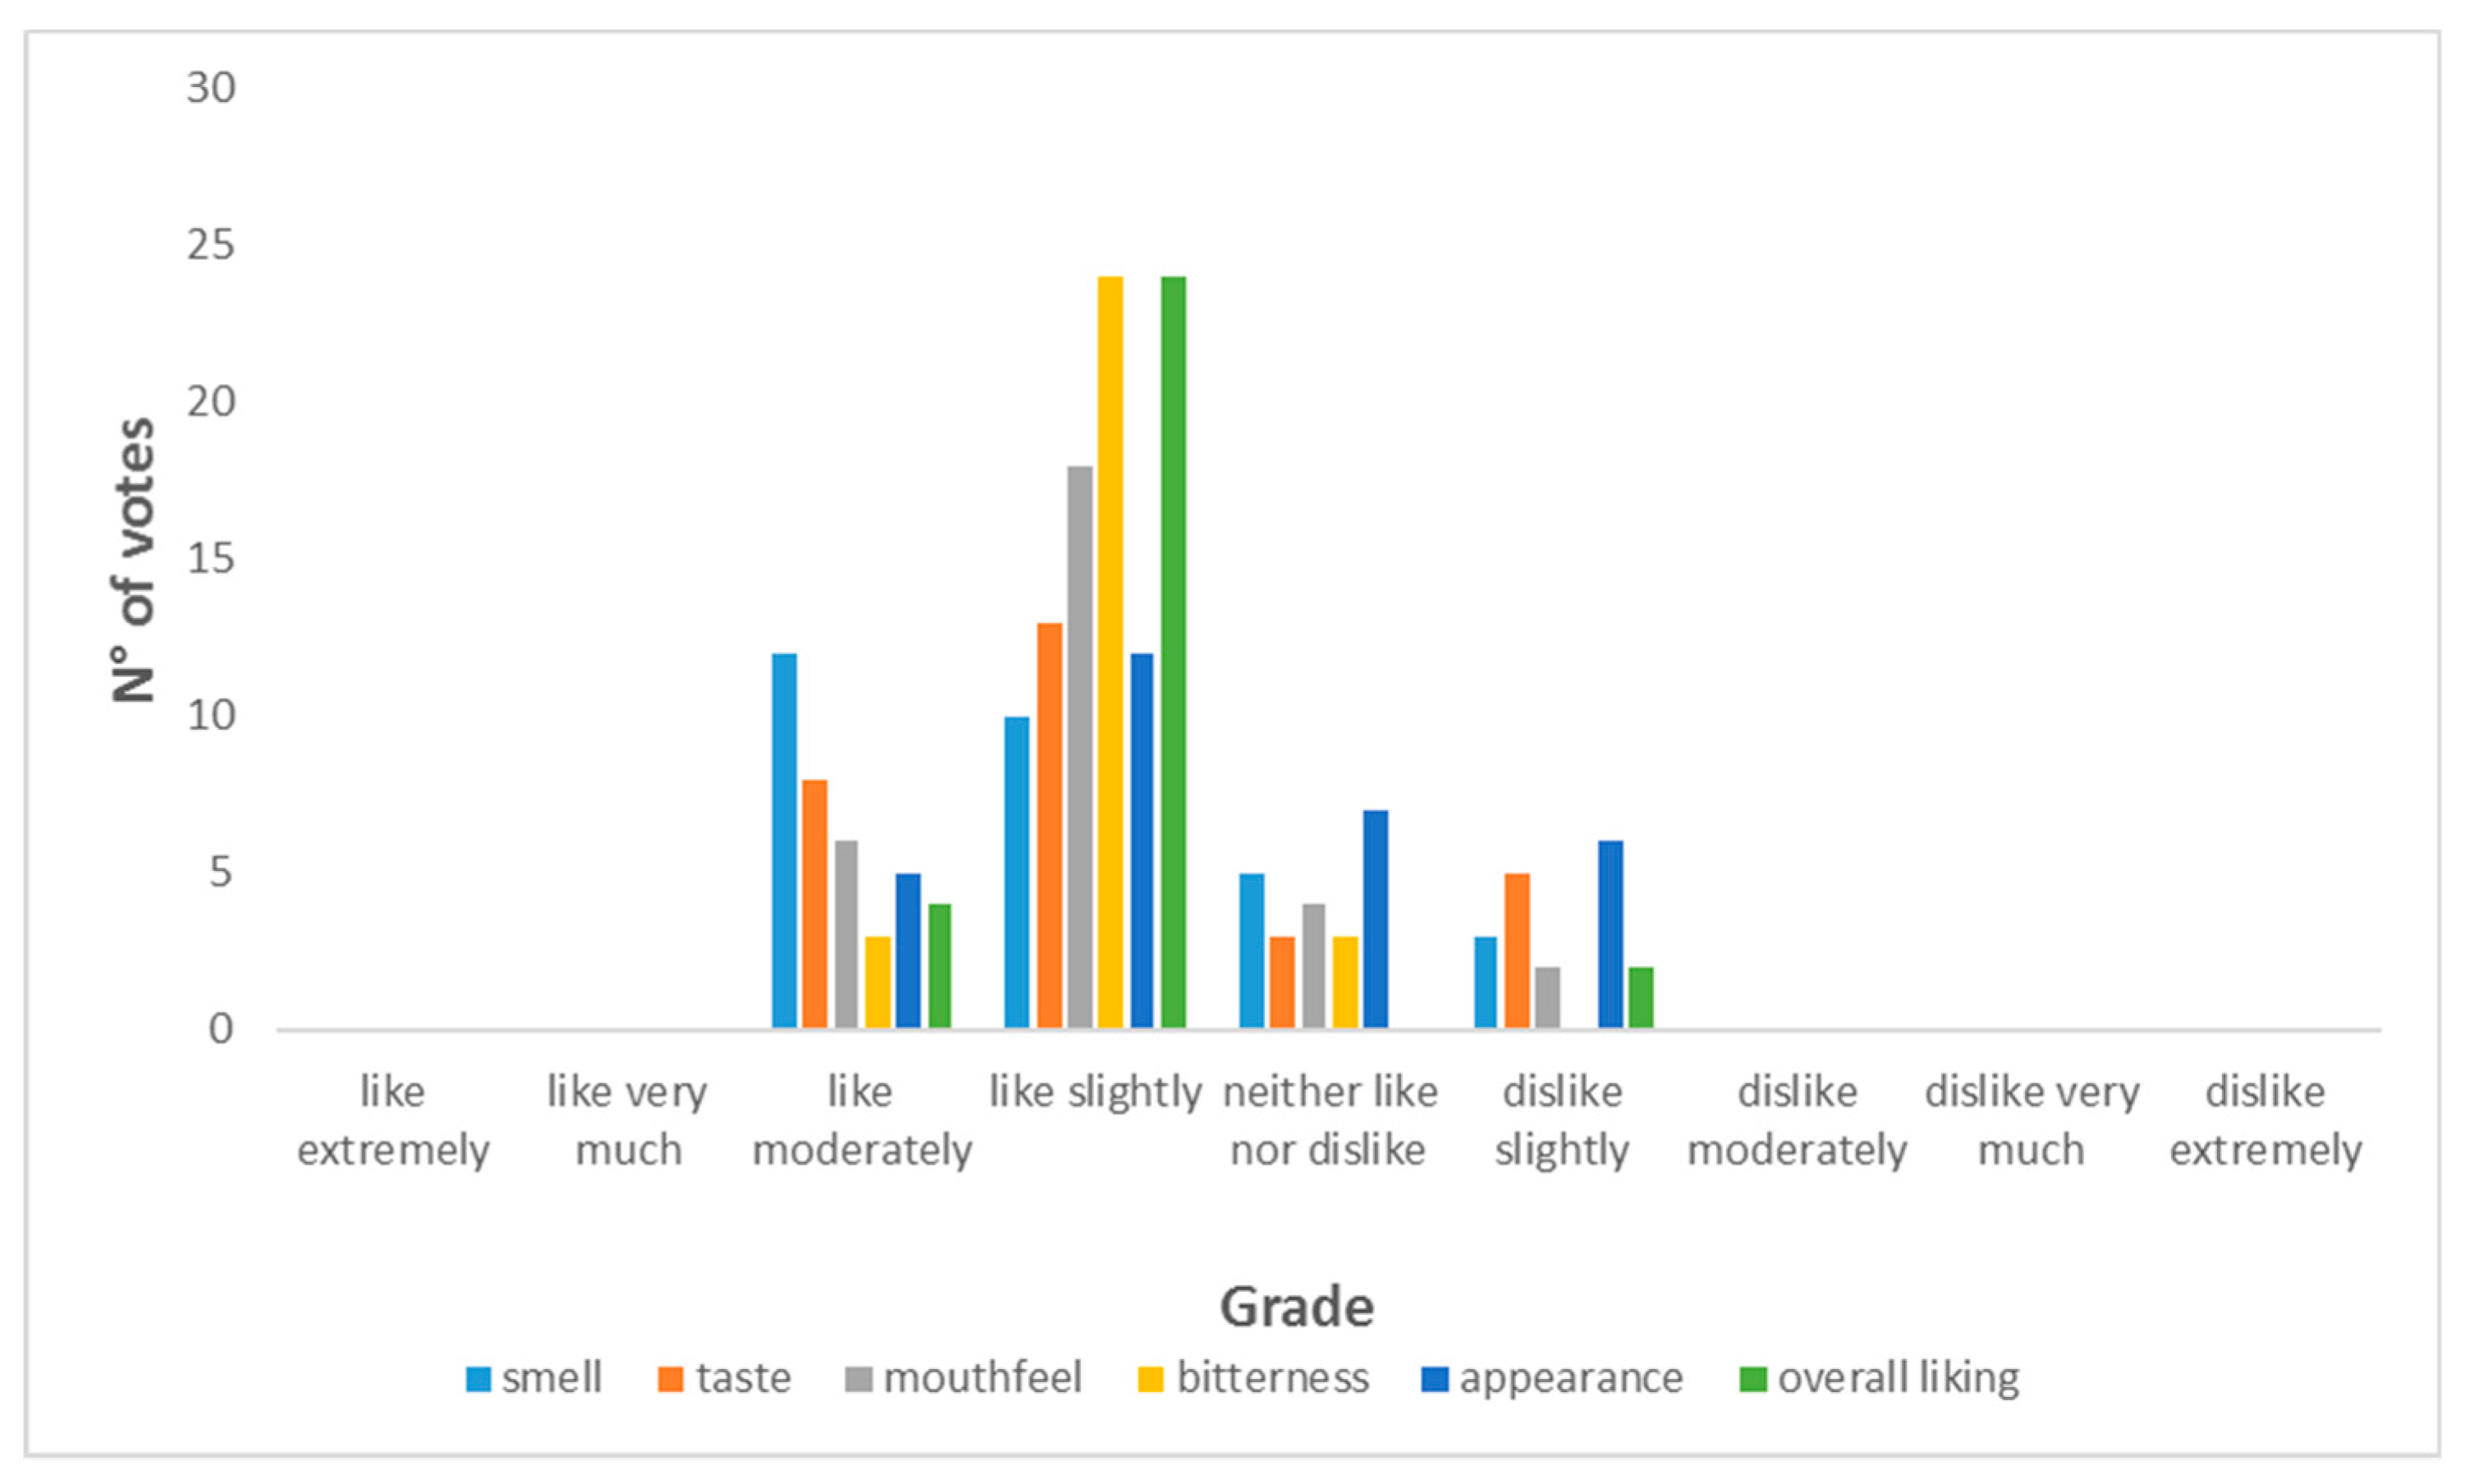
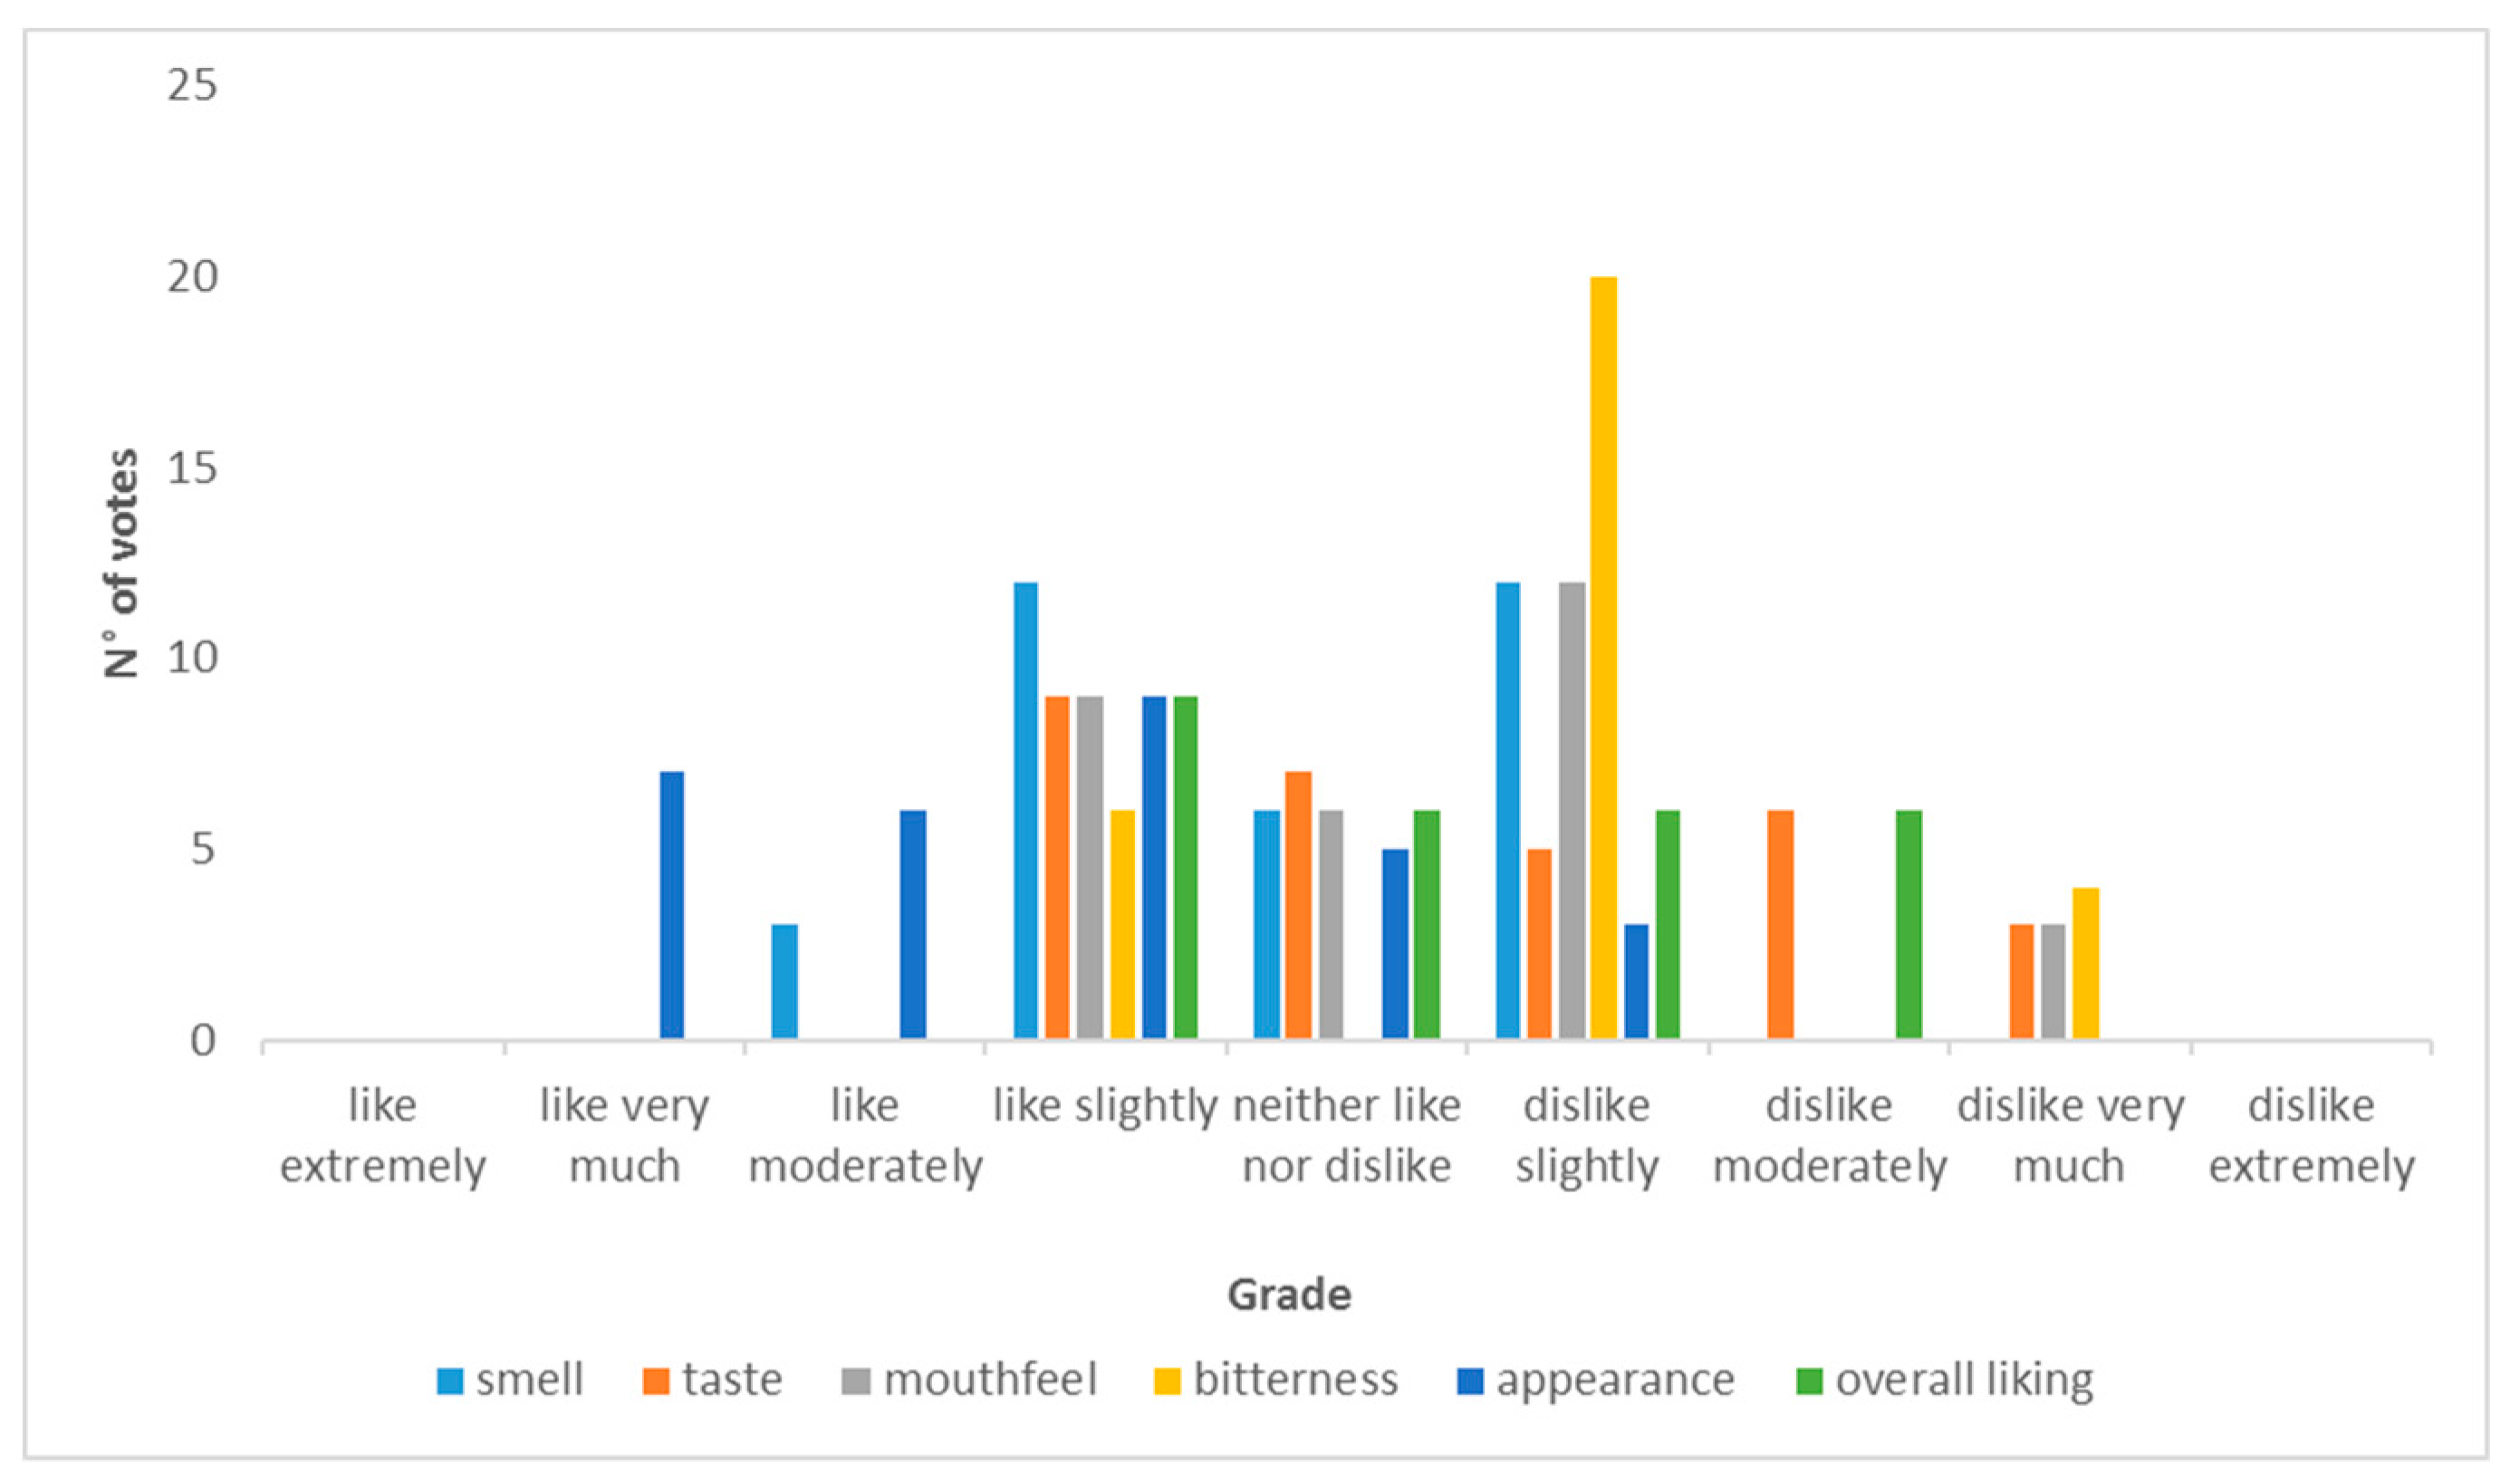
Except for smell and appearance, beer 4 containing 25% lactose and 75% coffee, had the majority of votes for all other attributes located in “the disliking part” of the diagram (Figure 13). The comments gave a clue on consumers’ grading. They commented that the beer was too bitter such that they could not appreciate the flavour of the malts. They suggested much of the bitterness should be reduced. The dark colour with less haze of the beer was much appreciated and gave the appearance its good score.
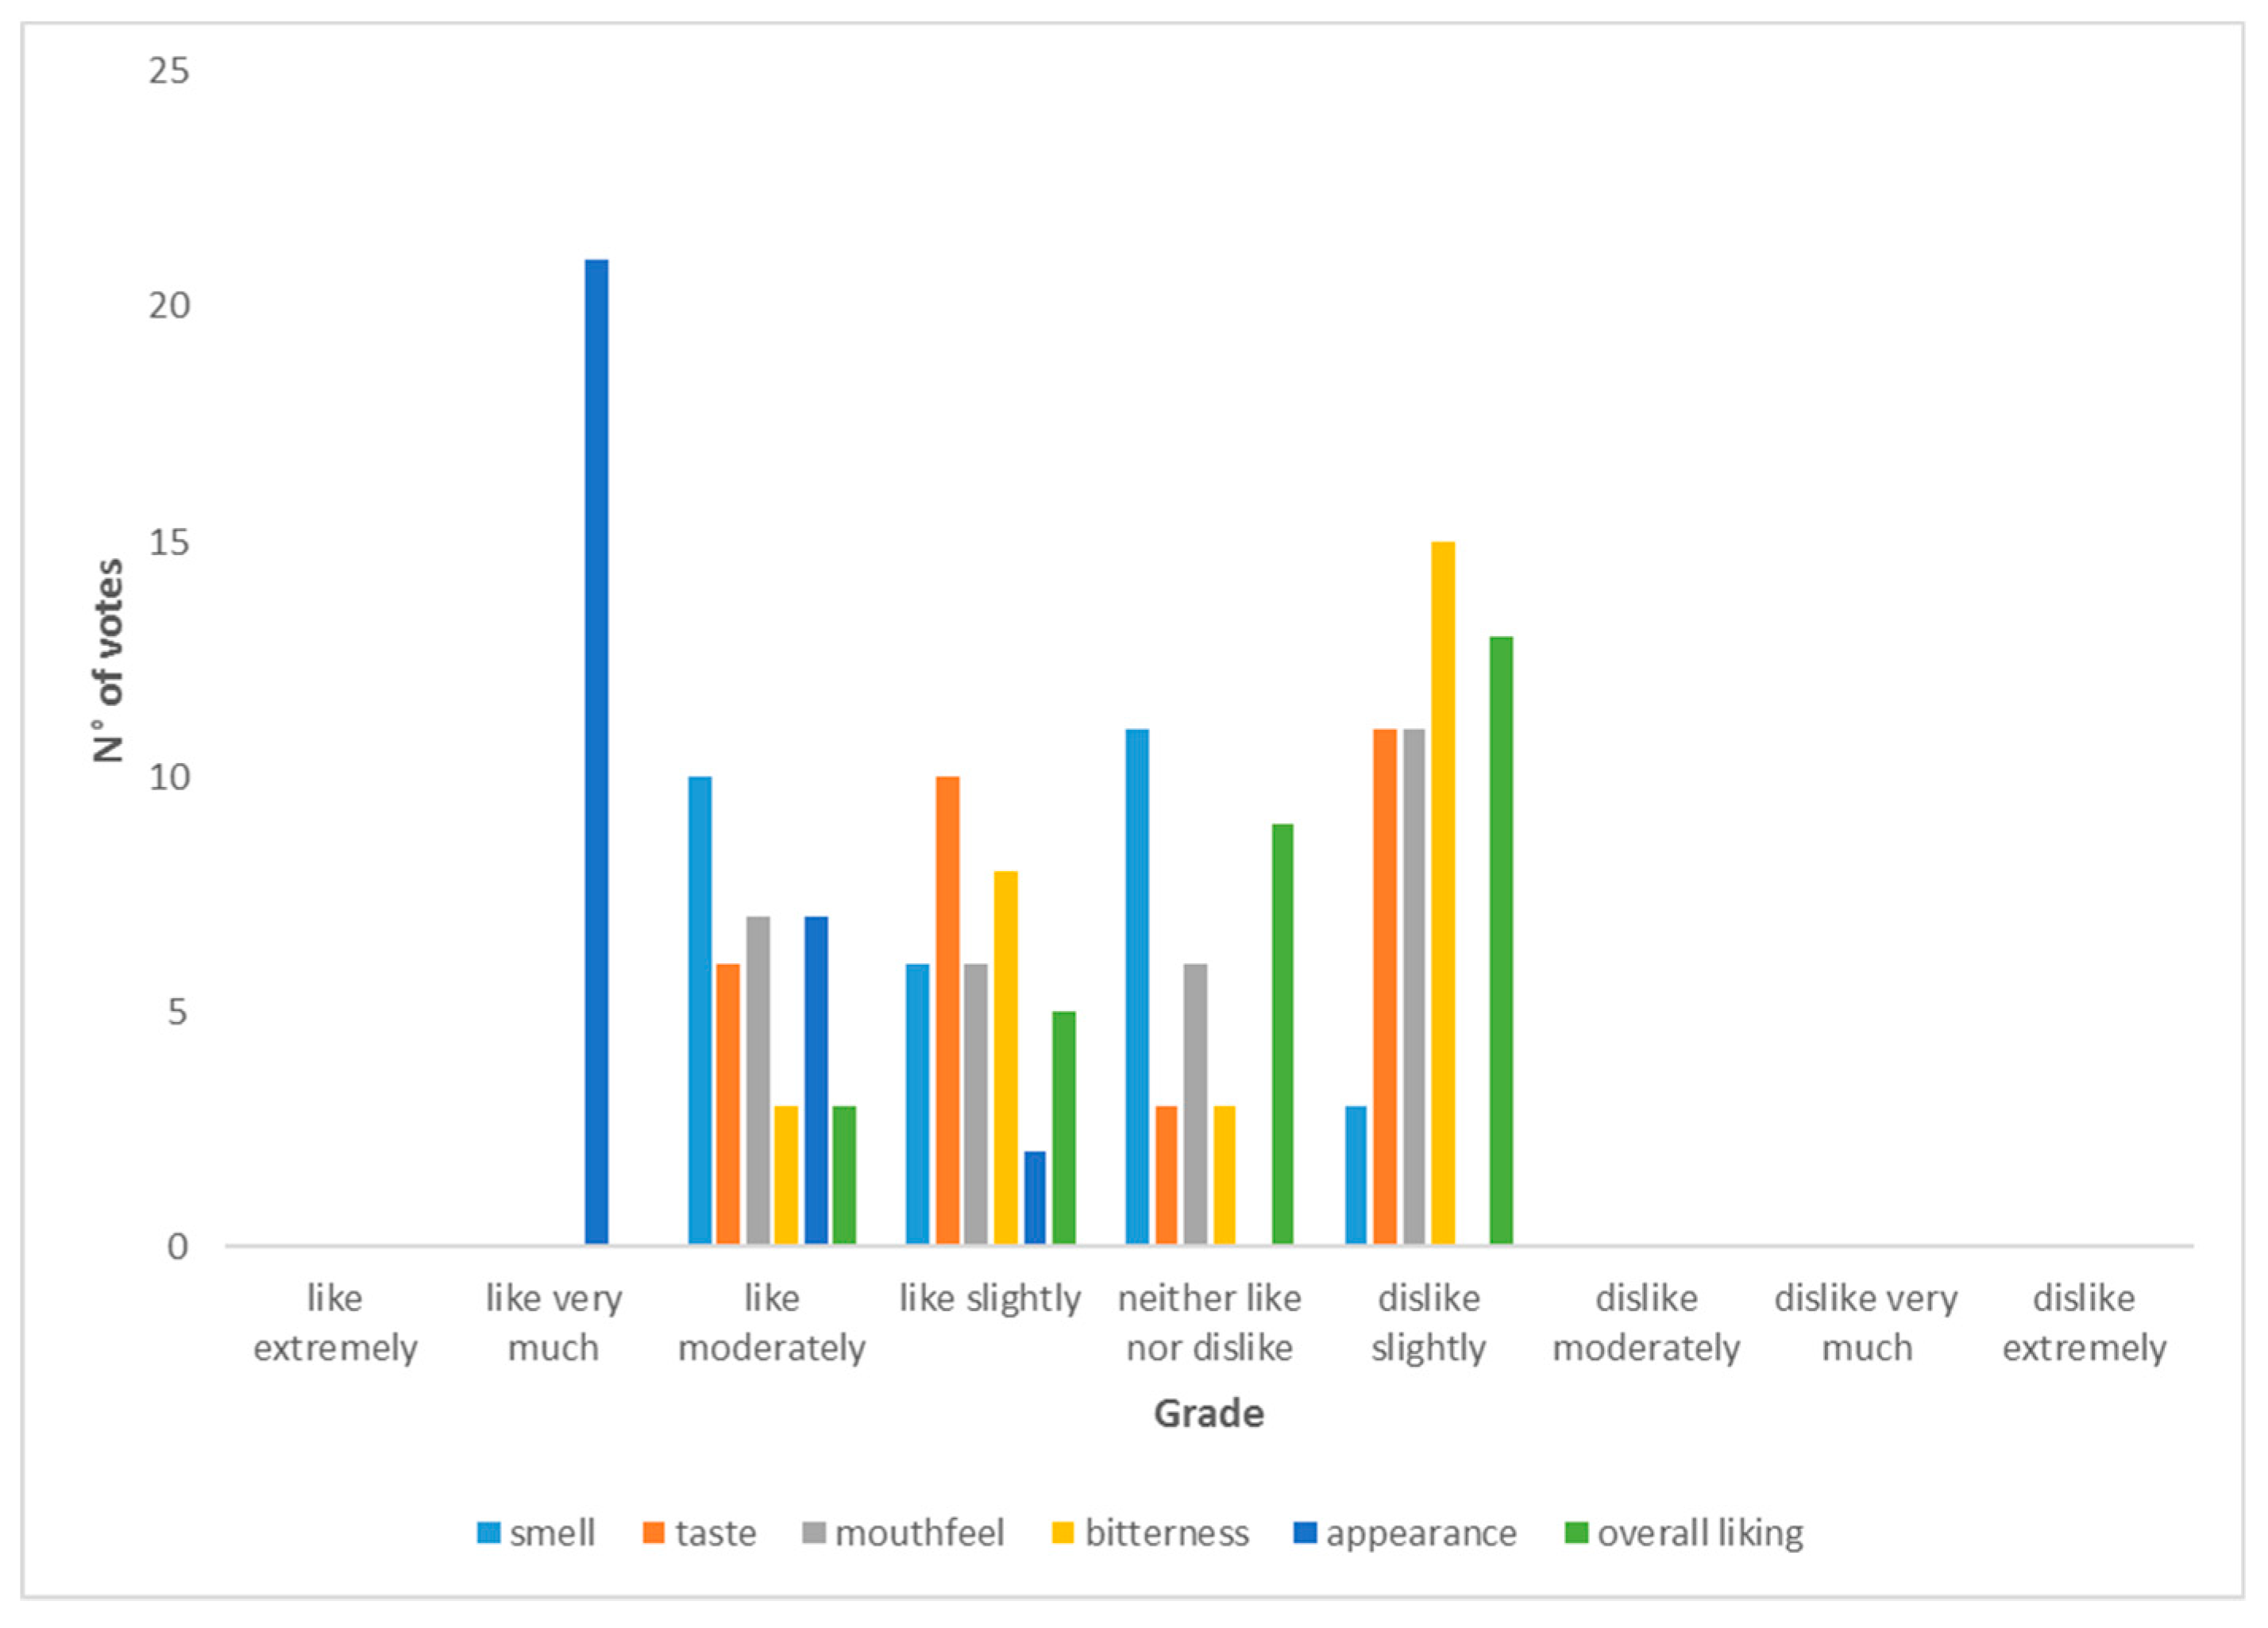
Beer 5 containing 100% coffee had the majority of votes in the “liking part” of the hedonic diagram, except for bitterness with the majority of votes located in “the disliking part” of the diagram (Figure 14). The appearance was very much liked. The dark colour with the least haze of the beer was highly appreciated as depicted by the votes. Though the bitterness was decried and suggested being reduced in the comments made by consumers, the taste scored well.
4. Conclusions
Studies on the physicochemical characterization of a beer stout using coffee and lactose as ingredients and Vernonia amygdalina as bittering were made. It emerged from this study after having carried out a mixing plan having given five different beers that the physicochemical characteristics of musts and beers were comparable to the values obtained in the literature. The sensory analysis of these beers revealed those which are appreciated by the panellists during a hedonic test. It is therefore at the end of this work, plausible to consider a feasibility study for a pilot production of this type of beer.
Author Contributions
F.M.H. Performed the experiments. D.Z.S.C. Analyzed the data; Contributed reagents/materials/analysis tools; Wrote the paper. N.E.J. Contributed reagents/materials/analysis tools; Supervised the laboratory work and the paper.
Funding
This research received no external funding.
Acknowledgments
The authors gratefully acknowledge the Departments of Process Engineering of the National School of Agro-Industrial Sciences (ENSAI), The University of Ngaoundere (Cameroon) for providing necessary facilities for the successful completion of this research work.
Conflicts of Interest
The authors declare no conflict of interest.
References
- Food and Agriculture Organization of the United Nations (FAO). Faostat Database Collections; Food and Agriculture Organization of the United Nations: Rome, Italy, 2014. [Google Scholar]
- Agu, R.C.; Palmer, G.H. Enzymic modification of endosperm of barley and sorghum of similar total nitrogen. Brew. Dig. 1998, 73, 30–35. [Google Scholar]
- Bajomo, M.F.; Young, T.W. The properties, composition and fermentabilities of worts made from 100% raw sorghum and commercial enzymes. J. Inst. Brew. 1993, 99, 153–158. [Google Scholar] [CrossRef]
- Bajomo, M.F.; Young, T.W. Fermentation of worts made form 100% raw sorghum and enzymes. J. Inst. Brew. 1994, 100, 79–84. [Google Scholar] [CrossRef]
- Taylor, J.R.N.; Robbins, D. Factors affecting beta-amylase activity in sorghum malt. J. Inst. Brew. 1993, 99, 413–416. [Google Scholar] [CrossRef]
- Nso, E.J.; Nanadoum, M.; Palmer, G.H. The effect of formaldehyde on enzyme development in sorghum malts. Tech. Q. Master Brew. Assoc. Am. 2006, 43, 177–182. [Google Scholar]
- Desobgo, Z.S.C.; Nso, E.J.; Tenin, D.; Kayem, G.J. Modelling and optimizing of mashing enzymes-effect on yield of filtrate of unmalted sorghum by use of response surface methodology. J. Inst. Brew. 2010, 116, 62–69. [Google Scholar] [CrossRef]
- Desobgo, Z.S.C. Modélisation de L’action des Hydrolases sur Quelques Caractéristiques Physico-Chimiques des Moûts de Deux Cultivars de Sorgho; Université de Ngaoundéré Ngaoundéré: Ngaoundéré, Cameroon, 2012. [Google Scholar]
- Bubacz, M.; Philip, T.; McCreanor, P.T.; Jenkins, H.E. Engineering of beer: Hard work or too much fun? In 2013 American Society for Engineering Education Southeast Conference; American Society for Engineering Education: Cookeville, TN, USA, 2013; pp. 1–10. [Google Scholar]
- Owuama, C.I. Brewing beer with sorghum. J. Inst. Brew. 1999, 105, 23–34. [Google Scholar] [CrossRef]
- Desobgo, Z.S.C.; Nso, E.J.; Tenin, D. The response surface methodology as a reliable tool for evaluating the need of commercial mashing enzymes for alleviating the levels of reducing sugars of worts of malted sorghum: Case of the Safrari cultivar. J. Brew. Distill. 2011, 2, 5–15. [Google Scholar]
- Desobgo, Z.S.C.; Nso, E.J.; Tenin, D. Use of response surface methodology for optimizing the action of mashing enzymes on wort reducing sugars of the madjeru sorghum cultivar. Af. J. Food Sci. 2011, 5, 91–99. [Google Scholar]
- Desobgo, Z.S.C.; Nso, E.J.; Tenin, D. Modeling the action of technical mashing enzymes on extracts and free-amino nitrogen yields of the madjeru sorghum cultivar. J. Brew. Distill. 2011, 2, 29–44. [Google Scholar]
- Desobgo, Z.S.C.; Nso, E.J.; Tenin, D. Optimisation of the action of commercial mashing enzymes on wort extracts and free amino nitrogen of the Safrari sorghum cultivar. Tech. Q. Master Brew. Assoc. Am. 2011, 48, 77–86. [Google Scholar]
- Nso, E.J.; Ajebesone, P.E.; Mbofung, C.M.; Palmer, G.H. Properties of three sorghum cultivars used for the production of bili-bili beverage in northern cameroon. J. Inst. Brew. 2003, 109, 245–250. [Google Scholar] [CrossRef]
- Wolgang, K. Technology Brewing and Malting, 5th ed.; VLB: Berlin, Germany, 2014; p. 960. [Google Scholar]
- Mackintosh, I.; Higgins, B. The development of a sorghum-based lager beer in uganda: A model of co-operating between industry and government in the development of local ingredients for the production of quality lager beer and consequential benefits for the parties involved. Asp. Appl. Biol. 2004, 72, 235–245. [Google Scholar]
- Taylor, J.R.N.; Schober, J.T.; Bean, S.R. Novel food and non-food uses for sorghum and millets. J. Cereal Sci. 2006, 44, 252–271. [Google Scholar] [CrossRef]
- Veith, K.N. Evaluation of four Sorghum Hybrids through the Development of Glutenfree Beer; Master of Science; Kansas State University: Manhattan, AR, USA, 2007. [Google Scholar]
- Ajebesone, P.E.; Aina, J.O. Potential african substitutes for hops in tropical beer brewing. J. Food Technol. Afr. 2004, 9, 13–16. [Google Scholar]
- Desobgo, Z.S.C.; Naponni, F.Y.; Nso, E.J. Characterization of Safrari sorghum worts and beers hopped with Vernonia amygdalina and nauclea diderrichii. Int. J. Innov. Appl. Stud. 2013, 2, 83–91. [Google Scholar]
- Okafor, N. Prospects and challenges of the use of local cereals and starchy subtrates in brewing. In National Symposium on the Brewing Industry, Now and the 21st Century; Owerri, Nigeria, 1985; pp. 22–25. [Google Scholar]
- Okafor, N.; Aniche, G.N. West african hop substitute for sorghum lager. Brew. Distill. Int. 1983, 13, 200–204. [Google Scholar]
- Owuama, C.I.; Okafor, N. Use of unmalted sorghum as a brewing adjunct. World J. Microbiol. Biotechnol. 1990, 6, 318–322. [Google Scholar] [CrossRef] [PubMed]
- Analytica-EBC. European Brewery Convention; Fachverlag Hans Carl: Nürnberg, Germany, 1998. [Google Scholar]
- AFNOR. Association française de normalisation. In Recueil des Normes Françaises des Produits Dérivés des Fruits et Légumes. Jus de Fruits, 1st ed.; AFNOR: Paris, France, 1982. [Google Scholar]
- Briggs, D.E. Malts and Malting, 1st ed.; Blackie Academic & Professional: London, UK, 1998. [Google Scholar]
- Marigo, G. Méthode de fractionnement et d’estimation des composés phénoliques chez les végétaux. Analysis 1973, 2, 106–110. [Google Scholar]
- Ogu, E.; Odibo, F.; Agu, R.C.; Palmer, G.H. Malting studies of some selected brewing sorghum varieties. MBAA TQ 2004, 41, 386–389. [Google Scholar]
- Okon, E.U.; Uwaifo, A.O. Evaluation of malting sorghum i: The malting potentials of nigerian varieties of sorghum. Brew. Dig. 1985, 60, 24–27. [Google Scholar]
- Agu, R.C.; Palmer, G.H. A reassessment of sorghum for lager-beer brewing. Bioresour. Technol. 1998, 66, 253–261. [Google Scholar] [CrossRef]
- Agu, R.C.; Palmer, G.H. Effect of mashing with commercial enzymes on the properties of sorghum worts. World J. Micro-Biol. Biotechnol. 1998, 14, 43–48. [Google Scholar] [CrossRef]
- Briggs, D.E.; Boulton, C.A.; Brookes, P.A.; Stevens, R. Brewing Science and Practice; Woodhead Publishing Limited: Cambridge, UK; CRC Press LLC: Boca Raton, FL, USA, 2004. [Google Scholar]
- Gupta, M.; Abu-Ghannam, N.; Gallaghar, E. Barley for brewing: Characteristic changes during malting, brewing and applications of its by-products. Compr. Rev. Food Sci. Food Saf. 2010, 9, 318–328. [Google Scholar] [CrossRef]
- Pontieri, P.; Di-Maro, A.; Tamburino, R.; De-Stefano, M.; Tilley, M.; Bean, S.R.; Roemer, E.; De-Vita, P.; Alifano, P.; Del-Giudice, L.; et al. Chemical composition of selected food-grade sorghum varieties grown under typical mediterranean conditions. Maydica 2010, 55, 139–143. [Google Scholar]
- Pontieri, P.; De-Vita, P.; Boffa, A.; Tuinstra, M.R.; Bean, S.R.; Krishnamoorthy, G.; Miller, C.; Roemer, E.; Alifano, P.; Pignone, D.; et al. Yield and morpho-agronomical evaluation of food-grade white sorghum hybrids grown in southern italy. J. Plant Interact. 2012, 7, 341–347. [Google Scholar] [CrossRef]
- Bamforth, C.W. Brewing: New Technologies; Woodhead Publishing: Cambridge, UK, 2006; p. 500. [Google Scholar]
- Bajomo, M.F.; Young, T.W. Development of a mashing profile for the use of microbial enzymes in brewing with raw sorghum (80%) and malted barley or sorghum malt (20%). J. Inst. Brew. 1992, 98, 515–523. [Google Scholar] [CrossRef]
- Walstra, P.; Wouters, J.; Geurts, T. Dairy Science and Technology; CRC Press: Boca Raton, FL, USA, 2006. [Google Scholar]
- Briggs, D.E.; Hough, J.S. Malting and Brewing Science, 2nd ed.; Chapman and Hall: London, UK, 1981. [Google Scholar]
- Fox, P.F.; Uniacke-Lowe, T.; McSweeney, P.L.H.; O’Mahony, J.A. Dairy Chemistry and Biochemistry, 2nd ed.; Springer International Publishing: Basel, Switzerland, 2015; p. 584. [Google Scholar]
- Wang, Y.; Ho, C.-T. Polyphenolic chemistry of tea and coffee: A century of progress. J. Agric. Food Chem. 2009, 57, 8109–8114. [Google Scholar] [CrossRef] [PubMed]
- Kondo, K.; Kurihara, M.; Miyata, N.; Suzuki, T.; Toyoda, M. Scavenging mechanisms of (-)-epigallocatechin gallate and (-)-epicatechin gallate on peroxyl radicals and formation of superoxide during the inhibitory action. Free Radic. Biol. Med. 1999, 27, 855–863. [Google Scholar] [CrossRef]
- Liu, Z.; Ma, L.P.; Zhou, B.; Yang, L.; Liu, Z.L. Antioxidative effects of green tea polyphenols on free radical initiated and photosensitized peroxidation of human low density lipoprotein. Chem. Phys. Lipids 2000, 106, 53–63. [Google Scholar] [CrossRef]
- Yilmaz, Y.; Toledo, R.T. Major flavonoids in grape seeds and skins: Antioxidant capacity of catechin, epicatechin, and gallic acid. J. Agric. Food Chem. 2004, 52, 255–260. [Google Scholar] [CrossRef] [PubMed]
- Beckerich, R.P.; Denault, L.J. Enzymes in the preparation of beer and fuel alcohol. In Enzymes and Their Role in Cereal Technology; Kruger, J.E., Lineback, D., Stauffer, C.E., Eds.; American Association of Cereal Chemists: St. Paul, MN, USA, 1987; pp. 335–354. [Google Scholar]
- Lekkas, C.; Hill, A.; Taidi, B.; Hodgson, J.; Stewart, G. The role of small wort peptides in brewing fermentations. J. Inst. Brew. 2009, 115, 134–139. [Google Scholar] [CrossRef]
- Lekkas, C.; Stewart, G.; Hill, A.; Taidi, B.; Hodgson, J. The importance of free amino nitrogen in wort and beer. Tech. Q.-Master Brew. Assoc. Am. 2005, 42, 113. [Google Scholar]
- Shellhammer, T.H. Beer color. In Beer: A Quality Perspective; Bamforth, C.W., Russell, I., Stewart, G.G., Eds.; Academic Press: London, UK, 2008; pp. 221–226. [Google Scholar]
- Bamforth, C.W. Beer, carbohydrates and diet. J. Inst. Brew. 2005, 111, 259–264. [Google Scholar] [CrossRef]
- Bamforth, C.W. Chemistry of Brewing; Elsevier Science Ltd.: Amsterdam, The Netherlands, 2003. [Google Scholar]
Figure 1.
Safrari cultivar.

Figure 2.
Vernonia amygdalina (bitter leaf).

Figure 3.
Green coffee bean.

Figure 4.
General work overview (MC = moisture content; GE = germinative energy; GC = germinative capacity; TCW = thousand corn weight; DP = diastatic power; FAN = free amino nitrogen: SG = specific gravity; TP = total polyphenols; TA = titratable acidity; ABV = alcohol by volume).
Figure 4.
General work overview (MC = moisture content; GE = germinative energy; GC = germinative capacity; TCW = thousand corn weight; DP = diastatic power; FAN = free amino nitrogen: SG = specific gravity; TP = total polyphenols; TA = titratable acidity; ABV = alcohol by volume).

Figure 5.
Processing of Vernonia amygdalina leaves.

Figure 6.
Processing of coffee beans.

Figure 7.
Sorghum malting process.

Figure 8.
Decantation mashing process.

Figure 9.
Brewing process.

Figure 10.
Hedonic nine-point scale grading for beer 1 (100% lactose and 0% coffee).

Figure 11.
Hedonic nine-point scale grading for beer 2 (75% lactose and 25% coffee).

Figure 12.
Hedonic nine-point scale grading for beer 3 (50% lactose and 50% coffee).

Figure 13.
Hedonic nine-point scale grading for beer 4 (25% lactose and 75% coffee).

Figure 14.
Hedonic nine-point scale grading for beer 5 (0% lactose and 100% coffee).


Table 1.
Characteristics of commercial enzyme preparations used during mashing.
| Commercial Mashing Enzyme | ||
|---|---|---|
| Hitempase 2XL | Bioglucanase TX | |
| Organism of origin | Bacillus licheniformis | Trichoderma reesei |
| Activity | 4416.29 ± 19.34 U/mL | 750 BGU/mL |
| Description | α-amylase | β-glucanase |
| Optimum temperature (°C) | 60–95 | 60 |
| Optimum pH | 4–8 | 4.5–6.5 |
| Recommended application level in adjuncts | 60 U/g | 0.01 and 0.025% (v/w) |
| Form | Solution | Solution |
Table 2.
Sorghum malt types and quantities used during mashing.
| Sorghum Malt Type | Quantity/kg |
|---|---|
| Pale malt | 3.1 |
| Caramel malt | 1.2 |
| Toasted malt | 0.3 |
| Roasted malt | 0.4 |
Table 3.
Experimental matrix.
| Std | Run | Block | Proportion | Quantity (g) | ||
|---|---|---|---|---|---|---|
| : Lactose | : Coffee | : Lactose | : Coffee | |||
| 4 | 1 | Block 1 | 1.000 | 0.000 | 500 | 0 |
| 1 | 2 | Block 1 | 0.750 | 0.250 | 375 | 125 |
| 3 | 3 | Block 1 | 0.500 | 0.500 | 250 | 250 |
| 2 | 4 | Block 1 | 0.250 | 0.750 | 125 | 375 |
| 5 | 5 | Block 1 | 0.000 | 1.000 | 0 | 500 |
Table 4.
Physicochemical characteristics of unmalted and malted sorghum.
| Characteristics | Unmalted Safrari | Safrari Malt |
|---|---|---|
| Water content (%) | 8.50 ± 0.01 | 4.80 ± 0.56 |
| Germinative capacity (%) | 99.30 ± 0.58 | N.D. |
| Germinative energy (4 mL) (%) | 98.60 ± 1.79 | N.D. |
| Germinative energy (8 mL) (%) | 97.00 ± 1.21 | N.D. |
| Thousand corn weight (g) | 48.10 ± 0.02 | 38.00 ± 1.35 |
| Diastatic power (WK) | N.D. | 187.40 ± 7.89 |
| Total ash (%) | 1.30 ± 0.10 | 0.90 ± 0.22 |
N.D. = not determined.
Table 5.
Physicochemical characteristics of worts.
| Factors | Responses | |||||||
|---|---|---|---|---|---|---|---|---|
| X1 | X2 | SG | pH | Turbidity (NTU) | TP (mgGAE/L) | FAN (mg/L) | Colour (EBC) | TA (g/L H2T) |
| 1.000 | 0.000 | 1.0748 | 5.79 ± 0.01 | 606.0 ± 0.8 | 416.0 ± 0.1 | 308.0 ± 0.2 | 186.40 ± 0.12 | 2.58 ± 0.04 |
| 0.750 | 0.250 | 1.0728 | 5.73 ± 0.00 | 375.0 ± 1.2 | 487.0 ± 0.1 | 313.0 ± 0.2 | 242.50 ± 2.04 | 2.78 ± 0.10 |
| 0.500 | 0.500 | 1.0704 | 5.68 ± 0.01 | 281.0 ± 0.5 | 615.0 ± 0.1 | 317.0 ± 0.5 | 192.50 ± 0.20 | 2.84 ± 0.01 |
| 0.250 | 0.750 | 1.0632 | 5.63 ± 0.00 | 149.0 ± 0.5 | 441.0 ± 0.1 | 339.0 ± 0.9 | 146.70 ± 3.00 | 2.83 ± 0.00 |
| 0.000 | 1.000 | 1.0592 | 5.41 ± 0.01 | 91.0 ± 0.0 | 442.0 ± 0.0 | 286.0 ± 0.2 | 151.30 ± 0.12 | 2.84 ± 0.00 |
Table 6.
Physicochemical characteristics of beers.
| Factors | Responses | ||||||||
|---|---|---|---|---|---|---|---|---|---|
| X1 | X2 | SG | pH | Turbidity (NTU) | TP (mg GAE/L) | FAN (mg/L) | Colour (EBC) | TA (g/L H2T) | ABV (%) |
| 1.000 | 0.000 | 1.0040 | 4.64 ± 0.00 | 120.0 ± 0.5 | 108.0 ± 0.6 | 140.0 ± 0.1 | 155.00 ± 0.00 | 4.38 ± 0.02 | 9.30 ± 0.00 |
| 0.750 | 0.250 | 1.0027 | 4.62±0.01 | 299.0 ± 0.5 | 127.0 ± 0.7 | 131.0 ± 0.4 | 189.70 ± 0.20 | 4.37 ± 0.02 | 9.20 ± 0.09 |
| 0.500 | 0.500 | 0.9987 | 4.68 ± 0.03 | 141.0 ± 0.0 | 135.0 ± 0.4 | 120.0 ± 0.5 | 183.90 ± 0.24 | 4.18 ± 0.04 | 9.40 ± 0.01 |
| 0.250 | 0.750 | 0.9960 | 4.57 ± 0.00 | 11.0 ± 0.1 | 139.0 ± 0.7 | 112.0 ± 0.1 | 109.20 ± 1.18 | 3.97 ± 0.05 | 8.80 ± 0.02 |
| 0.000 | 1.000 | 0.9923 | 4.47 ± 0.02 | 6.0 ± 0.0 | 146.0 ± 0.6 | 110.0 ± 0.2 | 112.50 ± 0.00 | 3.92 ± 0.08 | 8.80 ± 0.02 |
© 2019 by the authors. Licensee MDPI, Basel, Switzerland. This article is an open access article distributed under the terms and conditions of the Creative Commons Attribution (CC BY) license (http://creativecommons.org/licenses/by/4.0/).
Share and Cite
MDPI and ACS Style
Mbeh. Harry, F.; Zangué Steve Carly, D.; Emmanuel Jong, N. Sorghum Coffee–Lactose Stout Production and Its Physico-Chemical Characterization. Beverages 2019, 5, 20. https://0-doi-org.brum.beds.ac.uk/10.3390/beverages5010020
AMA Style
Mbeh. Harry F, Zangué Steve Carly D, Emmanuel Jong N. Sorghum Coffee–Lactose Stout Production and Its Physico-Chemical Characterization. Beverages. 2019; 5(1):20. https://0-doi-org.brum.beds.ac.uk/10.3390/beverages5010020
Chicago/Turabian StyleMbeh. Harry, Fali, Desobgo Zangué Steve Carly, and Nso Emmanuel Jong. 2019. "Sorghum Coffee–Lactose Stout Production and Its Physico-Chemical Characterization" Beverages 5, no. 1: 20. https://0-doi-org.brum.beds.ac.uk/10.3390/beverages5010020
Note that from the first issue of 2016, this journal uses article numbers instead of page numbers. See further details here.