Understanding 21st Century Bordeaux Wines from Wine Reviews Using Naïve Bayes Classifier

Department of Computer Science, University of Central Arkansas, Conway, AR 72034, USA
*
Author to whom correspondence should be addressed.
Beverages 2020, 6(1), 5; https://0-doi-org.brum.beds.ac.uk/10.3390/beverages6010005
Submission received: 31 October 2019
/
Revised: 2 December 2019
/
Accepted: 23 December 2019
/
Published: 14 January 2020
Abstract
:Wine has been popular with the public for centuries; in the market, there are a variety of wines to choose from. Among all, Bordeaux, France, is considered as the most famous wine region in the world. In this paper, we try to understand Bordeaux wines made in the 21st century through Wineinformatics study. We developed and studied two datasets: the first dataset is all the Bordeaux wine from 2000 to 2016; and the second one is all wines listed in a famous collection of Bordeaux wines, 1855 Bordeaux Wine Official Classification, from 2000 to 2016. A total of 14,349 wine reviews are collected in the first dataset, and 1359 wine reviews in the second dataset. In order to understand the relation between wine quality and characteristics, Naïve Bayes classifier is applied to predict the qualities (90+/89−) of wines. Support Vector Machine (SVM) classifier is also applied as a comparison. In the first dataset, SVM classifier achieves the best accuracy of 86.97%; in the second dataset, Naïve Bayes classifier achieves the best accuracy of 84.62%. Precision, recall, and f-score are also used as our measures to describe the performance of our models. Meaningful features associate with high quality 21 century Bordeaux wines are able to be presented through this research paper.
1. Introduction
The ancient beverage, wine, has remained popular in modern times. While the ancients had mostly wine available from neighboring vineyards, the number and variety of wines available for purchase have exploded in modern times. Consumers are assaulted with an endless number of varieties and flavors. Some examples include red wine, white wine, rose wine, starch-based wine, etc., which are then also based on a variety of grapes, fruits like apples, and berries. For a non-expert, unfamiliar with the various nuances that make each brand distinct, the complexity of decision making has vastly increased. In such a competitive market, wine reviews and rankings matter a lot since they become part of the heuristics that drive consumers decision making. Producers of wine gain a competitive advantage by knowing what factors contribute the most to quality as determined by rankings. What has also changed is the amount of data available. Moore’s law and other advances in computing have allowed for the collection and analysis of vast amounts of data. Data mining is the utilization of various statistics, algorithms, and other tools of analysis to uncover useful insights into all this data. The goal of data mining is to gain predictive or descriptive information in the domain of interest. To help producers better understand the determinants of wine quality we decided to harness the power of these data mining techniques on two datasets on wine produced in the Bordeaux region. This region is the biggest wine delivering district in France and one of the most influential wine districts in the world.
There is a lot of research that focuses on the price and vintage of Bordeaux wines [1,2,3] from a historical and economic data. Shanmuganathan et al. applied decision tree and statistical methods for modeling seasonal climate effects on grapevine yield and wine quality [4]. Noy et al. developed the ontology on Bordeaux wine [5,6]. Most of these Bordeaux or wine related data mining researches applied their works on small to medium sized wine datasets [7,8,9,10]. However, to the best of our knowledge, there is almost no research utilizing data mining to determine the quality and character of various vintages of wines in Bordeaux comparable to the size of our dataset.
The performance of data mining researches relies on the quality of the data. In this research work, we focus on the wine reviews in human language format with a score as a verdict to wine. Many researches point out the inconsistency between wine judges as well as the bias in taste [11,12]. The small group of wine experts many not agree with each other while they taste research designated wines. Every wine expert might have their own tasting palate, wine preference, choice of word, etc. [13,14,15,16,17,18]. However, this type of research falls into small or medium at best size of dataset, which is not suitable for true data mining research works. Therefore, this paper focus on a single reputable wine review organization: Wine Spectator to gather thousands of wine reviews as the research input dataset. Although there are some challenges on Wine Spectator’s rating, ranking, and comments [19,20,21], based on our previous researches [22,23,24,25], the correlation between wine reviews and their grading are strong. To predict a wine receives a 90+ or 90− score based on Wine Spectators’ wine reviews, the data mining models built on a dataset with more than 100,000 wine reviews achieved 87.21% and 84.71% accuracy via Support Vector Machine (SVM) and Naïve Bayes model, accordingly. The regression model built on the same dataset to predict a wine’s actual score based on Wine Spectator’s wine reviews was only 1.6 points away on Mean Absolute Error (MAE) evaluation [25]. These findings support that the large amount of Wine Spectators’ reviews are suitable for our data mining research.
To study 21 century Bordeaux wines based on our previous works, we developed two new datasets related to Bordeaux. For the first dataset, we collected all the available Bordeaux wine reviews on the latest vintage (2000–2016) from the Wine Spectator [26]. These reviews are then converted from human language format into computer encoded codes via the computational wine wheel proposed in the research of Wineinformatics [22,23,24,25]. For the second dataset, we are interested in a famous collection of Bordeaux wines, 1855 Bordeaux Wine Official Classification [27]. The quality of the wine in both data sets was determined by experts in a blind taste test. This was based upon an interval scale from 50–100 in which 100 was determined to be the highest quality while 50 being the wine that was not recommended due to quality issues. We will train algorithms on both datasets and see which one is most effective at classifying it in 90+ category or 89− category via Naïve Bayes and SVM. If the algorithms are effective, we can potentially uncover the words most predictive of wine quality and enlighten producers on how to maintain and/or improve the quality of their wine allowing them to succeed in such a competitive environment.
2. Bordeaux Wine Dataset
2.1. Wine Spectator
Wine Spectator is a wine evaluation company which gives a renowned and credible reviews of the wine by an expert to the people who are interested in wine. The company has published a total of around 400,000 wine reviews, and the magazines will come out in 15 issues a year, and there are between 400 to 1000 wine reviews per issue. For testing the wine from wine spectator reviver, the test experts use a blind test methodology, which means they only knows the year and type of the wine when they test it without knowing the name of the wine. There is a 50–100 score scale on the evaluation of the wine used by Wine Spectator [28].
- 95–100 Classic: a great wine
- 89–94 Outstanding: a wine of superior character and style
- 85–89 Very good: a wine with special qualities
- 80–84 Good: a solid, well-made wine
- 75–79 Mediocre: a drinkable wine that may have minor flaws
- 50–74 Not recommended
Following is a wine review example of the famous Château Latour Pauillac 2009, which cost $1600 in 2012:
Château Latour Pauillac 2009 99pts $1600
This seems to come full circle, with a blazing iron note and mouthwatering acidity up front leading to intense, vibrant cassis, blackberry and cherry skin flavors that course along, followed by the same vivacious minerality that started things off. The tobacco, ganache and espresso notes seem almost superfluous right now, but they’ll join the fray in due time. The question is, can you wait long enough? Best from 2020 through 2040. 9580 cases made—JM.
Country: France • Region: Bordeaux • Issue Date: 31 March 2012
2.2. The Computational Wine Wheel
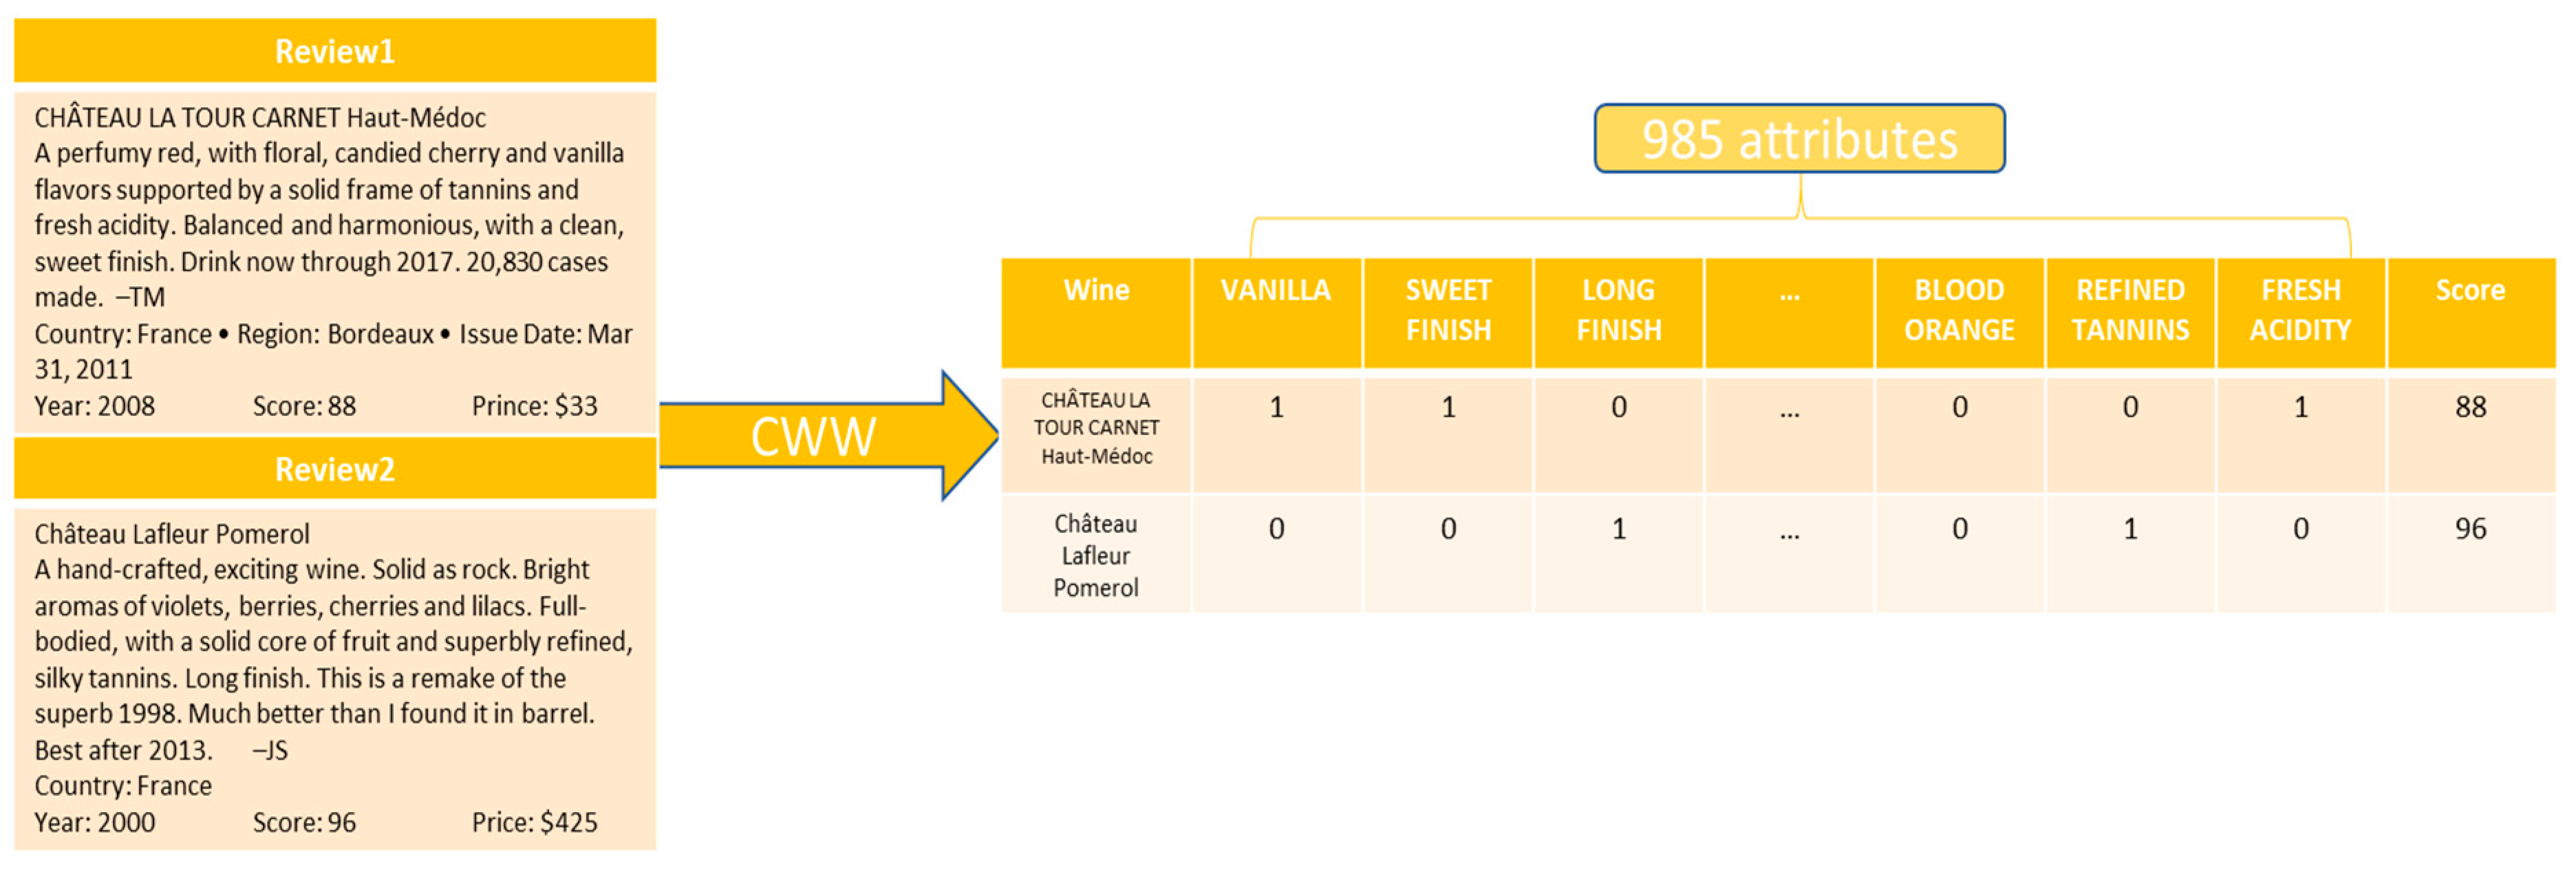
Since the wine reviews are stored in human language format, we have to convert reviews into machine understandable via the computational wine wheel [23]. The computational wine wheel works as a dictionary to one-hot encoding to convert words into vectors. For example, in the wine review, there are some words that contain fruits such as apple, blueberry, plum, etc. If the word matches the attribute in the computation wine wheel, it will be 1, otherwise, it will be 0. More examples can be found in Figure 1. Many other wine characteristics are included in the computational wine wheel other than fruit flavors, such as descriptive adjectives (balance, beautifully, etc.) and body of the wine (acidity, level of tannin, etc.). The computational wine wheel is also equipped with generalization function to generalize similar words into the same coding. For example, fresh apple, apple, and ripe apple are generalized into “Apple” since they represent the same flavor; yet, green apple belongs to “Green Apple” since the flavor of green apple is different from apple.
In this research, in order to understand the characteristics of classic (95+) and outstanding (90–94) wine, we use 90 points as a cutting point. If a wine receives a score equal/above 90 points out of 100, we mark the label as a positive (+) class to the wine. Otherwise, the label would be a negative (−) class. There are some wines that scored a ranged score, such as 85–88. We use the average of the ranged score to decide and assign the label.
2.3. Datasets
We developed two datasets in this research. The first one is the reviews for all the Bordeaux wines made in the 21st century (2000–2016). The second one is the reviews for all available wine listed in Bordeaux Wine Official Classification, made in the 21st century (2000–2016) as well. The second dataset is a subset of the first dataset. All the available wine reviews were collected from Wine Spectator. Details of each dataset will be discussed as follows.
2.3.1. ALL Bordeaux Wine Dataset
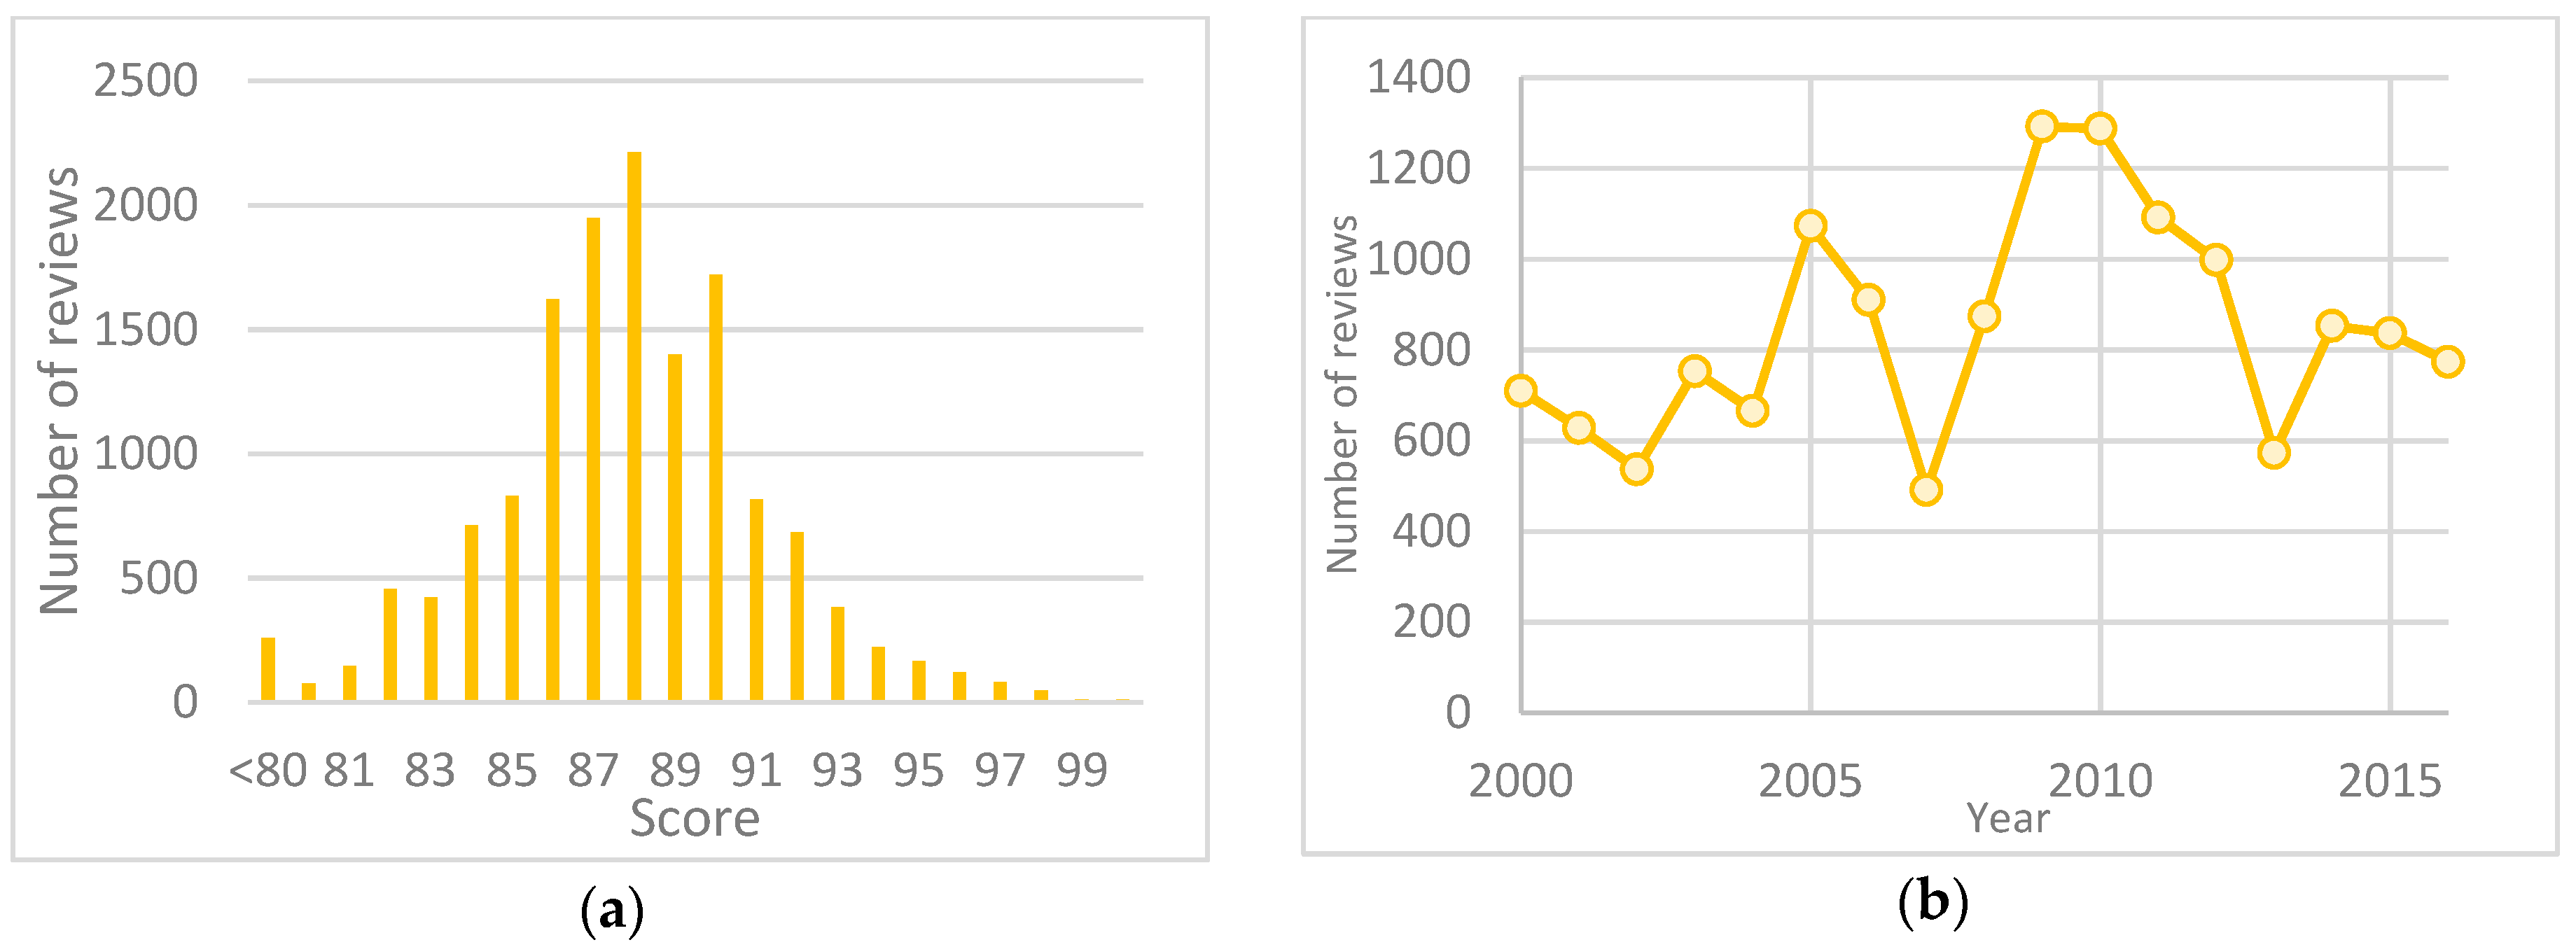
A total of 14,349 wines has been collected. There are 4263 90+ wines and 10,086 89− wines. The number of 89− wines is more than 90+ wines. The score distribution is given in Figure 2a. Most wines score between 86 and 90. Therefore, they fall into the category of “Very Good” wine. In Figure 2b, the line chart is used to represent the trend of number of wines has been reviewed in each year. The chart also reflects the quality of vintages. More than 1200 wines were reviewed in 2009 and 2010, which indicates that 2009 and 2010 are good vintages in Bordeaux. Wine makers are more willing to send their wines to be reviewed if their wines are good.
2.3.2. 1855 Bordeaux Wine Official Classification Dataset
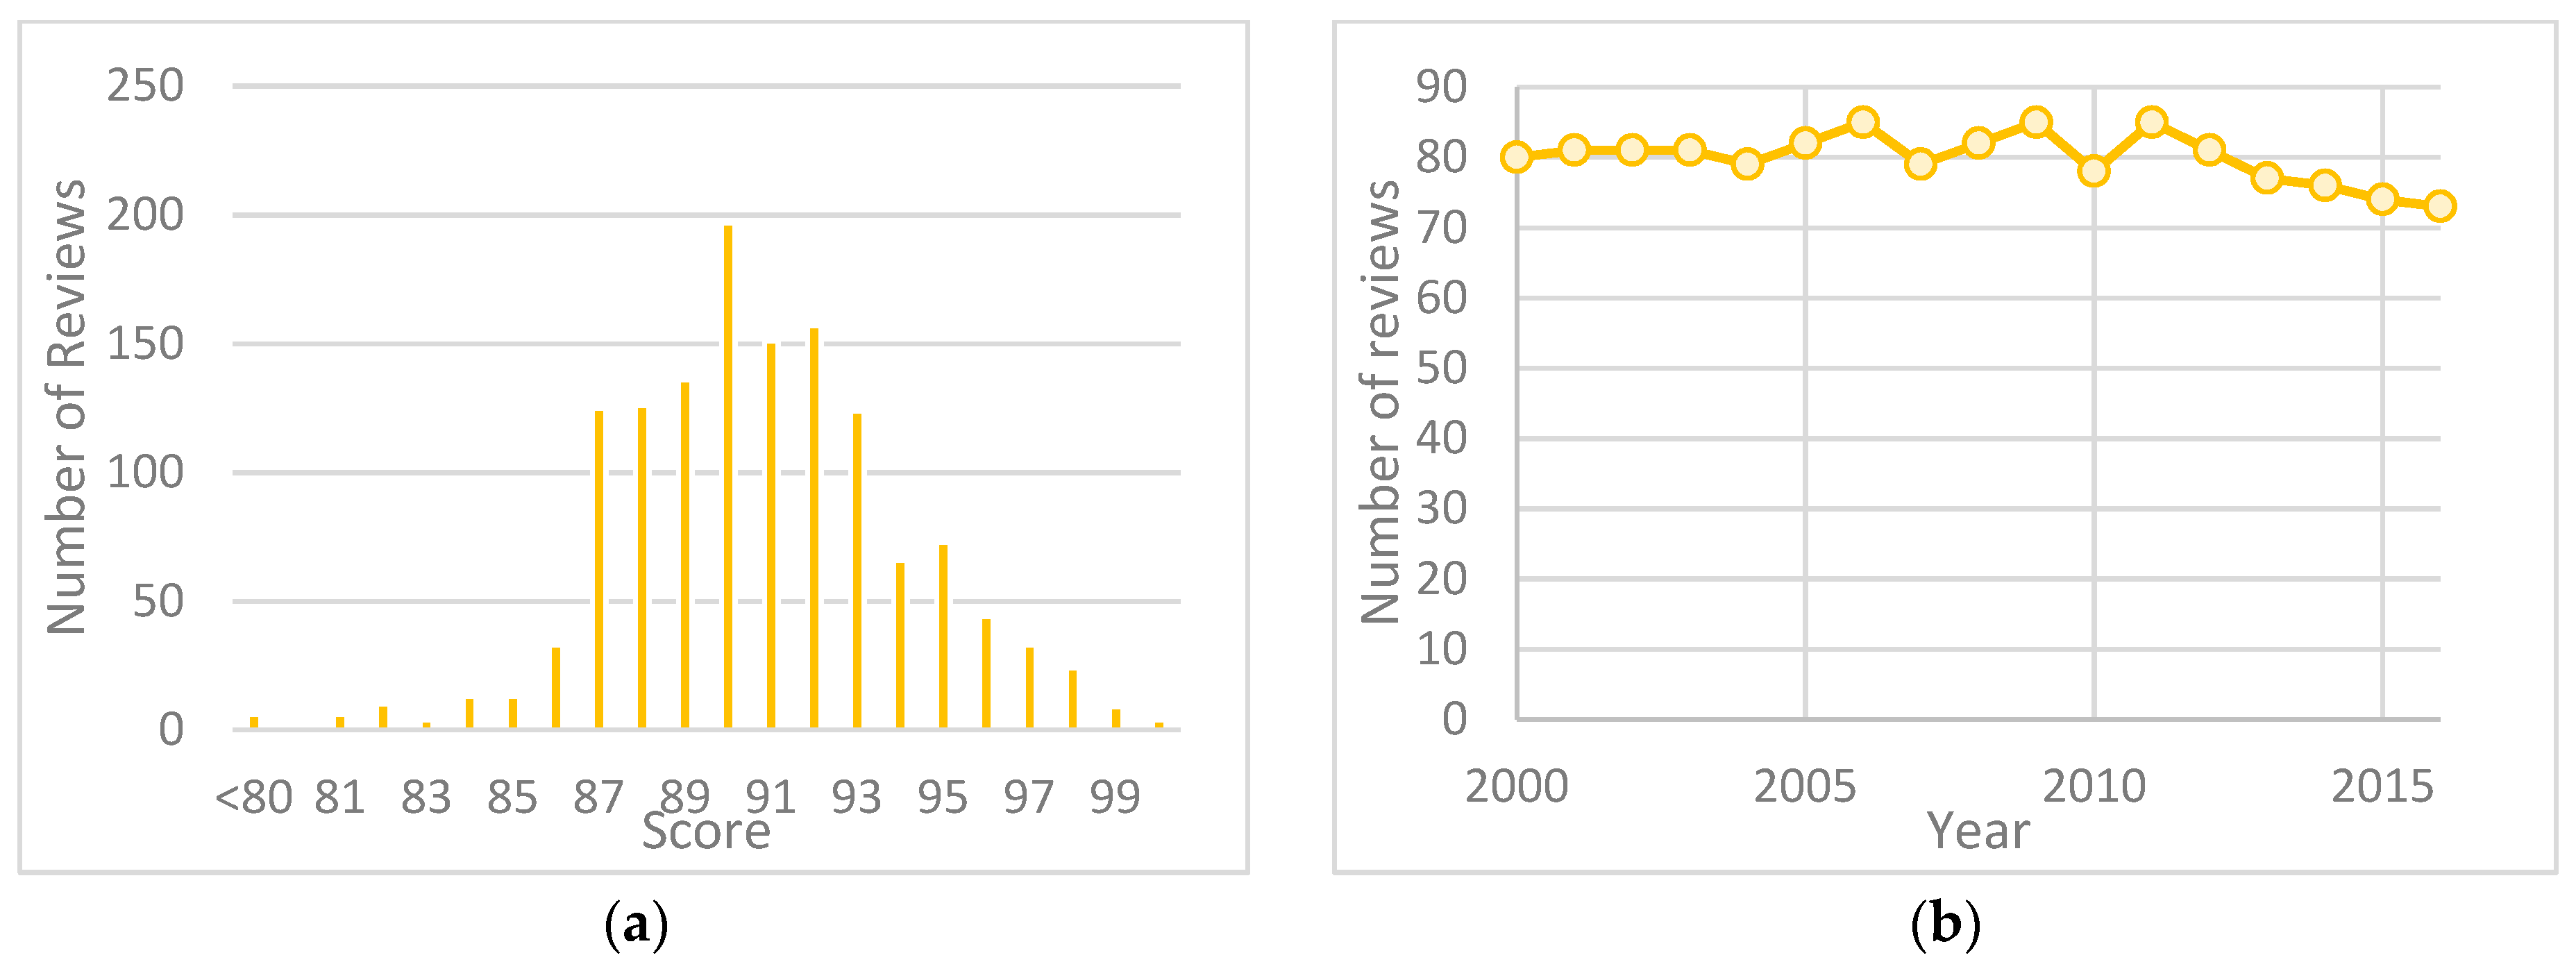
A total of 1359 wines has been collected. In this dataset, we have 882 90+ wines and 477 89− wines. The score distribution is given in Figure 2. Unlike the data distribution of the first dataset, which has much more 89− wines than 90+ wines, in Wine Spectator, the wines selected in this research are elite choices based on Bordeaux Wine Official Classification in 1855 (a complete list of Bordeaux Wine Official Classification in 1855 is given in Appendix A). Therefore, classic (95+ points) and outstanding (90–94 points) wines are the majority of this dataset. The number of wines has been reviewed annually is given in Figure 3b. Since Bordeaux Wine Official Classification in 1855 is a famous collection of Bordeaux wines, wine makers send their wine for review almost every year. Therefore, the line chart remains stable, which is very different from Figure 2b. Regardless, some wines listed in Bordeaux Wine Official Classification in 1855 may still missing their wine reviews in Wine Spectator. A complete list of wines and vintages we cannot find within this dataset’s scope is listed in Appendix B.
3. Methods
3.1. Classification Algorithms
Our goal of this research is to find out the important wine characteristics/attributes toward 21st century general Bordeaux wines. Applying white box classification algorithms is a way to achieve the goal. Based on the previous research, Naïve Bayes classifier algorithm achieved the best accuracy among all applied white box classification algorithms; and Support Vector Machine (SMV) classifier algorithm, which is from black box classification algorithms family, always had slightly better accuracy than Naïve Bayes [29]. Therefore, in this research, we applied Naïve Bayes classifier algorithm to find out the important wine characteristics/attributes toward 21st century general Bordeaux wines. Then we applied SMV classifier as a comparison to evaluate the goodness of Naïve Bayes classifier.
3.1.1. Naïve Bayes
Naïve Bayes is a commonly used machine learning classification algorithm. A Naïve Bayes classifier is a simple probabilistic classifier by applying Bayes’ theorem with ignoring the dependency between features.
Formula of Naïve Bayes classifier algorithm [30]:
Bayes’ Theorem:
- P(Y|X): The posterior probability of Y belongs to a particular class when X happens;
- P(X|Y): The prior probability of certain feature value X when Y belongs to a certain class;
- P(Y): prior probability of Y;
- P(X): prior probability of X.
Naïve Bayes Classifier:
: Compute all posterior probability of all values in X for all values in Y.
Naïve Bayes classifier makes the prediction based on the maximum of posterior probability.
Laplace Smoothing:
c: number of values in Y
When a value of X never appears in the training set, the prior probability of that value of X will be 0. If we do not use any techniques, will be 0, even when some of other prior probability of X are very high. This case does not seem fair to other X. Therefore, we use Laplace smoothing to handle zero prior probability.
3.1.2. SMV
“SVM are supervised learning models with associated learning algorithms that analyze data and recognize patterns, used for classification and regression analysis” [31]. SVM for classification will based on the training data, building a model by constructing “a hyperplane or set of hyperplanes in a high- or infinite-dimensional space, which can be used for classification, regression, or other tasks. Intuitively, a good separation is achieved by the hyperplane that has the largest distance to the nearest training data point of any class (so-called functional margin), since in general the larger the margin the lower the generalization error of the classifier”. After having the model, a test data is used to predict the accuracy. SVM light [32] is the version of SVM that was used to perform the classification of attributes for this project.
3.2. Evaluations
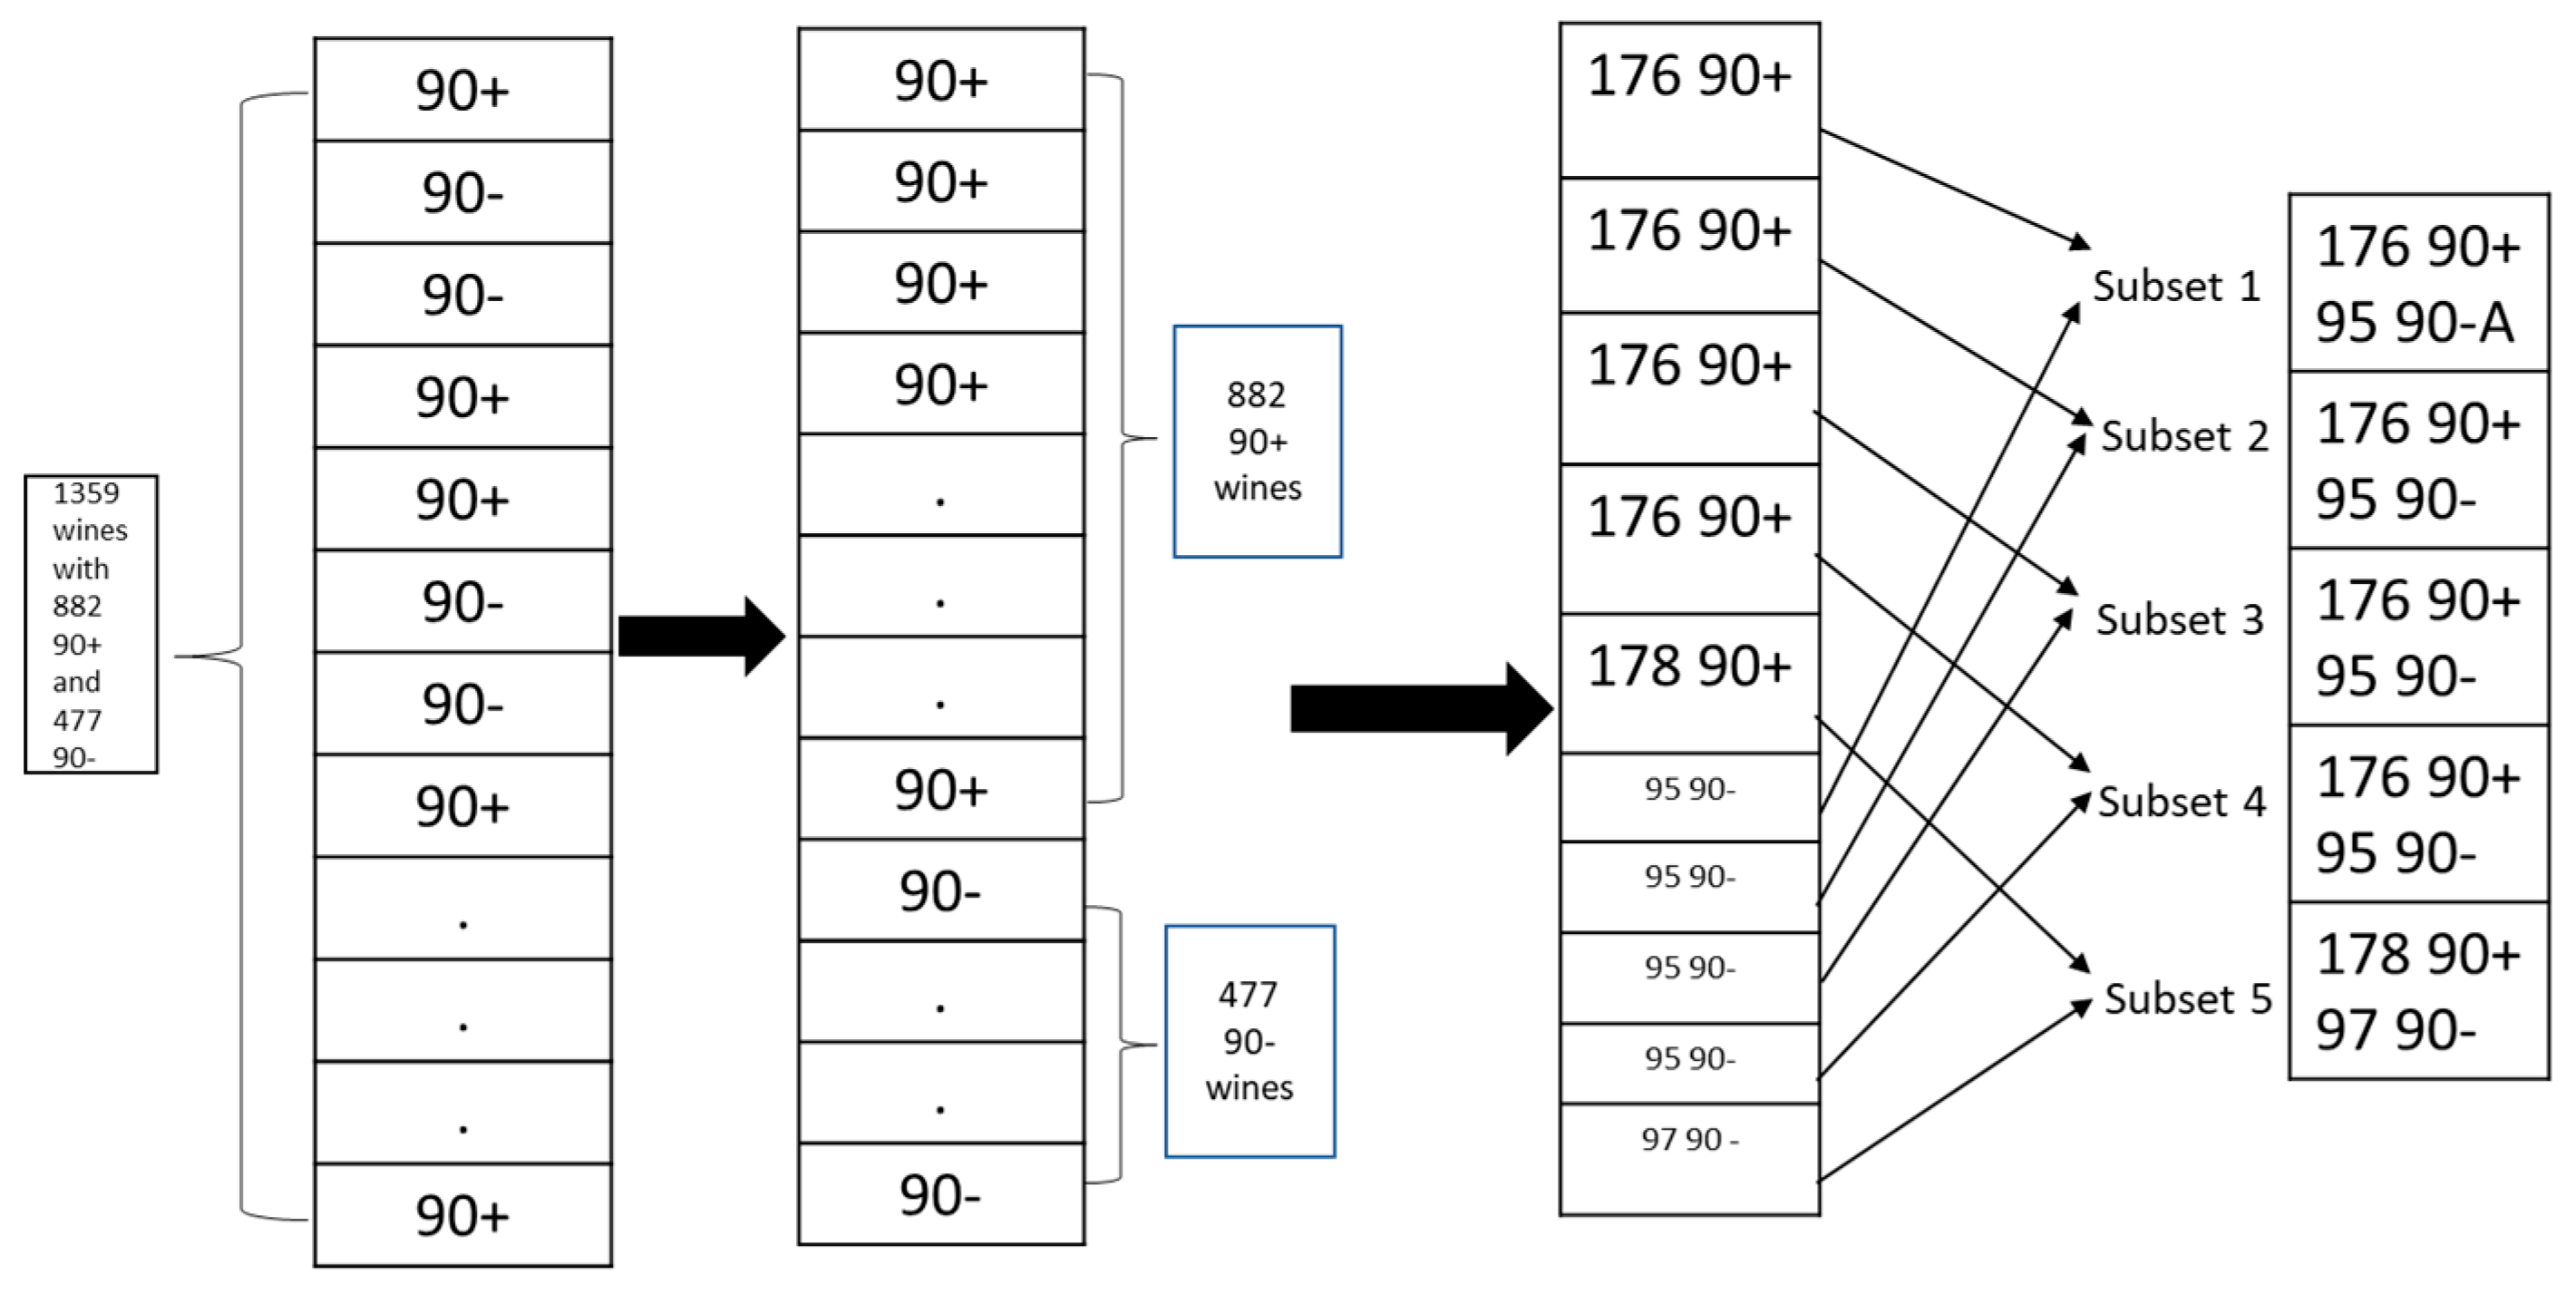
5-fold cross-validation, illustrated in Figure 4 and Figure 5, is used to evaluate the predictive performance of our models, especially the performance of the model for new data, which can reduce overfitting to some extent. First, we shuffle the dataset randomly. Second, we group 90+/89− wines. Third, split 90+ wine group and 89− wine group into 5 subsets separately. Fourth, combine first subset from 90+ wine group and first subset from 89− wine group into a new set, repeat the same process for the rest. In this way, we split our dataset into 5 subsets with the same distribution as the original dataset.
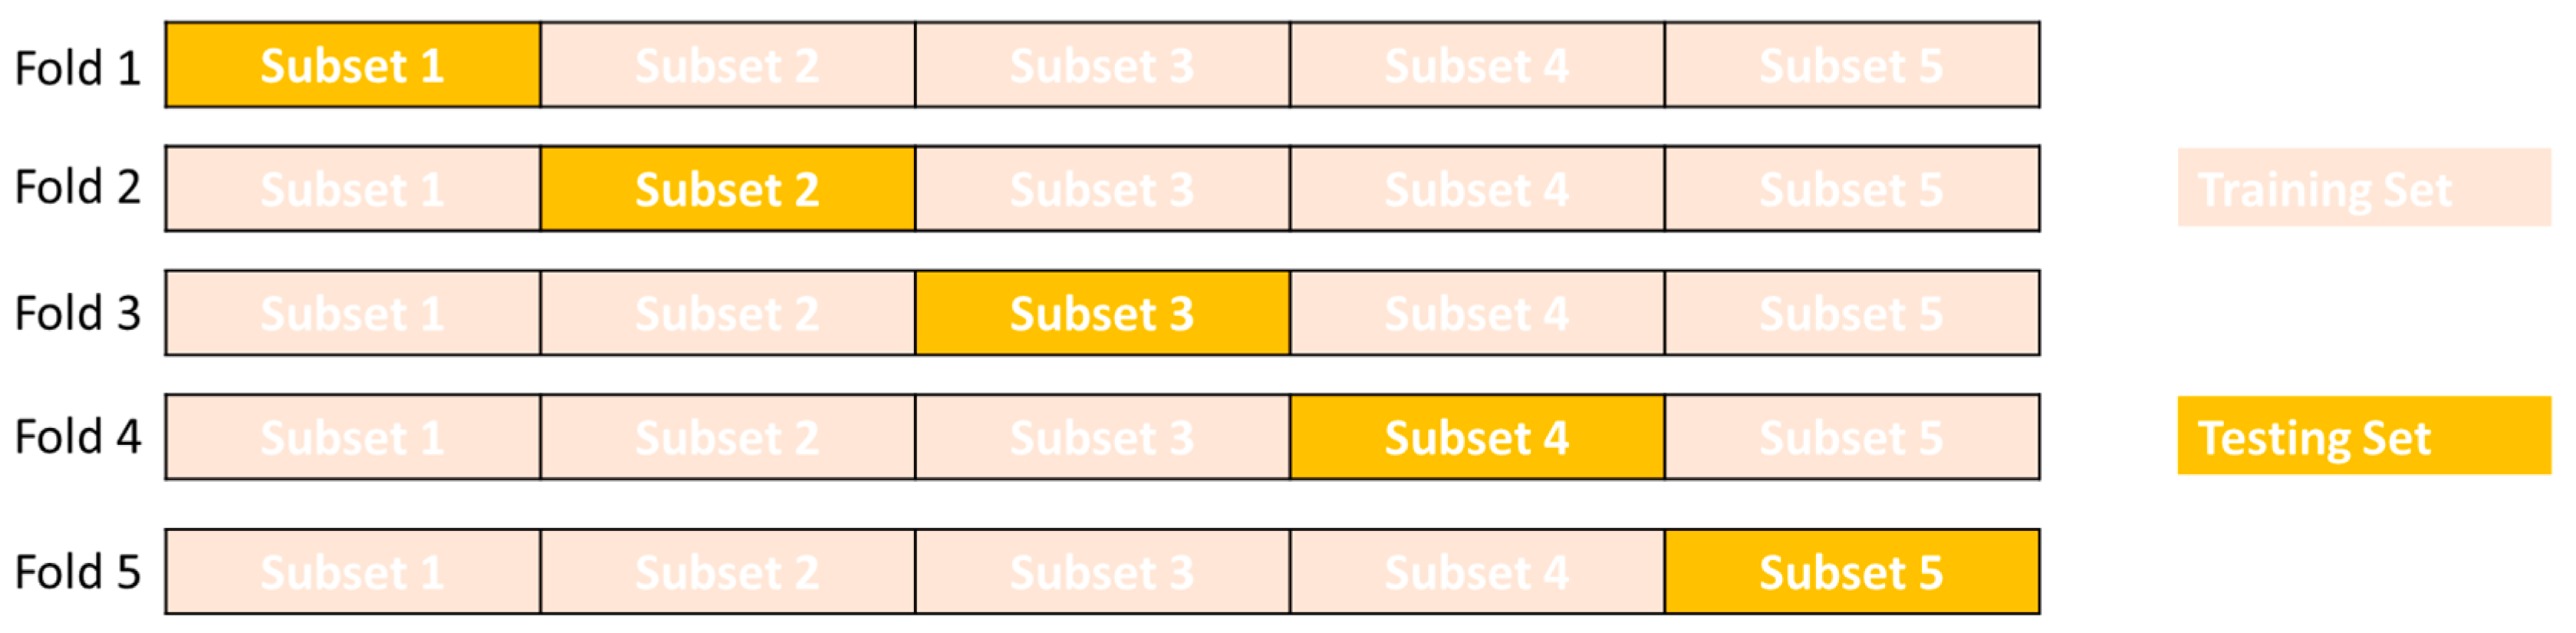
After data splitting, we use the subset 1 as testing set, the rest of the subsets as training set as fold 1; we use subset 2 as testing set, the rest of the subsets as training set as fold 2; Repeat the same process for the rest.
To evaluate the effectiveness of the classification model, several standard statistical evaluation metrics are used in this paper. First of all, we need to define True Positive (TP), True Negative (TN), False Positive (FP), and False Negative (FN) as:
- TP:
- The real condition is true (1) and predicted as true (1); 90+ wine correctly classified as 90+ wine;
- TN:
- The real condition is false (−1) and predicted as false (−1); 89− wine correctly classified as 89− wine;
- FP:
- The real condition is false (−1) but predicted as true (1); 89− wine incorrectly classified as 90+ wine;
- FN:
- The real condition is true (1) but predicted as false (−1); 90+ wine incorrectly classified as 89− wine.
If we use 90 points as a cutting point, to describe TP is this research’s perspective would be “if a wine scores equal/above 90 and the classification model also predicts it as equal/above 90”. In this research, we include the following evaluation metrics:
Accuracy: The proportion of wines that has been correctly classified among all wines. Accuracy is a very intuitive metric.
Recall: The proportion of 90+ wines was identified correctly. Recall explains the sensitivity of the model to 90+ wine.
Precision: The proportion of predicted 90+ wines was actually correct.
F-score: The harmonic mean of recall and precision. F-score takes both recall and precision into account, combining them into a single metric.
4. Results
4.1. ALL Bordeaux Wine Dataset
In ALL Bordeaux Wine dataset, both Naïve Bayes classifier and SVM classifier achieve 85% accuracy or above. SVM classifier achieves the highest accuracy of 86.97%. In terms of precision, SVM classifier has much better performance than Naïve Bayes Laplace classifier. Diametrically opposed in recall, Naïve Bayes Laplace classifier has much better performance. Naïve Bayes classifier and SVM classifier have very close F-scores. Overall, SMV has better performance in terms of accuracy and f-score. Details can be found in Table 1.
4.2. 1855 Bordeaux Wine Official Classification Dataset
In Bordeaux Wine Official Classification in 1855 dataset, both Naïve Bayes classifier and SVM classifier are able to achieve 81% accuracy or above. Naive Bayes Laplace classifier achieves the highest accuracy of 84.62%. In terms of precision, both classifiers are around 86%; SVM classifier achieves highest precision of 86.84%. In terms of recall, Naive Bayes Laplace classifier achieves the recall as high as 90.02%. In the combination of precision and recall, Naive Bayes Laplace classifier has the highest F-score of 88.38%. Overall, Naïve Bayes Laplace has better performance than SMV classifier in this specific Bordeaux wine dataset. Details can be found in Table 2.
4.3. Comparison of Two Datasets
SVM classifier achieves the best accuracy of 86.97% in ALL Bordeaux Wine dataset; Naïve Bayes Laplace achieves the best accuracy of 84.62% in 1855 Bordeaux Wine Official Classification dataset. The accuracies in both datasets are very close. However, compared to the second dataset, the models in the first dataset have relatively poor performance in terms of accuracy, recall, and f-score. This can be explained from their score distribution. In the first dataset, there are more 89− wines than 90+ wines, so the models can better identify 89− wines than 90+ wines. In the second dataset, there are more 90+ wines than 89− wines, so the models can better identify 90+ wines than 89− wines.
4.4. Visualization of 1855 Bordeaux Wine Official Classification Dataset
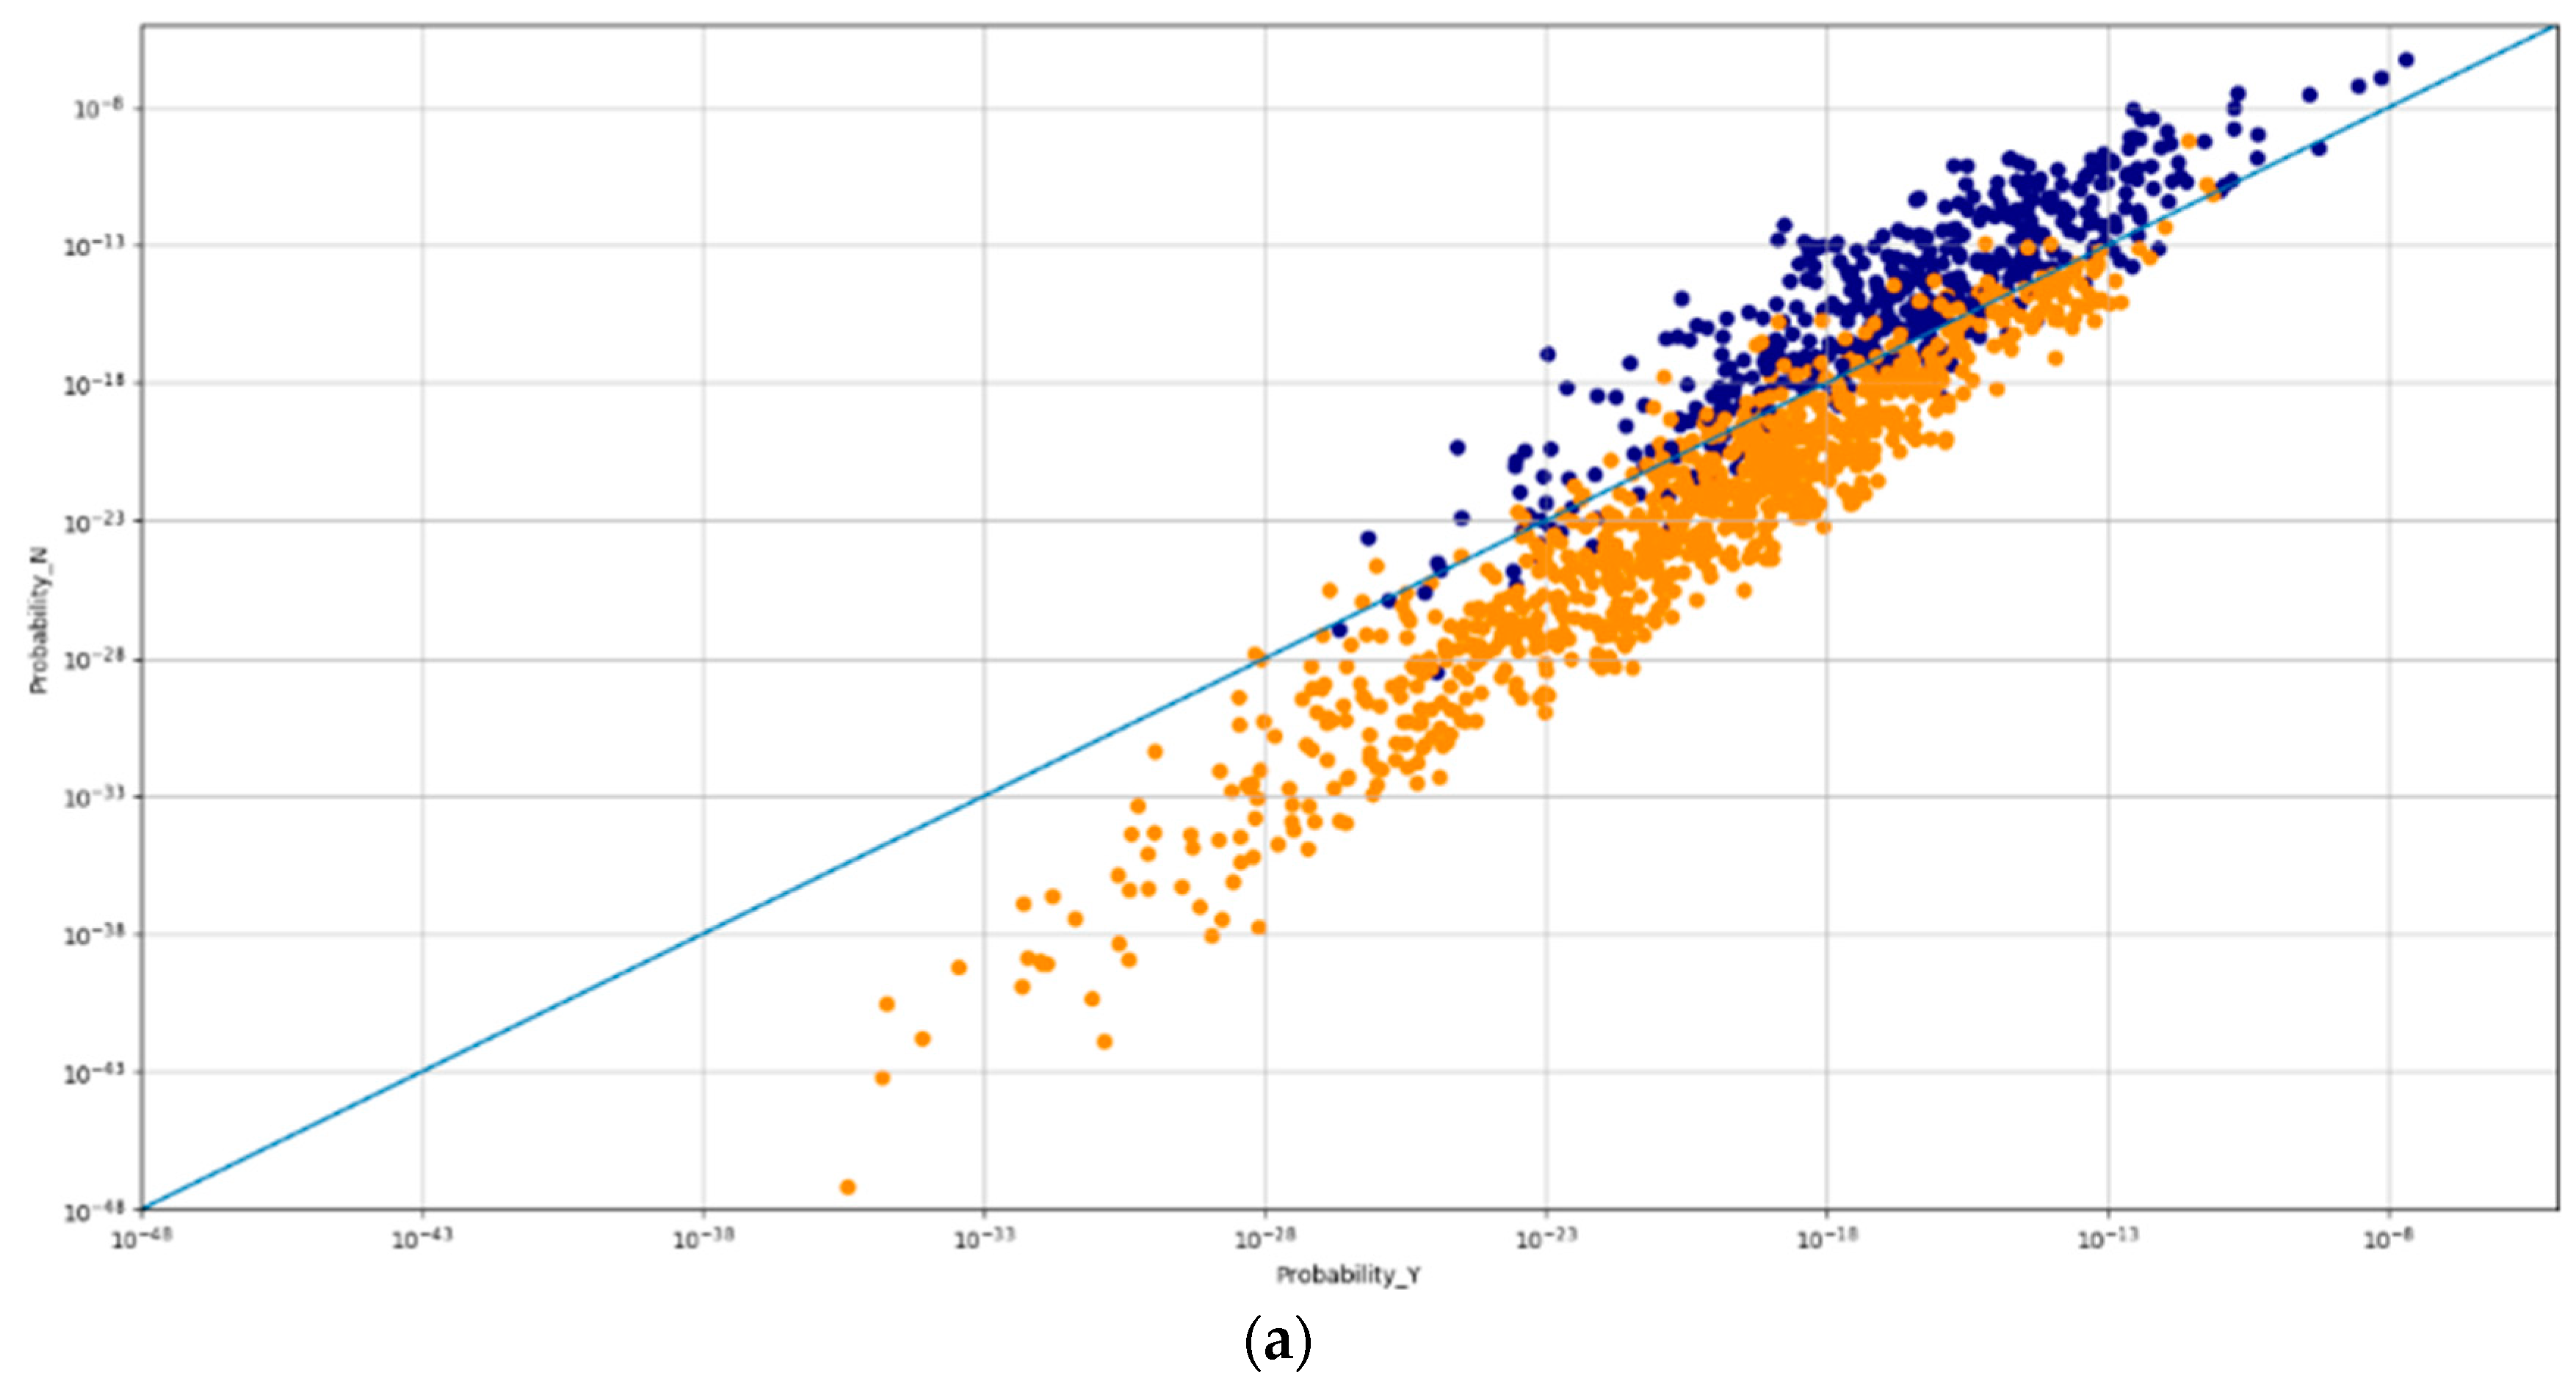
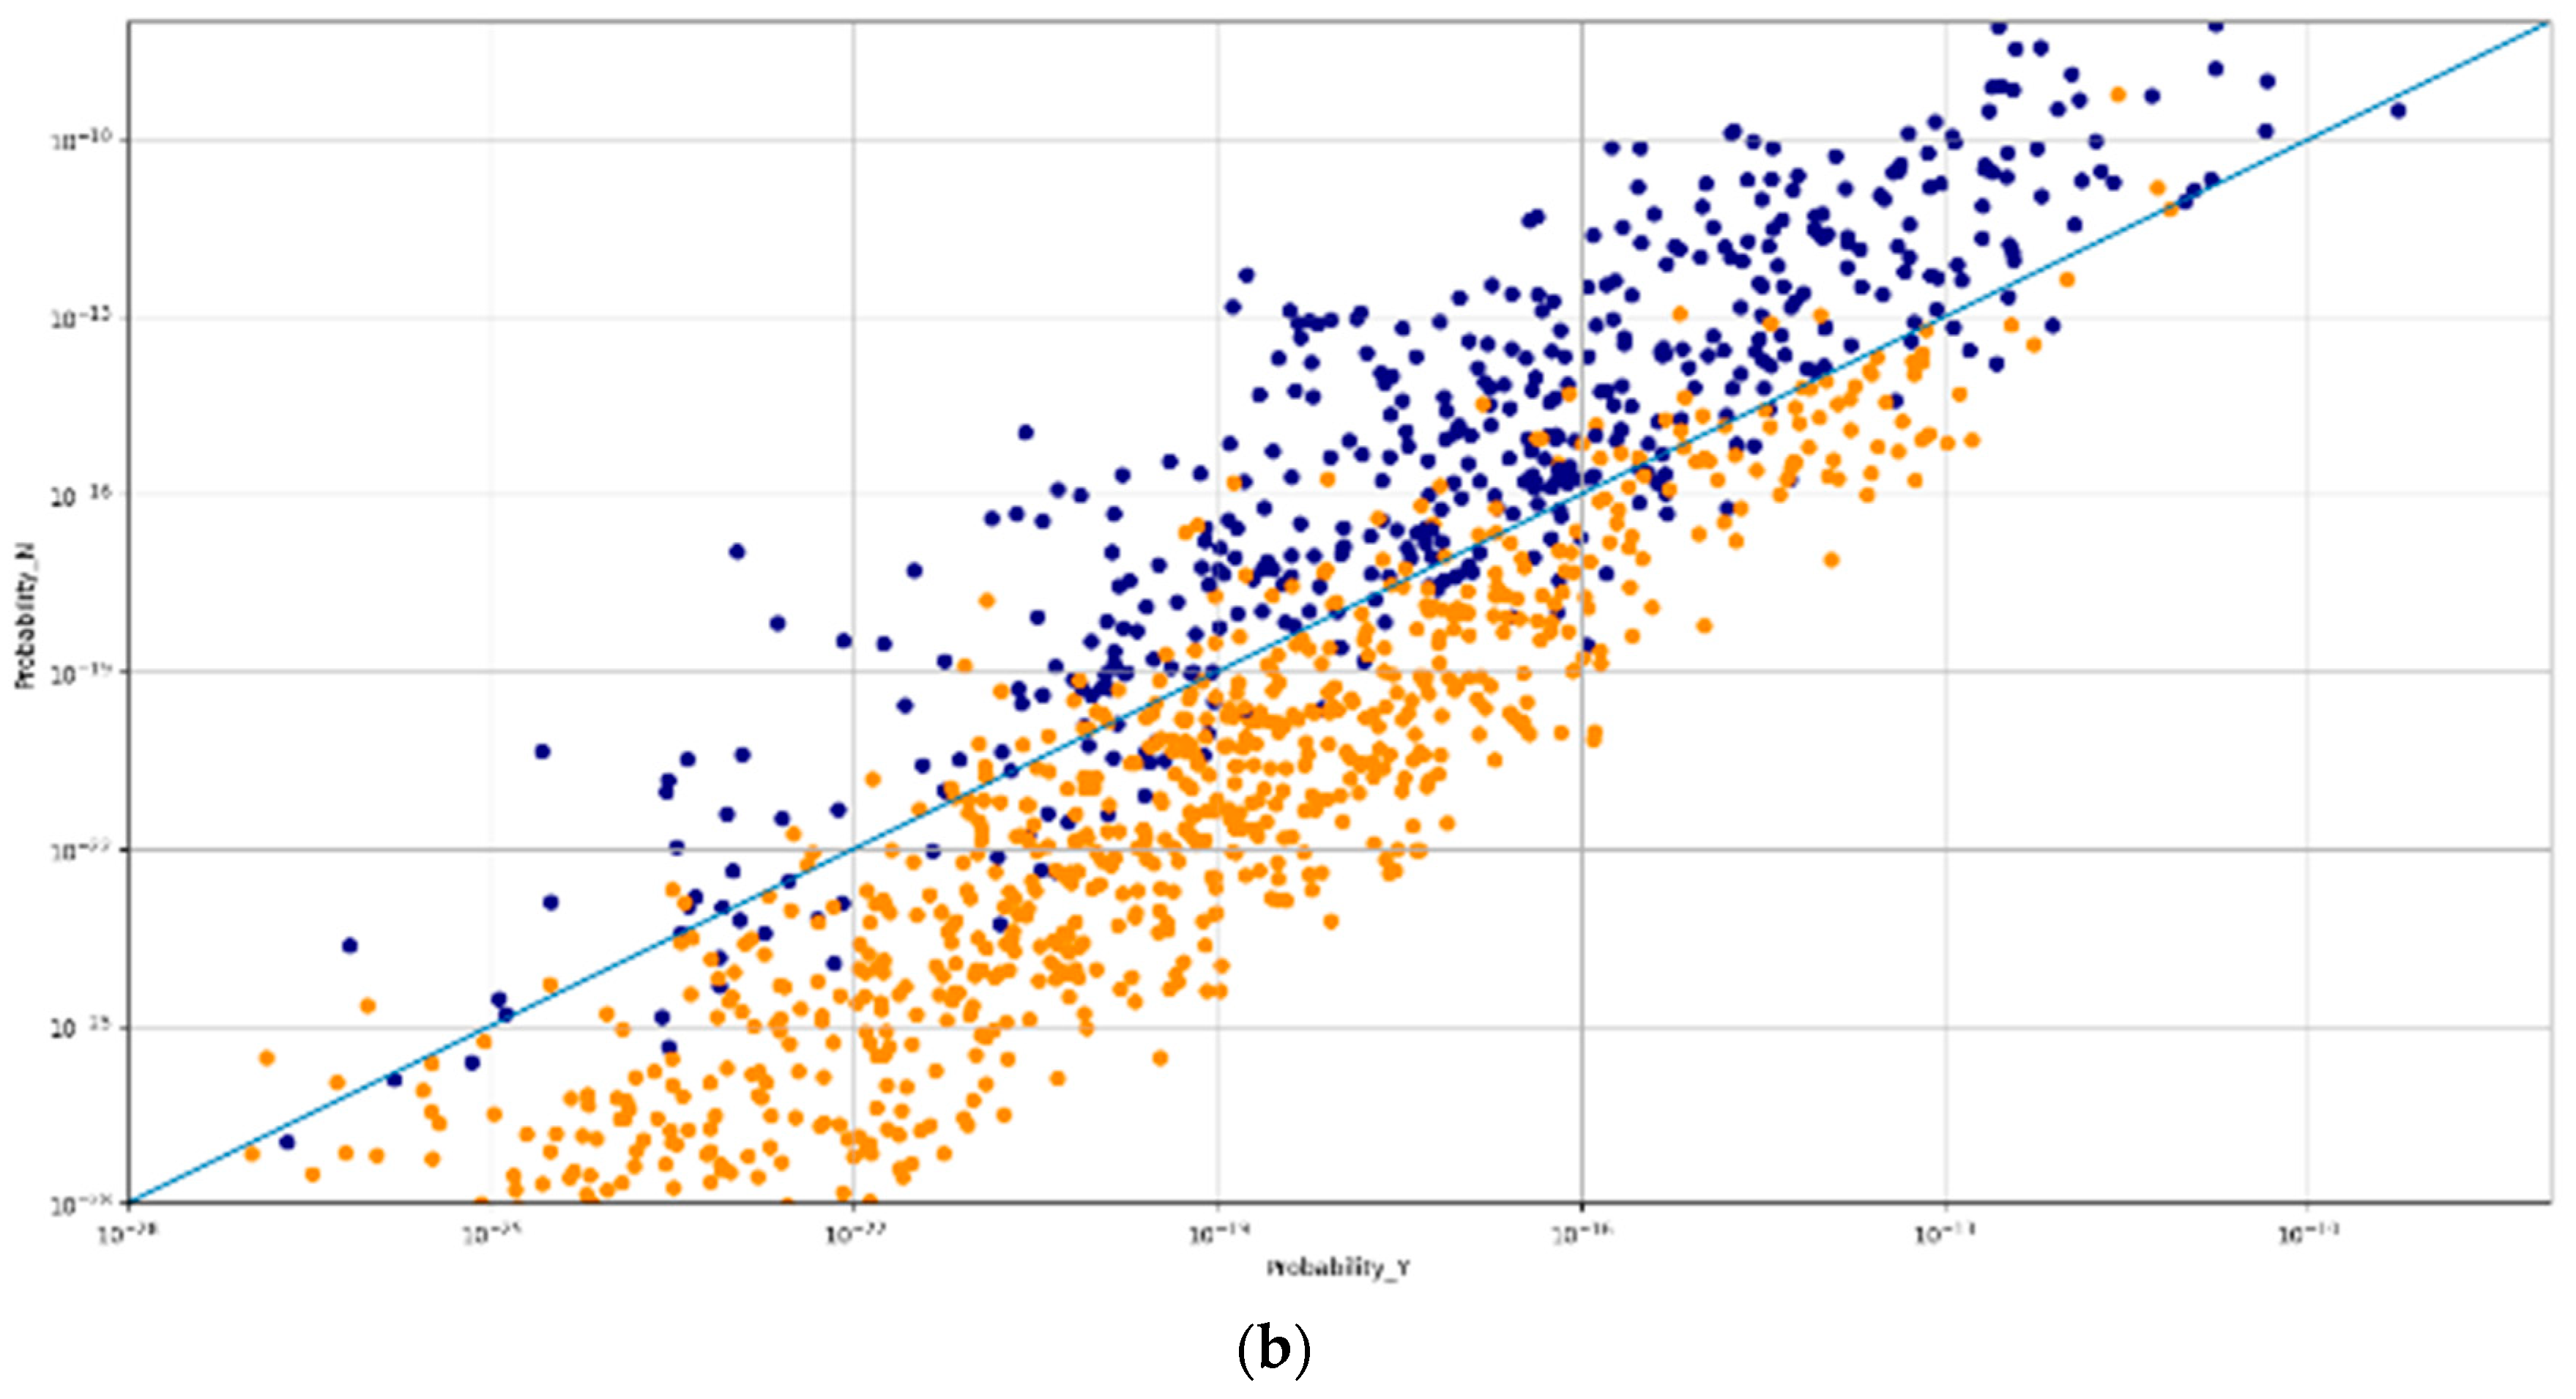
With the benefit of using Naïve Bayes in a small dataset, we developed a visualized classification result from Naïve Bayes for the Bordeaux Wine Official Classification in 1855 dataset in Figure 6a. In the figure, we have the probability that the sample is 90+ for the horizontal axis, and the probability that the sample is 89− for the vertical axis. According to Bayes’ theorem, the sample belongs to the class with a bigger probability. Therefore, a line y = x is drawn as the decision boundary. Any samples in the area that are below the line are predicted as positive classes and vice versa. The points in blue are actually from 89– class, orange is 90+ class. By seeing this figure, we can tell the numbers of misclassified samples, and can be accurate to false positive and false negative samples. Figure 6b is a zoom in picture of Figure 6a to understand the dense area of the figure. These figures demonstrate that most miss-classified wines are very close to the boundary. These visualizations provide the insight of the challenges in Wineinformatics.
4.5. Top 20 Keywords
SVM is considered as a black-box classifier, since the classification processes are unexplainable. Naïve Bayes, on the other hand, is a white-box classification algorithm, since each attribute has its own probability contribute to positive case and negative case. We extract keywords with 20 highest positive probabilities toward 90+ and 89− classes from both datasets.
In ALL Bordeaux Wine dataset, there are 11 common keywords that appear in both 90+ and 89− wines. Details can be found in Table 3. These common keywords represent the important wine characteristics/attributes toward 21st century general Bordeaux wines. Furthermore, our goal is to understand the important wine characteristics/attributes toward 21st century classic and outstanding Bordeaux wines. Therefore, finding out the distinct keywords between 90+ and 89− is our final goal. Details about the distinct keywords between 90+ and 89− from ALL Bordeaux Wine dataset can be found in Table 4 and Table 5. According to Table 4, fruity characters including “BLACK CURRANT”, “APPLE”, “RASPERBERRY”, and “FIG” are favorable flavors to 21st century Bordeaux. Since Bordeaux is also famous for red wines that can age for many years, “SOLID” (showed in Table 4 Body category) is preferred over “MEDIUM-BODIED” and “LIGHT-BODIED” (showed in Table 5 Body category).
In 1855 Bordeaux Wine Official Classification dataset, there are 11 common keywords that appear in both 90+ and 90− wines. Details can be found in Table 6. Comparing the common keywords with ALL Boredeaux Wine dataset, 10 out of 11 are the same keywords. “TANNINES_LOW” only appears in ALL Bordeaux Wine dataset, and “SWEET” only appears in 1855 Bordeaux Wine Official Classification dataset. Details about the distinct keywords between 90+ and 89− from 1855 Bordeaux Wine Offical Classification dataset can be found in Table 7 and Table 8.
Comparing the dictinct keywords between 90+ and 89− wines from both datasets in 90+ wines, “LONG”, “BLACK CURRANT”, “APPLE”, and “FIG” appear in both datasets; “RANGE”, “RIPE”, “RASPERBERRY”, “SOLID”, and “LICORICE” only appear in ALL Bordeaux Wine dataset; “STYLE”, “LOVELY”, “IRON”, “TANNINS_LOW”, and “SPICE” only appear in 1855 Bordeaux Wine Offical Classification.
5. Conclusions
In this research, we developed and studied two datasets: the first dataset is all the Bordeaux wine from 2000 to 2016; and the second one is all wines listed in a famous collection of Bordeaux wines, 1855 Bordeaux Wine Official Classification, from 2000 to 2016. We used Naïve Bayes classifier and SMV classifier to make wine quality prediction based on wine reviews. Overall, Naïve Bayes classifier works better than SMV in the 1855 Bordeaux Wine Official Classification dataset, slightly worse than SMV in the ALL Bordeaux Wine. Also, with the benefit of using Naïve Bayes classifier, we were able to find the important wine characteristics/attributes toward 21st century classic and outstanding Bordeaux wines. The list of common attributes in Table 3 and Table 6 identifies the general wine characteristics in Bordeaux; while the list of dominate attributes in Table 4 and Table 7 (Table 5 and Table 8) shows the preferable characteristics for 90+ (90–) wines. Those characteristics/attributes can help producers improve the quality of their wines allowing them to concentrate of dilute the wanted or unwanted characteristics during the wine making process. To the best of our knowledge, this is the first paper that gives a detailed analysis in all prestigious Bordeaux wines in the 21st century.
To go further in this research as future works, two follow up questions can be raised; 1. Instead of dichotomous (90+ and 90−) analysis, can the research use finer label (classic, outstanding, very good, and good) to categorize these Bordeaux wine to perform the analysis or even regression analysis [32]? 2. What characteristics/attributes make the Bordeaux wines become a classic (95+) instead of outstanding (90–94)? The first question can be studied as a multi-class problem in data science since the computational model will be built into four different classes and produce important characteristics for each class. The second question is a typical highly unbalanced problem in data science. The number of wines scores 95+ is much less than 95− wines. The regular computational model such as SVM and Naïve Bayes will not be able to identify the boundary between the two classes and predict all testing wines into majority class. How to amplify the minority class and obtain meaningful information is a big challenge in this type of question. Finally, we would like to address the limitation of our current research. Since the computational wine wheel was developed from Wine Spectators’ Top 100 lists, the proposed research might have optimal results in the dataset collected from Wine Spectators’ review. While several other wine experts in the filed such as Robert Parker Wine Advocate [33], Wine Enthusiast [34], and Decanter [35] may not agree with each other’s comments, they can still agree in the overall score of the wine. The legendary Chateau Latour 2009 gives a great example [36]; every reviewer scores the wine either 100 or 99 and their testing notes are very different with each other. This would be our ultimate challenge in Wineinformatics research that involves the true human language processing topic.
Author Contributions
B.C. and Z.D. literature review, conceived, designed the experiment and original writing. X.G. and S.R. revised and improved the experiment. B.C. Critical reading and financial support. All authors have read and agree to the published version of the manuscript.
Funding
We would like to thank the Department of Computer Science at UCA for the support of the new research application domain development.
Conflicts of Interest
The authors declare no conflicts of interest.
Appendix A. The 1855 Classification, Revised in 1973
Appendix A.1. Red Wines
PREMIERS CRUS
- Château Haut-Brion, Pessac, AOC Pessac-Léognan
- Château Lafite-Rothschild, Pauillac, AOC Pauillac
- Château Latour, Pauillac, AOC Pauillac
- Château Margaux, Margaux, AOC Margaux
- Château Mouton Rothschild, Pauillac, AOC Pauillac
DEUXIÈMES CRUS
- Château Brane-Cantenac, Cantenac, AOC Margaux
- Château Cos-d’Estournel, Saint-Estèphe, AOC Saint-Estèphe
- Château Ducru-Beaucaillou, Saint-Julien-Beychevelle, AOC Saint-Julien
- Château Durfort-Vivens, Margaux, AOC Margaux
- Château Gruaud-Larose, Saint-Julien-Beychevelle, AOC Saint-Julien
- Château Lascombes, Margaux, AOC Margaux
- Château Léoville-Barton, Saint-Julien-Beychevelle, AOC Saint-Julien
- Château Léoville-Las-Cases, Saint-Julien-Beychevelle, AOC Saint-Julien
- Château Léoville-Poyferré, Saint-Julien-Beychevelle, AOC Saint-Julien
- Château Montrose, Saint-Estèphe, AOC Saint-Estèphe
- Château Pichon-Longueville-Baron-de-Pichon, Pauillac, AOC Pauillac
- Château Pichon-Longueville-Comtesse-de-Lalande, Pauillac, AOC Pauillac
- Château Rauzan-Ségla, Margaux, AOC Margaux
- Château Rauzan-Gassies, Margaux, AOC Margaux
TROISIÈMES CRUS
- Château Boyd-Cantenac, Cantenac, AOC Margaux
- Château Calon-Ségur, Saint-Estèphe, AOC Saint-Estèphe
- Château Cantenac-Brown, Cantenac, AOC Margaux
- Château Desmirail, Margaux, AOC Margaux
- Château Ferrière, Margaux, AOC Margaux
- Château Giscours, Labarde, AOC Margaux
- Château d’Issan, Cantenac, AOC Margaux
- Château Kirwan, Cantenac, AOC Margaux
- Château Lagrange, Saint-Julien-Beychevelle, AOC Saint-Julien
- Château La Lagune, Ludon, AOC Haut-Médoc
- Château Langoa-Barton, Saint-Julien-Beychevelle, AOC Saint-Julien
- Château Malescot-Saint-Exupéry, Margaux, AOC Margaux
- Château Marquis-d’Alesme, Margaux, AOC Margaux
- Château Palmer, Cantenac, AOC Margaux
QUATRIÈMES CRUS
- Château Beychevelle, Saint-Julien-Beychevelle, AOC Saint-Julien
- Château Branaire-Ducru, Saint-Julien-Beychevelle, AOC Saint-Julien
- Château Duhart-Milon, Pauillac, AOC Pauillac
- Château Lafon-Rochet, Saint-Estèphe, AOC Saint-Estèphe
- Château Marquis-de-Terme, Margaux, AOC Margaux
- Château Pouget, Cantenac, AOC Margaux
- Château Prieuré-Lichine, Cantenac, AOC Margaux
- Château Saint-Pierre, Saint-Julien-Beychevelle, AOC Saint-Julien
- Château Talbot, Saint-Julien-Beychevelle, AOC Saint-Julien
- Château La Tour-Carnet, Saint-Laurent-de-Médoc, AOC Haut-Médoc
CINQUIÈMES CRUS
- Château d’Armailhac, Pauillac, AOC Pauillac
- Château Batailley, Pauillac, AOC Pauillac
- Château Belgrave, Saint-Laurent-de-Médoc, AOC Haut-Médoc
- Château Camensac, Saint-Laurent-de-Médoc, AOC Haut-Médoc
- Château Cantemerle, Macau, AOC Haut-Médoc
- Château Clerc-Milon, Pauillac, AOC Pauillac
- Château Cos-Labory, Saint-Estèphe, AOC Saint-Estèphe
- Château Croizet-Bages, Pauillac, AOC Pauillac
- Château Dauzac, Labarde, AOC Margaux
- Château Grand-Puy-Ducasse, Pauillac, AOC Pauillac
- Château Grand-Puy-Lacoste, Pauillac, AOC Pauillac
- Château Haut-Bages-Libéral, Pauillac, AOC Pauillac
- Château Haut-Batailley, Pauillac, AOC Pauillac
- Château Lynch-Bages, Pauillac, AOC Pauillac
- Château Lynch-Moussas, Pauillac, AOC Pauillac
- Château Pédesclaux, Pauillac, AOC Pauillac
- Château Pontet-Canet, Pauillac, AOC Pauillac
- Château du Tertre, Arsac, AOC Margaux
Appendix A.2. White Wines
PREMIER CRU SUPÉRIEUR
- Château d’Yquem, Sauternes, AOC Sauternes
PREMIERS CRUS
- Château Climens, Barsac, AOC Barsac
- Clos Haut-Peyraguey, Bommes, AOC Sauternes
- Château Coutet, Barsac, AOC Barsac
- Château Guiraud, Sauternes, AOC Sauternes
- Château Lafaurie-Peyraguey, Bommes, AOC Sauternes
- Château Rabaud-Promis, Bommes, AOC Sauternes
- Château Rayne-Vigneau, Bommes, AOC Sauternes
- Château Rieussec, Fargues-de-Langon, AOC Sauternes
- Château Sigalas-Rabaud, Bommes, AOC Sauternes
- Château Suduiraut, Preignac, AOC Sauternes
- Château La Tour-Blanche, Bommes, AOC Sauternes
DEUXIÈMES CRUS
- Château d’Arche, Sauternes, AOC Sauternes
- Château Broustet, Barsac, AOC Barsac
- Château Caillou, Barsac, AOC Barsac
- Château Doisy-Daëne, Barsac, AOC Barsac
- Château Doisy-Dubroca, Barsac, AOC Barsac
- Château Doisy-Védrines, Barsac, AOC Barsac
- Château Filhot, Sauternes, AOC Sauternes
- Château Lamothe (Despujols), Sauternes, AOC Sauternes
- Château Lamothe-Guignard, Sauternes, AOC Sauternes
- Château de Malle, Preignac, AOC Sauternes
- Château de Myrat, Barsac, AOC Barsac
- Château Nairac, Barsac, AOC Barsac
- Château Romer-du-Hayot, Fargues-de-Langon, AOC Sauternes
- Château Romer, Fargues-de-Langon, AOC Sauternes
- Château Suau, Barsac, AOC Barsac
Appendix B. The List of Wine and Vintages We Can’t Find
- CHÂTEAU PÉDESCLAUX Pauillac (2005,2004,2003,2002,2001)
- CHÂTEAU CLIMENS Barsac (2000)
- CHÂTEAU RABAUD-PROMIS Sauternes (2016,2015,2014,2010,2008)
- CHÂTEAU RIEUSSEC Sauternes (2012)
- CHÂTEAU SUDUIRAUT Sauternes (2012)
- CHÂTEAU LA TOUR BLANCHE Sauternes (2000)
- CHÂTEAU BROUSTET Barsac (2012,2008,2007,2005,2004,2000)
- CHÂTEAU CAILLOU Barsac(2016,2015,2014,2010,2008,2000)
- CHÂTEAU LAMOTHE-DESPUJOLS Sauternes (2016,2015,2014,2013,2012,2011,2010,2009,2006,2005,2004,2002,2000)
- CHÂTEAU NAIRAC Barsac (2016,2000)
- CHÂTEAU ROMER DU HAYOT Sauternes (2016,2015,2014,2010)
- CHÂTEAU ROMER Sauternes (2016,2010,2008,2006,2004,2002,2001,2000)
- CHÂTEAU SUAU Barsac (2014,2010,2007)
- CHÂTEAU D’YQUEM Sauternes (2012)
- CHÂTEAU D’ARCHE Sauternes (2016,2015,2014,2012,2010)
- Château Durfort-Vivens Margaux (2016,2015,2014)
- Château Pichon-Longueville-Baron-de-Pichon, Pauillac, AOC Pauillac(Château Pichon-Longueville Baron Pauillac Les Griffons de Pichon Baron (2016,2015,2013,2011,2010,2009,2008,2007,2006,2005,2004,2003,2002,2001,2000))
- Château Pichon-Longueville-Comtesse-de-Lalande, Pauillac, AOC Pauillac(Château Pichon Longueville Lalande Pauillac Réserve de la Comtesse (2013,2007))
- Château Rauzan-Gassies Margaux (2007,2004)
- Château Boyd-Cantenac Margaux (2016,2015,2014,2013,2012)
- Château Desmirail Margaux (2007,2006,2005,2004,2003,2002,2001,2000)
- CHÂTEAU MARQUIS D’ALESME BECKER Margaux (2004)
- CHÂTEAU BEYCHEVELLE St.-Julien Amiral de Beychevelle (2013,2011,2004,2003,2002,2001)
- CHÂTEAU MARQUIS DE TERME Margaux (2003)
- CHÂTEAU POUGET Margaux (2016,2015,2014,2013,2012)
- CHÂTEAU DE CAMENSAC Haut-Médoc (2016,2015,2014,2008)
- Château La Lagune Haut-Médoc (2016,2015,2013)
- CHÂTEAU COS LABORY St.-Estèphe (2016,2015,2014,2013)
- CHÂTEAU CROIZET-BAGES Pauillac (2007)
- Château d’Issan, Cantenac, AOC Margaux (not Found)
- Château Doisy-Dubroca, Barsac (not found)
- Château Lamothe-Guignard, Sauternes (2016)
References
- Combris, P.; Lecocq, S.; Visser, M. Estimation of a hedonic price equation for Bordeaux wine: Does quality matter? Econ. J. 1997, 107, 389–402. [Google Scholar] [CrossRef]
- Cardebat, J.-M.; Figuet, J. What explains Bordeaux wine prices? Appl. Econ. Lett. 2004, 11, 293–296. [Google Scholar] [CrossRef]
- Ashenfelter, O. Predicting the quality and prices of Bordeaux wine. Econ. J. 2008, 118, F174–F184. [Google Scholar] [CrossRef]
- Shanmuganathan, S.; Sallis, P.; Narayanan, A. Data mining techniques for modelling seasonal climate effects on grapevine yield and wine quality. In Proceedings of the 2010 2nd International Conference on Computational Intelligence, Communication Systems and Networks, Liverpool, UK, 28–30 July 2010; pp. 84–89. [Google Scholar]
- Noy, F.N.; Sintek, M.; Decker, S.; Crubézy, M.; Fergerson, R.W.; Musen, M.A. Creating semantic web contents with protege-2000. IEEE Intell. Syst. 2001, 16, 60–71. [Google Scholar] [CrossRef]
- Noy, F.N.; McGuinness, D.L. Ontology Development 101: A Guide to Creating Your First Ontology. Stanford Knowledge Systems Laboratory Technical Report KSL-01-05 and Stanford Medical Informatics Technical Report SMI-2001-0880. March 2001. Available online: http://www.corais.org/sites/default/files/ontology_development_101_aguide_to_creating_your_first_ontology.pdf (accessed on 1 January 2020).
- Quandt, R.E. A note on a test for the sum of ranksums. J. Wine Econ. 2007, 2, 98–102. [Google Scholar] [CrossRef] [Green Version]
- Ashton, R.H. Improving experts’ wine quality judgments: Two heads are better than one. J. Wine Econ. 2011, 6, 135–159. [Google Scholar] [CrossRef]
- Ashton, R.H. Reliability and consensus of experienced wine judges: Expertise within and between? J. Wine Econ. 2012, 7, 70–87. [Google Scholar] [CrossRef]
- Bodington, J.C. Evaluating wine-tasting results and randomness with a mixture of rank preference models. J. Wine Econ. 2015, 10, 31–46. [Google Scholar] [CrossRef]
- Cardebat, J.M.; Livat, F. Wine experts’ rating: A matter of taste? Int. J. Wine Bus. Res. 2016, 28, 43–58. [Google Scholar] [CrossRef] [Green Version]
- Cardebat, J.M.; Figuet, J.M.; Paroissien, E. Expert opinion and Bordeaux wine prices: An attempt to correct biases in subjective judgments. J. Wine Econ. 2014, 9, 282–303. [Google Scholar] [CrossRef]
- Cao, J.; Stokes, L. Evaluation of wine judge performance through three characteristics: Bias, discrimination, and variation. J. Wine Econ. 2010, 5, 132–142. [Google Scholar] [CrossRef] [Green Version]
- Cardebat, J.M.; Paroissien, E. Standardizing expert wine scores: An application for Bordeaux en primeur. J. Wine Econ. 2015, 10, 329–348. [Google Scholar] [CrossRef]
- Hodgson, R.T. An examination of judge reliability at a major US wine competition. J. Wine Econ. 2008, 3, 105–113. [Google Scholar] [CrossRef]
- Hodgson, R.T. An analysis of the concordance among 13 US wine competitions. J. Wine Econ. 2009, 4, 1–9. [Google Scholar] [CrossRef]
- Hodgson, R.; Cao, J. Criteria for accrediting expert wine judges. J. Wine Econ. 2014, 9, 62–74. [Google Scholar] [CrossRef]
- Hopfer, H.; Heymann, H. Judging wine quality: Do we need experts, consumers or trained panelists? Food Qual. Prefer. 2014, 32, 221–233. [Google Scholar] [CrossRef]
- Ashenfelter, O.; Goldstein, R.; Riddell, C. Do expert ratings measure quality? The case of restaurant wine lists. In Proceedings of the 4th Annual AAWE Conference at the University of California at Davis, Davis, CA, USA, 20 June 2010. [Google Scholar]
- Cardebat, J.M.; Corsinovi, P.; Gaeta, D. Do Top 100 wine lists provide consumers with better information? Econ. Bull. 2018, 38, 983–994. [Google Scholar]
- Reuter, J. Does advertising bias product reviews? An analysis of wine ratings. J. Wine Econ. 2009, 4, 125–151. [Google Scholar] [CrossRef]
- Chen, B.; Rhodes, C.; Crawford, A.; Hambuchen, L. Wineinformatics: Applying data mining on wine sensory reviews processed by the computational wine wheel. In Proceedings of the 2014 IEEE International Conference on Data Mining Workshop, Shenzhen, China, 14–14 December 2014; pp. 142–149. [Google Scholar]
- Chen, B.; Rhodes, C.; Yu, A.; Velchev, V. The Computational Wine Wheel 2.0 and the TriMax Triclustering in Wineinformatics. In Industrial Conference on Data Mining; Springer: Cham, Switzerland, 2016; pp. 223–238. [Google Scholar]
- Chen, B.; Velchev, V.; Palmer, J.; Atkison, T. Wineinformatics: A Quantitative Analysis of Wine Reviewers. Fermentation 2018, 4, 82. [Google Scholar] [CrossRef] [Green Version]
- Palmer, J.; Chen, B. Wineinformatics: Regression on the Grade and Price of Wines through Their Sensory Attributes. Fermentation 2018, 4, 84. [Google Scholar] [CrossRef] [Green Version]
- Wine Spectator. Available online: https://www.winespectator.com (accessed on 1 January 2020).
- Bordeaux Wine Official Classification of 1855. Available online: https://www.bordeaux.com/us/Our-Terroir/Classifications/Grand-Cru-Classes-en-1855 (accessed on 1 January 2020).
- Wine Spectator’s 100-Point Scale | Wine Spectator, Winespectator.com. 2019. Available online: https://www.winespectator.com/articles/scoring-scale (accessed on 1 January 2020).
- Chen, B.; Le, H.; Rhodes, C.; Che, D. Understanding the Wine Judges and Evaluating the Consistency Through White-Box Classification Algorithms. In Advances in Data Mining. Applications and Theoretical Aspects. ICDM 2016; Perner, P., Ed.; Lecture Notes in Computer Science; Springer: Cham, Switzerland, 2016; Volume 9728. [Google Scholar]
- Rish, I. An empirical study of the naive Bayes classifier. In Proceedings of the IJCAI 2001 Workshop on Empirical Methods in Artificial Intelligence; 2001; Volume 3, pp. 41–46. Available online: https://www.cc.gatech.edu/~isbell/reading/papers/Rish.pdf (accessed on 1 January 2020).
- Suykens, K.J.A.; Vandewalle, J. Least squares support vector machine classifiers. Neural Process. Lett. 1999, 9, 293–300. [Google Scholar] [CrossRef]
- Thorsten, J. Svmlight: Support Vector Machine. Available online: https://www.researchgate.net/profile/Thorsten_Joachims/publication/243763293_SVMLight_Support_Vector_Machine/links/5b0eb5c2a6fdcc80995ac3d5/SVMLight-Support-Vector-Machine.pdf (accessed on 1 January 2020).
- Robert Parker Wine Advocate. Available online: https://www.robertparker.com/ (accessed on 1 January 2020).
- Wine Enthusiast. Available online: https://www.wineenthusiast.com/ (accessed on 1 January 2020).
- Decanter. Available online: https://www.decanter.com/ (accessed on 1 January 2020).
- Chateau Latour 2009 Wine Reviews. Available online: https://www.wine.com/product/chateau-latour-2009/119875 (accessed on 1 January 2020).
Figure 1.
The flowchart of coveting reviews into machine understandable via the computation wine wheel.
Figure 1.
The flowchart of coveting reviews into machine understandable via the computation wine wheel.

Figure 2.
(a) The score distribution of ALL Bordeaux Wines; (b) The number of wines that have been reviewed annually.
Figure 2.
(a) The score distribution of ALL Bordeaux Wines; (b) The number of wines that have been reviewed annually.

Figure 3.
(a) The score distribution of Bordeaux Wine Official Classification in 1855; (b) The number of wines reviewed annually.
Figure 3.
(a) The score distribution of Bordeaux Wine Official Classification in 1855; (b) The number of wines reviewed annually.

Figure 4.
This figure demonstrates data splitting in 5-fold cross-validation.

Figure 5.
This figure demonstrates training and testing sets assigning in 5-fold cross-validation.

Figure 6.
(a) The visualization of whole dataset by Naïve Bayes. The horizontal axis indicates the probability that the sample is 90+, and the vertical axis indicates the probability that the sample is type 90−; (b) Magnification of Figure 6a.
Figure 6.
(a) The visualization of whole dataset by Naïve Bayes. The horizontal axis indicates the probability that the sample is 90+, and the vertical axis indicates the probability that the sample is type 90−; (b) Magnification of Figure 6a.


Table 1.
Accuracies, precisions, recalls, and F-score in different classifiers.
| Classifier | Accuracy | Precision | Recall | F-Score |
|---|---|---|---|---|
| Naïve Bayes Laplace | 85.17% | 73.22% | 79.03% | 76.01% |
| SVM | 86.97% | 80.68% | 73.80% | 77.10% |
Table 2.
Accuracies, precisions, recalls, and F-score in different classifiers.
| Classifier | Accuracy | Precision | Recall | F-Score |
|---|---|---|---|---|
| Naïve Bayes Laplace | 84.62% | 86.79% | 90.02% | 88.38% |
| SVM | 81.38% | 86.84% | 84.12% | 85.46% |
Table 3.
Common keywords between 90+ and 89− wines from ALL Bordeaux Wine dataset.
| CATEGORY | 90+ WINES AND 89− WINES | |||
|---|---|---|---|---|
| FLAVOR/DESCRIPTORS | GREAT | FLAVORS | ||
| FRUITY | FRUIT | PLUM | BLACKBERRY | CURRENT |
| BODY | FULL-BODIED | CORE | ||
| FINISH | FINISH | |||
| HERBS | TOBACCO | |||
| TANNINS | TANNINS_LOW | |||
Table 4.
Distinct keywords between 90+ and 89− wines from ALL Bordeaux Wine dataset in 90+ wines.
| CATEGORY | 90+ WINES | |||
|---|---|---|---|---|
| FLAVOR/DESCRIPTORS | LONG | RANGE | RIPE | |
| FRUITY | BLACK CURRANT | APPLE | RASPERBERRY | FIG |
| BODY | SOLID | |||
| SPICE | LICORICE | |||
Table 5.
Distinct keywords between 90+ and 89− wines from ALL Bordeaux Wine dataset in 89− wines.
| CATEGORY | 89− WINES | ||
|---|---|---|---|
| FLAVOR/DESCRIPTORS | CHARACTER | FRESH | GOOD |
| FRUITY | CHERRY | BERRY | |
| BODY | MEDIUM-BODIED | LIGHT-BODIED | |
| TANNINS | TANNINE_MEDIUM | ||
Table 6.
Common keywords between 90+ and 89− wines from 1855 Bordeaux Wine Official classification dataset.
Table 6.
Common keywords between 90+ and 89− wines from 1855 Bordeaux Wine Official classification dataset.
| CATEGORY | 90+ WINES AND 89− WINES | |||
|---|---|---|---|---|
| FLAVOR/DESCRIPTORS | GREAT | FLAVORS | SWEET | |
| FRUITY | FRUIT | PLUM | BLACKBERRY | CURRENT |
| BODY | FULL-BODIED | CORE | ||
| FINISH | FINISH | |||
| HERBS | TOBACCO | |||
Table 7.
Distinct keywords between 90+ and 89− wines from 1855 Bordeaux Wine Official classification dataset in 90+ wines.
Table 7.
Distinct keywords between 90+ and 89− wines from 1855 Bordeaux Wine Official classification dataset in 90+ wines.
| CATEGORY | 90+ WINES | ||
|---|---|---|---|
| FLAVOR/DESCRIPTORS | LONG | STYLE | LOVELY |
| FRUITY | BLACK CURRENT | FIG | APPLE |
| EARTHY | IRON | ||
| TANNINS | TANNINS_LOW | ||
| SPICE | SPICE | ||
Table 8.
Distinct keywords between 90+ and 89− wines from 1855 Bordeaux Wine Official classification dataset in 89− wines.
Table 8.
Distinct keywords between 90+ and 89− wines from 1855 Bordeaux Wine Official classification dataset in 89− wines.
| CATEGORY | 89− WINES | |||
|---|---|---|---|---|
| FLAVOR/DESCRIPTORS | CHARACTER | FRESH | RANGE | GOOD |
| FRUITY | BERRY | |||
| BODY | MEDIUM-BODIED | LIGHT-BODIED | ||
| TANNINS | TANNIS_MEDIUM | |||
© 2020 by the authors. Licensee MDPI, Basel, Switzerland. This article is an open access article distributed under the terms and conditions of the Creative Commons Attribution (CC BY) license (http://creativecommons.org/licenses/by/4.0/).
Share and Cite
MDPI and ACS Style
Dong, Z.; Guo, X.; Rajana, S.; Chen, B. Understanding 21st Century Bordeaux Wines from Wine Reviews Using Naïve Bayes Classifier. Beverages 2020, 6, 5. https://0-doi-org.brum.beds.ac.uk/10.3390/beverages6010005
AMA Style
Dong Z, Guo X, Rajana S, Chen B. Understanding 21st Century Bordeaux Wines from Wine Reviews Using Naïve Bayes Classifier. Beverages. 2020; 6(1):5. https://0-doi-org.brum.beds.ac.uk/10.3390/beverages6010005
Chicago/Turabian StyleDong, Zeqing, Xiaowan Guo, Syamala Rajana, and Bernard Chen. 2020. "Understanding 21st Century Bordeaux Wines from Wine Reviews Using Naïve Bayes Classifier" Beverages 6, no. 1: 5. https://0-doi-org.brum.beds.ac.uk/10.3390/beverages6010005
Note that from the first issue of 2016, this journal uses article numbers instead of page numbers. See further details here.