Google Web and Image Search Visibility Data for Online Store


Department of Informatics, University of Economics in Katowice, 40-287 Katowice, Poland
Data 2019, 4(3), 125; https://0-doi-org.brum.beds.ac.uk/10.3390/data4030125
Submission received: 17 July 2019
/
Revised: 5 August 2019
/
Accepted: 15 August 2019
/
Published: 22 August 2019
(This article belongs to the Special Issue Data Analysis for Financial Markets)
Abstract
:This data descriptor describes Google search engine visibility data. The visibility of a domain name in a search engine comes from search engine optimization and can be evaluated based on four data metrics and five data dimensions. The data metrics are the following: Clicks volume (1), impressions volume (2), click-through ratio (3), and ranking position (4). Data dimensions are as follows: queries that are entered into search engines that trigger results with the researched domain name (1), page URLs from research domains which are available in the search engine results page (2), country of origin of search engine visitors (3), type of device used for the search (4), and date of the search (5). Search engine visibility data were obtained from the Google search console for the international online store, which is visible in 240 countries and territories for a period of 15 months. The data contain 123 K clicks and 4.86 M impressions for the web search and 22 K clicks and 9.07 M impressions for the image search. The proposed method for obtaining data can be applied in any other area, not only in the e-commerce industry.
Dataset License: CC-BY 4.0
1. Introduction
Currently, search engines are used hundreds of times every day by a single user. Users are searching for everything. Website owners know that high visibility in search engines converts to traffic on their website [1]. Traffic gained from internet users originating from this traffic source is further converted into goals set by website owners, or transactions if the website is an online store. High visibility in a search engine is measured through ranking position, the number of keywords, and pages visible in the search engine results page [2].
The value of this dataset can be described in the following four areas. First, when it is compared to the dataset published by [3], which had to be removed 3 days after its release, this dataset does not share any private or personal data, and neither does it contain any type of information which allows the identification of users. This dataset can be freely used, while preserving the full privacy of users. Previous dataset releases have shown that it is important to keep data anonymized.
Second, this dataset contains more dimensions and metrics than previously published datasets [3]. Until this dataset, previous work included only limited data on position and whether URLs were clicked on or not. Other metrics, such as the click-through ratio (CTR) and impressions volume, needed to be calculated. This dataset contains the CTR and impression metrics, which allows for calculating further results such as the average CTR for each ranking position or predicting traffic volume for particular keywords. This is also influenced by changes provided in Google’s search engine interface. For years, this interface has been undergoing changes, the number of displayed sponsored links have increased, rich snippets were introduced, and other extensions beyond the traditional 10 blue links are now displayed.
Third, this dataset has value for determining consumers’ search behaviors. Since data are for an online store, it contains keywords for different purchasing intentions. The general purchase intention is described by general keywords describing product categories, and the URLs displayed in the search engine are from category list pages. More specific keywords show that consumers are closer to purchasing, as they use keywords with exact product names and visit URLs with detailed product descriptions.
Fourth, additional dimensions, which are novel since there is no available data or studies with dimensions such as country and device, allow the achievement of another type of result for an online store’s search visibility, e.g., which products or brands are popular in which countries, or what type of devices are more popular when comparing product types or brands.
1.1. Search Visibility
Web search engines use different ranking factors for websites to determine the position of a certain website in a search engine results page. The visibility of websites in search engines comes from an algorithm, which ranks and orders websites according to their calculated ranking position. The original concept [4] of ranking for the Google search engine is named PageRank, after one of Google’s founders. PageRank was invented and published in 1998 [5]. This concept takes into account incoming links and, based on its volume and quality, estimates ranking positions for websites and corresponding keywords [6].
Nowadays, this topic is more explored [7] and can be divided into onsite factors and offsite factors [8]. Onsite factors are domain-related, website-related, and page-related [9]. Offsite factors are link-related [10], user-action-related [11], special-rules-related [12], brand-related [13], and spam-related [14]. In recent years, the search engine optimization (SEO) industry has evolved [15]. SEO is about using knowledge about those factors for websites, to display appropriate websites in the search engine results page.
Visibility in search engines is measured as the number of keywords, position, and the number of visible pages that can be used to compare competing organizations in one common area or industry [16,17]. The comparison will disclose what the search market share is of each organization that is compared [18]. Based on this comparison, further analysis of internet strategies in marketing, sales, promotion, and publishing can be set. Visibility in search engines is always subject to algorithms that sort and set rankings for results based on type of content, metadata, models of content creation [19,20,21], or hide results due to different reasons [22].
1.2. Data Study Subject
The subject for this study is the online store that is owned by Babyaisle company. Babyaisle is a Polish company that sells goods in online stores. Their goods are for babies and children. Their first online store was established in 2013. Their online store operates on a custom e-commerce engine manufactured by Insolutions software house from Gliwice, Poland. After launching an online store for the Polish market, the owner decided to create an offer for foreign customers by launching the same store in other languages and for other countries.
For the last three years, Babyaisle has launched a copied version of its online store, which has been localized for different countries. For now, there are eight different domain names in use. The E-commerce engine, backend engine, and database are the same for every language and country version. However, this solution emulates eight different languages and localized country versions. Localization refers to currency conversion, IP detection is for delivery purposes, and there is a different set of reviews and opinions given by consumers from each targeted country.
Next, each online store was set up with the domain name “babyaisle” with the local domain name suffix. Babyaisle is now operating in eight different markets in the EU, which are seven dedicated, localized markets like Poland, Germany, Denmark, France, Spain, Italy, and the Czech Republic. The eighth version is for English-speaking customers who are from other European countries. This English version has the URL address https://www.babyaisle.eu and is the subject of this study. Currently, this .EU online store is delivering orders to 19 European countries.
According to data from Google Analytics, users visiting the online store from the search engine between the period from 1 April 2018 to 30 June 2019 were 67.5% women and 32.5% men. Visits from the search engine were made using mobile devices (54%), desktop devices (40.7%) and tablets (5.3%).
This dataset [23] contains search engine visibility data for an online store (https://www.babyaisle.eu/) collected over a period of 15 months, from April 2018 to June 2019. The dataset is built from two search result types: Web search and image search. A web search is a universal search interface where all result types are published on one page. These results types are: Organic, map, image, video, shopping, books, finance, Google News, Sponsored Links, Knowledge Graph, flights, etc. Image search is a specialized part of Google search displaying only images as results for the query.
This dataset is prepared based on Search Analytics available through the Google Search Console Application Programming Interface (API) v3. Since Google is currently the most popular search engine [24], collected data are better quality and more precise than from other search engines. This data descriptor should make this dataset easier to use for more researchers and allow this area to be explored deeply. Data can be used to identify reasons for the increase or decrease in traffic, identify keywords targeting quality, identify content revision and new content opportunities, project potential keyword volume, identify CTR opportunities, identify the success of failing outliers, identify geographic opportunities, and identify mobile opportunities.
2. Data Description
Search engine visibility is the combined data of metrics and dimensions. The metrics are the following: Clicks volume (1); impressions volume (2); click-through ratio (CTR), calculated as the ratio of clicks and impressions (3); and ranking position (4). The dimensions are: Query (1), page (2), country (3), device (4), and date (5). The metrics need at least two dimensions to create usable data. A mandatory dimension is a date range of one or more days. The second dimension is, e.g., query. For one query (dimension) there are metrics such as the number of clicks, number of impressions, the CTR, and ranking position. Other dimensions can be added to further segment the data.
This dataset is a set of 32 CSV files separated with semicolons. Each file has the same structure, containing nine columns: Date, device, country, page, query, impressions, clicks, CTR, and position. A total of 15 files contain data for web search, and another 15 files contain data for image search. Each file has data obtained over one month. File names are created in the following sequence: year–month–searchtype.csv. Two CSV files are control files containing the volume of clicks and impressions, not altered by Query dimension (see Section 2.5). Descriptive statistics of this dataset are shown in Table 1 with year and month, the number of rows (without headers) for web search, and the number of rows (without headers) for image search.
The search type is the type of search run by the user. In this study, it is either a web search or image search. Data are stored separately by search type. For a given page URL, all click, impression, and position data are stored separately for each search type. An image can be displayed in both web and image results, but the click, impression, and position data for that image are stored separately for web searches and image searches. Image results appear as embedded thumbnails in the universal search results page or inline in the image search results page. In the universal search engine results page (SERP), they sometimes appear in a carousel of images. In search analytics data, an image is a link to the URL of the final page.
Results are grouped according to all the specified dimensions. All values with the same set of dimensions are grouped into a single row. Data are grouped by date, device, country, page, and query dimension, so all results for “2019-04-18; mobile; Finland; https://www.babyaisle.eu/; babyaisle” are grouped together, all results for “2019-04-18; mobile; Denmark; https://www.babyaisle.eu/; babyaisle” are grouped together, and so on.
2.1. Date Column A
Column A contains information about the date of grouped data.
2.2. Device Column B
Column B contains information about the type of device on which the user is searching, such as desktop, tablet, or mobile.
2.3. Country Column C
Column C contains information about the country where the search came from, for example, Finland or Denmark.
2.4. Page Column D
Column D contains information about the page URL, which was displayed in the search engine results page (SERP).
2.5. Query Column E
Column E contains information about the query. Query represents the keywords that users searched for on Google. Only searches that returned the studied site are shown. Query in the dataset can show together with keywords as well as search operators. Observed search operators are: − (minus), which defines keyword exclusion from search results and “” (quotation mark) which describes the exact match phrase, so the keywords in the query have to be in the same order of appearance in the results.
Data available through the Search Analytics Application Programming Interface (API) do not contain very rare queries, which are called anonymized queries. They are not revealed in results to protect the privacy of the user making the query. If the data are extracted under the Query dimension, anonymized queries are always omitted from the set. This decreases the total number of clicks and impressions. The real volume of clicks and impressions is shown for dimensions without Query, e.g., Date and Country. This dataset contains a separate CSV file with Date and Country dimensions, in order to not have decreased volume of clicks and impressions.
2.6. Impressions Column F
Column F contains information about how many times a user saw the studied website on the SERP. For a web search, impressions are counted when the user visits that page of the SERP, even if the result was not scrolled into view. However, if a user views only page one, but the result is on page two, the impression is not counted. The count is aggregated in set dimensions. An image search has infinitely scrolling result pages, so the impression might require the item to be scrolled into view.
2.7. Clicks Column G
Column F contains information about count of clicks from a Google search result that sends the user to a page outside Google Search.
2.8. CTR Column H
Column F contains information about the click-through ratio. The CTR is the click count divided by the impression count. The CTR is in the range of 0 to 1.
2.9. Position Column I
Column F contains information about the position value in the table. This value represents the average position in search results for the item in that specific row. The position column contains the results in numeric values. The SERP is composed of many search result elements. Search result elements include blue link sections, featured snippets, carousels, Knowledge Graph, and other types of displayed snippets. A single search result element can include text, interactive features, and one or more links. If the result is in first position, sometimes it has additional site links, placed below the first result, with more results from the same domain name. Most of the search result elements have a numeric position value describing their position on the SERP. The placement of the result elements on the SERP can vary depending on the device type, search features, and the screen size, but the general rule is the position of each result is calculated top to bottom.
Data in the files are in descending order on column Clicks, then are in descending order on column Impressions. In Table 2, there are five sample rows from 2018–04–web.csv file. It presents a glimpse of the dataset.
As shown in Table 2, data extracted from the online store are limited to one domain name and its subpages.
Table 3 contains descriptive statistics of the data included in the dataset. The dataset contains aggregated data originating from 240 countries on 78,313 queries resulting in 13,115 pages for web searches and 225,123 queries resulting in 18,088 pages for image searches. Impressions for web searches are in volume of 4,861,688 and for image search in volume of 9,056,528 of non-filtered data. Data are filtered by turning on query.
This online store has a significant number of anonymized queries, since a significant discrepancy is observed between the total number of clicks and impressions with the query dimension and the total number of clicks and impressions without the query dimension because the anonymized queries have been omitted (see Section 2.5).
3. Methods
Data are retrieved from the Google Search Console (GSC). The GSC is a free service that enables monitoring of verified websites’ performance in Google Search. Search Console provides programmatic access to the service through the APIs [25]. The GSC allows for four metrics to be observed and downloaded (clicks, impressions, CTR, and position) together with only one dimension and only 1000 rows of data. The GSC API allows for the retrieval of all four metrics together with all five dimensions, and the current limit is 1,000,000 rows.
3.1. Data Selection
Data selection is based on verified domains available in the GSC. It means that only having administrative access to the domain name, it is possible to verify its ownership or management rights. The domain can be verified by a few methods, such as uploading a specific file to a host server, pasting a verification line of code into the domain source code, or adding a verification text record into the domain name system (DNS) zone. After domain verification, from now on, the GSC starts collecting data from search results. The data are collected daily according to the local time in California, where data for each day are labeled according to the local time in California.
The author has unique access to the online store’s verified domain name in the GSC. This is www.babyaisle.eu, an e-commerce store which operates in the international market, since its main interface is in English language, and goods are delivered to 19 European countries. Being active in 19 national markets has allowed for the collection of extensive data in the GSC.
3.2. Data Processing
The GSC preserves data for the past 16 months. The author used Clusteric Search Auditor (https://clusteric.com), a commercial software with an implemented connector for the GSC API and was able to retrieve data for a full 15 months, starting on 1 April 2018 and going up to 30 June 2019. There are connectors for the GSC API available for other software, e.g., searchConsoleR, which is a GSC R client (https://github.com/MarkEdmondson1234/searchConsoleR); Search Analytics for Sheets, which is a GSC Google Sheets client (https://searchanalyticsforsheets.com/); or SEO Tools for Excel, which has a GSC API connector for Microsoft Excel (https://seotoolsforexcel.com/google-search-console/).
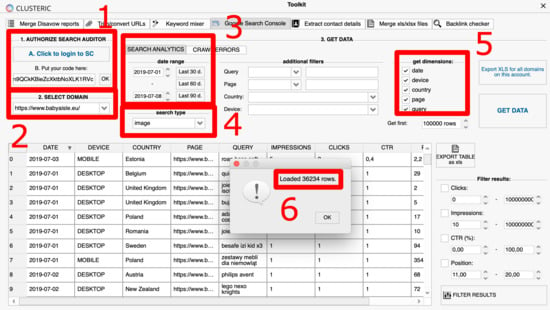
The software authorizes access to the Google Search Console API and lists domains for which data are available. The interface allows selection of a date range, the type of search, and dimensions for retrieval. Figure 1 shows the interface for data retrieval. Step 1 is authorization to the GSC. When the Clusteric Search Auditor (CSA) requests private data, the request is authorized by an authenticated user who has access to that data. The CSA uses OAuth 2.0 to authorize requests. Authorizing is achieved by entering a username and password for a Google account, which has access to the Google Search Console. A single-access token is returned, that needs to be copied into field B in area 1. Step 2 is domain selection. On the dropdown list, there are all the available domain names, which are authorized in the Google Search Console service. Step 3 is choosing a date range, which by default is the last 30 days. Step 4 is selecting the search type from image, web and video. By default, it is web search. Step 5 is selecting dimensions. Selection can be a variety of 1 to 5 chosen dimensions. Step 6 is retrieving data with the exact number of loaded rows for given settings.
Retrieved data are collected for full months and saved primarily in XLS format. After sorting columns by clicks and impressions descending, files are exported to CSV file type for each month separately. A common name for files is numbers for the year and month together with search type, e.g., 2019-06-img.csv for data from an image search for June 2019.
4. Concluding Remarks
This dataset contains data for 240 countries, which are available under a localized Google Search domain. In the dataset, queries are formed in several different alphabets. Queries are written left-to-right, with alphabets such as Latin, Cyrillic, Greek, Georgian, Armenian; East Asian alphabets such as Japanese, Chinese, Korean, Thai, Bengali, and Indian; and right-to-left alphabets such as Arabic and Hebrew and many others. This type of data can be reused by linguistic researchers.
If the keywords that one would expect to see do not appear on the query list, the website might not have enough useful content relevant to those keywords. Queries with high impressions volume and low CTR can help identify where titles and snippets for the web search can be improved to match the searcher’s interests. The dataset reveals how many queries show the data when the searcher does or does not include a specific string, such as a brand name. Data make it easier to find branded or not-branded query totals and percentage. These types of data can be reused by the marketing researchers.
Data allow for the generation of hypotheses to explain the increase or decrease in traffic from Google Search Engine (1); to see keyword performance and revise website content for better focus (2); to identify content revision opportunities by looking for queries with positions between 11 and 20 (3); to identify new content opportunities by finding all the highest impression volume keywords that are on the third SERP page, e.g., position 20 to 50 and prioritize keywords that are somewhat related, but not strongly related to existing content (4); and to identify geographic opportunities by analyzing search traffic from other countries, then those where courier delivery is offered (in case of an online store) (5). These types of data can be reused by the website owners.
Data show search traffic usage divided by device type for particular queries, pages, and countries. Devices are grouped into three categories: Desktop, mobile, and tablet. Further research can reveal mobile traffic statistics for different countries along with queries and landing pages. This can help to project further mobile website optimization and performance.
Funding
This research received no external funding.
Conflicts of Interest
Author declares no conflict of interest.
References
- Lee, S.; Jang, W.; Lee, E.; Oh, S.G. Search engine optimization: A case study using the bibliographies of LG Science Land in Korea. Libr. Hi Tech 2016, 34, 197–206. [Google Scholar] [CrossRef]
- Dickinson, Z.; Smit, M. Being where the people are: the challenges and benefits of search engine visibility for public libraries. Libr. Hi Tech News 2015, 32, 11–15. [Google Scholar] [CrossRef]
- Pass, G.; Chowdhury, A.; Torgeson, C. A picture of search. In Proceedings of the 1st International Conference on Scalable Information Systems InfoScale, 30 May–1 June 2006; ACM: New York, NY, USA, 2006; pp. 1–7. [Google Scholar]
- Brin, S.; Page, L. The Anatomy of a Large-Scale Hypertextual Web Search Engine The Anatomy of a Search Engine. Comput. Netw. ISDN Syst. 1998, 30, 107–117. [Google Scholar] [CrossRef]
- Page, L.; Brin, S.; Motwani, R.; Winograd, T. The PageRank Citation Ranking: Bringing Order to the Web. 1998. Available online: http://ilpubs.stanford.edu:8090/422/ (accessed on 29 January 1998).
- Kleinberg, J.M. Authoritative sources in a hyperlinked environment. J. ACM 1999, 46, 604–632. [Google Scholar] [CrossRef]
- Serrano, W. Neural Networks in Big Data and Web Search. Data 2019, 4, 7. [Google Scholar] [CrossRef]
- Ziakis, C.; Vlachopoulou, M.; Kyrkoudis, T.; Karagkiozidou, M. Important factors for improving Google search rank. Future Internet 2019, 11, 32. [Google Scholar] [CrossRef]
- Evans, M.P. Analysing Google rankings through search engine optimization data. Internet Res. 2007, 17, 21–37. [Google Scholar] [CrossRef] [Green Version]
- Bifet, A.; Castillo, C.; Chirita, P.-A.; Weber, I. An analysis of factors used in search engine ranking. In Proceedings of the 2005 4th International World Wide Web Conference, Chiba, Japan, 10–14 May 2015. [Google Scholar]
- Agichtein, E.; Brill, E.; Dumais, S. Improving Web Search Ranking by Incorporating User Behavior Information. ACM SIGIR Forum 2019, 52, 11–18. [Google Scholar] [CrossRef]
- Egri, G.; Bayrak, C. The role of search engine optimization on keeping the user on the site. Proced. Comput. Sci. 2014, 36, 335–342. [Google Scholar] [CrossRef]
- Dotson, J.P.; Fan, R.R.; Feit, E.M.; Oldham, J.D.; Yeh, Y.-H. Brand Attitudes and Search Engine Queries. J. Interact. Mark. 2017, 37, 105–116. [Google Scholar] [CrossRef]
- Gyöngyi, Z.; Garcia-Molina, H.; Pedersen, J. Combating Web Spam with TrustRank. In Proceedings of the 2004 VLDB Conference, Toronto, ON, Canada, 31 August–3 September 2004. [Google Scholar]
- Katumba, S.; Coetzee, S. Employing Search Engine Optimization (SEO) Techniques for Improving the Discovery of Geospatial Resources on the Web. ISPRS Int. J. Geo-Inf. 2017, 6, 284. [Google Scholar] [CrossRef]
- Dickinson, Z.; Smit, M. Canadian public libraries and search engines: barriers to visibility. Aslib J. Inf. Manag. 2016, 68, 589–606. [Google Scholar] [CrossRef]
- Baye, M.R.; De los Santos, B.; Wildenbeest, M.R. Search Engine Optimization: What Drives Organic Traffic to Retail Sites? J. Econ. Manag. Strateg. 2016, 25, 6–31. [Google Scholar] [CrossRef]
- French, R.B.; Fagan, J.C. The Visibility of Authority Records, Researcher Identifiers, Academic Social Networking Profiles, and Related Faculty Publications in Search Engine Results. J. Web Librariansh. 2019, 13, 156–197. [Google Scholar] [CrossRef] [Green Version]
- Zhang, J.; Dimitroff, A. The impact of webpage content characteristics on webpage visibility in search engine results (Part I). Inf. Process. Manag. 2005, 41, 665–690. [Google Scholar] [CrossRef]
- Killoran, J.B. How to Use Search Engine Optimization Techniques to Increase Website Visibility. IEEE Trans. Prof. Commun. 2013, 56, 50–66. [Google Scholar] [CrossRef]
- Miklosik, A.; Evans, N.; Zak, S.; Lipianska, J. A framework for constructing optimisation models to increase the visibility of organizations’ information in search engines. Inf. Res. 2019, 24. [Google Scholar]
- Strzelecki, A. Website removal from search engines due to copyright violation. Aslib J. Inf. Manag. 2019, 71, 54–71. [Google Scholar] [CrossRef]
- Strzelecki, A. Data for Study “Google Web and Image Search Visibility Data for Online Store”. RepOD 2019. [Google Scholar] [CrossRef]
- Worldwide Desktop Market Share of Leading Search Engines from January 2010 to April 2019. Available online: https://0-www-statista-com.brum.beds.ac.uk/statistics/216573/worldwide-market-share-of-search-engines/ (accessed on 15 July 2019).
- Search Console API |Google Developers. Available online: https://developers.google.com/webmaster-tools/search-console-api-original/ (accessed on 10 July 2019).
Figure 1.
Clusteric Search Auditor with the Google Search Console (GSC) Application Programming Interface (API).
Figure 1.
Clusteric Search Auditor with the Google Search Console (GSC) Application Programming Interface (API).


Table 1.
Descriptive statistics of dataset rows.
| Year & Month | Web Search | Image Search |
|---|---|---|
| 2018-04 | 125,846 | 412,956 |
| 2018-05 | 123,177 | 415,194 |
| 2018-06 | 126,690 | 418,675 |
| 2018-07 | 151,526 | 413,382 |
| 2018-08 | 249,218 | 483,056 |
| 2018-09 | 248,674 | 382,541 |
| 2018-10 | 270,541 | 332,905 |
| 2018-11 | 313,840 | 301,943 |
| 2018-12 | 244,733 | 302,235 |
| 2019-01 | 269,413 | 351,523 |
| 2019-02 | 252,751 | 293,517 |
| 2019-03 | 186,795 | 175,073 |
| 2019-04 | 157,443 | 140,649 |
| 2019-05 | 161,647 | 152,094 |
| 2019-06 | 161,741 | 126,335 |
| Control | 68,093 | 76,158 |
Table 2.
Sample set of five rows from the file 2018–04–web.csv in the dataset.
| Date | Device | Country | Page | Query | Impr. | Clicks | Click-Through Ratio (CTR) | Pos. |
|---|---|---|---|---|---|---|---|---|
| 2018-04-22 | mobile | United States | https://www.babyaisle.eu/en/product/64410, roan-bass-soft-multifunctional-stroller | bass soft | 5 | 2 | 0.4 | 1 |
| 2018-04-25 | mobile | Estonia | https://www.babyaisle.eu/en/product/73647, invictus-v-plus-multifunctional-stroller | invictus stroller | 5 | 2 | 0.4 | 2.8 |
| 2018-04-27 | tablet | United Kingdom | https://www.babyaisle.eu/en/product/65561, espiro-next-manhattan-multifunctional-stroller | next espiro | 4 | 2 | 0.5 | 2.5 |
| 2018-04-23 | desktop | Serbia | https://www.babyaisle.eu/en/product/11745, chicco-zanza-no-anti-mosquitoes-device | chicco zanza | 3 | 2 | 0.67 | 14 |
| 2018-04-26 | mobile | Canada | https://www.babyaisle.eu/en/product/72290, tako-jumper-duo-multifunctional-stroller | tako jumper duo | 2 | 2 | 1 | 2.5 |
Table 3.
Descriptive statistic of data.
| Dimensions & Data | Web Search | Image Search |
|---|---|---|
| Country | 240 | 240 |
| Page | 13,115 | 18,088 |
| Query | 78,313 | 225,123 |
| Device | 3 | 3 |
| Impressions | 4,861,688 a (3,780,270) b | 9,056,528 a (6,916,252) b |
| Clicks | 122,705 a (42,715) b | 22,674 a(13,063) b |
a Volume calculated with Date and Country dimensions. b Decreased volume calculated with all five dimensions.
© 2019 by the author. Licensee MDPI, Basel, Switzerland. This article is an open access article distributed under the terms and conditions of the Creative Commons Attribution (CC BY) license (http://creativecommons.org/licenses/by/4.0/).
Share and Cite
MDPI and ACS Style
Strzelecki, A. Google Web and Image Search Visibility Data for Online Store. Data 2019, 4, 125. https://0-doi-org.brum.beds.ac.uk/10.3390/data4030125
AMA Style
Strzelecki A. Google Web and Image Search Visibility Data for Online Store. Data. 2019; 4(3):125. https://0-doi-org.brum.beds.ac.uk/10.3390/data4030125
Chicago/Turabian StyleStrzelecki, Artur. 2019. "Google Web and Image Search Visibility Data for Online Store" Data 4, no. 3: 125. https://0-doi-org.brum.beds.ac.uk/10.3390/data4030125