
Recursive Genetic Micro-Aggregation Technique: Information Loss, Disclosure Risk and Scoring Index


1
Department of Computer Science and Applications, Faculty of Prince Al-Hussein Bin Abdallah II for Information Technology, The Hashemite University, P.O. Box 330127, Zarqa 13133, Jordan
2
Department of Antiquities, Amman 11118, Jordan
*
Author to whom correspondence should be addressed.
Data 2021, 6(5), 53; https://0-doi-org.brum.beds.ac.uk/10.3390/data6050053
Submission received: 27 April 2021
/
Revised: 16 May 2021
/
Accepted: 17 May 2021
/
Published: 20 May 2021
Abstract
:This research investigates the micro-aggregation problem in secure statistical databases by integrating the divide and conquer concept with a genetic algorithm. This is achieved by recursively dividing a micro-data set into two subsets based on the proximity distance similarity. On each subset the genetic operation “crossover” is performed until the convergence condition is satisfied. The recursion will be terminated if the size of the generated subset is satisfied. Eventually, the genetic operation “mutation” will be performed over all generated subsets that satisfied the variable group size constraint in order to maximize the objective function. Experimentally, the proposed micro-aggregation technique was applied to recommended real-life data sets. Results demonstrated a remarkable reduction in the computational time, which sometimes exceeded 70% compared to the state-of-the-art. Furthermore, a good equilibrium value of the Scoring Index was achieved by involving a linear combination of the General Information Loss and the General Disclosure Risk .
1. Introduction
A large number of users, clients, and customers access data and information, which raises concerns regarding the confidentiality of data [1,2]. Accessing statistical summaries is obligatory in several public and private entities [3,4], threatening data security and privacy. Several statistical agencies worldwide aim to provide useful statistical summaries without breaking the confidentiality requirements. Assessment of the confidentiality and utility of the data is studied using various methods and strategies [4].
“Micro-Aggregation” is a perturbative method that critically partitions the micro-data file into groups of either a fixed-size k or variable-size , where k is a predefined threshold set by the data protector [4]. If the size of the group is satisfiable, then Micro-Aggregation Technique discloses the mean values of the group as a replacement of the original micro-records.
The Micro-Aggregation Problem belongs to the -hard class problems, which aims to obtain the optimal partition of the micro-data file. It is defined as follows. A micro-data set is defined as n multi-variate individuals, namely the ’s. Each of them is a data vector that has p continuous variables. Micro-aggregation involves partitioning the n data vectors into m groups in order to reach the optimal k-partition, such that each group, of size, , contains either exactly k data vectors (fixed-size case), or (data-oriented case). The best k-partition is the partition that minimizes between-group similarity and maximizes within-group similarity. The similarity of each group is measured as the Sum of Squares Error calculated using the Euclidean distances of each individual data vector to the mean of the group it belongs to [5]. It is given by:
Analogously, the between-group is computed as the Sum of Squares Among the groups reflecting the squared deviations of the means from the data total mean [5]. It is given as:
The Total Sum of Squares is designated by . Information Loss is a metric expressed as a ratio of to . The value of falls in the range of 0 and 1 as given [5]:
The primary contribution of this work is to apply the divide and conquer concept to the state-of-the-art Enhanced Genetic Multi-variate Micro-Aggregation Technique [6] to reduce the computational time and to enhance the value of the and Disclosure Risk (Disclosure risk presents the probability that an intruder can obtain some information about the original micro-data from the published one.) by imposing a variable group-size. The applicability of integrating the divide and conquer concept and genetic algorithm to the provides a favorable strategy for preserving sensitive data in the micro-data file and compromising the contradiction between the and the .
This research article presents an introduction in Section 1; a brief survey about the reported in Section 2 and, particularly, the strategy. Section 3 illustrates the informal and algorithmic expressions of the newly proposed . Section 4 shows results of experiments performed on real benchmark data sets. Finally, the conclusions are drawn in Section 5.
2. Micro-Aggregation
Micro-aggregation is applied to preserve statistical databases and to protect the individual records [2]. This technique seeks to group the micro-records in the original file into groups of size and then disseminates the average values instead of the original micro-record values. To preserve the privacy of original data before publishing, the records should be placed in a group whose size equals k or more [4]. The s are classified based on [7]:
- The degree of the micro-data file, which represents the number of attributes used in the micro-aggregation process that determines the aggregation method, namely whether it is uni-variate or multi-variate. The uni-variate method covers using a principle component, choosing a particular variable, or calling the sum of z-scores [8], whereas the multi-variate method covers unprojected multi-variate data or projected multi-variate data on a single axis [9].
- The type of solution. The optimal uni-variate solves as the shortest path problem on a graph with a polynomial complexity [13]. However, there is no optimal for multi-variate known as an -hard problem [5,7]. Thus, researchers have shown great interests in heuristic s that provide approximate solutions near the optimal, by employing genetic algorithms [14,15,16], hierarchical clustering [10,17], automata theory [12], neural networks [2,18], graph theory [19,20], or fuzzy-logic [21].
This paper will focus on the Maximum Distance to Average Vector technique [10] and the Enhanced Genetic Multi-variate Micro-Aggregation Technique [6] as examples of the state-of-the-art. Therefore, a summary of each one will be proposed.
The is one of the simplest and the most attractive techniques. It is designed to generate a fixed group size constraint. begins by computing the mean of the whole data set, and then searching for the farthest record from the mean, called . After that, it obtains the farthest record from , called . Then, the technique finds the closest records to the s and the closest records to r in order to form two groups. The records in these two groups are deleted from the original data set. The above steps are continuously repeated until the number of records in the data set is less than k records. The remaining records have to be grouped to the closest group to them [10]. Finally, the means of each group are published [22].
The is one of the that employs a genetic algorithm to solve [6]. Firstly, the micro-data file is divided into a number of domes based on the proximity distance similarity. All domes have equal size, which is pre-defined by the data protector. The genetic operations, namely crossover and mutation, are independently invoked in every dome and repeated until the convergence condition is satisfied. The latter condition is defined to reach a stable fitness value defined as the value of . Secondly, all domes are merged into one single dome to refine the final results by reinvoking the genetic operations in the whole micro-data file. Further details can be found in [6]; as mentioned earlier, the micro-data records/genes are divided into a number of sub-domes L, with size equal to . The authors of [6] reported that choosing the number of domes to be between and leads to the optimal value of the . The best value of L may belong to a large range; therefore, guessing the optimal size of these sub-domes is not an easy task. Another disadvantage of this is that it requires substantial computational time to generate and disclose the micro-aggregated file. It is worth addressing here that the belongs to the fixed size group type where all groups/chromosomes share the same size, which is equal to k. This will lead to an increase in the value of the Disclosure Risk .
3. Recursive Genetic Micro-Aggregation Technique (RGMAT)
We developed a recursive and plausible mechanism, referred to as the Recursive Genetic Micro-Aggregation Technique (RGMAT), for minimizing the required computational time of the entire data set and providing us with a favorable value of the Scoring Index (SI)(The scoring index is a metric that trades off between the achieved level of protection (privacy) and the correctness of the results that the users could obtain (utility).) besides generating a variable group-size constraint for the aggregated micro-individuals. Our methodology is as follows: rather than splitting the entire micro-data file into a number of domes by invoking the method, we propose that the entire data in a single original dome be recursively sub-divided into two smaller sub-domes. The genetic operation “crossover” is performed on each sub-dome independently until the convergence condition is satisfied. The recursion is successfully terminated, if the generated sub-dome size is between k and inclusive. Lastly, the genetic operation “mutation” is performed over all generated sub-domes to maximize the objective function. We stress that the smaller sub-domes should not be obtained as the result of invoking the on the original dome. This recursive sub-division cannot be “arbitrary” (it must be based on a meaningful criterion). It must utilize the underlying clustering philosophy by applying the genetic concept. Moreover, we suggest that every sub-dome is independently micro-aggregated. Finally, the micro-aggregated records are combined in order to obtain the published file.
The algorithm that implements the can be formalized as follows. Let the input of the micro-data set be given by InSet with a size of N and the output micro-aggregated records be OutSet.
The process is initiated with normalizing the micro-data file (InSet) to give equal weights for all variables [5,6,7]. The similarity between records/genes is estimated by building the similarity distance matrix based on “Euclidean distance” [5,12].
Instead of micro-aggregating the individual records using genetic algorithm by dividing the vast dome into L domes where each dome size is equal to in , we apply the divide and conquer concept to partition the original dome (InSet) set into two mutually exclusive sub-domes (i.e., and ), satisfying the variable group size constraint.
The InSet is ready to be micro-aggregated if the size of InSet, N, is between k and inclusive. Nevertheless, if the size of InSet, N, is equal to or greater than , then the InSet is recursively invoked into two mutually exclusive sub-domes. It is worth mentioning that before recursive calls, the seeks to reach the optimal size of the two sub-domes and represented by left.dome.size and right.dome.size, respectively. We converge to this optimal size for both sub-domes by initializing the left.dome.size to half the original dome size . Then we check if the left.dome.size is divisible by two and, simultaneously, divisible by k. If the above condition is satisfied, then we successfully determine the optimal size of the . Otherwise, we keep decreasing the left.dome.size by one until the above condition is satisfied. After converging to the optimal size of the left.dome.size, the right.dome.size is directly assigned to be equal to the remaining genes/records in the original dome (right.dome.size = N − left.dome.size). Secondly, and more importantly, this procedure utilizes the underlying clustering philosophy by applying the genetic operations. This is done by computing the mean of the original dome InSet, and then searching for the furthest record/gene from the computed centroid called , using this to create an sub-dome of a size equal to left.dome.size. The consists of and the nearest left.dome.size genes/records. After removing these genes/records from the original dome InSet, we assign the remaining records/genes to the sub-dome.
The objective function is to maximize the homogeneity of the records/genes in the generated sub-domes. The goal is to simultaneously maximize the within-group and minimize the between-group similarity of records/genes in each sub-dome and . This is done by applying the genetic learning process to epochs. Each epoch is started with computing the fitness value (i.e., the sum of square error) of the and sub-domes. Then, the crossover process is set in progress by choosing a set of records/genes based on the crossover ratio (CorRatio) predefined by the data protector. Then, a random pair of records/genes is selected from the chosen set to swap the predefined percentage of the CorRatio between them. Consequently, this impacts the fitness value of both sub-domes and . If the fitness value decreased, then the swap action takes place, otherwise, it is cancelled. Accordingly, the pair (original genes) is deleted from the chosen set. The whole crossover process is repeated when the chosen set is not empty.
After performing the crossover operation, the total value of the fitness function is computed. If there is a change compared to the old computed value, a new generation will take place. Otherwise, a recursive call will be invoked for each sub-dome and . The reason behind the recursive calls is converging to the desired underlying cluster in and .
The mutation operation does not immediately start after the crossover step in each level of recursion. This mutation step will only take place at the leaves level by creating a chosen mutation set of records/genes from the rightmost sub-dome to the leftmost sub-dome based on the mutation ratio (MuRatio) defined by the data protector. Then, a random record/gene is selected from the chosen mutation set to migrate one record/gene from the most to other sub-domes without violating the variable group-size constraint. The total fitness value of all sub-domes at the leaves levels will be affected by this migration process. Thus, if the total fitness value decreased, then the migration action takes place; otherwise, it is cancelled. Accordingly, the migrated record/gene is deleted from the chosen mutation set. The whole mutation process is repeated while the chosen set is not empty. Finally, the aggregated file is created and disclosed. The above description is formulated in Algorithms 1 and 2.
| Algorithm 1: The RGMAT Scheme for the MAP |
Input: InSet: Set of micro-data records. N: Number of records. d: Number of dimensions of dataset. Output: IL: The value of the Information Loss Note: : Security Threshold is a constant value. : Constant value of crossover ration. : Constant value of mutation ration. Method:
|
Time is not a crucial factor in genetic algorithms; as consequence, the most important criterion is the accuracy of the results. It is well-known that the genetic algorithm runs iteratively in a polynomial degree that depends on the number of generations, the size of the data set, and the inner genetic operations. A set of solutions is randomly generated, thus forming the initial population. The cost of each reachable solution includes the cost of crossover, mutation and selection. The best k solutions are kept. Then the genetic algorithm is continued as previously explained to either reach maximum number of generations, or to successfully converge to the sub-optimal fitness value measured by . After the last iteration, the optimal partition is found.
The main advantage of the new is to micro-aggregate the micro-data set in substantially less time without sacrificing neither the nor the values. Another advantage of the proposed technique is that such a strategy is applicable in multi-processor machines, and particularly shared-memory systems (where there is no need to plan the communication of data between different processors). Additionally, the memory caches will be used efficiently because the subset size is small enough to be stored in the cache and then the partitioning can be achieved without accessing the slower main memory. Integrating the divide and conquer approach with the genetic algorithm will reduce the required time.
As mentioned earlier, imposing a recursive strategy does not only lead to an evident saving of time, but also it preserves the minimization of the and values. This is achieved by invoking the base (terminating) step, where the is minimized for each atomic partition. The beauty of this is to aggregate the genes in different chromosome sizes that satisfy the variable group size constraint.
| Algorithm 2: REC-Split(InSet,N) |
Input: InSet: Set of micro-records. N: Number of micro-records. Output: OutSet: The micro-aggregated records. Note: : Security Threshold is a constant value. : Constant value of crossover ration. : Constant value of mutation ration. Method:
|
4. Experimental Results
The was thoroughly tested, and the results are encouraging. It was tested on the Tarragona data set (834 records and 13 variables) and the Census data set (1080 records and 13 variables) [5,10].
The strength of the newly developed is profound when it is used with a variable group size constraint. The has the talent of implementing a recursive division of the whole data set into two groups/chromosomes based on the distance proximity between the individual micro-records/genes. The recursive step is terminated when the number of genes per chromosomes is between k and . The main objective of the function is to minimize the value of the fitness function by varying the number of chromosomes from one generation to another in each recursive step. It is worth mentioning that using epochs is enough to maintain the diversity between generations. Additionally, sequentially invoking the crossover process per recursive step and performing the mutation process once before aggregation gives a positive contribution to the variation between generations. The values of the and were set to be equal to and , respectively.
Table 1 presents the results of using the newly proposed on multivariate data sets. The experiments of testing were performed with various values of k to investigate the effect of increasing the number of genes per chromosome. Increasing the number of genes/micro-records per chromosome/groups tends to increase the computational time and the value of the . Although the value of obtained by is comparable (either equal or less than) to the value obtained by , the required computational time was always less than the required computational time in . Splitting the single dome into two sub-domes continuously until satisfying the variable group size constrain reduced the required computational time by up to 70%. It is essential to highlight that did not involve optimizing the dome size at all, as is the case in the . Within the context of this work, the computational time represents the time needed for obtaining the micro-aggregated file with a specified dome size. This does not cover the total computational time for all dome sizes between and (to find the best value of ).
The experiments were performed to test the applicability of the proposed algorithm to balance the two conflicting criteria of and [23,24], which were evaluated by calculating the Scoring Index value for the , , and on both the Census and Tarragona data sets as shown in Table 2.
General Information Loss (): The value of approximates how much of the data was generically damaged when using the [8,10,13,25,26]. We now assess the impact of MAT on the original file’s data utility. Our goal is to evaluate the difference between the masked aggregated file and the original one. This is generally measured by demonstrating how the statistics have been structurally modified and how large is the modification [5]. The statistical characteristics of the original file are essential to be protected. This is usually measured by calculating the mean variation of the data (), the mean variation of the means (), the mean variation of the variances (), the mean variation of the covariance (), and the mean absolute error of correlations (). The overall is defined as follows: [5,7,9]. These calculations will undoubtedly provide a better understanding of the performance of the [5]. More information on measuring the can be found in [25,27,28,29,30]. In general, the ’s value is directly proportional to the number of genes per chromosome (records per group) represented by the value of k. For the Census data set, the ’s best value for all three was at k equal to 3. Specifically, the value for the was , was , and was . By contrast, the best value of in the Tarragona data set for all three was at k equal to 4. The value for was , was , and was . These results clearly indicate that the method saved the data utility more efficiently than and . Therefore, the outperformed the state-of-the-art methods in term of .
General Disclosure Risk : Analyzing the effect on the confidentiality of disseminating the micro-aggregated file must also be comprehensively studied. The reason is that the depends on the data and the intruder’s prior knowledge about the data. Therefore, we have to quantify the risk of having extra information that can link a masked record in the masked file with the corresponding original record in the original file. This also evaluates the risk of accurately estimating the original records’ values from the published masked records [12,18,28,31]. The will be evaluated as the average value of two different recommended strategies, the Record Linkage Disclosure technique and the confidential Interval Disclosure as follows: .
Record Linkage Disclosure Technique : The Euclidean distance is calculated between every single micro-record in the generated micro-aggregated masked file with all micro-records in the original file. Then the “the first nearest” and “the second nearest” micro-records for each micro-record in the masked file are marked. If the marked micro-record in the original file has the same index record as in the masked file, a “Match” is counted [12,23,27,32,33,34]. The number of matches over the number of micro-records in the original file defines the . This technique estimates the number of masked micro-records whose identity can be re-identified by the invader [12]. Applying this technique requires an assumption that “an intruder has an external file containing a subset of the key variables that are common with the published file”. The intruder tries to pair-match a subset of common shared variables in the external file with the published file to infer more information about the original micro-record. Therefore, The is calculated as the average of the overall possible combinations as combinations, such that S represents the number of key variables in the micro-data file and C represents the number of selected variables known to the intruder in the external file. Namely, seven key variables are used based on the literature, including: Var1, Var2, Var3, Var5, Var10, Var11, and Var12 [18,28,31]. The results shown in Table 2 illustrate that using to estimate the risk of disclosing the confidentiality of the information is decreased with increasing genes per chromosome for a given k value. Herein, we found that the scored the minimum value of the estimated risk of using the on the Tarragona data set, while scored the minimum value of the estimated risk of using the on the Census data set.
Confidential Interval Disclosure Technique : This technique is not attentive to define the exact original value; it has interest only in finding an approximate value [32]. The independently ranks each attribute and defines an interval for each ranked attribute based on the neighborhood of the value that the attribute takes on for a specific micro-record, say r. The rank of this value should not be more than of the size of the original micro-file, and the value of that attribute in the micro-record, r, should correspond to the value of the center of the interval. In other words, it is assumed that a specific variable is independently sorted, and r is the value taken by that variable in a certain micro-record. Then, the lower and the upper bounds of the interval are equal to and the value , respectively. The match occurs when values of all variables in the micro-record fall into the corresponding computed intervals. Further details can be found in [5,23,32,35].
The invader estimates each interval size by using the . A large interval indicates a large value for the confidence. The average confidence is calculated by using a specific fixed determined range of percentage (between 1 and 10%) of the micro-records. Clearly, if P has a large value, then a larger value of will be obtained and a small amount of information is disclosed [5]. The percentage value of was measured as the average values at the various settings of P() on the Census and Tarragona data sets, as shown in Table 2.
Finally, the values were calculated for all of the and presented in Table 2.
Evaluating the scoring index for this proposed is an urgent demand in order to compare its performance with the state-of-the-art and . It is well-known that every disturbs the original dataset in two fronts: privacy and utility. To the best of our knowledge, it is inappropriate to focus on one of them and ignore the other. Additionally, the direct comparison between privacy and utility is not reasonable for several technical and philosophical reasons. The most important reason is that privacy is an individual concept, while utility is an aggregate concept. The masked dataset will not be disseminated unless the privacy for each individual is protected and the utility gain adds up when multiple pieces of knowledge are learned. Secondly, when publishing a masked dataset, only the individuals whose data are included have potential privacy loss, while others have potential utility gain. Therefore, the Scoring Index, , is a measure that focuses on the two conflicting criteria General Information Loss () and General Disclosure Risk (); a decrease in one of them results in an increase in the other one. Estimating the is a recommended practice since each criterion measures a totally different perspective for the . For that reason, there is a serious requisite to utilize a rational index that linearly combines and as follows: , where X is set to be equal to to give both criteria an equal weight [5]. The lower score value implies a better performance [36,37]. From Table 2, the technique has comparable performance to the state-of-art and techniques in terms of the and at different k values.
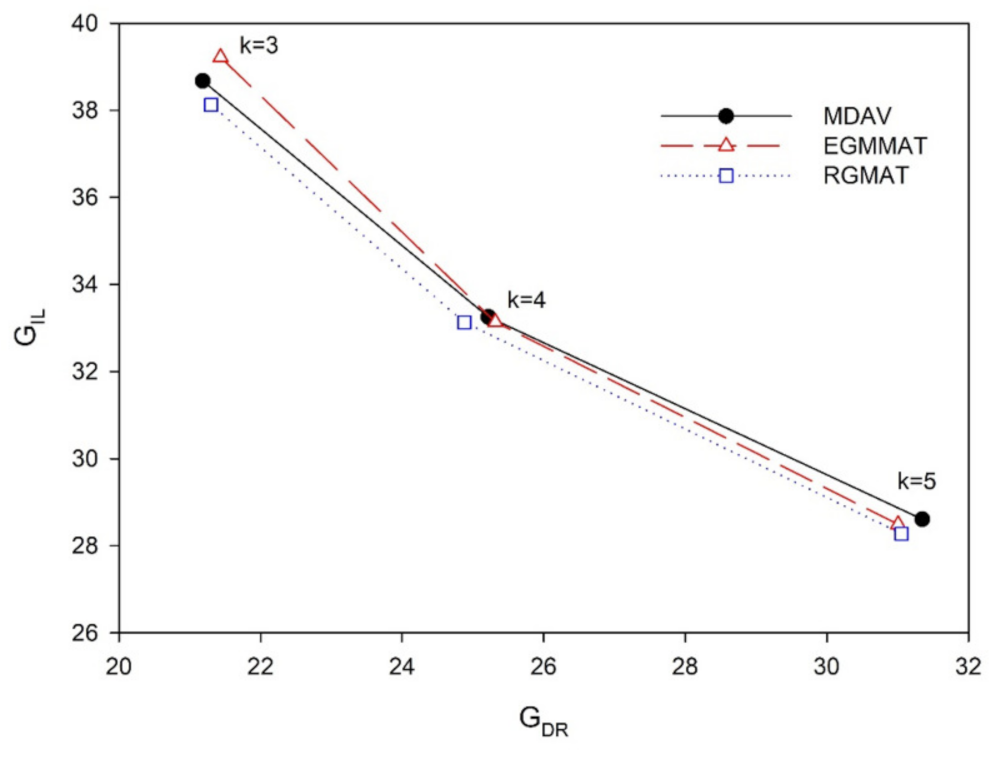
A motivating task includes studying how the , , and are compared when the conflicting criteria come to production at the same time. This can be achieved by plotting the versus the for the Census data set, as shown in Figure 1, for all schemes. A set of paired values of and for the particular technique at various values of k ranging from 3 to 5 were plotted. The user will witness the effect of the k values on a masked method. From the curve we observe that the successfully balances these conflicting criteria in an excellent way comparable to the and methods. This small difference has a significant impact on trading off between the two conflicting criteria and . Finding the optimal combination of these two measures is a difficult and challenging task [38]. This confirms the difficulty of improving the measure.
5. Conclusions
In this research, we discussed the problem of designing for secure statistical databases. The originality of the developed technique involves integrating the divide and conquer concept with a genetic algorithm. This incorporates proximity information between individual micro-data. Experimentally, the newly proposed showed good results in obtaining a comparable value of to the state-of-the-art (either same or less than) with a reduction in the required computational time of up to . This strategy presents an excellent tool for solving the micro-aggregation problem in the statistical disclosure control field. The disadvantages of this strategy are an integral part of the disadvantage of any micro-aggregation technique, which may suffer from obscuring useful statistical information of some presented information in the published file. In addition, adding or deleting certain micro-records is considered a very expensive operation. The proposed can be applied in other contexts—for example, redesigning the proposed to form parallelism. To the best of our knowledge, focusing on designing a fast parallel algorithm for the micro-aggregation problem has not been explored yet.
Author Contributions
Conceptualization, E.F.; methodology, E.F.; software, O.A.; formal analysis, E.F.; investigation, E.F.; data curation, E.F.; writing-original draft preparation, E.F.; writing-review and editing, E.F.; All authors have read and agreed to the published version of the manuscript.
Funding
This research received no external funding.
Conflicts of Interest
The authors declare no conflict of interest.
References
- Adam, N.; Wortmann, J. Security-Control Methods for Statistical Databases: A Comparative Study. ACM Comput. Surv. 1989, 21, 515–556. [Google Scholar] [CrossRef]
- Sanchez, D.; Domingo-Ferrer, J.; Martinez, S.; Soria-Comas, J. Utility-preserving differentially private data releases via individual ranking microaggregation. Inf. Fusion 2016, 30, 1–14. [Google Scholar] [CrossRef] [Green Version]
- Domingo-Ferrer, J.; Soria-Comas, J. Steered Microaggregation: A Unified Primitive for Anonymization of Data Sets and Data Streams. In Proceedings of the 2017 IEEE International Conference on Data Mining Workshops, ICDM Workshops 2017, New Orleans, LA, USA, 18–21 November 2017; IEEE Computer Society: Washington, DC, USA, 2017; pp. 995–1002. [Google Scholar]
- Tonni, S.; Rahman, M.; Parvin, S.; Gawanmeh, A. Securing Big Data Efficiently through Microaggregation Technique. In Proceedings of the 2017 IEEE 37th International Conference on Distributed Computing Systems Workshops (ICDCSW), Atlanta, GA, USA, 5–8 June 2017; pp. 125–130. [Google Scholar]
- Fayyoumi, E. Novel Micro-Aggregation Techniques for Secure Statistical Databases. Ph.D. Thesis, Shool of Computer Science at Carleton University, Ottawa, ON, Canada, 2008. [Google Scholar]
- Fayyoumi, E.; Nofal, O. Applying Genetic Algorithms on Multi-level Micro-Aggregation Techniques for Secure Statistical Databases. In Proceedings of the 15th IEEE/ACS International Conference on Computer Systems and Applications, AICCSA 2018, Aqaba, Jordan, 28 October–1 November 2018; IEEE Computer Society: Washington, DC, USA, 2018; pp. 1–6. [Google Scholar]
- Fayyoumi, E.; Oommen, B. A survey on statistical disclosure control and micro-aggregation techniques for secure statistical databases. Softw. Pract. Exp. 2010, 40, 1161–1188. [Google Scholar] [CrossRef]
- Mateo-Sanz, J.; Domingo-Ferrer, J. A Comparative Study of Microaggregation Methods. Questiio 1998, 22, 511–526. [Google Scholar]
- Cuppen, M. Secure Data Perturbation in Statistical Disclosure Control. Ph.D. Thesis, Statistics Netherlands, Amsterdam, The Netherlands, 2000. [Google Scholar]
- Domingo-Ferrer, J.; Mateo-Sanz, J. Practical Data-Oriented Microaggregation for Statistical Disclosure Control. IEEE Trans. Knowl. Data Eng. 2002, 14, 189–201. [Google Scholar] [CrossRef] [Green Version]
- Domingo-Ferrer, J.; Torra, V. Disclosure Control Methods and Information Loss for Microdata. In Confidentiality, Disclosure and Data Access: Theory and Practical Applications for Statistical Agencies; Doyle, P., Lane, J., Theeuwes, J., Zayatz, L., Eds.; North-Holland: Amsterdam, The Netherlands, 2002; pp. 93–112. [Google Scholar]
- Fayyoumi, E.; Oommen, B. Achieving Microaggregation for Secure Statistical Databases Using Fixed-Structure Partitioning-Based Learning Automata. IEEE Trans. Syst. Man Cybern. Part B 2009, 39, 1192–1205. [Google Scholar] [CrossRef] [PubMed]
- Hansen, S.; Mukherjee, S. A Polynomial Algorithm for Univariate Optimal Microaggregation. IEEE Trans. Knowl. Data Eng. 2003, 15, 1043–1044. [Google Scholar] [CrossRef]
- Martinez-Balleste, A.; Solanas, A.; Domingo-Ferrer, J.; Mateo-Sanz, J. A Genetic Approach to Multivariate Microaggregation for Database Privacy. In Proceedings of the ICDE Workshops, Istanbul, Turkey, 17–20 April 2007; pp. 180–185. [Google Scholar]
- Balasch-Masoliver, J.; Muntes-Mulero, V.; Nin, J. Using genetic algorithms for attribute grouping in multivariate microaggregation. Intell. Data Anal. 2014, 18, 819–836. [Google Scholar] [CrossRef] [Green Version]
- Solanas, A.; Gonzalez-Nicolas, U.; Martinez-Balleste, A. A variable-MDAV-based partitioning strategy to continuous multivariate microaggregation with genetic algorithms. In Proceedings of the 2010 International Joint Conference on Neural Networks (IJCNN), Barcelona, Spain, 18–23 July 2010; pp. 1–7. [Google Scholar]
- Fayyoumi, E.; Oommen, B. On Optimizing the k-Ward Micro-Aggregation Technique for Secure Statistical Databases. In Proceedings of the 11th Austratasian Conference on Information Security and Privacy Proceeding, Melbourne, Australia, 3–5 July 2006; pp. 324–335. [Google Scholar]
- Oommen, B.; Fayyoumi, E. On Utilizing Association and Interaction Concepts for Enhancing Microaggregation in Secure Statistical Databases. IEEE Trans. Syst. Man Cybern. Part B 2010, 40, 198–207. [Google Scholar] [CrossRef] [PubMed] [Green Version]
- Oommen, B.; Fayyoumi, E. On utilizing dependence-based information to enhance micro-aggregation for secure statistical databases. Pattern Anal. Appl. 2013, 16, 99–116. [Google Scholar] [CrossRef] [Green Version]
- Grygorash, O.; Zhou, Y.; Jorgensen, Z. Minimum Spanning Tree Based Clustering Algorithms. In Proceedings of the 2006 18th IEEE International Conference on Tools with Artificial Intelligence (ICTAI’06), Arlington, VA, USA, 13–15 November 2006; pp. 73–81. [Google Scholar]
- Domingo-Ferrer, J.; Torra, V. A Critique of k-Anonymity and Some of Its Enhancements. In Proceedings of the 2008 Third International Conference on Availability, Reliability and Security, Barcelona, Spain, 4–7 March 2008; pp. 990–993. [Google Scholar]
- Solanas, A.; Martinez-Balleste, A. V-MDAV: A Multivariate Microaggregation with Variable Group Size. In Proceedings of the 17th COMPSTAT Symposium of the IASC, Rome, Italy, 28–31 August 2006. [Google Scholar]
- Domingo-Ferrer, J.; Mateo-Sanz, J. An Empirical Comparison of SDC Methods for Continuous Micro-data in Terms of Information Loss and Disclosure Risk. In Proceedings of the Joint ECE/Eurostat Work Session on Statistical Data Confidntiality, Conference of European Satisticians, Skopje, North Macedonia, 14–16 March 2001. [Google Scholar]
- Yancey, W.; Winkler, W.; Creecy, R. Disclosure Risk Assessment in Perturbative Microdata Protection. In Inference Control in Statistical Databases, from Theory to Practice; Springer: London, UK, 2002; pp. 135–152. [Google Scholar]
- Crises, G. Additive Noise for Microdata Privacy Protection in Statistical Databases; Technical Report; Springer: Barcelona, Spain, 2004. [Google Scholar]
- Laszlo, M.; Mukherjee, S. Minimum Spanning Tree Partitioning Algorithm for Microaggregation. IEEE Trans. Knowl. Data Eng. 2005, 17, 902–911. [Google Scholar] [CrossRef]
- Domingo-Ferrer, J.; Mateo-Sanz, J.; Oganian, A.; Torra, V.; Torres, A. On The Security of Microaggregation with Individual Ranking: Analytical Attacks. Int. J. Uncertain. Fuzziness Knowl.-Based Syst. 2002, 10, 477–491. [Google Scholar] [CrossRef] [Green Version]
- Mateo-Sanz, J.; Sebé, F.; Domingo-Ferrer, J. Outlier Protection in Continuous Microdata Masking; Springer: Berlin, Germany; Barcelona, Spain, 2004; pp. 201–215. [Google Scholar]
- Oganian, A.; Karr, F. Combinations of SDC Methods for Microdata Protection. In Privacy Statistical Databases; Springer: Berlin/Heidelberg, Germany, 2006; pp. 102–113. [Google Scholar]
- Sanchez, J.; Urrutia, J.; Ripoll, E. Trade-Off between Disclosure Risk and Information Loss Using Multivariate Microaggregation: A Case Study on Business Data; Privacy in Statistical Databases: CASC Project International Workshop, PSD 2004 Proceedings; Domingo-Ferrer, J., Torra, V., Eds.; Springer: Berlin, Germany; Barcelon, Spain, 2004; pp. 307–322. [Google Scholar]
- Brand, R.; Domingo-Ferrer, J.; Mateo-Sanz, J. Reference Data Sets to Test and Compare SDC Methods for Protection of Numerical Microdata; Technical Report; CASC PROJECT; Computational Aspects of Statistical Confidentiality: Plymouth, UK, 2002. [Google Scholar]
- Crises, G. Trading Off Information Loss and Disclosure Risk in Database Privacy Protection; Technical Report; Springer: London, UK, 2004. [Google Scholar]
- Oganian, A.; Domingo-Ferrer, J. On The Complexity of Optimal Microaggregation for Statistical Disclosure Control. Stat. J. U. N. Econ. Com. Eur. 2001, 18, 345–354. [Google Scholar] [CrossRef]
- Hundepool, A.; Domingo-Ferrer, J.; Franconi, L.; Giessing, S.; Lenz, R.; Longhurst, J.; Nordholt, E.; Seri, G.; Wolf, P. Handbook on Statistical Disclosure Control; A CENtre of EXcellence for Statistical Disclosure Control CENEX SDC: Amsterdam, The Netherlands, 2006. [Google Scholar]
- Domingo-Ferrer, J.; Torra, V. A Quantitative Comparison of Disclosure Control Methods for Microdata. In Confidentiality, Disclosure and Data Access: Theory and Practical Applications for Statistical Agencies; Doyle, P., Lane, J., Theeuwes, J., Zayatz, L., Eds.; Springer: Berlin, Germany; Amesterdam, The Netherlands, 2002; pp. 113–134. [Google Scholar]
- Herranz, J.; Matwin, S.; Nin, J.; Torra, V. Classifying data from protected statistical datasets. Comput. Secur. 2010, 29, 875–890. [Google Scholar] [CrossRef] [Green Version]
- Jimenez, J.; Mares, J.; Torra, V. An evolutionary approach to enhance data privacy. Soft Comput. 2011, 15, 1301–1311. [Google Scholar] [CrossRef]
- Nin, J.; Herranz, J.; Torra, V. Rethinking rank swapping to decrease disclosure risk. Data Knowl. Eng. 2008, 64, 346–364. [Google Scholar] [CrossRef]
Figure 1.
The effect of invoking the , , and on the and indices when , 4, and 5 for the Census data set.
Figure 1.
The effect of invoking the , , and on the and indices when , 4, and 5 for the Census data set.


Table 1.
Comparison of the value of between the state-of-the- art and as an average of 100 runs by using the Tarragona and Census data sets on various values of k.
Table 1.
Comparison of the value of between the state-of-the- art and as an average of 100 runs by using the Tarragona and Census data sets on various values of k.
| Data | k | |||||
|---|---|---|---|---|---|---|
| Set | Value | IL | Dome Size | Time (S) | IL | Time (S) |
| 3 | 15.5358 | 18 | 328 | 15.5359 | 86 | |
| Tarragona | 4 | 18.3463 | 20 | 359 | 18.3463 | 103 |
| 5 | 21.4701 | 20 | 392 | 21.4700 | 113 | |
| 3 | 5.62643 | 9 | 268 | 5.5787 | 103 | |
| Census | 4 | 7.40552 | 16 | 273 | 7.40552 | 108 |
| 5 | 8.87224 | 45 | 284 | 8.8678 | 113 | |
Table 2.
Scoring the , , and by combining the values of and to calculate the for different values of k as an average of 100 runs on the Tarragona and Census data sets.
Table 2.
Scoring the , , and by combining the values of and to calculate the for different values of k as an average of 100 runs on the Tarragona and Census data sets.
| Data | ||||||||||
|---|---|---|---|---|---|---|---|---|---|---|
| 28.60866 | 28.49277 | 28.27607 | 33.25432 | 33.13305 | 33.12851 | 38.67248 | 39.21647 | 38.11960 | ||
| 60.71330 | 60.46690 | 60.32290 | 49.70570 | 49.87700 | 49.05100 | 42.09810 | 42.71080 | 42.44210 | ||
| Census | 1.98148 | 1.54630 | 1.78704 | 0.73148 | 0.75925 | 0.70370 | 0.26852 | 0.15741 | 0.16667 | |
| 31.34739 | 31.00660 | 31.05497 | 25.21859 | 25.31813 | 24.87735 | 21.18331 | 21.43410 | 21.30438 | ||
| 29.97803 | 29.74969 | 29.66552 | 29.23646 | 29.22559 | 29.00293 | 29.92789 | 30.32529 | 29.71199 | ||
| 75.98087 | 76.27831 | 73.95006 | 52.36572 | 52.33175 | 51.69467 | 66.47553 | 66.07935 | 63.68698 | ||
| 33.85100 | 33.94670 | 35.15900 | 24.90940 | 24.92730 | 25.11270 | 20.40380 | 20.55200 | 22.00250 | ||
| Trragona | 0.731415 | 0.75540 | 0.77937 | 0.38369 | 0.35971 | 0.38369 | 0.40767 | 0.45563 | 0.25179 | |
| 17.29121 | 17.35105 | 17.96919 | 12.64655 | 12.64350 | 12.74820 | 10.40574 | 10.50382 | 11.12715 | ||
| 46.63604 | 46.81468 | 45.95962 | 32.50613 | 32.487628 | 32.22143 | 38.44063 | 3 8.29158 | 37.40706 | ||
Publisher’s Note: MDPI stays neutral with regard to jurisdictional claims in published maps and institutional affiliations. |
© 2021 by the authors. Licensee MDPI, Basel, Switzerland. This article is an open access article distributed under the terms and conditions of the Creative Commons Attribution (CC BY) license (https://creativecommons.org/licenses/by/4.0/).
Share and Cite
MDPI and ACS Style
Fayyoumi, E.; Alhuniti, O. Recursive Genetic Micro-Aggregation Technique: Information Loss, Disclosure Risk and Scoring Index. Data 2021, 6, 53. https://0-doi-org.brum.beds.ac.uk/10.3390/data6050053
AMA Style
Fayyoumi E, Alhuniti O. Recursive Genetic Micro-Aggregation Technique: Information Loss, Disclosure Risk and Scoring Index. Data. 2021; 6(5):53. https://0-doi-org.brum.beds.ac.uk/10.3390/data6050053
Chicago/Turabian StyleFayyoumi, Ebaa, and Omar Alhuniti. 2021. "Recursive Genetic Micro-Aggregation Technique: Information Loss, Disclosure Risk and Scoring Index" Data 6, no. 5: 53. https://0-doi-org.brum.beds.ac.uk/10.3390/data6050053