Data Descriptor

Analyses of Li-Rich Minerals Using Handheld LIBS Tool

1
Geosciences Department, GeoRessources CNRS-Université de Lorraine, BP 70239, 54506 Vandoeuvre-les-Nancy, France
2
Department of Geosciences, Environment and Spatial Plannings, Faculty of Sciences, University of Porto, Rua Campo Alegre, 4169-007 Porto, Portugal
3
ICT (Institute of Earth Sciences)–Porto pole (Portugal), Rua Campo Alegre, 4169-007 Porto, Portugal
4
Remote Sensing Division, Geological Survey of Brazil (CPRM), Rua Costa, São Paulo 01304-010, Brazil
5
Helmholtz Centre Potsdam, GFZ, 14473 Potsdam, Germany
6
Department of Earth Sciences, University of Western Ontario, BGS 1000B, London, ON N6A 5B7, Canada
7
Manitoba Geological Survey, 360-1395 Ellice Avenue, Winnipeg, MB R3G 3P2, Canada
*
Author to whom correspondence should be addressed.
Submission received: 2 April 2021 / Revised: 17 June 2021 / Accepted: 17 June 2021 / Published: 21 June 2021

Abstract

:
Lithium (Li) is one of the latest metals to be added to the list of critical materials in Europe and, thus, lithium exploration in Europe has become a necessity to guarantee its mid- to long-term stable supply. Laser-induced breakdown spectroscopy (LIBS) is a powerful analysis technique that allows for simultaneous multi-elemental analysis with an excellent coverage of light elements (Z < 13). This data paper provides more than 4000 LIBS spectra obtained using a handheld LIBS tool on approximately 140 Li-content materials (minerals, powder pellets, and rocks) and their Li concentrations. The high resolution of the spectrometers combined with the low detection limits for light elements make the LIBS technique a powerful option to detect Li and trace elements of first interest, such as Be, Cs, F, and Rb. The LIBS spectra dataset combined with the Li content dataset can be used to obtain quantitative estimation of Li in Li-rich matrices. This paper can be utilized as technical and spectroscopic support for Li detection in the field using a portable LIBS instrument.
Dataset License: CC-BY

1. Summary

Since the emergence of laser-induced breakdown spectroscopy (LIBS) [1,2], it has been utilized in numerous geological studies. This is due to the large range of potentially detected elements, which makes it a promising technique for the future. For a better overview, one can read the numerous papers and reviews on the applications of LIBS for geological purposes [3,4,5,6,7,8,9,10,11,12,13,14,15,16,17,18]. One may recall that the Perseverance rover on Mars, similar to the previous Curiosity rover, uses the LIBS technique (with the ChemCam and SuperCam instruments, respectively). Since 2012, the ChemCam tool has provided several thousand LIBS analyses on Martian soils and rocks for the geological interpretation of the Gale crater [19,20,21,22,23]. The SuperCam instrument, which arrived on Mars in February 2021, has already obtained remote LIBS–Raman–VNIR analyses of calibration targets and Martian rocks and soils [24,25,26].
More recently, portable LIBS tools have been widely used for the analysis of rocks, minerals, economic elements, and light elements [18,27,28,29,30,31,32,33,34]. Although quantitative data are mainly obtained from metal studies [30,35], for more complex materials such as geological mineral mixtures or rocks, standards and calibrations need to be designed to obtain consistent data when using the LIBS technique and, thus, the handheld LIBS tools [6,17,36,37,38,39,40,41,42,43]. The LIGHTS (Lightweight Integrated Ground and airborne Hyperspectral Topological Solutions) project aims at facilitating the exploration of new lithium (Li) resources, which mainly consist of pegmatites (http://lights.univ-lorraine.fr accessed on 1 May 2021). One of the richest regions in Europe is in Northern Portugal and North-Western Spain. These outcrops were specially selected to test the simultaneous acquisition of hyperspectral imaging data (HSI) and in situ analyses using handheld tools (LIBS, VNIR, SWIR). The project is dedicated to recognizing the most favorable targets from remotely sensed data and immediately following these up with ground measurements. In fact, by avoiding lab interpretation after the remote sensing work and the ground-truthing, the duration of exploration processes could be considerably shortened. This would require near real-time data processing based on chemometrics and artificial intelligence [44,45]. One previous data paper reported the acquisition of VNIR and SWIR spectra in the field from outcrops and various reference minerals [46] within the same project. As the LIBS handheld tool provides fast identification of trace elements, i.e., Li (Figure 1); here we aimed to establish the calibration curve of Li content in different matrices. These univariate calibrations can be used in LIBS applications [42,47,48,49,50,51,52].

2. Data Description

The database mainly includes laboratory LIBS spectra obtained from homogeneous Li-bearing minerals such as spodumene (LiAlSi2O6), petalite (LiAlSi4O10), amblygonite or montebrasite (LiAl(PO4)(F,OH)), lepidolite (K2(Li,Al)5-6(Si6-7Al2-1O20)(OH,F)4), zinnwaldite (KLiFeAl(AlSi3)O10(OH,F)2), and altered Li minerals [53]. Various LIBS analyses were also directly performed on Li-rich pegmatites at fresh outcrops in the field in Portugal by our Portuguese colleagues [46,54,55]. LIBS analyses were additionally performed on different powder pellets (obtained from the FAME project) and glasses made up of crushed powders from homogenized minerals. These samples (pellets and glasses) were specially tested to check the potential matrix effect that occurs during plasma formation and its emission.
In this study, 134 samples were analyzed using the handheld LIBS tool, covering the main minerals investigated during the LIGHTS project. In order to help the users of our dataset, the Li concentrations of minerals, calculated using bulk analysis such as ICP-OES, are available on the LIBS_database_file.csv with other important information, such as (i) the name of sample/spectra; (ii) sample matrix: mineral/rock, pressed pellet, synthetic glass; (iii) mineralogy if known; (iv) main trace elements detected by LIBS; (v) number of point analysis (mean number of available spectra) by sample; (vi) Li concentration (%). A first description of the samples is reported in the Table 1.
According to the rock mineralogy, the number of LIBS spectra acquired in each area (higher than 45) is sufficient to provide consistent data that reveal the mean composition of the rock. The relationship between the granulometry of the rock and the LIBS analyses is detailed in [17,56]. Thus, all the LIBS spectra presented in this data paper are representative of each composition. The relative standard deviations that were obtained from the different samples, and particularly for the lithium emission peaks, were between 7% for the powder pellets and 15% for the minerals. Previous studies have already reported the potential of handheld LIBS for lithium applications [18,32,57].

2.1. Format of the LIBS Spectra Files

Concerning data acquisition, the spectra can be directly displayed on the portable tool just after the analyses and the mean spectra are provided on the Profile Builder (internal software). These LIBS data (spectra) can be exported from the device to the user’s computer by opening the communication between the LIBS and the computer (USB connection or Wi-Fi). Different options are possible such as raw LIBS spectra, mean raw spectra, or all individual and/or mean spectra calibrated in wavelength. Here, two different kinds of spectra, obtained after cleaning the laser shots to avoid any dust contamination, are available in this dataset (as downloaded from the LIBS tool):
(i) Firstly, 4362 LIBS files correspond to the raw LIBS spectra with no processing treatment; thus, each spectra value corresponds to a point (corresponding to several laser shots) on the samples. These spectra values are not calibrated in wavelengths; thus, the identification of the elements is difficult due to potential shifts in nm as a result of the detectors. The raw spectra correspond to the LIBS spectra obtained at each point, are recorded in csv format, and they correspond to three columns: the first for pixels, the second for the wavelengths, and the last for the intensity (arbitrary intensity, counts on the detector), with the column titles being “pixel”, “wavelength”, and “intensity”. For the raw data, the initial format was built as IDmineral_yearmonthday_hour_PM_Spectrumnumber_PixelData.csv. These spectra can be downloaded from seven separate folders with explicit names that correspond to the providers and/or matrices (i.e., Univ. Lorraine, Canada, Brazil, GFZ, thin sections, powders, etc.). The open access website of ORDaR (OTELo Research Data Repository) is https://0-doi-org.brum.beds.ac.uk/10.24396/ORDAR-65 (accessed on 21 June 2021).
(ii) Secondly, 369 average LIBS spectra values calculated for each area are available. It should be highlighted that these LIBS spectra were directly recorded from the handheld LIBS tool and the spectra were calibrated in wavelength in order to facilitate element identification (as the element peaks are very narrow) by adding artificial pixels. The LIBS mean spectra values also correspond to .csv files. These calibrated spectra are the mean spectra obtained at several points, and they correspond to two columns: the first for wavelengths and the second for the intensity (arbitrary intensity, counts on the detector), with the column titles being “wavelength” and “intensity”. The initial format was built as IDmineral_yearmonthday_hour_AM_AverageSpectrum.csv; for the spectra associated with the analysis number, IDmineral_yearmonthday_hour_PM_Spectrumnumber.csv was used. In this study, the AverageSpectrum.csv was always kept for the major part of the spectra, and the beginning of the filename corresponds to the mineral ID. A typical name of these spectra is “IDMineral_20190417_041453_PM_AverageSpectrum” with the ID mineral at the beginning, the YearMonthDay_hourminutesecond time of the acquisition, and the notification of the AverageSpectrum. These spectra can be downloaded from the LIBS LIBS_spectra_DATAPAPER.zip.

2.2. Mineral Samples

The sample collection is composed of 128 minerals (spodumene (LiAlSi2O6), petalite (LiAlSi4O10), amblygonite (LiAl(PO4)(F,OH)), lepidolite (K2(Li,Al)5-6(Si6-7Al2-1O20)(OH,F)4), zinnwaldite (KLiFeAl(AlSi3)O10(OH,F)2)), and rock samples: 51 samples correspond to outcrop minerals/rocks from the Fregenda–Almendra pegmatite field, 30 minerals correspond to reference minerals from official suppliers, personal collections, or partners (MGS, Univ. Ontario, Suffel Collection, GeoRessources), and 41 LIBS spectra located on 24 different thick sections (provided by Univ. Ontario) correspond to individual minerals analyzed using LIBS. Nine rock samples were provided by Monica Perrotta from the Brazilian Geological Survey.

2.3. Thin Rock Sections

The analyzed thin rock sections (1 cm × 2 cm × 0.5 mm) correspond to muscovite samples where LA-ICP-MS analyses (individual points) on different micas were already performed, and the LIBS analysis was performed to compare the two techniques (not presented in this paper). In these minerals, the main elements detected using LIBS were obviously Al, Si, Mg, K, Na, Fe, Ca, and Li, but numerous trace elements were also detected such as Cs, Rb, Ta, Be, and Sr [58].

2.4. Powder Pellets

One portion of the samples corresponds to powder pellets with low Li content. One portion of the powders was provided by the FAME project (from the lepidolite pegmatite of Gonçalo in Portugal (GLi and TPR samples)), and the other portion of the pellets was from Bajoca outcrop rocks (the location can be found on the Bajoca_sample_location.csv file). These powders are less enriched in lithium than the Li-mineral samples. The particulate size of the powders used for the pellets was approximately 150 ± 10 µm. The powders were poured into steel molds with a diameter of 26 mm and a thickness of 2 mm to be finally compacted under 6.5 ton cm−2 for 1 min, since a pressure below 3 ton cm−2 can disturb the LIBS intensities [31,59].

2.5. Best Conditions for LIBS Analysis

Solid samples are more suitable for LIBS, and marked asperities on the sample surface can lead to a loss of ablation and problems with the plasma emission. However, for classical LIBS element detection, the signal is usually sufficient for identification even if the sample is not strictly flat (for the scale of the window 3 mm × 4 mm). For quantitative applications, a strict flatness is required, which can be compensated for by normalization if the matrix is the same [36,40,42]. If bulk estimation is the aim of the study, samples must be homogeneous at the laser beam scale (or on the area analyzed by several laser shots). The granulometry of the rock is the most critical point to be investigated before any geochemical interpretation, especially for analyses performed on micrometric areas (µLIBS, µXRF, Raman, VNIR, etc.). Multiplying the number of analyses on the rock is required in order to obtain the bulk composition [17,39,56]. Crushed and homogenized samples can be investigated by making pressed pellets. LIBS analysis is slightly destructive with an ablated layer of several to dozens of micrometers per laser shot depending on the smoothness of the material. As a series of laser shots is usually emitted, the sample thickness should be a minimum of 40 micrometers (corresponding to common thin rock sections). Finely grained samples may be homogeneous enough and provide good data but there is no way of knowing if there is a hidden feature below the sample surface, shallow enough to contribute to the signal. As such, confidence in results from such samples is not at the level it would be for homogenized ones.

3. Methods

3.1. Laser-Induced Breakdown Spectroscopy Technique

More information can be obtained through various specific papers as regards the spectroscopic aspects of the LIBS technique and its application in geology and more recently on Martian soil and rock ChemCam analyses [2,3,17,23,29,34,60]. The portable LIBS tool has a very safe design and avoids any laser operating in the air, allowing the geologists to perform analyses safely in the field. A pre-ablation shot at very low intensity is always emitted and if low or no plasma emission is detected, the device automatically stops. These devices now rely on Li batteries, which may require transportation authorization when traveling by road, boat, or plane. The batteries are usually below the threshold for road transportation. They should, however, be declared for boat or plane trips. The normal regulation, based on risk mitigation, is to avoid transporting Li batteries in the hold and to keep them with the traveler. A maximum number of batteries per traveler may be imposed by the transport company.

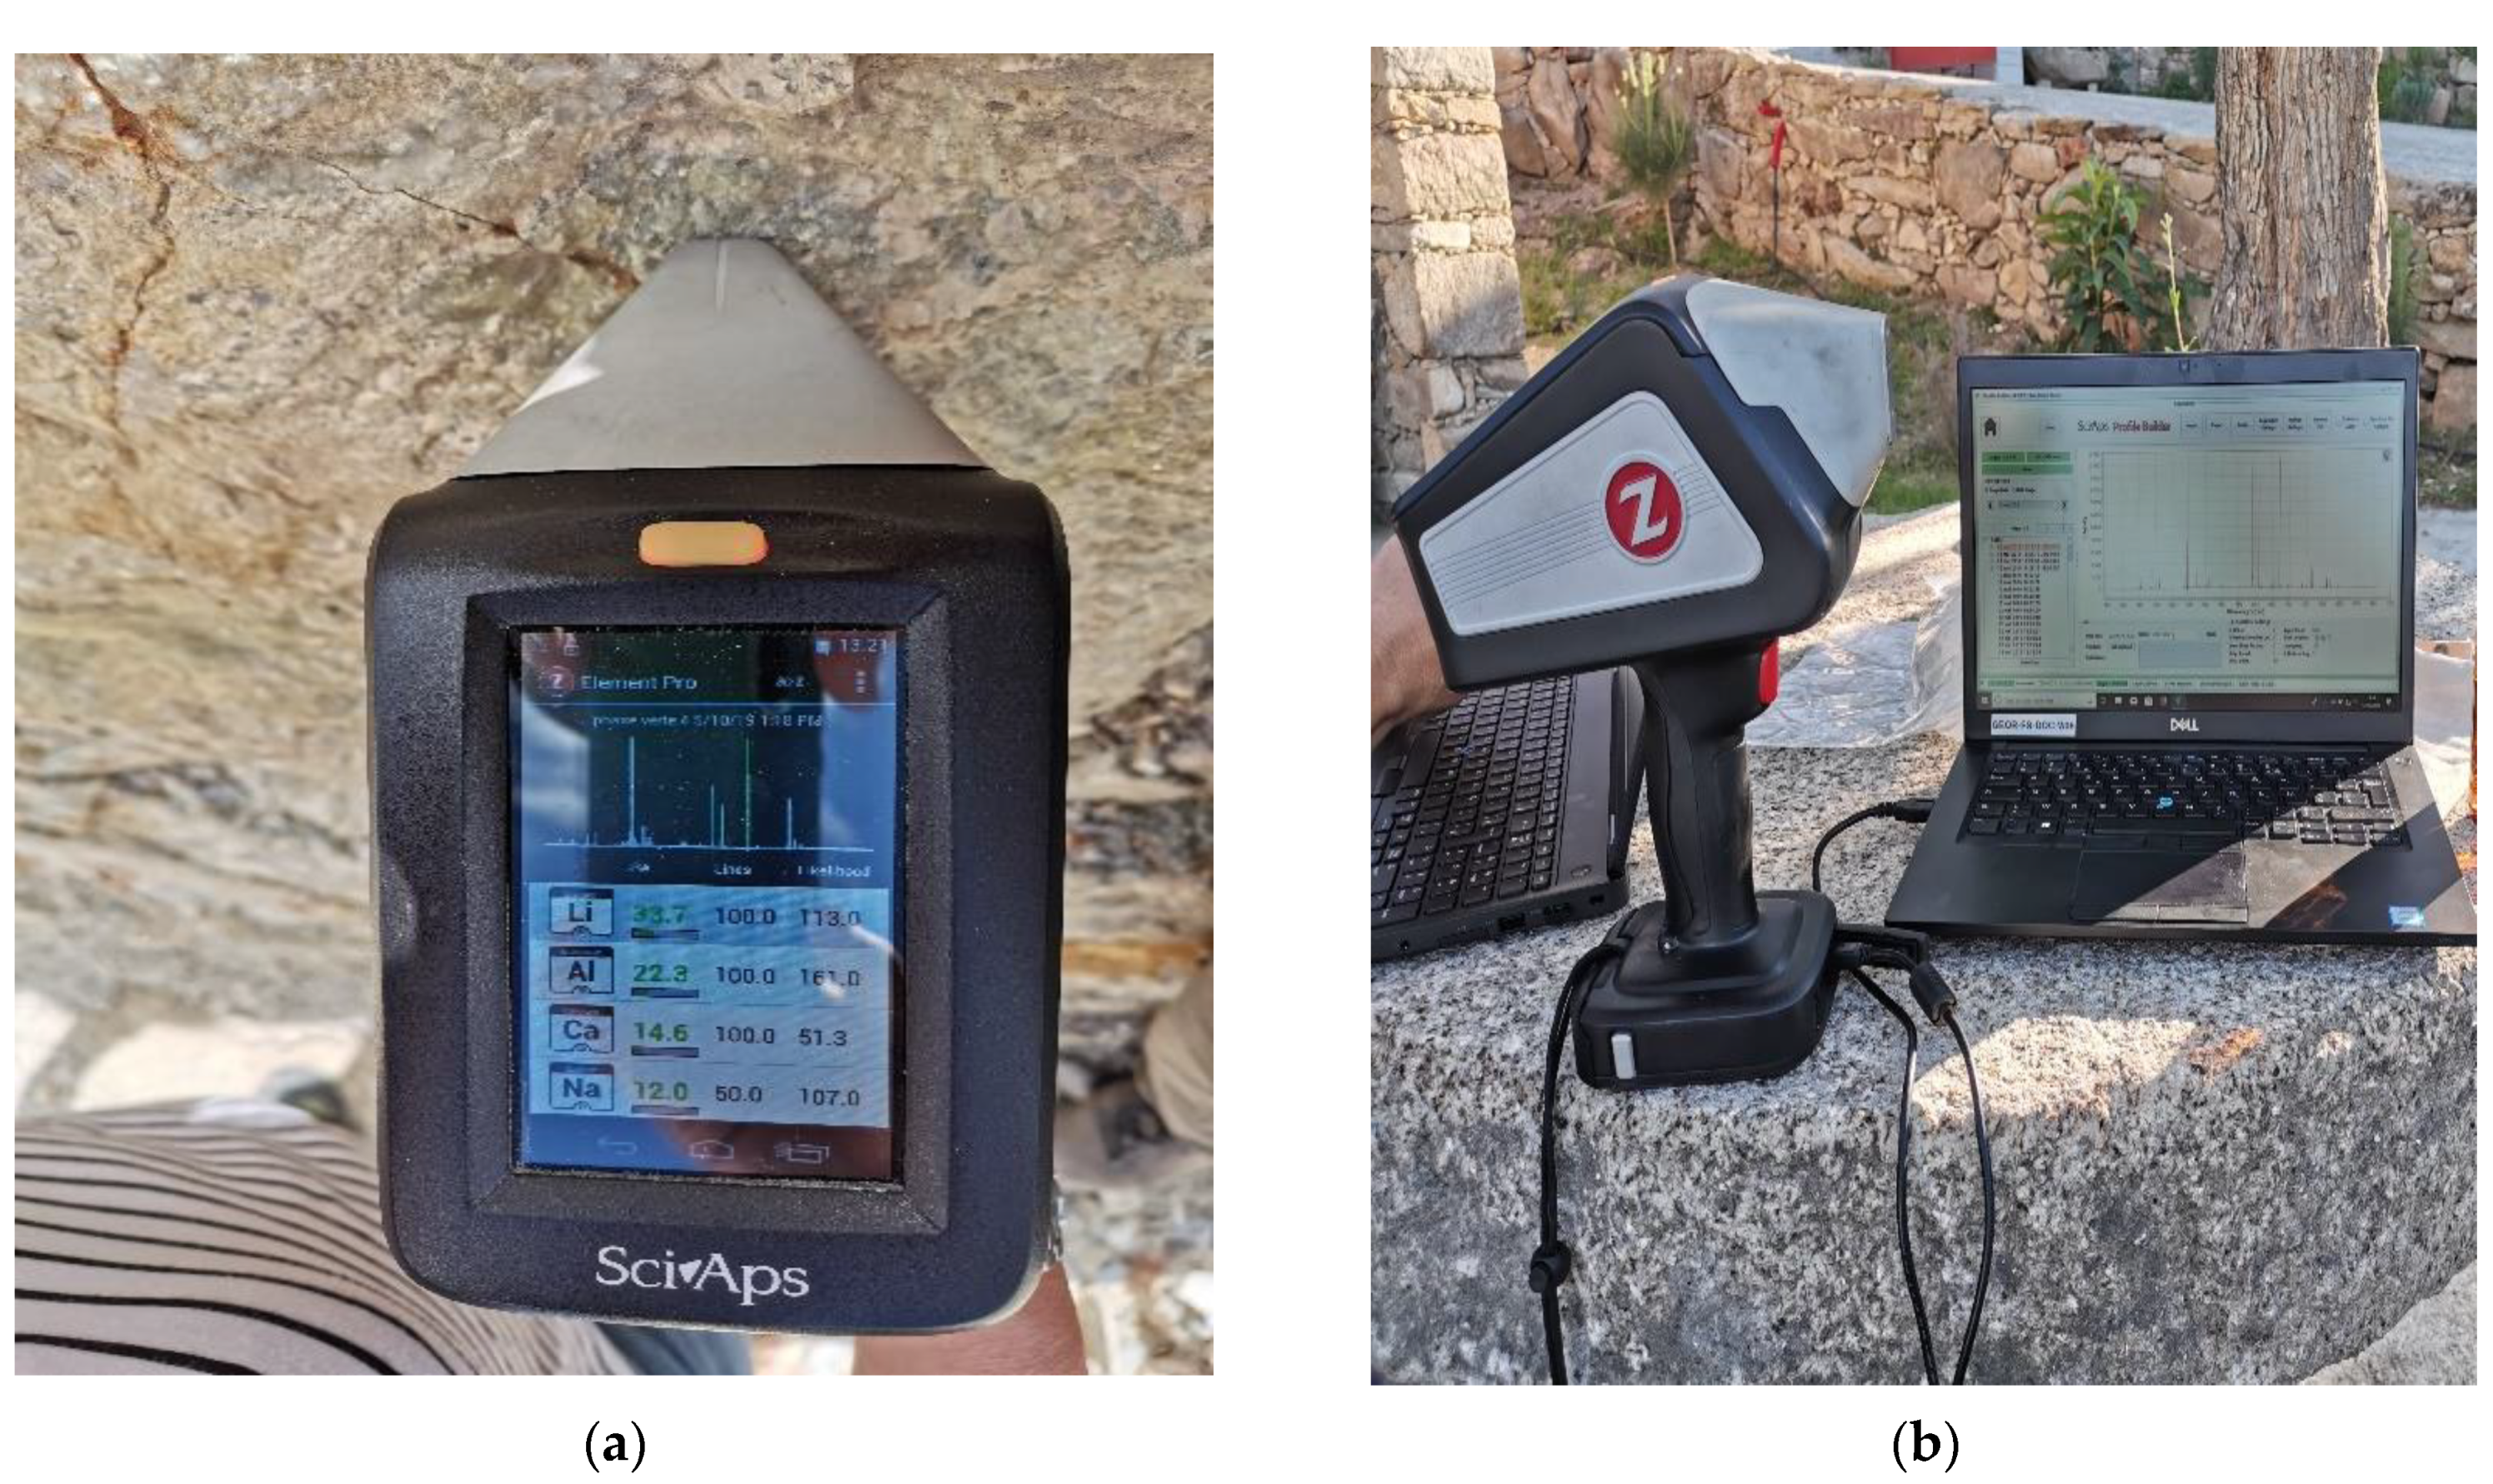
3.2. LIBS Spectra Acquisition (Z300 Instrument)

All LIBS spectra acquisitions were obtained using one unique handheld instrument (Z300 SciAps © instruments). Depending on the samples and the size of the minerals, the number of mean spectra values acquired can be from 3 to 5 different analyzed zones corresponding to 9 and 15 points, respectively. Thus, the most relevant information regarding acquisition is available in the LIBS_Database_file.csv file.

3.2.1. Laser Parameters and Ablation

When using the portable Z300 LIBS instrument, the parameters of the laser cannot be modified. For Z300 analyses, the characteristics for all the spectra were 5–6 mJ/pulse, 10 Hz repetition rate for the analysis and for the cleaning shot, and a 1064 nm pulsed Nd-YAG laser source. The use of laser ablation allows one to “clean” the first micrometers of the surface to avoid any dust contamination. Here, we used cleaning mode firing and made only one laser cleaning shot that was not recorded.

3.2.2. Wavelength Range of the Detectors

LIBS analysis does not require a prerequisite of the detected elements, and their detection only depends on the wavelength. Here, Z300 provides an extended spectrometer range from 190 to 950 nm, allowing for the detection of the major and trace elements present in the rocks such as F, N, O, Br, Cl, Rb, Cs, and S.

3.2.3. Number of Measurements

The Z300 tool provides an image of the sample through a camera to optimize the correct location of the sampled points. As repeating the measurement can improve the error bars, a 2D raster of 15 points can be used to obtain a kind of bulk content. Therefore, the laser is fired in discreet increments in two dimensions (X-Y) with a number of points/locations depending on the samples.
  • For Li minerals, which were reported as reference minerals and analyzed in GeoRessources laboratory of Université de Lorraine, the LIBS rasters were centered along a three points by five points rectangle with four laser shots at each point (with one laser cleaning shot to avoid any dust contamination). This grid was duplicated for each sample and 30 LIBS spectra were obtained to mimic a bulk composition. Then, the mean average LIBS spectra values were recorded and they corresponded to the database reported here (258 mean spectra). To ensure that we were on a non-altered mineral, the selected zones were based on the selection of the most color-homogenized zone observed on the entire sample (larger than 3 mm square). This protocol was also followed for the bulk analysis.
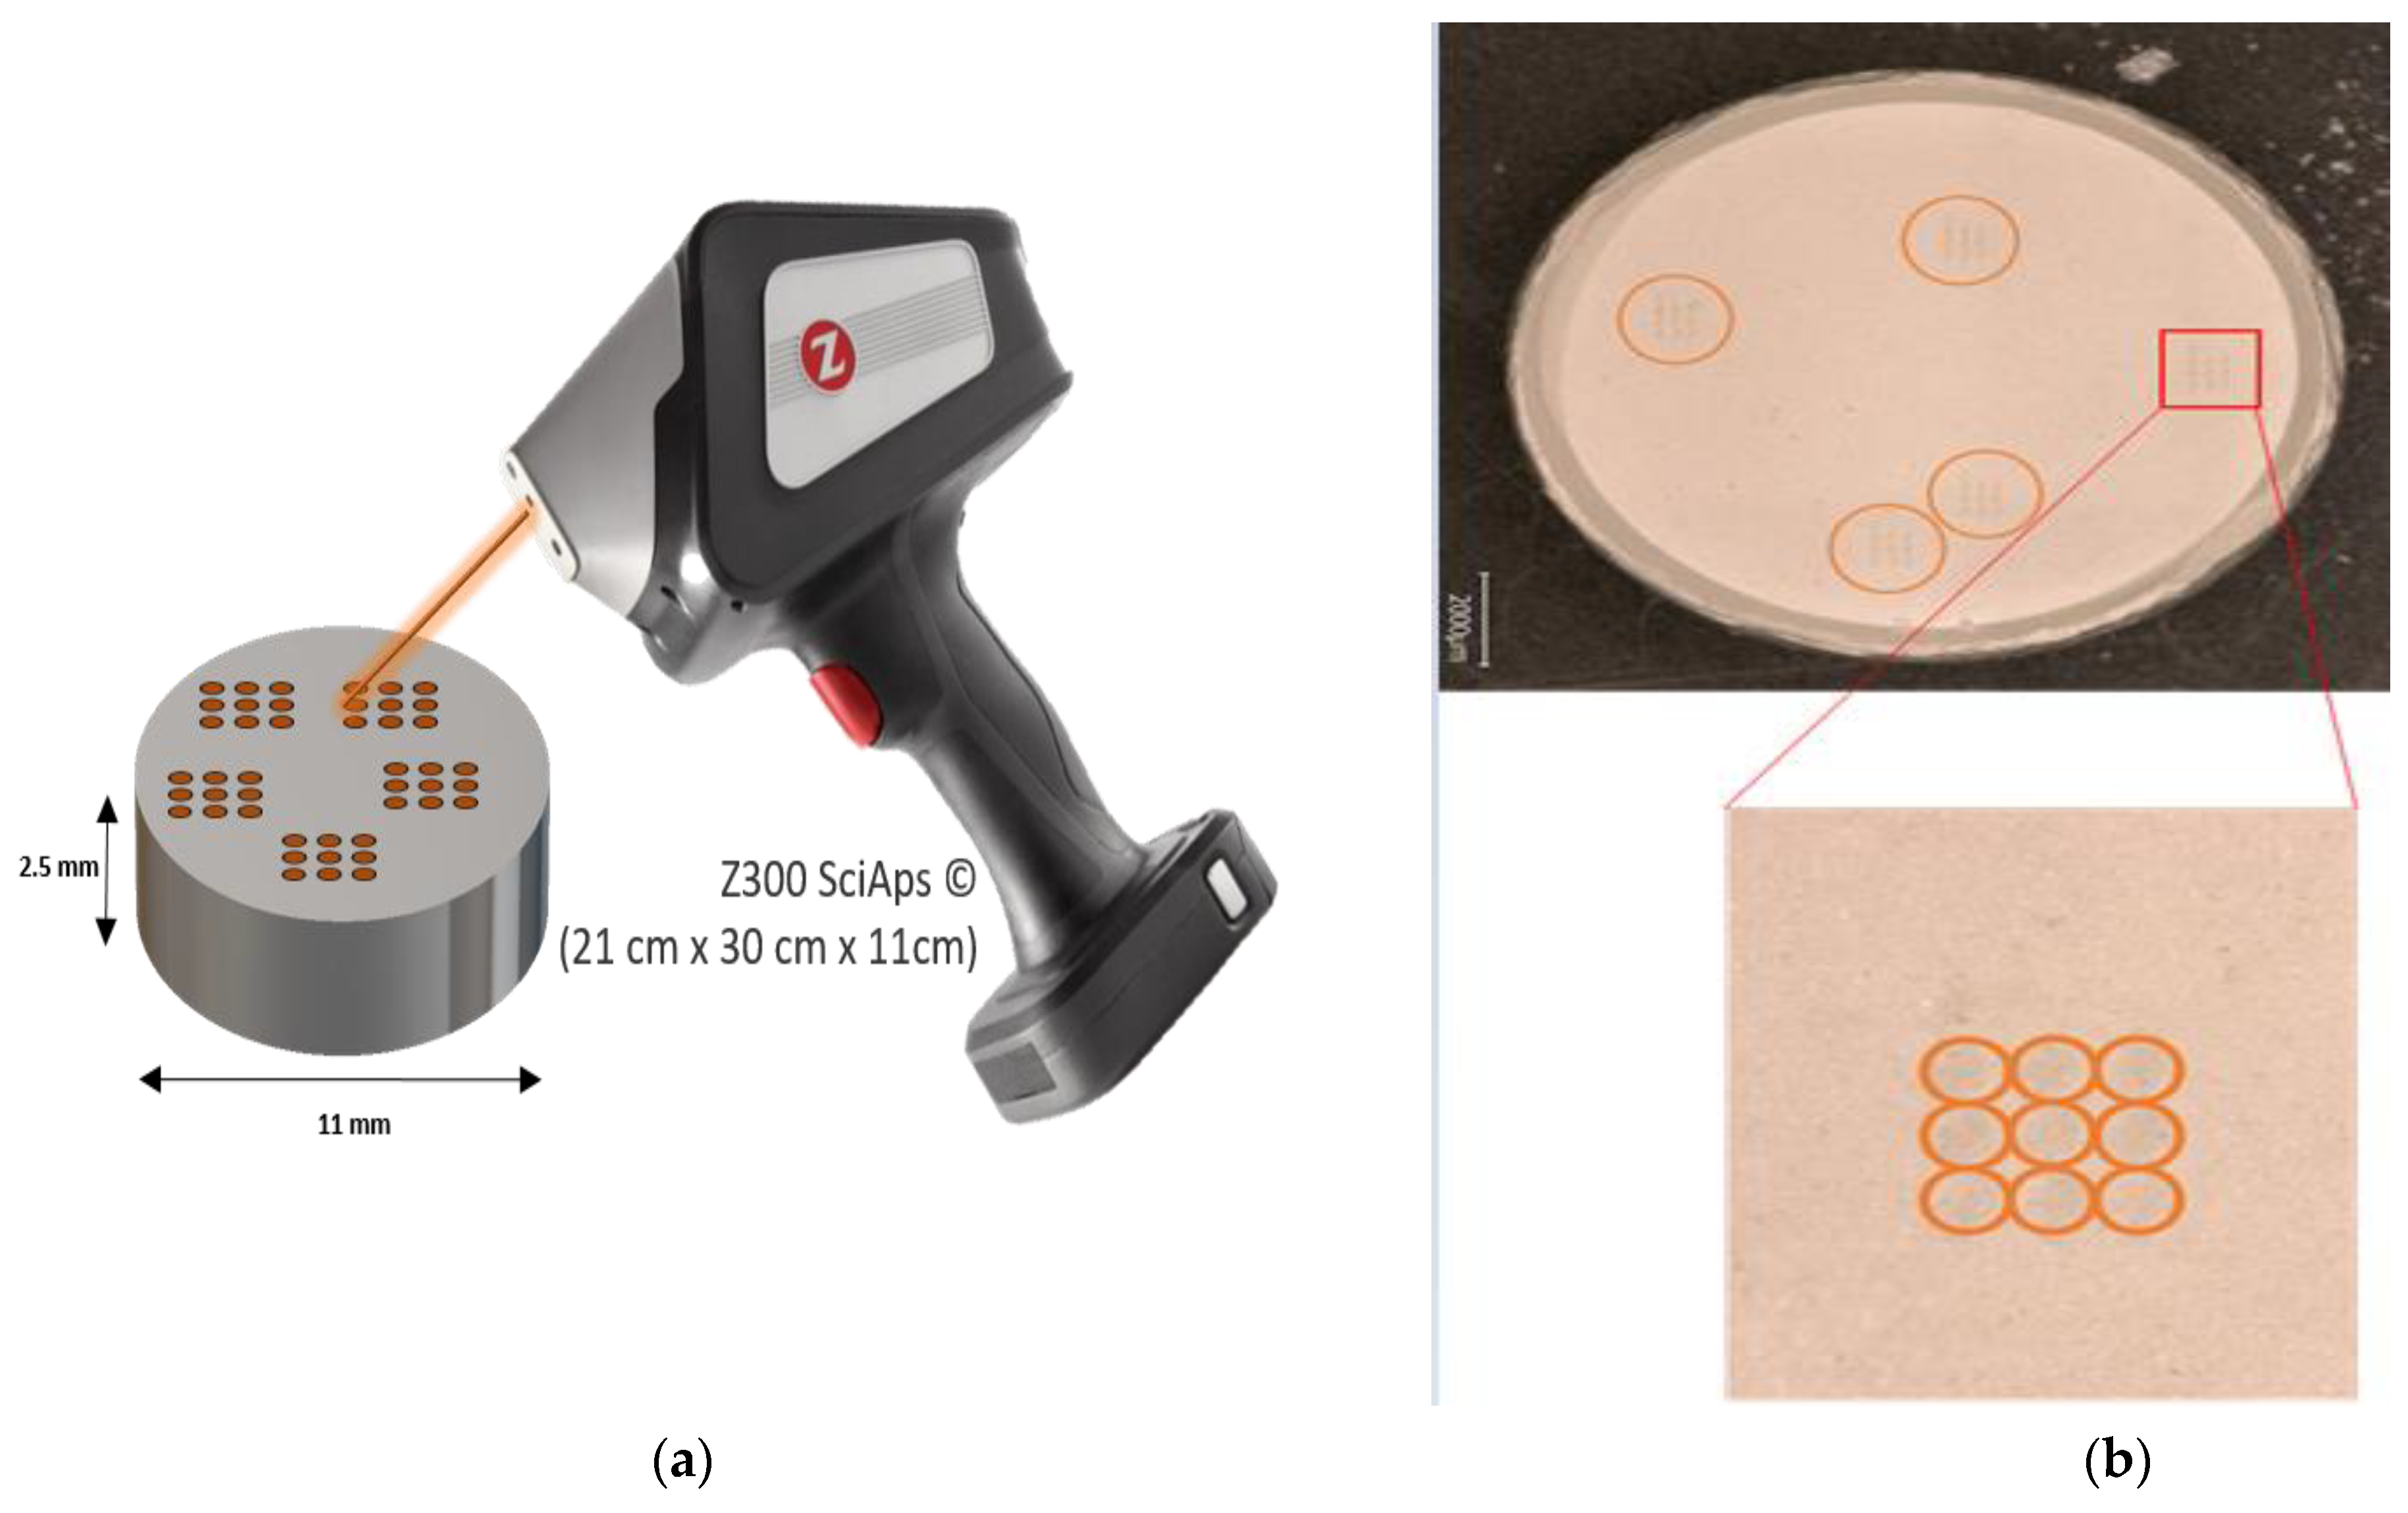
  • For powder pellets, which were realized at GeoRessources and analyzed there, the grid was three points by three points with five laser shots at each point (one cleaning laser shot). Five different random locations were studied and 45 LIBS spectra were recorded. For this data paper, each LIBS reference spectrum on each pellet corresponds to the mean LIBS of 45 spectra (Figure 2).

3.2.4. Atmosphere and Time Gating Measurement

All of the LIBS analyses were performed under ambient air added to a constant argon purge (13 mPsi), yielding enhancement in signal particularly for emissions in the deep UV (190 to 300 nm). Here, concerning the temporal conditions of the plasma analysis, the delay time was fixed as follows: the beginning of the acquisition of the LIBS emission was 400 ns and the acquisition time window was fixed to 1 ms. Then, in case of molecular recombination during the plasma emission (such as CaF or AlO), the large bands could be detected [31,61]. For the LIBS acquisition parameters, no file can be downloaded directly, but the information is available on the panel control of the Profile Builder interface.

3.3. LIBS Spectra Analysis

The reading and the interpretation of the LIBS spectra can be done using the Profile Builder for the recognition of the detected element emission lines. It is possible to explore the spectra and to normalize the spectra to the total area if necessary (in the case of a change in the ablated volume, point by point), and it is possible to obtain the net intensity under the peaks to provide a calibration curve directly using the Profile Builder software after defining standards. All the detected and non-detected elements can be downloaded in a .csv format if necessary. Various different software programs can be used to treat the spectra or to establish calibration curves [36,43]. In the following for example, we use SpectraGryph (http://spectroscopy.ninja, accessed on 1 May 2021).

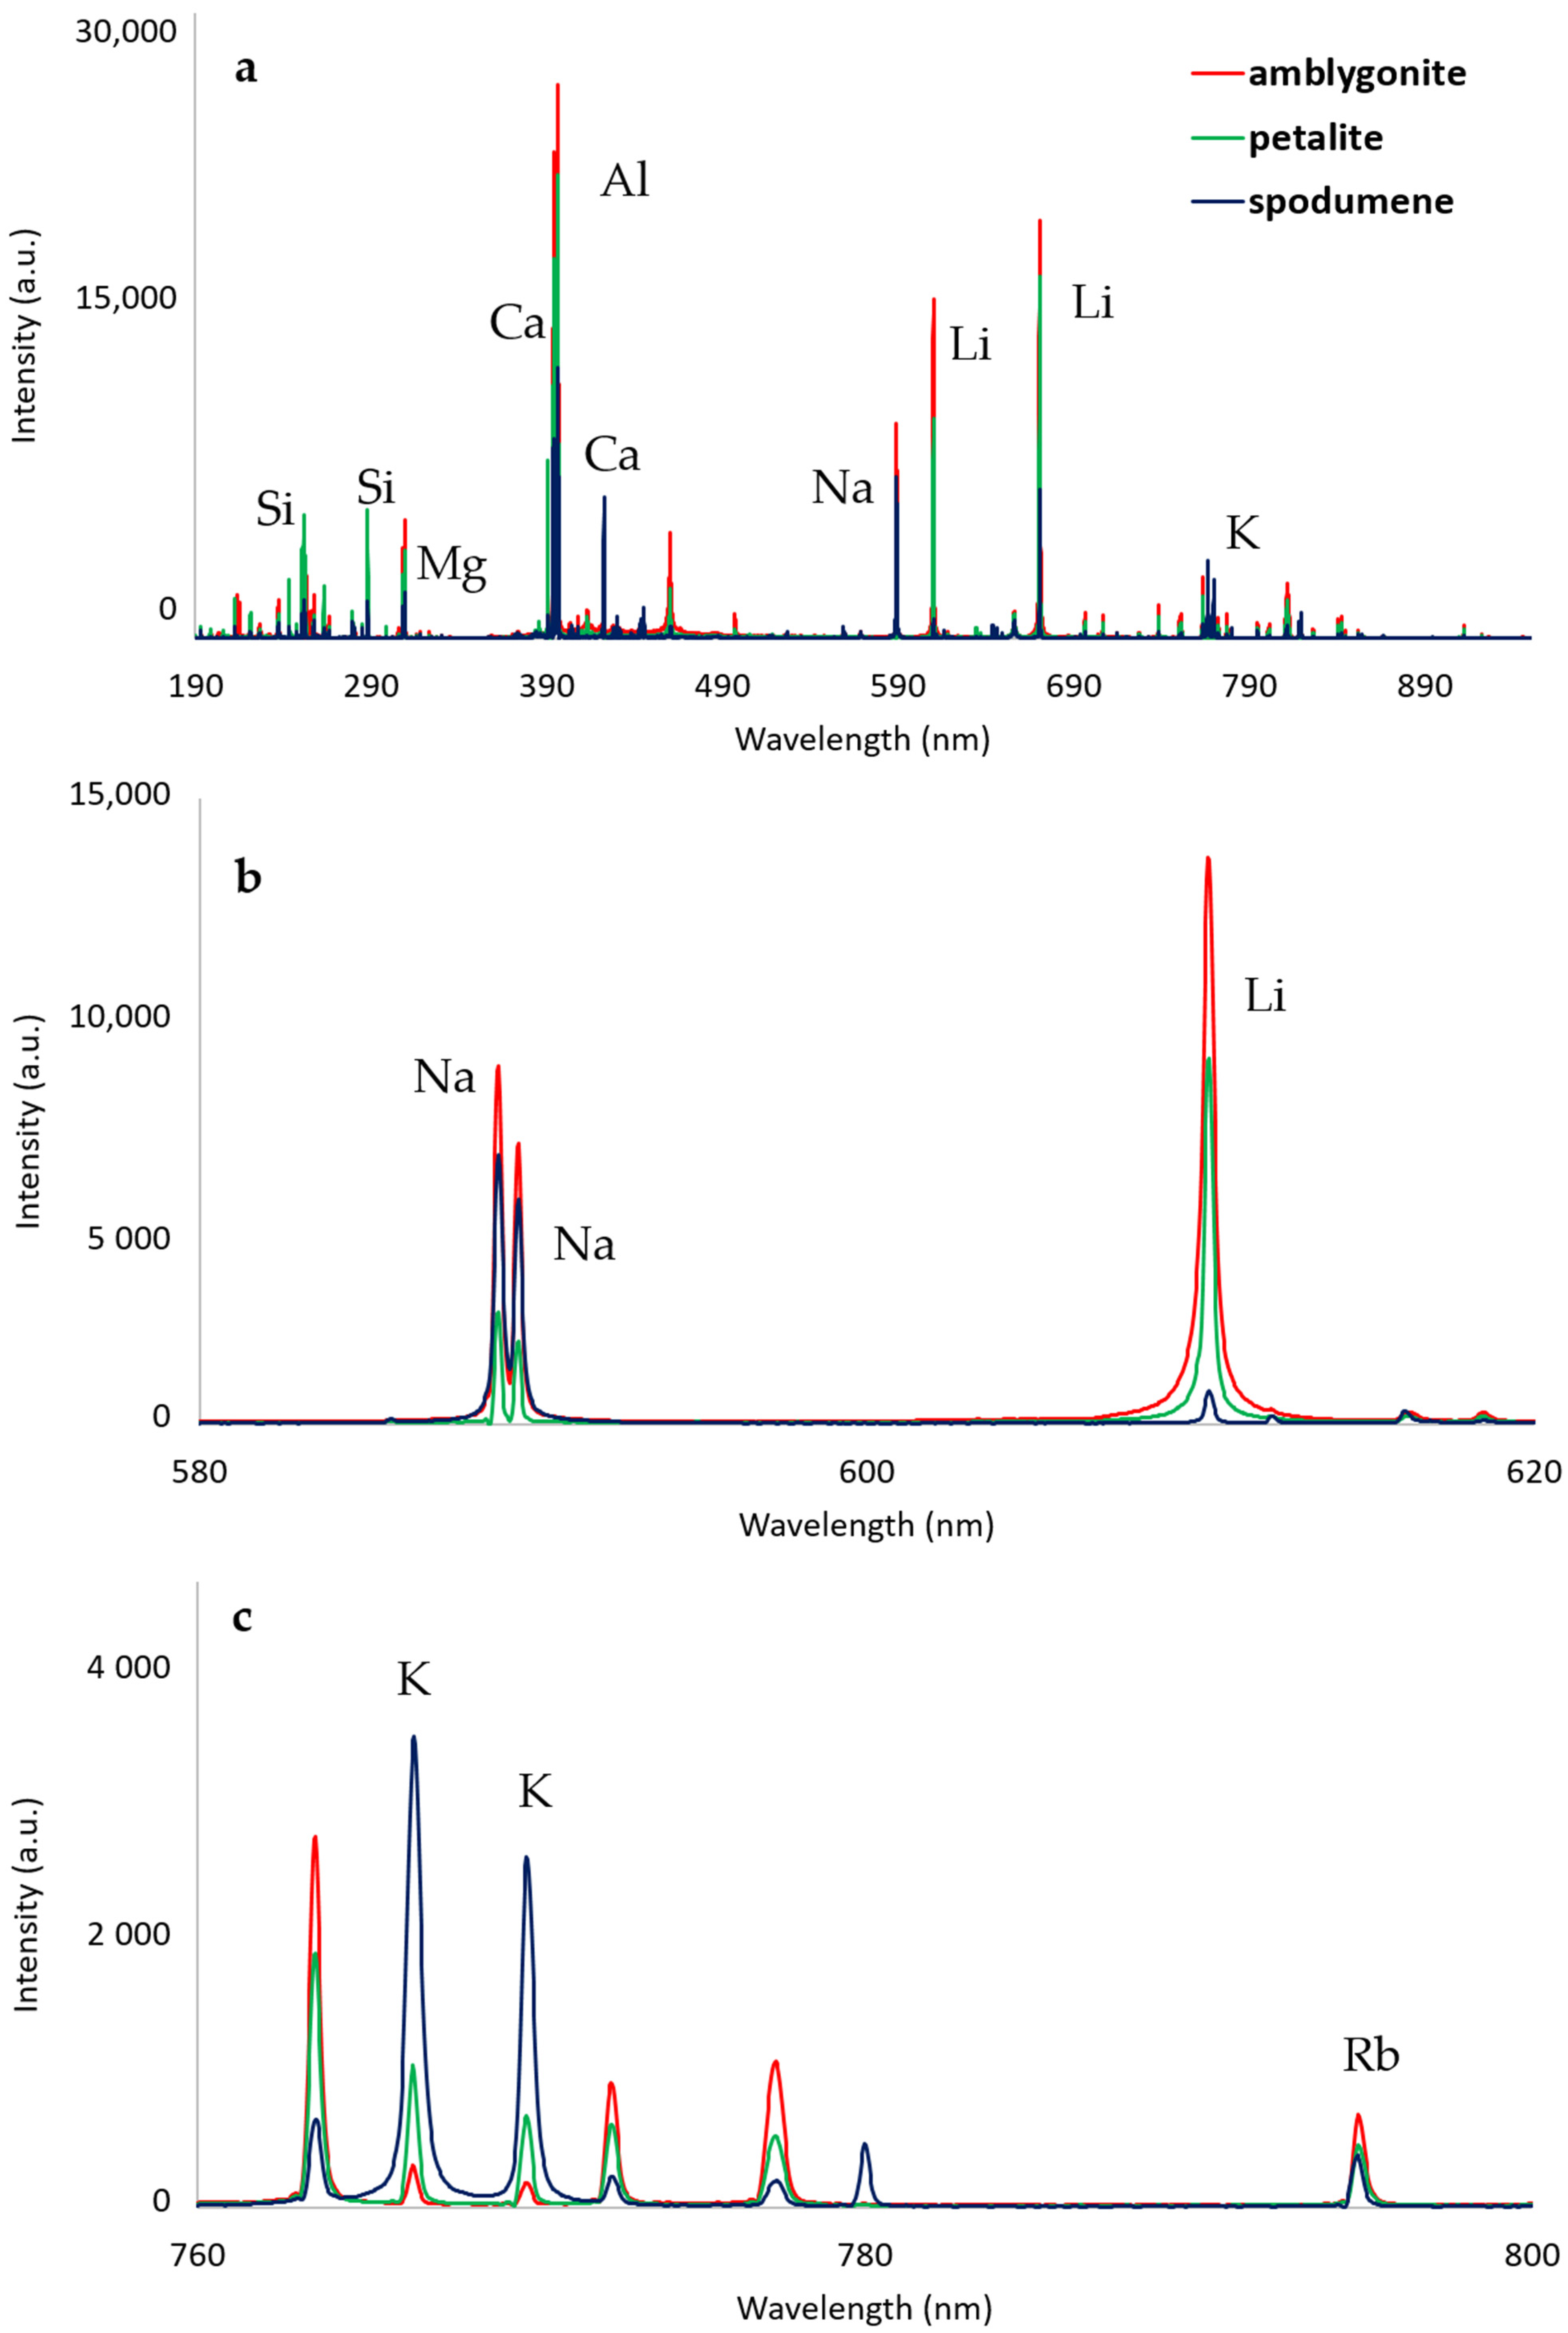
3.3.1. Detected Elements

The major elements detected by the handheld LIBS tool for all the minerals mainly corresponded to Al, Si, O, Mg, Ca, Li, Na, K, and Fe (Figure 3). Minor and trace elements depending on the mineral origins, such as Be, Sr, Ba, Cs, Sn, Cs, Ta, W, etc., were also identified in numerous LIBS spectra provided in this database. The main trace elements detected in these Li-rich materials are reported in the LIBS_database_file.csv. The reference emission lines can also be obtained online from various websites and, for example, from the NIST LIBS database (https://physics.nist.gov/PhysRefData/ASD/LIBS/libs-form.html, accessed on 1 May 2021).

3.3.2. Spectra Treatment

For the LIBS spectra treatment, a qualitative comparison between different samples can be performed by looking at the peak areas under the selected emission with an individual baseline. The relative standard deviations obtained for the Li emission lines were approximately 18% for the Li minerals and 13% for the pellets. These values can be linked to the heterogeneity of the rocks, to their granulometry regarding the beam size of the laser (approximately 50 µm), and to a possible change in the ablated volume point by point. Ratios between different emission lines can also be proposed for comparison. A careful selection of the emission spectra for such a treatment is necessary to avoid any overlapping of other emission lines or saturation of the detector. The use of the mean value obtained from various spectra is preferred in order to provide a bulk vision of the elements detected in the minerals. When bulk analysis is available or if the concentration of the element in the sample can be obtained, a calibration curve can be established to obtain the contents of unknown samples, associating each analyzed area with its element content [43]. Normalization of the LIBS spectra (for example, normalization to the entire spectra or using the standard normal variate (SNV) method) can also be performed if the matrices are very different from each other in terms of chemistry or hardness [17,40]. Multivariate techniques can also be applied to the LIBS spectra to classify the samples or to obtain calibration curves of the different elements [62,63,64].

Author Contributions

Conceptualization, C.F. and J.C.; methodology, C.F., N.E.O., and J.C.; validation, C.F. and N.E.O.; formal analysis, N.E.O., J.C.-F., and C.F.; investigation, C.F.; resources, A.L., M.P., F.K. (Friederike Kaestner), N.K., F.K. (Friederike Koerting), J.C.-F., R.L., T.M., D.B., and J.M.; data curation, C.F. and N.E.O.; writing—original draft preparation, C.F.; writing—review and editing, C.F., N.E.O., F.K. (Friederike Koerting), and J.C.-F.; visualization, C.F.; supervision, C.F. and J.C.; project administration, J.C.; funding acquisition, J.C.; F.D. contributed to the Resources of this paper. All authors have read and agreed to the published version of the manuscript.

Funding

This research was funded by the ERA-MIN/0001/2017–LIGHTS project. The work was also supported by Portuguese National Funds through the FCT– Fundação para a Ciência e a Tecnologia, I.P., project UIDB/04683/2020-ICT (Institute of Earth Sciences). Joana Cardoso-Fernandes and Filipa Dias are financially supported within the compass of their respective Ph.D. Theses, ref. SFRH/BD/136108/2018 and ref. 2020.05534.BD, by national funds from MCTES through FCT, and co-financed by the European Social Fund (ESF) through POCH–Programa Operacional Capital Humano–and NORTE 2020 regional program.

Institutional Review Board Statement

Not applicable.

Informed Consent Statement

Not applicable.

Data Availability Statement

All of the files mentioned on this study can be found in open access at the following address: https://0-doi-org.brum.beds.ac.uk/10.24396/ORDAR-65 (accessed on 21 June 2021).

Acknowledgments

We acknowledge Robert Linnen for his synthetized glasses and also Tania Martin and Marc Binnen for their mineral investigation. We thank the Suffel Collection, department of Ontario, for providing some of the Li-rich minerals. We acknowledge SciAps Company for technical support. Pierre-Yves Arnould is acknowledged for his technical support for ORDaR (OTELo Research Data Repository) website.

Conflicts of Interest

The authors declare no conflict of interest. The funders had no role in the design of the study; in the collection, analyses, or interpretation of data; in the writing of the manuscript, or in the decision to publish the results.

References

  1. Radziemski, L.J. From LASER to LIBS, the path of technology development. Spectrochim. Acta Part B At. Spectrosc. 2002, 57, 1109–1113. [Google Scholar] [CrossRef]
  2. Cremers, D.A.; Radziemski, L.J. History and fundamentals of LIBS. In Laser Induced Breakdown Spectroscopy: Fundamentals and Applications; Cambridge University Press: Cambridge, UK, 2006; pp. 9–16. [Google Scholar]
  3. Harmon, R.S.; De Lucia, F.C.; McManus, C.E.; McMillan, N.J.; Jenkins, T.F.; Walsh, M.E.; Miziolek, A. Laser-induced breakdown spectroscopy—An emerging chemical sensor technology for real-time field-portable, geochemical, mineralogical, and environmental applications. Appl. Geochem. 2006, 21, 730–747. [Google Scholar] [CrossRef]
  4. Alvey, D.C.; Morton, K.; Harmon, R.S.; Gottfried, J.L.; Remus, J.J.; Collins, L.M.; Wise, M.A. Laser-induced breakdown spectroscopy-based geochemical fingerprinting for the rapid analysis and discrimination of minerals: The example of garnet. Appl. Opt. 2010, 49, C168–C180. [Google Scholar] [CrossRef] [Green Version]
  5. Rossi, M.; Dell’Aglio, M.; De Giacomo, A.; Gaudiuso, R.; Senesi, G.S.; de Pascale, O.; Capitelli, F.; Nestola, F.; Ghiara, M.R. Multi-methodological investigation of kunzite, hiddenite, alexandrite, elbaite and topaz, based on laser-induced breakdown spectroscopy and conventional analytical techniques for supporting mineralogical characterization. Phys. Chem. Miner. 2013, 41, 127–140. [Google Scholar] [CrossRef]
  6. Díaz, D.; Hahn, D.W.; Molina, A. Quantification of gold and silver in minerals by laser-induced breakdown spectroscopy. Spectrochim. Acta Part B At. Spectrosc. 2017, 136, 106–115. [Google Scholar] [CrossRef]
  7. Castello, M.; Constantin, M.; Laflamme, M. Measurements of Gold in Ores by LIBS.; Quebec City, 23 August 2017. Available online: https://numerique.banq.qc.ca/patrimoine/details/52327/3081324 (accessed on 21 June 2021).
  8. Harhira, A.; Bouchard, P.; Rifai, K.; Haddad, J.E.; Sabsabi, M.; Blouin, A.; Laflamme, M. Advanced La-ser-Induced Breakdown Spectroscopy (LIBS) Sensor for Gold Mining. 2017. Available online: https://nrc-publications.canada.ca/eng/view/ft/?id=e302005a-66d5-4a1e-921d-d2cdb0ba0e77 (accessed on 1 April 2021).
  9. McMillan, N.J.; Curry, J.; Dutrow, B.L.; Henry, D.J. Identification of the Host Lithology of Tourmaline Using Laser-Induced Breakdown Spectroscopy for Application in Sediment Provenance and Mineral Exploration. Can. Miner. 2018, 56, 393–410. [Google Scholar] [CrossRef]
  10. Rifai, K.; Doucet, F.; Özcan, L.; Vidal, F. LIBS core imaging at kHz speed: Paving the way for real-time geochemical applications. Spectrochim. Acta Part B At. Spectrosc. 2018, 150, 43–48. [Google Scholar] [CrossRef]
  11. Fabre, C.; Devismes, D.; Moncayo, S.; Pelascini, F.; Trichard, F.; Lecomte, A.; Bousquet, B.; Cauzid, J.; Motto-Ros, V. Elemental imaging by laser-induced breakdown spectroscopy for the geological characterization of minerals. J. Anal. At. Spectrom. 2018, 33, 1345–1353. [Google Scholar] [CrossRef]
  12. Jolivet, L.; Leprince, M.; Moncayo, S.; Sorbier, L.; Lienemann, C.-P.; Motto-Ros, V. Review of the recent advances and applications of LIBS-based imaging. Spectrochim. Acta Part B At. Spectrosc. 2019, 151, 41–53. [Google Scholar] [CrossRef]
  13. Bi, Y.; Yan, M.; Dong, X.; Li, Z.; Zhang, Y.; Li, Y. Recognition of 25 natural geological samples using a modified correlation analysis method and laser-induced breakdown spectroscopic data. Optics 2018, 158, 1058–1062. [Google Scholar] [CrossRef]
  14. McManus, C.E.; Dowe, J.; McMillan, N.J. Quantagenetics® analysis of laser-induced breakdown spectroscopic data: Rapid and accurate authentication of materials. Spectrochim. Acta Part B At. Spectrosc. 2018, 145, 79–85. [Google Scholar] [CrossRef]
  15. Busser, B.; Moncayo, S.; Coll, J.-L.; Sancey, L.; Motto-Ros, V. Elemental imaging using laser-induced breakdown spectroscopy: A new and promising approach for biological and medical applications. Coord. Chem. Rev. 2018, 358, 70–79. [Google Scholar] [CrossRef]
  16. Akhmetzhanov, T.F.; Labutin, T.A.; Zaytsev, S.M.; Drozdova, A.N.; Popov, A.M. Determination of the Mn/Fe Ratio in Ferromanganese Nodules Using Calibration-Free Laser-Induced Breakdown Spectroscopy. Opt. Spectrosc. 2019, 126, 316–320. [Google Scholar] [CrossRef]
  17. Fabre, C. Advances in Laser-Induced Breakdown Spectroscopy analysis for geology: A critical review. Spectrochim. Acta Part B At. Spectrosc. 2020, 166, 105799. [Google Scholar] [CrossRef]
  18. Lawley, C.J.; Somers, A.M.; Kjarsgaard, B.A. Rapid geochemical imaging of rocks and minerals with handheld laser induced breakdown spectroscopy (LIBS). J. Geochem. Explor. 2021, 222, 106694. [Google Scholar] [CrossRef]
  19. Vasavada, A.R.; Grotzinger, J.P.; Arvidson, R.E.; Calef, F.J.; Crisp, J.; Gupta, S.; A Hurowitz, J.; Mangold, N.; Maurice, S.; E Schmidt, M.; et al. Overview of the Mars Science Laboratory mission: Bradbury Landing to Yellowknife Bay and beyond. J. Geophys. Res. Planets 2014, 119, 1134–1161. [Google Scholar] [CrossRef]
  20. Forni, O.; Gaft, M.; Toplis, M.J.; Clegg, S.M.; Maurice, S.; Wiens, R.C.; Mangold, N.; Gasnault, O.; Sautter, V.; Le Mouélic, S.; et al. First detection of fluorine on Mars: Implications for Gale Crater’s geochemistry. Geophys. Res. Lett. 2015, 42, 1020–1028. [Google Scholar] [CrossRef]
  21. Cousin, A.; Meslin, P.; Wiens, R.; Rapin, W.; Mangold, N.; Fabre, C.; Gasnault, O.; Forni, O.; Tokar, R.; Ollila, A.; et al. Compositions of coarse and fine particles in martian soils at gale: A window into the production of soils. Icarus 2015, 249, 22–42. [Google Scholar] [CrossRef]
  22. Payré, V.; Fabre, C.; Sautter, V.; Cousin, A.; Mangold, N.; Le Deit, L.; Forni, O.; Goetz, W.; Wiens, R.C.; Gasnault, O.; et al. Copper enrichments in the Kimberley formation in Gale crater, Mars: Evidence for a Cu deposit at the source. Icarus 2019, 321, 736–751. [Google Scholar] [CrossRef] [Green Version]
  23. Wiens, R.C.; Sylvestre, S.; the MSL Science Team Maurice; Reitz, G. DLR Collaborator (MSL Science Team) ChemCam: Chemostratigraphy by the First Mars Microprobe. Elements 2015, 11, 33–38. [Google Scholar] [CrossRef]
  24. Fabre, C.; Bousquet, B. De chemcam à supercam: L’apport de la LIBS pour le spatial. Photon 2020, 38–41. [Google Scholar] [CrossRef]
  25. Maurice, S.; Wiens, R.C.; Bernardi, P.; Caïs, P.; Robinson, S.; Nelson, T.; Gasnault, O.; Reess, J.-M.; Deleuze, M.; Rull, F.; et al. The SuperCam Instrument Suite on the Mars 2020 Rover: Science Objectives and Mast-Unit Description. Space Sci. Rev. 2021, 217, 47. [Google Scholar] [CrossRef]
  26. Wiens, R.C.; Maurice, S.; Robinson, S.H.; Nelson, A.E.; Cais, P.; Bernardi, P.; Newell, R.T.; Clegg, S.; Sharma, S.K.; Storms, S.; et al. The SuperCam Instrument Suite on the NASA Mars 2020 Rover: Body Unit and Combined System Tests. Space Sci. Rev. 2021, 217, 4. [Google Scholar] [CrossRef]
  27. Cuñat, J.; Palanco, S.; Carrasco, F.; Simón, M.D.; Laserna, J.J. Portable instrument and analytical method using laser-induced breakdown spectrometry for in situ characterization of speleothems in karstic caves. J. Anal. At. Spectrom. 2005, 20, 295–300. [Google Scholar] [CrossRef]
  28. Rakovský, J.; Čermák, P.; Musset, O.; Veis, P. A review of the development of portable laser induced breakdown spectroscopy and its applications. Spectrochim. Acta Part B At. Spectrosc. 2014, 101, 269–287. [Google Scholar] [CrossRef]
  29. Connors, B.; Somers, A.; Day, D. Application of Handheld Laser-Induced Breakdown Spectroscopy (LIBS) to Geochemical Analysis. Appl. Spectrosc. 2016, 70, 810–815. [Google Scholar] [CrossRef] [PubMed]
  30. Bennett, B.N.; Martin, M.Z.; Leonard, D.N.; Garlea, E. Calibration curves for commercial copper and aluminum alloys using handheld laser-induced breakdown spectroscopy. Appl. Phys. A 2018, 124, 42. [Google Scholar] [CrossRef]
  31. Foucaud, Y.; Fabre, C.; Demeusy, B.; Filippova, I.; Filippov, L. Optimisation of fast quantification of fluorine content using handheld laser induced breakdown spectroscopy. Spectrochim. Acta Part B At. Spectrosc. 2019, 158, 105628. [Google Scholar] [CrossRef]
  32. Harmon, R.S.; Lawley, C.J.; Watts, J.; Harraden, C.L.; Somers, A.M.; Hark, R.R. Laser-Induced Breakdown Spectroscopy—An Emerging Analytical Tool for Mineral Exploration. Minerals 2019, 9, 718. [Google Scholar] [CrossRef] [Green Version]
  33. Pochon, A.; Desaulty, A.-M.; Bailly, L. Handheld laser-induced breakdown spectroscopy (LIBS) as a fast and easy method to trace gold. J. Anal. At. Spectrom. 2020, 35, 254–264. [Google Scholar] [CrossRef]
  34. Senesi, G.S.; Harmon, R.S.; Hark, R.R. Field-portable and handheld laser-induced breakdown spectroscopy: Historical review, current status and future prospects. Spectrochim. Acta Part B At. Spectrosc. 2021, 175, 106013. [Google Scholar] [CrossRef]
  35. Colao, F.; Fantoni, R.; Lazić, V.; Spizzichino, V. Laser-induced breakdown spectroscopy for semi-quantitative and quantitative analyses of artworks—application on multi-layered ceramics and copper based alloys. Spectrochim. Acta Part B At. Spectrosc. 2002, 57, 1219–1234. [Google Scholar] [CrossRef]
  36. El Haddad, J.; Canioni, L.; Bousquet, B. Good practices in LIBS analysis: Review and advices. Spectrochim. Acta Part B At. Spectrosc. 2014, 101, 171–182. [Google Scholar] [CrossRef] [Green Version]
  37. Shi, Q.; Niu, G.; Lin, Q.; Xu, T.; Li, F.; Duan, Y. Quantitative analysis of sedimentary rocks using laser-induced breakdown spectroscopy: Comparison of support vector regression and partial least squares regression chemometric methods. J. Anal. At. Spectrom. 2015, 30, 2384–2393. [Google Scholar] [CrossRef]
  38. Ahmad, N.; Ahmed, R.; Umar, Z.A.; Liaqat, U.; Manzoor, U.; Baig, M.A. Qualitative and quantitative analyses of copper ores collected from Baluchistan, Pakistan using LIBS and LA-TOF-MS. Appl. Phys. A 2018, 124, 160. [Google Scholar] [CrossRef]
  39. Maaza, M.; Mothudi, B.M. Laser-Induced Breakdown Spectroscopy (LIBS) on Geological Samples: Compositional Differentiation and Relative Hardness Quantification. Master’s Thesis, University of South Africa, Pretoria, South Africa, 2018. [Google Scholar]
  40. Guezenoc, J.; Gallet-Budynek, A.; Bousquet, B. Critical review and advices on spectral-based normalization methods for LIBS quantitative analysis. Spectrochim. Acta Part B At. Spectrosc. 2019, 160, 105688. [Google Scholar] [CrossRef]
  41. Sobron, P. Non-Linear Methods for Quantitative Elemental Analysis and Mineral Classification Using Laser-Induced Breakdown Spectroscopy (LIBS) 2019. Available online: https://patents.google.com/patent/US20190079019A1/en (accessed on 21 June 2021).
  42. Syvilay, D.; Guezenoc, J.; Bousquet, B. Guideline for increasing the analysis quality in laser-induced breakdown spectroscopy. Spectrochim. Acta Part B At. Spectrosc. 2019, 161, 105696. [Google Scholar] [CrossRef]
  43. Duponchel, L.; Bousquet, B.; Pelascini, F.; Motto-Ros, V. Should we prefer inverse models in quantitative LIBS analysis? J. Anal. At. Spectrom. 2020, 35, 794–803. [Google Scholar] [CrossRef]
  44. Rifai, K.; Paradis, M.-C.M.; Swierczek, Z.; Doucet, F.; Özcan, L.; Fayad, A.; Li, J.; Vidal, F. Emergences of New Technology for Ultrafast Automated Mineral Phase Identification and Quantitative Analysis Using the CORIOSITY Laser-Induced Breakdown Spectroscopy (LIBS) System. Minerals 2020, 10, 918. [Google Scholar] [CrossRef]
  45. Rifai, K.; Özcan, L.-Ç.; Doucet, F.R.; Rhoderick, K.; Vidal, F. Ultrafast Elemental Mapping of Platinum Group Elements and Mineral Identification in Platinum-Palladium Ore Using Laser Induced Breakdown Spectroscopy. Minerals 2020, 10, 207. [Google Scholar] [CrossRef] [Green Version]
  46. Cardoso-Fernandes, J.; Silva, J.; Dias, F.; Lima, A.; Teodoro, A.; Barrès, O.; Cauzid, J.; Perrotta, M.; Roda-Robles, E.; Ribeiro, M. Tools for Remote Exploration: A Lithium (Li) Dedicated Spectral Library of the Fregeneda–Almendra Aplite–Pegmatite Field. Data 2021, 6, 33. [Google Scholar] [CrossRef]
  47. Andrade, J.M.; Cristoforetti, G.; Legnaioli, S.; Lorenzetti, G.; Palleschi, V.; Shaltout, A. Classical univariate calibration and partial least squares for quantitative analysis of brass samples by laser-induced breakdown spectroscopy. Spectrochim. Acta Part B At. Spectrosc. 2010, 65, 658–663. [Google Scholar] [CrossRef]
  48. Wiens, R.; Maurice, S.; Lasue, J.; Forni, O.; Anderson, R.; Clegg, S.; Bender, S.; Blaney, D.; Barraclough, B.; Cousin, A.; et al. Pre-flight calibration and initial data processing for the ChemCam laser-induced breakdown spectroscopy instrument on the Mars Science Laboratory rover. Spectrochim. Acta Part B At. Spectrosc. 2013, 82, 1–27. [Google Scholar] [CrossRef]
  49. Fabre, C.; Cousin, A.; Wiens, R.; Ollila, A.; Gasnault, O.; Maurice, S.; Sautter, V.; Forni, O.; Lasue, J.; Tokar, R.; et al. In situ calibration using univariate analyses based on the onboard ChemCam targets: First prediction of Martian rock and soil compositions. Spectrochim. Acta Part B At. Spectrosc. 2014, 99, 34–51. [Google Scholar] [CrossRef]
  50. Payré, V.; Fabre, C.; Cousin, A.; Sautter, V.; Wiens, R.C.; Forni, O.; Gasnault, O.; Mangold, N.; Meslin, P.-Y.; Lasue, J.; et al. Alkali trace elements in Gale crater, Mars, with ChemCam: Calibration update and geological implications. J. Geophys. Res. Planets 2017, 122, 650–679. [Google Scholar] [CrossRef]
  51. Guezenoc, J.; Payré, V.; Fabre, C.; Syvilay, D.; Cousin, A.; Gallet-Budynek, A.; Bousquet, B. Variable selection in laser-induced breakdown spectroscopy assisted by multivariate analysis: An alternative to multi-peak fitting. Spectrochim. Acta Part B At. Spectrosc. 2019, 152, 6–13. [Google Scholar] [CrossRef]
  52. Gamela, R.R.; Costa, V.C.; Babos, D.V.; Araújo, A.S.; Pereira-Filho, E.R. Direct Determination of Ca, K, and Mg in Cocoa Beans by Laser-Induced Breakdown Spectroscopy (LIBS): Evaluation of Three Univariate Calibration Strategies for Matrix Matching. Food Anal. Methods 2020, 13, 1017–1026. [Google Scholar] [CrossRef]
  53. Grew, E.S. The Minerals of Lithium. Elements 2020, 16, 235–240. [Google Scholar] [CrossRef]
  54. Cardoso-Fernandes, J.; Silva, J.; Lima, A.; Teodoro, A.C.; Perrotta, M.; Cauzid, J.; Roda-Robles, E.; Ribeiro, M.A. Reflectance Spectroscopy to Validate Remote Sensing Data/Algorithms for Satellite-Based Lithium (Li) Exploration (Central East Portugal). In Proceedings of the Earth Resources and Environmental Remote Sensing/GIS Applications XI, Online Conference, 20 September 2020; Schulz, K., Nikolakopoulos, K.G., Michel, U., Eds.; SPIE: Bellingham, WA, USA, 2020; p. 19. [Google Scholar]
  55. Cardoso-Fernandes, J.; Silva, J.; Lima, A.; Teodoro, A.C.; Perrotta, M.; Cauzid, J.; Roda-Robles, E. Characterization of Lithium (Li) Minerals from the Fregeneda-Almendra Region through Laboratory Spectral Measurements: A Comparative Study. In Proceedings of the Earth Resources and Environmental Remote Sensing/GIS Applications XI, Online Conference, 20 September 2020; Schulz, K., Nikolakopoulos, K.G., Michel, U., Eds.; SPIE: Bellingham, WA, USA, 2020; p. 20. [Google Scholar]
  56. Cousin, A.; Sautter, V.; Fabre, C.; Maurice, S.; Wiens, R.C. Textural and modal analyses of picritic basalts with ChemCam Laser-Induced Breakdown Spectroscopy. J. Geophys. Res. Space Phys. 2012, 117, 117. [Google Scholar] [CrossRef] [Green Version]
  57. Sweetapple, M.T.; Tassios, S. Laser-induced breakdown spectroscopy (LIBS) as a tool for in situ mapping and textural interpretation of lithium in pegmatite minerals. Am. Miner. 2015, 100, 2141–2151. [Google Scholar] [CrossRef]
  58. Linnen, R.L.; Van Lichtervelde, M.; Černý, P. Granitic Pegmatites as Sources of Strategic Metals. Elements 2012, 8, 275–280. [Google Scholar] [CrossRef]
  59. Popov, A.M.; Zaytsev, S.M.; Seliverstova, I.V.; Zakuskin, A.; Labutin, T.A. Matrix effects on laser-induced plasma parameters for soils and ores. Spectrochim. Acta Part B At. Spectrosc. 2018, 148, 205–210. [Google Scholar] [CrossRef]
  60. Maurice, S.; Wiens, R.C.; Saccoccio, M.; Barraclough, B.; Gasnault, O.; Forni, O.; Mangold, N.; Baratoux, D.; Bender, S.; Berger, G.; et al. The ChemCam Instrument Suite on the Mars Science Laboratory (MSL) Rover: Science Objectives and Mast Unit Descriptn. Space Sci. Rev. 2012, 170, 95–166. [Google Scholar] [CrossRef]
  61. Quarles, C.D.; Gonzalez, J.J.; East, L.J.; Yoo, J.H.; Morey, M.S.; Russo, R.E. Fluorine analysis using Laser Induced Breakdown Spectroscopy (LIBS). J. Anal. At. Spectrom. 2014, 29, 1238–1242. [Google Scholar] [CrossRef]
  62. McMillan, N.J.; Rees, S.; Kochelek, K.; E McManus, C. Geological Applications of Laser-Induced Breakdown Spectroscopy. Geostand. Geoanal. Res. 2014, 38, 329–343. [Google Scholar] [CrossRef]
  63. Kochelek, K.A.; McMillan, N.J.; McManus, C.E.; Daniel, D.L. Provenance determination of sapphires and rubies using laser-induced breakdown spectroscopy and multivariate analysis. Am. Miner. 2015, 100, 1921–1931. [Google Scholar] [CrossRef]
  64. Farnsworth-Pinkerton, S.; McMillan, N.J.; Dutrow, B.L.; Henry, D.J. Provenance of detrital tourmalines from Proterozoic metasedimentary rocks in the Picuris Mountains, New Mexico, using Laser-Induced Breakdown Spectroscopy. J. Geosci. 2018, 63, 193–198. [Google Scholar] [CrossRef]
Figure 1. (a) Full portable LIBS operating on a pegmatite outcrop; some of the detected elements and the LIBS spectra can be seen on the screen; (b) transfer of the data from the Z300 to the laptop using the Profile Builder interface.
Data 06 00068 g001
Figure 2. (a) Schematic representation of the analytical protocol for the LIBS analysis on powder pellets, with the five different random zones, nine points for each; (b) images of powder pellets with random areas of analysis; the nine craters can be seen as a square, and the crater size is around 100 µm due to the smoothness of the material.
Data 06 00068 g002
Figure 3. LIBS spectra obtained from different Li-rich minerals: amblygonite (4371-ambly-PF-M-0031-A2_2_20191), petalite (4183-peta-LB-R-0013-A_3_2019112), and spodumene (Boa-RS-Spo-M_20190417_043329_PM). (a) Spectra in the entire wavelength range; (b) zoomed image of the Na doublet and Li emission lines; (c) zoomed image of the K and Rb emissions lines from the VNIR. The major element emission lines are shown on the spectra; the LIBS spectra are not normalized.
Data 06 00068 g003
Table 1. Description of the samples with their providers, their geological origin if known, and matrix. More information is available in the LIBS_database_file (.csv) (see data reference).
PartnersSamplesMinerals
Université de Lorraine, FranceRocks, minerals, glasses, pelletsLepidolite, spodumene, Kunzite, petalite, hindenite
University of Western Ontario and MGS, CanadaRocks, thin sections, glassLepidolite, spodumene, petalite
Geological Service of Brazil, BrazilRocksSpodumene, amblygonite
GFZ, Germany PowdersLi-rich pegmatite
Publisher’s Note: MDPI stays neutral with regard to jurisdictional claims in published maps and institutional affiliations.

