
Geodatabase of Publicly Available Information about Czech Municipalities’ Local Administration


1
Department of Geoinformatics, Palacký University Olomouc, 771 46 Olomouc, Czech Republic
2
Department of Development and Environmental Studies, Palacký University Olomouc, 771 46 Olomouc, Czech Republic
*
Author to whom correspondence should be addressed.
Data 2021, 6(8), 89; https://0-doi-org.brum.beds.ac.uk/10.3390/data6080089
Submission received: 16 July 2021
/
Revised: 3 August 2021
/
Accepted: 6 August 2021
/
Published: 10 August 2021
(This article belongs to the Section Spatial Data Science and Digital Earth)
Abstract
:In this data description, we introduce a unique (geo)dataset with publicly available information about the municipalities focused on (geo)participatory aspects of local administration. The dataset comprises 6258 Czech municipalities linked with their respective administrative boundaries. In total, 55 attributes were prepared for each municipality. We also describe the process of data collection, processing, verification, and publication as open data. The uniqueness of the dataset is that such a complex dataset regarding geographical coverage with a high level of detail (municipalities) has never been collected in Czechia before. Besides, it could be applied in various research agendas in public participation and local administration and used thematically using selected indicators from various participation domains. The dataset is available freely in the Esri geodatabase, geospatial services using API (REST, GeoJSON), and other common non-spatial formats (MS Excel and CSV).
Dataset: Dataset is available at https://gislib.upol.cz/portal/apps/sites/#/opendata/items/5ffeb36cdde8476bb46da1ff2f0b5cd5 or https://tinyurl.com/geoparticipation.
Dataset License: Attribution-ShareAlike 4.0 International (CC BY-SA 4.0).
1. Introduction
The major notion for collecting publicly available information in the form of a geographical database arose from the need of our project to deal with (geo)participatory spatial tools utilized in the decision-making processes of local administrations. The project aims to identify and spatially analyze the key factors affecting the successful implementation of public participation processes in participatory planning.
Various participatory/community mapping methods have gained popularity, especially after developing the Local Agenda 21 Planning Guide created during the United Nations Rio Conference on the Environment in 1992, where it was identified as a best practice for locally-based sustainability planning [1]. Nevertheless, the question of whether digital participation enables a move beyond informing or consulting citizens as part of the planning process has not fully been answered yet [2]. More evidence is therefore needed to assess the actual value of digital participatory platforms in urban planning, including web-based geoparticipation [3,4,5], especially with the links to the UN Sustainable Development Goals (SDGs) agenda and specifically the Indicator 11.3.2: “Proportion of cities with a direct participation structure of civil society in urban planning and management that operate regularly and democratically”.
Following the lack of data about geoparticipation on the municipal level and research gap in geoparticipation research in Central and Eastern Europe, we have created a vast geodatabase (n = 6258) about Czech municipalities’ local administration and their usage of geoparticipatory tools.
By collecting such a dataset, we can answer spatial questions concerning the whole country, such as:
- “What is the spatial distribution of given indicator”?
- “Do the municipalities with similar indicators tend to cluster or not”?
- Or “Is there a relationship between municipalities’ size and a certain level of (geo)participation”?
The questions above could not be answered using any of the existing data about participatory processes or e-governance at the local administration level in Czechia. In this data description, we do not intend to answer such questions (this is done in other research, e.g., [6]), but to introduce the unique dataset we collected. On the international level, two global indices are measuring the level of participation or e-government. The first, E-Government Development Index (EGDI), measures three aggregate indices [7] of e-government: (1) provision of online services (e.g., online availability of authorities); (2) telecommunication connectivity (e.g., number of internet users); and (3) human capacity (e.g., literacy rate) [8]. The second, E-Participation index, similarly to EGDI, focuses on three composite domains: (1) E-information sharing, (2) E-consultation, and (3) E-decision-making [9]. Both indices monitor all United Nations member states at a country level. Focusing on Europe, the European Participation Index (EPI) made for cross-national comparison of workers participation includes board-level, establishment-level, and collective bargaining participation [10,11]. The EPI is not an index dealing with public participation but rather exploring the relationship between employees and employers. The Better Life Index—created by the Organisation for Economic Co-operation and Development (OECD) and covering most of Europe—includes the Civic Engagement indicator, among others, which takes voter turnout and stakeholder engagement for developing regulations as two main measures since these are relatively easily available for all OECD member countries [12]. Eurostat as a main statistical body for the European Union provides only a few partial statistics connected to public participation (e.g., formal and informal voluntary activities, communication via social media, or active citizenship). These are mainly collected within European Union Statistics on Income and Living Conditions (EU-SILC) surveys. Probably the most important relevant indicator is active citizenship, defined as “participation in activities related to political groups, associations or parties, including attending any of their meetings or signing a petition” [13]. However, there is not a comprehensive statistics or index about public participation produced by Eurostat. Narrowing down the geographical scope, public participation at local administration level in Czechia was measured in 2016 using the comprehensive Participation index developed by the former D21 initiative (now renamed to Institute H21, and now running the Participation21 project). The Participation index was composed of 21 indicators grouped into six categories—transparency, communication, involvement/engagement, inclusion, implementation, and evaluation. However, it evaluated only 101 municipalities and city districts with more than 10,000 inhabitants. One of the most important public bodies in the field of participation in Czechia is represented by the association of Healthy Cities of the Czech Republic, comprising 131 members with regional influence on more than 2400 municipalities. The association actively uses and promotes a Pocitovemapy.cz platform (“emotional maps” in English), through which citizens can express their opinion on various topics (e.g., urban planning, development, and site improvements).
Nevertheless, there exists an endless dilemma in geographical research giving us two options. First, if we want to cover large areas by means of data, we usually exploit databases from official data sources, typically statistical offices. However, available indicators are either generic or not available at a finer administrative scale (e.g., municipal level, LAU 2). Second, desired detailed indicators are available, but covering only a small portion of the study area and/or collected as a sample survey, which might not be representative enough for each administrative unit in a country. Acquisition of spatially and thematically detailed data covering large areas—i.e., combining both options mentioned above—would impose highly cost- and time-demanding data collection.
Therefore, as there is no comprehensive and compact dataset dealing with participatory processes or e-governance at the local administration level (LAU 2) in Czechia, we filled the gap by collecting and creating a dataset from publicly available sources using crowdsourcing. We collected a considerable number of indicators about the local administration processes, communication means with local citizens, the openness of (geo)data, and other domains for each municipality (LAU 2) in Czechia. With the help of crowdsourcing, we prepared 55 attributes for 6258 municipalities in Czechia. The attributes are decomposed from the former 24 questions (see Table 1) to form unique records for better manipulation in GIS and consequent analysis and visualization. Moreover, the dataset presented here was enriched by the authors’ calculation of the Index of Participation with its partial dimensions (see details in [6]). The added value of the dataset does not lie in the novel use of methods of public surveying or data mining—instead, we used an intuitive and simple online tool for data collection—but in the final open-source database helping to evaluate the (geo)participatory notions of local administrations towards the concept of democracy 2.0 or active citizenship.
2. Data Description
As mentioned in the previous part, we collected a unique set of indicators about (geo)participatory processes and tools that municipalities in Czechia use at the local administration level. The database is cleaned up and ready to be implemented, used, and exploited by other researchers interested in the topic. Moreover, we provide a database about Czech municipalities that is fully integrated with their spatial counterpart. Thus, researchers seeking to search for the geographical or spatial context could use the dataset without additional efforts (in terms of data curation). In this part, we describe the most important characteristics of the dataset, focusing on attribute (tabular) data, its spatial part, and the open geodata portal through which we distribute the dataset. We elaborate more in detail on the methodological aspects of the data collection in the Methods section of this paper.
2.1. Spatial Part of the Dataset
The spatial part of the dataset represents the administrative boundaries of Czech municipalities, i.e., LAU 2 units. In 2019, to which we reference the data, there were 6258 municipalities. The spatial data were acquired from The Czech Office for Surveying, Mapping and Cadastre (ČÚZK). All the spatial data treatment was done in ArcGIS Pro with the use of the Esri File Geodatabase. The final dataset is distributed via the open data portal managed by the Department of Geoinformatics (see Section 2.3). The dataset is available primarily as Esri Geodatabase, but it is also available in Shapefile format and geospatial services using API (REST, GeoJSON). Moreover, the data is downloadable in textual CSV format and MS Excel table.
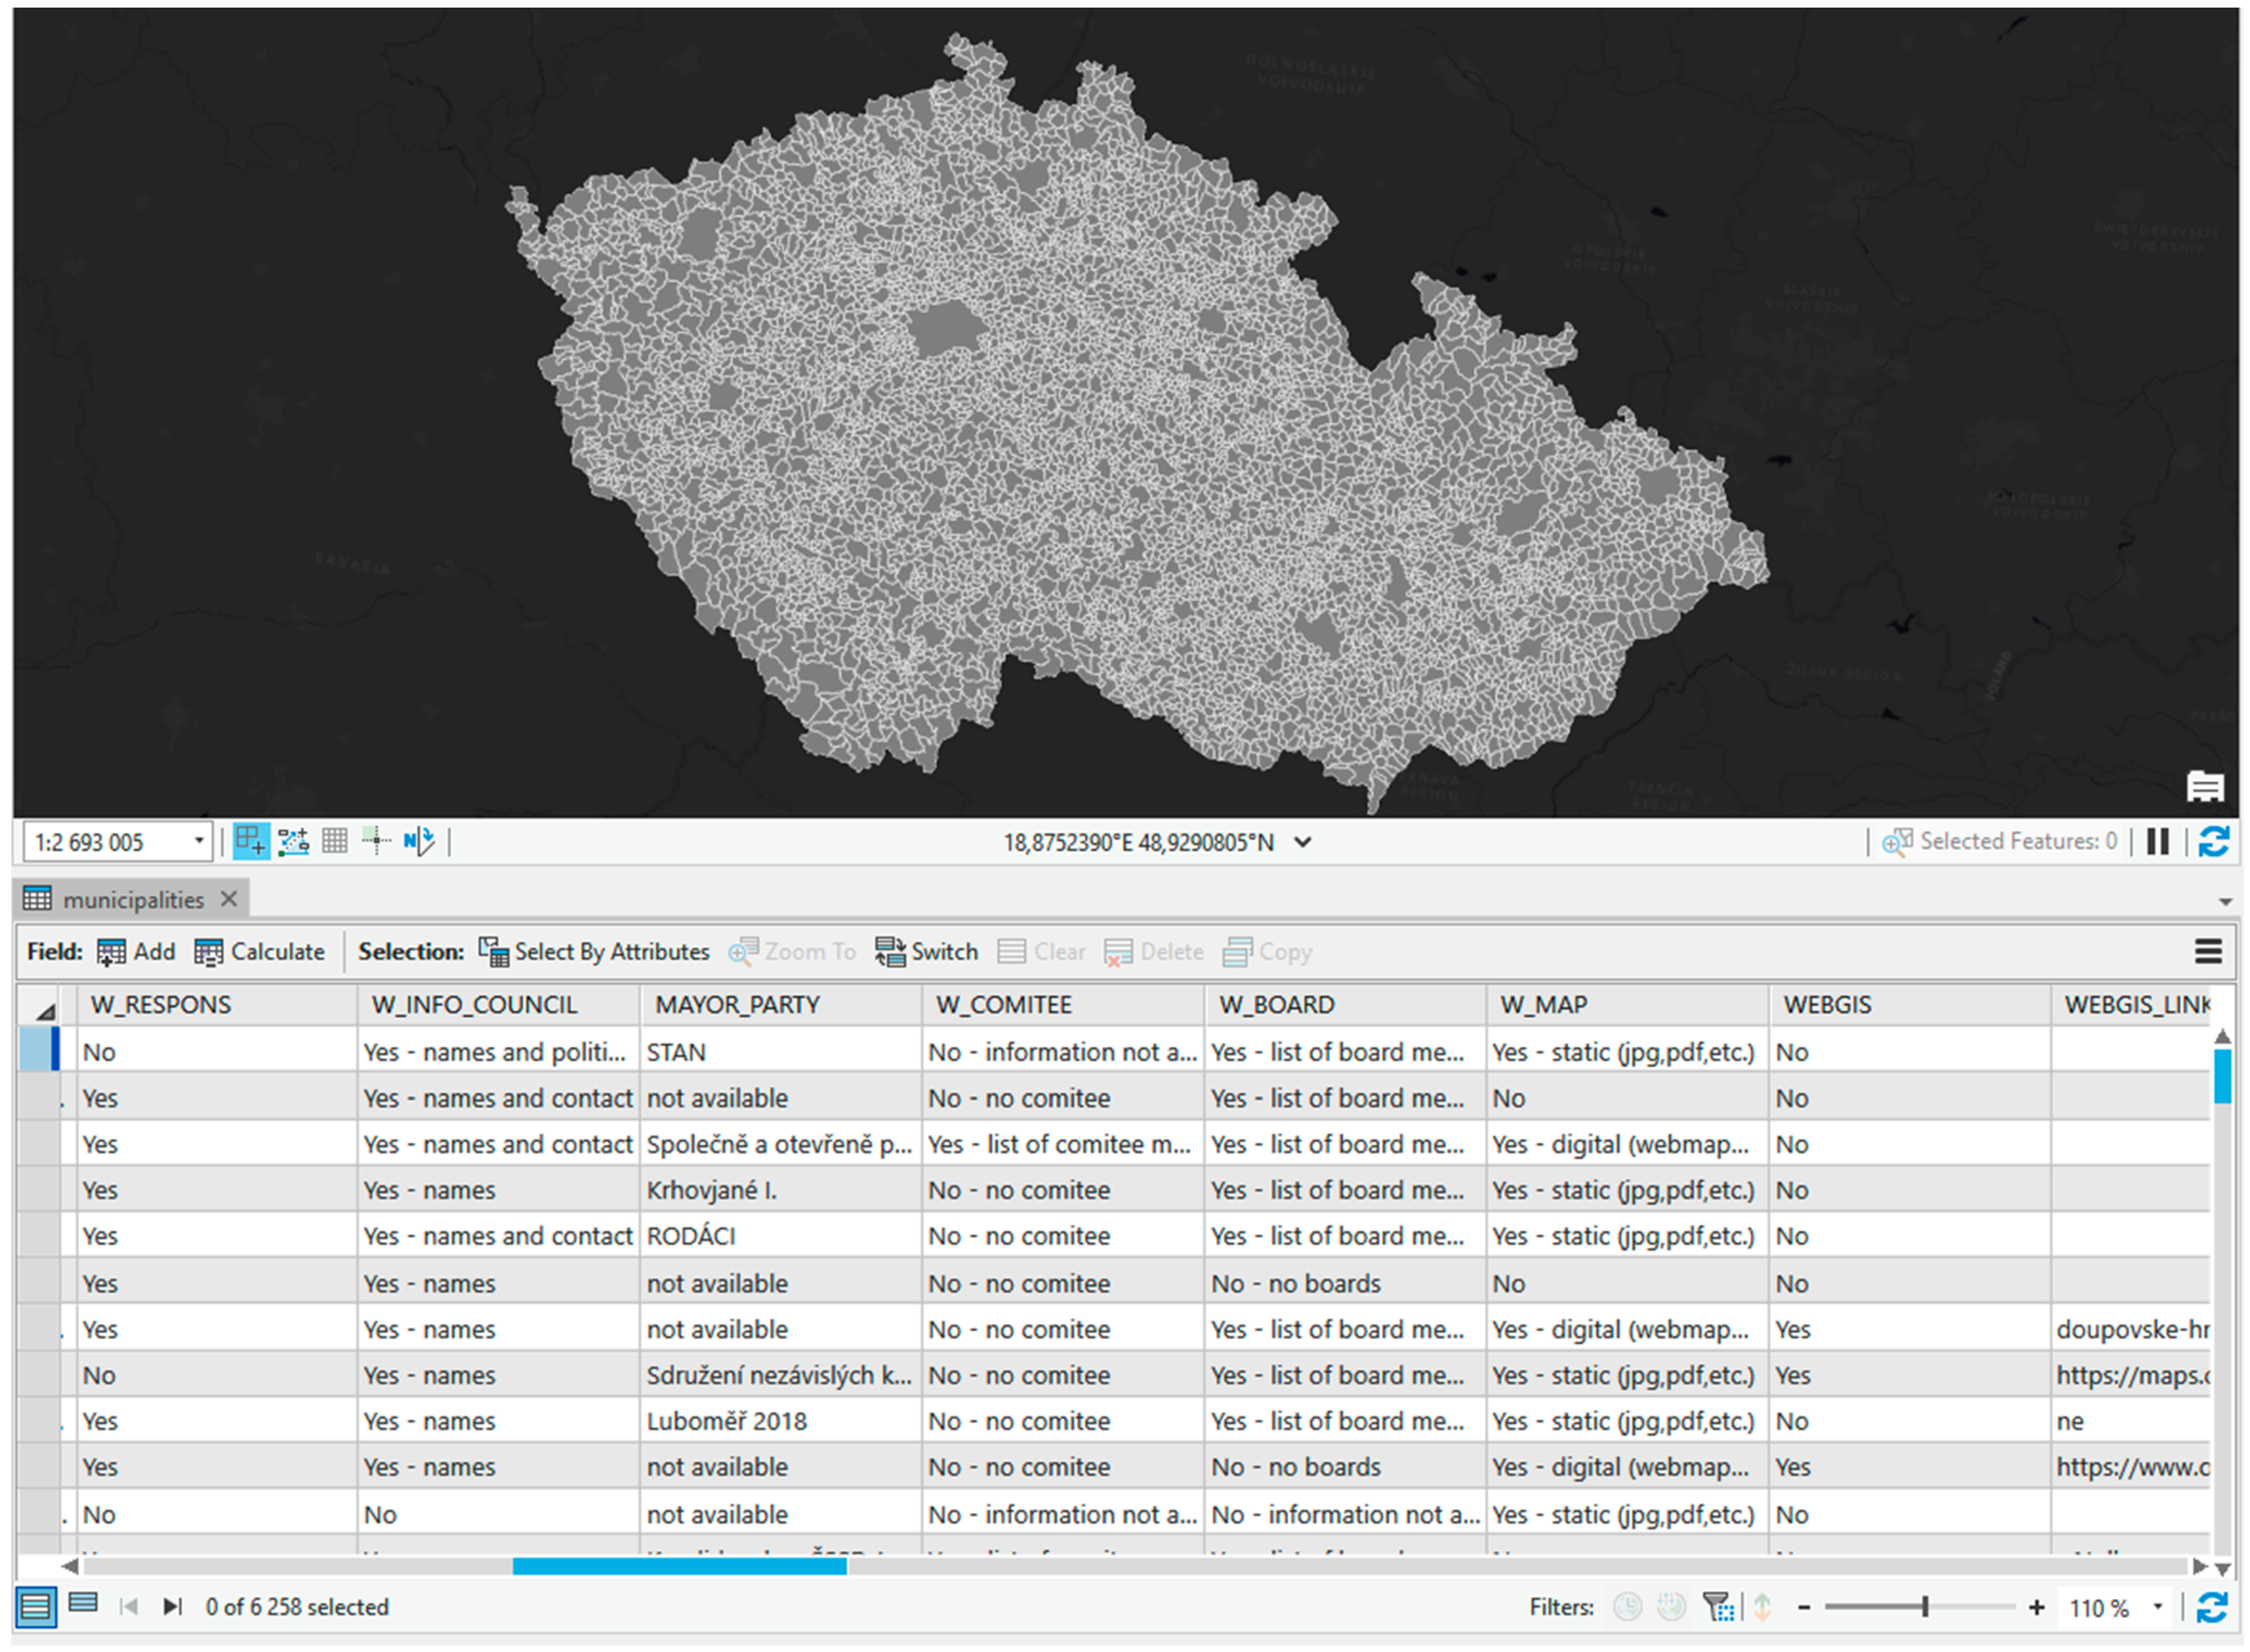
The final dataset is in a vector format using polygons as a geometric representation of administrative boundaries with attached data from the survey. The coordinate system set for the data is S-JTSK_Krovak_East_North (EPSG code 5514). Attributes are based on the questions from the survey (Table 1), but in some cases, answers on survey questions were decomposed for better manipulation (analysis and visualization) in GIS. Moreover, besides fundamental identifiers of municipalities (unique ID codes, municipalities’ names, higher hierarchical units codes, and names), we added a synthetic index—Index of GeoParticipation—derived from primarily collected data from the survey (see more in the methodology section). The list of attributes with their meaning is in Table 2, and the data view in ArcGIS Pro environment in Figure 1.
2.2. Attribute Part of the Dataset
The non-spatial part of the dataset resulted from time- and capacity-demanding but crowdsourced manual surveys done by research assistants (students) by exploring individual municipal websites. Original ID codes were provided by The Czech Statistical Office (CZSO).
The list of collected attributes is in Table 2 along with the short description (including related questions from Table 1) and primary data type. In total, there are 55 attributes (excluding ObjectID), from which nine are number format. Since some of the attributes were derived from one question (e.g., social networks or problem/defect reporting), the textual data type was chosen instead of a binary number (i.e., 0/1). This helps further use of the dataset, as additional data description (decoding table) is not needed. That is why most of the attributes were kept in textual data type, as some questions had multiple answer options. For instance, Question 5 concerning information about the municipal council offered four possible options: (1) Yes-list of board members; (2) Yes-list of boards; (3) No-no boards; and (4) No-information not available. Therefore, the attribute W_BOARD is oftext data type. Analogically with attributes W_COMITEE, W_INFO_COUNCIL, W_MAP, and several others.
Further decomposition of some questions would lead to a rather complex data structure with an overloaded attribute table (in terms of the number of attribute fields). On the other hand, some questions were decomposed into binary variables (e.g., problem/defect reporting attributes such as DEF_REP_FORM, DEF_REP_MAIL, DEF_REP_MAP, and DEF_REP_YN) as authors identify these attributes as useful ones for initial visual analysis. In general, the dataset’s attributes are unified to enable various types of analysis and visualizations.
As indicated earlier, the attributes are generated from answers to questions prepared in SurveyMonkey for research assistants who collected the data from publicly available sources. When controlling the dataset, we identify mistakes or incorrect information in the data. Details about data verification are in Section 3.2.
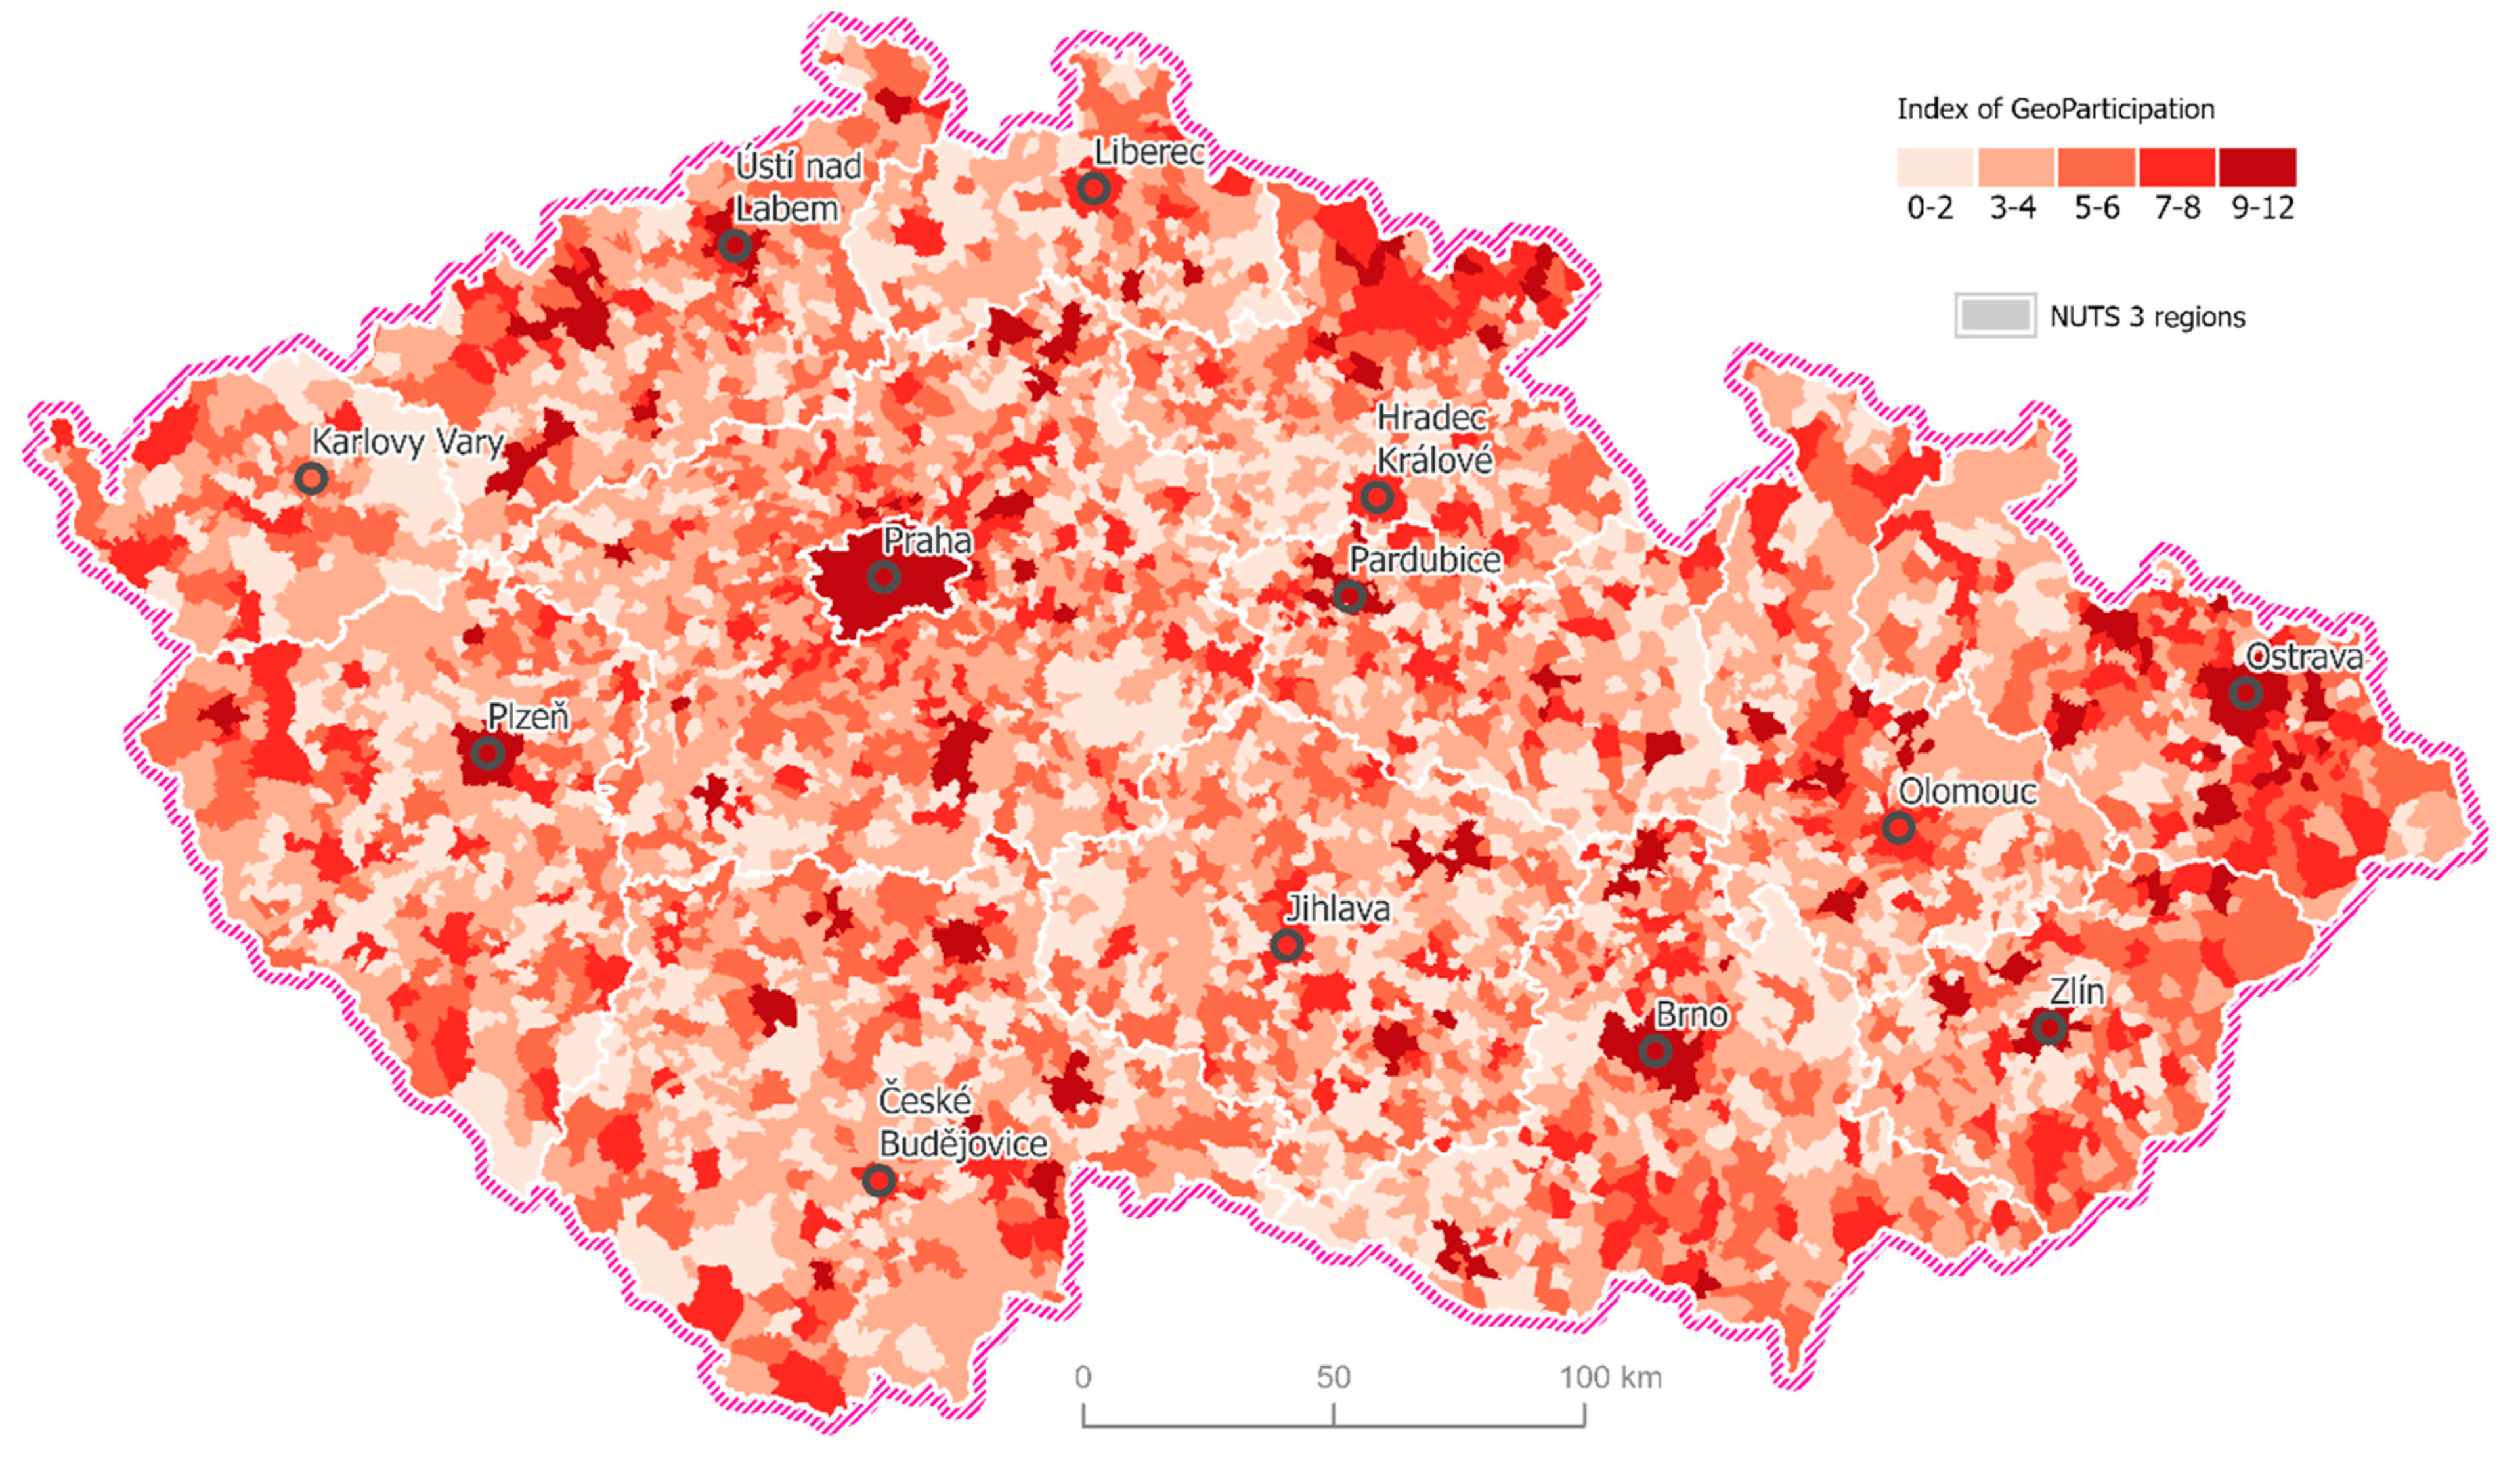
In addition, we also included derived attributes dealing with the Index of GeoParticipation (I_PARTICIP_SUM) and its domains (I_C, I_P, I_T). The synthetic Index of GeoParticipation (Figure 2) is computed from three domains—communication, participation, and transparency—that follows the concept of public participation proposed [14,15]. The Index of GeoParticipation combines the cubed frameworks (theory) with empirical/measurable indicators [6], which were used from the presented dataset. The communication domain uses answers from Questions 4, 12, 13, and 16; the participation domain includes answers to Questions 12, 18, 21, and 24; and finally, the transparency domain is composed of answers to Questions 5, 15, 17, and 20. Each domain received 0 to 4 points (the answers were used as binary variables); therefore, the overall Index of GeoParticipation ranges from 0 to 12 points. Further details about the index calculation and methodology are presented in [6]. Index of GeoParticipation represents possible advanced use of the presented dataset, besides individual analytical mapping of selected domains or concrete indicators.
2.3. Open Data Portal
We decided to follow an ‘open data’ concept to offer the dataset as available as possible. According to The Open Knowledge Foundation [16], open data is “data that can be freely used, shared and built-on by anyone, anywhere, for any purpose”. Based on generally accepted rules, the data should be published via Internet from the primary source with no legislative restriction. Data should be available in several formats following open standards. There should be no technical restrictions during downloading process (no registration). Data should be published to the maximum possible extent (all feature and all attributes).
There exist several tools (data portals) available for publishing and sharing spatially based data like CKAN (Comprehensive Knowledge Archive Network), DKAN (Drupal implementation of CKAN), Socrata Open Data, Junar, Plenar.io, or Esri solutions-ArcGIS Hub, and ArcGIS Enterprise Sites. For our purpose, we used the ArcGIS Enterprise platform, which is an alternative to ArcGIS Hub that allows more sophisticated solutions with better options for data management.
Data is published at Open Data Portal of Department of Geoinformatics, Palacký University Olomouc, available at URL https://gislib.upol.cz/portal/apps/sites/#/opendata (accessed on 8 July 2021). It contains dozens of datasets divided by categories. Each dataset is available via a specific URL. Our published dataset is available at https://tinyurl.com/geoparticipation (accessed on 8 July 2021).
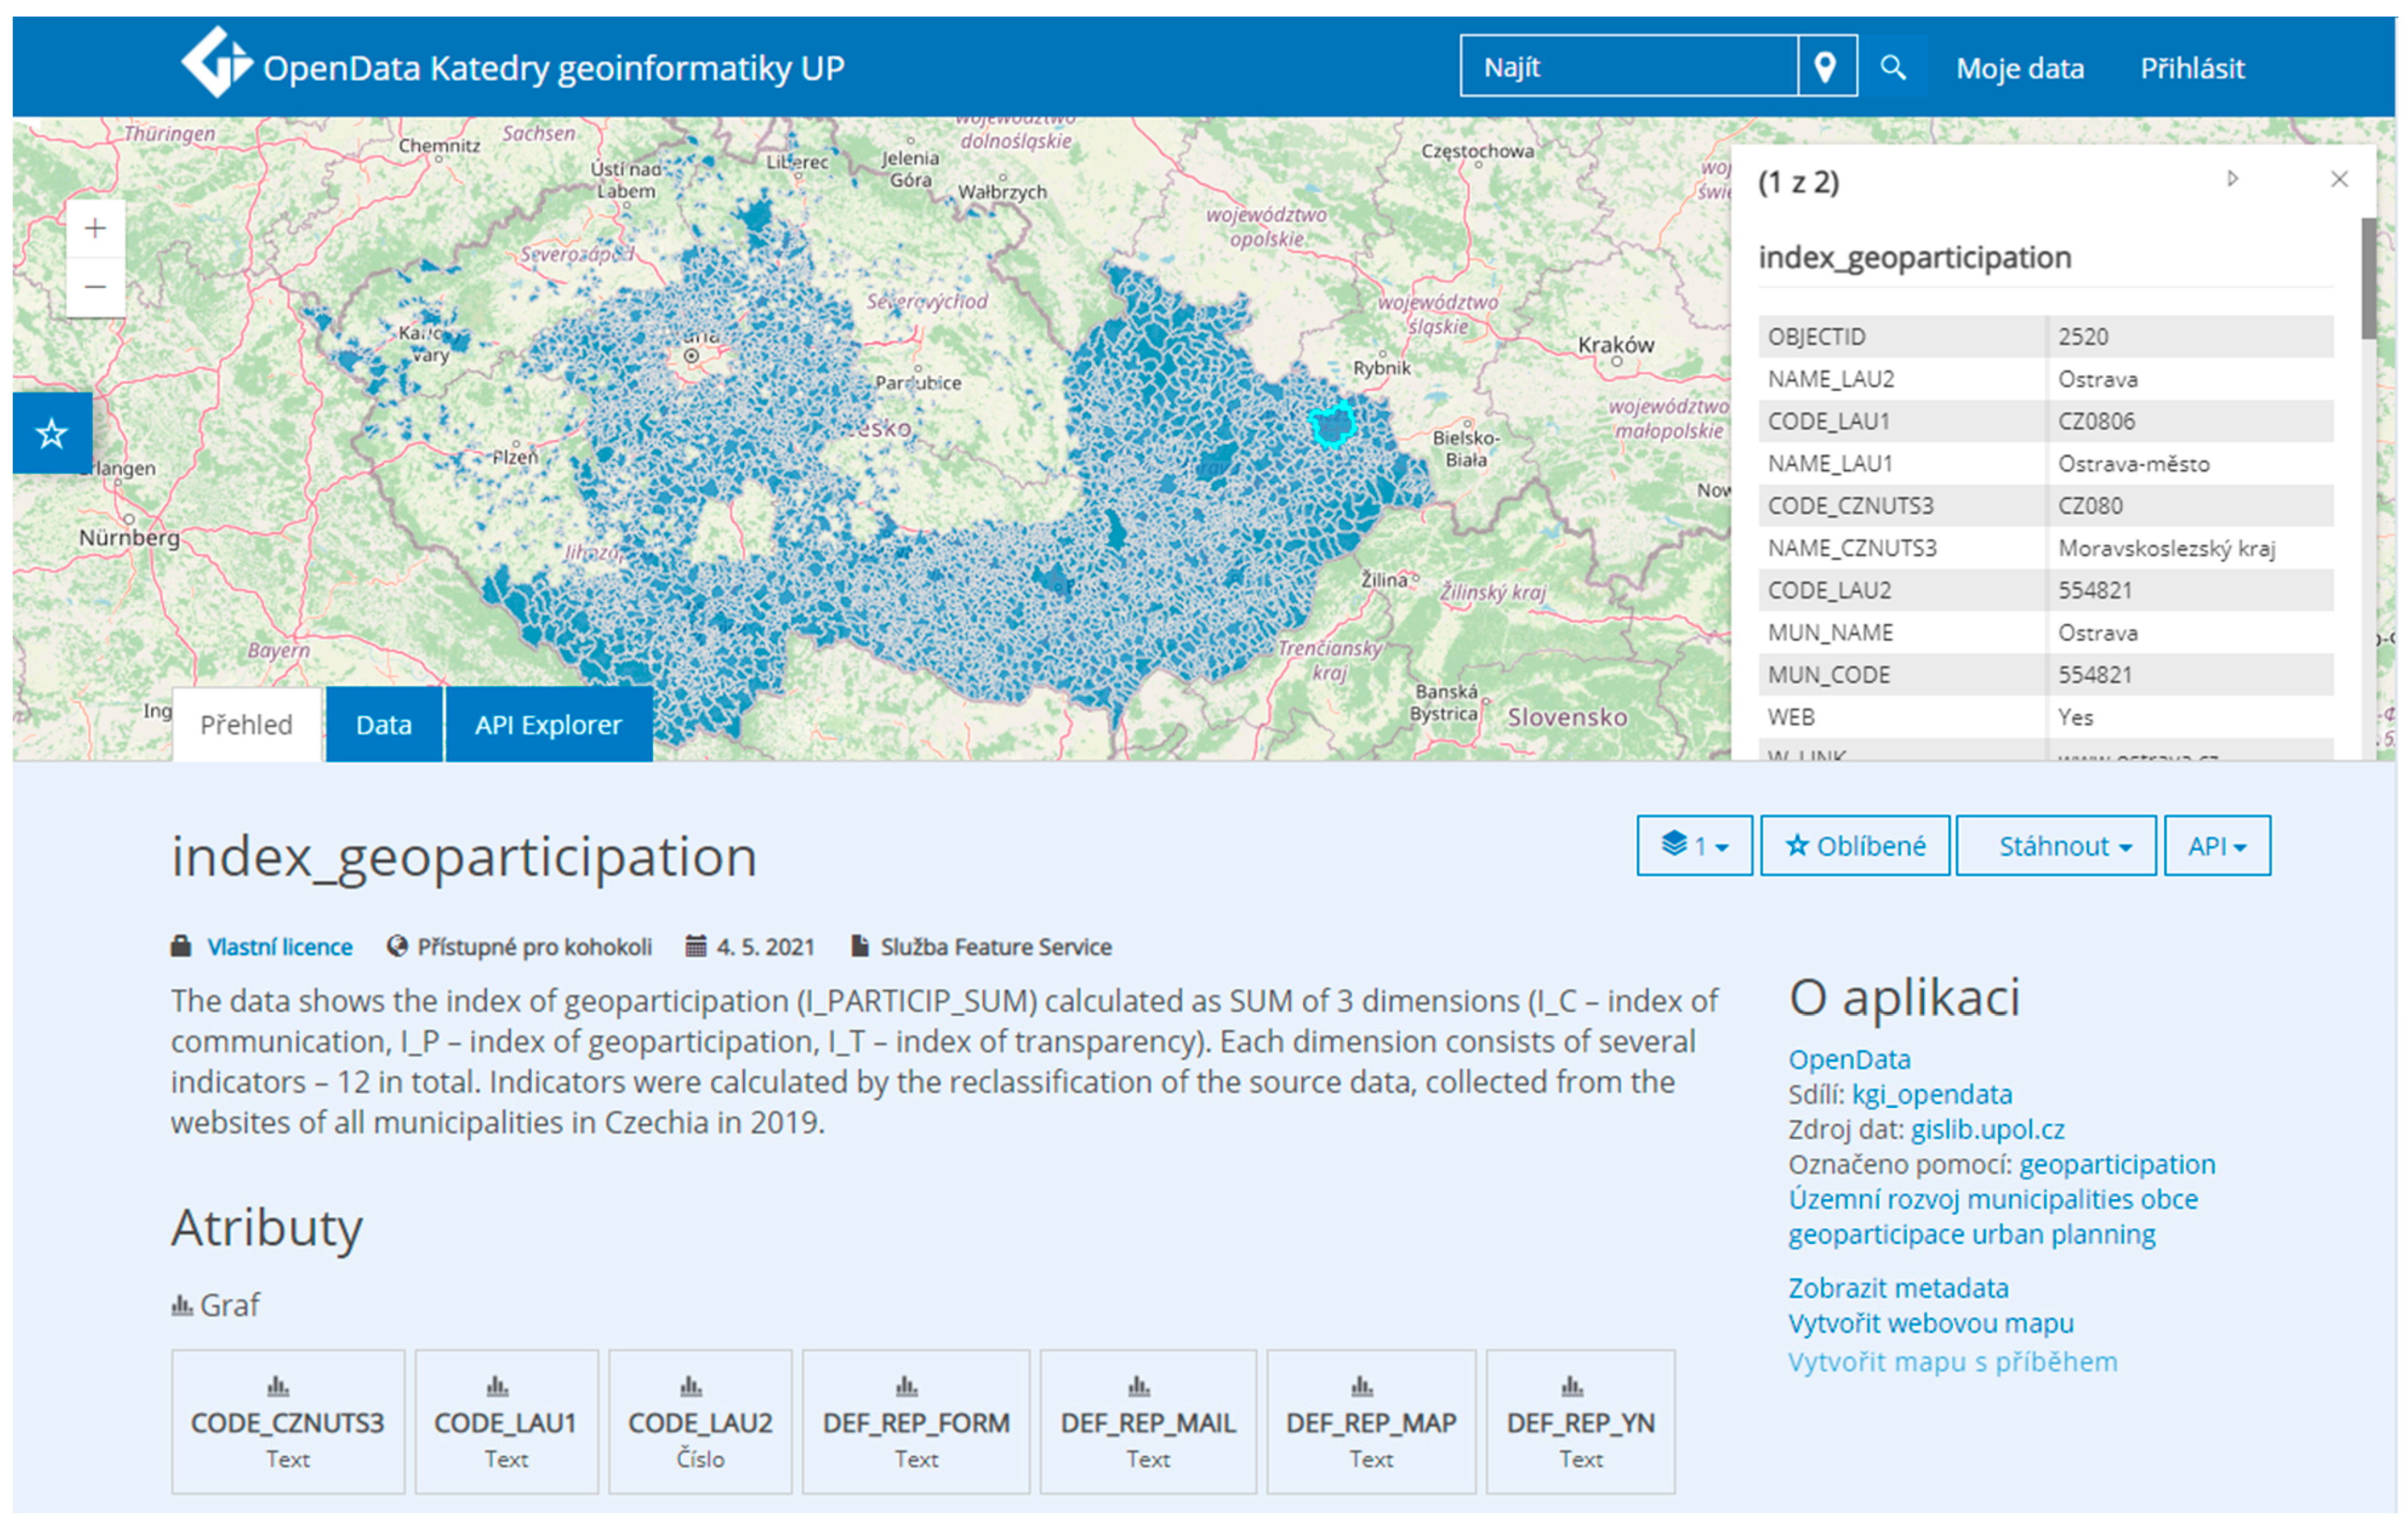
The interface (web page) of the dataset (Figure 3) contains spatial and nonspatial (metadata, description) segments. Upper part with the interactive map provides a general overview of visualized data. It is a simple web map application with a limited level of interactivity and limited options to change the layer symbology. It offers the basic functionality of web maps like zoom in/out, pan, and feature identification (attributes preview). Two tabs allow the user to switch between spatial (map) and tabular (attribute table) visualization of the dataset. Moreover, the application allows advanced filtering. The second part of the interface includes all metadata, including descriptions of the dataset (license and custom description) and attributes overview. Several buttons allow downloading the data in specified formats. Data is available for download in the following formats: Esri File Geodatabase; CSV (Comma-separated values); SHP (Shapefile); GeoJSON (Geo JavaScript Object Notation); XLSX for Excel; and GeoService API (Application Programming Interface).
Portal also allows Esri users to use the published dataset in the custom project within the ArcGIS platform. The layer is directly uploaded by the “Make web map” button in the ArcGIS Online Web Map Viewer, and users can create their interactive web map applications.
3. Methods
This chapter describes the main steps of data curation and publication of the dataset on an open data portal. Firstly, the methodology of the data collection campaign is described, including some of its drawbacks. Secondly, the data verification process is explained in detail; and, lastly, publishing to an open data portal is presented.
3.1. Data Collection Campaign
The intended indicators were inspired by research from [14], after which we followed the topics from local participatory policies in Czechia covering communication, transparency, and government. In addition, we expertly assessed the relevancy and availability of the information that municipalities provide openly on their websites. This two-fold process resulted in identifying questions (Table 1), which we planned to collect for a single municipality in the country. Since it was designed to collect publicly available and relevant information for every municipality in Czechia, i.e., for 6258 unique units, and considering the number of desired questions—i.e., 24, it means 150,192 records were gathered manually exploring individual municipalities’ websites. Therefore, we used the principle of crowdsourcing as we asked research assistants (university students enrolled in a GIS course) to help us with the data collection. In total, over 50 people were assigned to collect data about municipalities in two given LAU1 districts (77 in total). The data were collected via the questionnaire prepared in the Survey Monkey tool in the period from March 2019 until May 2020. Before the data collection campaign, all students were instructed on using the questionnaire and what each question meant. They were given the list of municipalities (with their unique codes) to collect the data about.
Moreover, a help button with further explanations for each question in the SurveyMonkey tool was available for collectors. Although we had various meetings and thorough pre-survey training, some research assistants made mistakes in data collection. However, the most common mistakes included mismatched names of the municipality (although unique codes were provided), incorrect municipal email and web addresses, factual mistakes in the attributes (confusion e.g., between mobile apps and webGIS), and others. Therefore, it was needed to assess the quality of the data in the following step of the data curation.
The resulting data collected by research assistants was stored in a tabular form in MS Excel, where the data was cleaned up and formatted for later join with its spatial equivalent in ArcGIS Pro. Since we used unique codes of municipalities, it was quite straightforward to join attributes with its spatial counterpart, i.e., municipal administrative boundaries. This process also helped us identify inconsistencies in data regarding municipality names (as referred to above).
3.2. Data Verification
As mentioned in the previous part, some data quality issues appeared during the data collection that had to be corrected. There exist municipalities with exact names in Czechia, and although we provided research assistants (students) with unique municipal IDs, it happened they mismatched some assigned municipalities with others having the same name. Therefore, we checked manually every single municipality after in order to have the correct dataset. Related to this, we also needed to check factual information filled by research assistants via the survey tool. However, since it was impossible to inspect every single record in the dataset, we focused on finding out the overall error rate of the data collected.
The data verification was conducted on a random sample of 77 municipalities—one per each LAU1 district. The random sample was chosen using a random sampling algorithm in ArcGIS software (ACM collected algorithm 599). The algorithm was incorporated into the ModelBuilder, allowing iterations over each district to avoid selecting multiple municipalities from one district. Six other research assistants collected the same data for each municipality, and the results were compared among each other. This test was designed to eliminate the subjectivity from data collection. Via this approach, we have collected 431 records (not every research assistant managed to collect all 77 municipalities); on average, we had 5.6 records per municipality. For each municipality and each question, a data check was performed to highlight the questions with the highest error value. The general error rate, where at least one assistant collected a different response for the question than the other assistant, was from 3.7% (“Is there information about the municipality’s council”?) to 31.8% (“Does the municipality allow online reporting of problems”?). Suppose we accept the fact that at least one assistant did not really perform well and did not collect the data correctly. In that case, the overall error drops, ranging from 1.4% (“Is there information about the municipality’s council”?) to 28.3% (“Does the municipality allow online reporting of problems”?). The average error in data is 10.3% in our random sample. This may seem high, but the data collected should not be treated as exact evidence on the real state, but merely as the public perception of how the real state is available. The assistants had the instruction that if the data/information was available/searchable quickly/easily on the municipality web page at the verification process, they should mark it as unavailable, as the average user will also not spend extra time searching for the actual data.
3.3. Open-Data Portal and Publishing the Dataset
For the data publication, we decided to use the Open Data Portal (https://gislib.upol.cz/portal/apps/sites/#/opendata; accessed on 8 July 2021) implemented at the Department of Geoinformatics, Palacký University Olomouc. Portal was created using the ArcGIS Enterprise solution that consists of ArcGIS Server, ArcGIS Enterprise Portal, ArcGIS DataStore, and ArcGIS Web Adaptor [17]. The main benefit of this high-end solution is more complex data management. Data is not stored in Esri Geospatial Cloud but at the owners hardware that offers more control of data publication, processing, and updates. Portal was designed via ArcGIS Enterprise Sites (part of ArcSGI enterprise Portal), an interface for creating websites to share the data.
Sharing the data via an open data portal is based on several steps: metadata and geometry preprocessing, data uploading, sharing, and publishing. First, the prepared data had to be uploaded into ArcGIS Enterprise. Next, the data was uploaded through ArcGIS Pro as a hosted layer from the Esri Data Store. A name and keywords were chosen to make the layer easier to find. Additional parameters—such as description, metadata, and license terms of use—were set for the data too. Finally, the metadata was filled in using the Metadata Editor, in which all known information was filled in.
Metadata represents additional information about the basic feature of a dataset. In our case, the metadata (according ISO 19139) is characterized by title, short description, spatial extent (bounding box), date of publishing, author, attributes specification, and license and permission. All metadata is available in a standardized format at URL: https://gislib.upol.cz/portal/sharing/rest/content/items/5ffeb36cdde8476bb46da1ff2f0b5cd5/info/metadata/metadata.xml (accessed on 8 July 2021).
Inspired by [18], after the metadata editing was finished, the publishing phase followed. Publishing is the technical and formal procedure of data publication, finished by visualized and freely available open data for download. From technical point of view, the publication procedure requires sharing data with the public and selecting available data formats for the download option. For our dataset, the following options are available: Esri spatial geodatabase (GDB) as the first option, CSV, Shapefile, GeoJSON, XLSX, and standardized GeoService API.
4. Summary
The dataset presented here comes from a crowdsourced campaign that searched for publicly available information about municipalities in Czechia. After a time- and capacity-consuming data collection and consequent data verification, we prepared a dataset containing all Czech municipalities (n = 6258) with 55 attributes concerning various aspects of (geo)participation. On top of it, we calculated a synthetic Index of Geoparticipation, which builds on collected data, and is included in the database. This manuscript describes the main methodological steps and data structure. We see the possible users of our data and readers of the paper in four main categories:
- (a)
- Data scientists who can benefit from the methodological approach we used in the data collection and validation process. To our knowledge, data about local municipalities are rarely collected on such fine level as we did; therefore, it may be interesting to learn from our mistakes and improve the data collection for further research;
- (b)
- Our data can be of course, used by political scientists and social geographers and other researchers interested in local democratic processes and/or geoparticipation. We would be highly interested in comparative studies, where our data would be part of a larger sample;
- (c)
- Our database can be freely used in various levels as well as subjects of education. We see the importance of open data and open science; hence the whole database is freely available, and we will be happy to see when it is used;
- (d)
- As the database is published as open data, we expect the general public to use our data as well as the Index of Geoparticipation that we calculated from the data in their advocacy work.
As mentioned above, the dataset is the first step in broader research in the domain of geoparticipation and local democracy indicators. We hope for further development, enhancement as well as collaboration based on this dataset. For more information, please contact the corresponding author.
5. User Notes
The dataset is ready to use in various formats indicated in the manuscript. In this Data Descriptor, we offer a detailed description of the dataset and methodological steps leading to compiling the final dataset. We also provided one example of possible use (Index of GeoParticipation), which is an inspiration for other scholars, researchers, and involved stakeholders. Moreover, a typology created from the dataset is presented in [6], which we encourage everybody to read before making use of this dataset. We invite anyone to use our dataset for their research or other agenda. We notice that the dataset is collected from publicly available sources using crowdsourced techniques; therefore, we cannot guarantee the accuracy of the content/attributes as they might have been subject to change since the data collection. Every user should be aware of these shortcomings. The data are published under the Creative Commons license to be freely shared and built on by any user.
Author Contributions
Conceptualization, V.P. and J.P.; Methodology, J.P., V.P., and J.B.; Data curation, J.P. and J.B.; Writing—original draft preparation, V.P., J.P., and J.B.; Writing—review and editing, V.P., J.P., and J.B.; Visualization, V.P. and J.B. All authors have read and agreed to the published version of the manuscript.
Funding
The output has been financially supported by the Czech Science Foundation (GACR) as part of the grant project no. 19-14506S–Geoparticipatory spatial tools in the decision-making processes of local administrations.
Institutional Review Board Statement
Not applicable.
Informed Consent Statement
Not applicable.
Data Availability Statement
The data presented in this study are available via the links in the main text.
Acknowledgments
The authors would like to thank all the research assistants (students) who voluntarily helped with the data collection. The authors thank Jiří Chovaneček for the assistance during the data collection campaign.
Conflicts of Interest
The authors declare no conflict of interest.
References
- International Council for Local Environmental Initiatives. The Local Agenda 21 Planning Guide; International Development Research Centre: Ottawa, ON, Canada, 1996; ISBN 0889368015. [Google Scholar]
- Kahila-Tani, M.; Kytta, M.; Geertman, S. Does mapping improve public participation? Exploring the pros and cons of using public participation GIS in urban planning practices. Landsc. Urban Plan. 2019, 186, 45–55. [Google Scholar] [CrossRef]
- Falco, E.; Kleinhans, R. Digital participatory platforms for co-production in urban development: A systematic review. Int. J. E Plan. Res. 2018, 7, 1–27. [Google Scholar] [CrossRef] [Green Version]
- Brown, G.; Kyttä, M. Key issues and priorities in participatory mapping: Toward integration or increased specialization? Appl. Geogr. 2018, 95, 1–8. [Google Scholar] [CrossRef]
- Hasler, S.; Chenal, J.; Soutter, M. Digital Tools as a Means to Foster Inclusive, Data-informed Urban Planning. Civ. Eng. Archit. 2017, 5, 230–239. [Google Scholar] [CrossRef]
- Pánek, J.; Pásztó, V.; Burian, J.; Bakule, J.; Lysek, J. What is the current state of geoparticipation in Czech municipalities? GeoScape 2021, 15, 90–103. [Google Scholar] [CrossRef]
- Whitmore, A. A statistical analysis of the construction of the United Nations E-Government Development Index. Gov. Inf. Q. 2012, 29, 68–75. [Google Scholar] [CrossRef]
- United Nations E-Government Development Index (EGDI). Available online: https://publicadministration.un.org/egovkb/en-us/About/Overview/-E-Government-Development-Index (accessed on 1 July 2021).
- United Nations E-Participation Index. Available online: https://publicadministration.un.org/egovkb/en-us/About/Overview/E-Participation-Index (accessed on 1 July 2021).
- Vitols, S. The European Participation Index (EPI): A Tool for Cross-National Quantitative Comparison; European Trade Union Institute: Brussels, Belgium, 2010; pp. 1–15. [Google Scholar]
- De Spiegelaere, S.; Vitols, S. A Better World with More Democracy at Work. Available online: https://europeanparticipationindex.eu/#Title (accessed on 4 July 2021).
- OECD. OECD Better Life Index. Available online: http://www.oecdbetterlifeindex.org/topics/civic-engagement/ (accessed on 1 July 2021).
- Eurostat Social Participation and Integration Statistics. Available online: https://ec.europa.eu/eurostat/statistics-explained/index.php?title=Social_participation_and_integration_statistics#Formal_and_informal_voluntary_activities (accessed on 4 July 2021).
- Lysek, J. Participatory Democracy and local representation: A Czech Case Study. In Proceedings of the ECPR General Conference, Prague, Czech Republic, 7–10 September 2016. [Google Scholar]
- Hurtíková, H.; Soukop, M. Participative and Deliberative Democracy on the Local Level: How the Political Characteristics of Municipalities in the Czech Republic Relate to the Use of Selected Democratic Innovation within their Territory? Lex Localis J. Local Self Gov. 2019, 17, 369–393. [Google Scholar] [CrossRef]
- James, L. Defining Open Data. Available online: https://blog.okfn.org/2013/10/03/defining-open-data/ (accessed on 14 June 2021).
- Esri. What Is ArcGIS Enterprise? Available online: https://enterprise.arcgis.com/en/get-started/10.7/windows/what-is-arcgis-enterprise-.htm (accessed on 14 June 2021).
- Pászto, V.; Nétek, R.; Vondráková, A.; Voženílek, V. Municipalities in the Czech Republic—Compilation of “a universal” dataset. Data 2020, 5, 107. [Google Scholar] [CrossRef]
Figure 1.
Final dataset geographical view in ArcGIS Pro environment.

Figure 2.
Index of GeoParticipation in Czech municipalities (based on calculation from [6]); white boundaries represents regions in Czechia (NUTS3 units).
Figure 2.
Index of GeoParticipation in Czech municipalities (based on calculation from [6]); white boundaries represents regions in Czechia (NUTS3 units).

Figure 3.
Interface of the Open Data Portal of the Department of Geoinformatics (Palacký University Olomouc) with the final dataset.
Figure 3.
Interface of the Open Data Portal of the Department of Geoinformatics (Palacký University Olomouc) with the final dataset.


Table 1.
Twenty-four fundamental questions/indicators collected during the crowdsourcing campaign.
| Question Number | Question Text | Note |
|---|---|---|
| 1 | Does the municipality have websites? | binary |
| 2 | Websites URL | - |
| 3 | Primary email contact | - |
| 4 | Is the webpage optimized for mobile devices? | binary |
| 5 | Is there information about the municipality’s council? | multiple |
| 6 | Which political party is the mayor? | multiple |
| 7 | Is there information about the municipal council commissions? | multiple |
| 8 | Is there information about committees of the municipal council? | multiple |
| 9 | Are maps or master plans available on the municipality’s website? | multiple |
| 10 | Does the municipality have a web GIS? | binary |
| 11 | Does the municipality offer (geo)data for download? | multiple |
| 12 | Does the municipality allow online reporting of problems? | multiple |
| 13 | Does the municipality have a mobile application for communication with citizens? | multiple |
| 14 | Does the municipality have its own newsletter? | multiple |
| 15 | Does the municipality provide minutes of council meetings? | multiple |
| 16 | Is the municipality on social networks? Which one(s)? | multiple |
| 17 | Does the municipality provide a drop-down budget on its websites? | binary |
| 18 | Does the municipality have a participatory budget? | multiple |
| 19 | Does the municipality publish contracts on their websites? | multiple |
| 20 | Does the municipality have a link to a transparent account on its websites? | binary |
| 21 | Does the community use participatory techniques? (round tables, participatory planning, etc.) | binary |
| 22 | Does the municipality have an info center? | binary |
| 23 | Is the municipality’s website searchable? | binary |
| 24 | Does the municipality use surveys/opinion polls? | binary |
Note: binary–it was possible to answer the question Yes/No; multiple–multiple answers from preset domains were available.
Table 2.
List of all attributes in the final dataset with their description (alphabetically ordered).
Table 2.
List of all attributes in the final dataset with their description (alphabetically ordered).
| Attribute | Description | Data Type |
|---|---|---|
| CODE_CZNUTS3 | Code of NUTS3 membership | text |
| CODE_LAU1 | Code of LAU1 membership | text |
| CODE_LAU2 | Municipal primary ID code | number |
| DEF_REP_FORM | Reporting of a problem/defect via e-form (Question 12) | text |
| DEF_REP_MAIL | Reporting of a problem/defect via e-mail (Question 12) | text |
| DEF_REP_MAP | Reporting of a problem/defect via map app (Question 12) | text |
| DEF_REP_YN | Reporting of a problem/defect (Question 12) | binary text |
| Email contact | text | |
| Facebook (Question 16) | text | |
| GEODATA | Municipal geodata (for free, on demand, no; Question 11) | text |
| I_C | Index of GeoParticipation—communication domain (scores) | number |
| I_P | Index of GeoParticipation—participation domain (scores) | number |
| I_PARTICIP_SUM | Index of GeoParticipation—final scores | number |
| I_T | Index of GeoParticipation—transparency domain (scores) | number |
| IC | Municipal info center (Question 22) | binary text |
| Instagram (Question 16) | text | |
| MAYOR_PARTY | Mayor’s political party/civic association | text |
| MOB_APP | Mobile application (Android, specific, more, no; Question 13) | text |
| MOB_APP_OTHER | Mobile application (name of the specific one; Question 13) | text |
| MUN_CODE | Municipal code (official) | number |
| MUN_NAME | Municipal name (official) | text |
| NAME_CZNUTS3 | Name of NUTS3 membership | text |
| NAME_LAU1 | Name of LAU2 membership | text |
| NAME_LAU2 | Municipal primary LAU2 name | text |
| NEWS_NEWSLETTER | Newsletter as an information source (Question 14) | binary text |
| NEWS_PRINTED | Printed news (Question 14) | binary text |
| NEWS_WEB | News on the web (Question 14) | binary text |
| NEWS_YN | Any source of municipal information (Question 14) | binary text |
| OBJECTID | Object ID (geometry) | number |
| PAR_BUD | Participatory budgeting (no, yes—with/without projects suggestions; Question 18) | text |
| PARTICIPATION | Participation techniques (Question 21) | binary text |
| REC_SKEN | Minutes from council meetings (scanned, Question 15) | binary text |
| REC_TRANS | Minutes from council meetings (transcription, Question 15) | binary text |
| REC_VIDEO | Minutes from council meetings (video recording, Question 15) | binary text |
| REC_YN | Minutes from council meetings (Question 15) | binary text |
| SOC_OTHER | Other social media | text |
| SOC_YN | Any social media | binary text |
| ST_AREA | Municipality area (square meters) | number |
| ST_LENGTH | Municipality perimeter (border length, meters) | number |
| SURVEYS | Municipal surveys/opinion polls | binary text |
| Twitter (Question 16) | text | |
| W_BOARD | On-web information about municipality’s council (Question 5) | text |
| W_COMITEE | On-web information about municipal council commissions (Question 7) | text |
| W_CONTRACTS | Publicly available municipal contracts on websites (Question 19) | text |
| W_DET_BUD | Participatory drop-down budget on websites (Question 18) | binary text |
| W_INFO_COUNCIL | On-web information about municipal council (Question 5) | text |
| W_LINK | Websites URL (Question 2) | text |
| W_MAP | Publicly available web maps (yes—static/dynamic, no; Question 9) | text |
| W_RESPONS | Responsible web design (Question 4) | binary text |
| W_SEARCH | Searchable websites (Question 23) | binary text |
| W_TRANSP_ACCOU | On-web transparent bank account (Question 20) | binary text |
| WEB | Municipal websites (Question 1) | binary text |
| WEBGIS | Municipal WebGIS (Question 10) | binary text |
| WEBGIS_LINK | Municipal WebGIS link (Question 10) | text |
| YOUTUBE | Youtube (Question 16) | text |
Publisher’s Note: MDPI stays neutral with regard to jurisdictional claims in published maps and institutional affiliations. |
© 2021 by the authors. Licensee MDPI, Basel, Switzerland. This article is an open access article distributed under the terms and conditions of the Creative Commons Attribution (CC BY) license (https://creativecommons.org/licenses/by/4.0/).
Share and Cite
MDPI and ACS Style
Pászto, V.; Pánek, J.; Burian, J. Geodatabase of Publicly Available Information about Czech Municipalities’ Local Administration. Data 2021, 6, 89. https://0-doi-org.brum.beds.ac.uk/10.3390/data6080089
AMA Style
Pászto V, Pánek J, Burian J. Geodatabase of Publicly Available Information about Czech Municipalities’ Local Administration. Data. 2021; 6(8):89. https://0-doi-org.brum.beds.ac.uk/10.3390/data6080089
Chicago/Turabian StylePászto, Vít, Jiří Pánek, and Jaroslav Burian. 2021. "Geodatabase of Publicly Available Information about Czech Municipalities’ Local Administration" Data 6, no. 8: 89. https://0-doi-org.brum.beds.ac.uk/10.3390/data6080089