Next Issue
Volume 7, May
Previous Issue
Volume 7, March


Data, Volume 7, Issue 4 (April 2022) – 13 articles

Cover Story (view full-size image): 
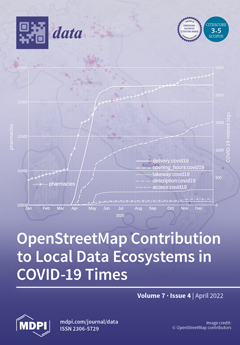
The paper describes the OpenStreetMap (OSM) contribution to address the early stage of the COVID-19 pandemic in Italy. In this period, the Italian OSM community initiated several activities, including adding new data to OSM (e.g., on delivery services of commercial activities), updating OSM data based on governmental datasets (e.g., pharmacies from the Ministry of Health), and publishing web maps offering specific information at the local level. Those initiatives are analyzed from a data ecosystem perspective, identifying actors, data, and data flows involved. The OSM project itself is also assessed within the current European policy context, highlighting opportunities and challenges for scaling successful approaches, such as those to fight COVID-19 from the local to the national and European scales. View this paper
  • Issues are regarded as officially published after their release is announced to the table of contents alert mailing list.
  • You may sign up for e-mail alerts to receive table of contents of newly released issues.
  • PDF is the official format for papers published in both, html and pdf forms. To view the papers in pdf format, click on the "PDF Full-text" link, and use the free Adobe Reader to open them.
Order results
Result details
Section
Select all
Export citation of selected articles as:
14 pages, 6409 KiB  
Data Descriptor
HAGDAVS: Height-Augmented Geo-Located Dataset for Detection and Semantic Segmentation of Vehicles in Drone Aerial Orthomosaics
by John R. Ballesteros, German Sanchez-Torres and John W. Branch-Bedoya
Data 2022, 7(4), 50; https://0-doi-org.brum.beds.ac.uk/10.3390/data7040050 - 14 Apr 2022
Cited by 6 | Viewed by 6095
Abstract
Detection and Semantic Segmentation of vehicles in drone aerial orthomosaics has applications in a variety of fields such as security, traffic and parking management, urban planning, logistics, and transportation, among many others. This paper presents the HAGDAVS dataset fusing RGB spectral channel and [...] Read more.
Detection and Semantic Segmentation of vehicles in drone aerial orthomosaics has applications in a variety of fields such as security, traffic and parking management, urban planning, logistics, and transportation, among many others. This paper presents the HAGDAVS dataset fusing RGB spectral channel and Digital Surface Model DSM for the detection and segmentation of vehicles from aerial drone images, including three vehicle classes: cars, motorcycles, and ghosts (motorcycle or car). We supply DSM as an additional variable to be included in deep learning and computer vision models to increase its accuracy. RGB orthomosaic, RG-DSM fusion, and multi-label mask are provided in Tag Image File Format. Geo-located vehicle bounding boxes are provided in GeoJSON vector format. We also describes the acquisition of drone data, the derived products, and the workflow to produce the dataset. Researchers would benefit from using the proposed dataset to improve results in the case of vehicle occlusion, geo-location, and the need for cleaning ghost vehicles. As far as we know, this is the first openly available dataset for vehicle detection and segmentation, comprising RG-DSM drone data fusion and different color masks for motorcycles, cars, and ghosts. Full article
Show Figures

Figure 1

18 pages, 296 KiB  
Communication
The Missing Case of Disinformation from the Cybersecurity Risk Continuum: A Comparative Assessment of Disinformation with Other Cyber Threats
by Kevin Matthe Caramancion, Yueqi Li, Elisabeth Dubois and Ellie Seoe Jung
Data 2022, 7(4), 49; https://0-doi-org.brum.beds.ac.uk/10.3390/data7040049 - 12 Apr 2022
Cited by 12 | Viewed by 7561
Abstract
This study examines the phenomenon of disinformation as a threat in the realm of cybersecurity. We have analyzed multiple authoritative cybersecurity standards, manuals, handbooks, and literary works. We present the unanimous meaning and construct of the term cyber threat. Our results reveal that [...] Read more.
This study examines the phenomenon of disinformation as a threat in the realm of cybersecurity. We have analyzed multiple authoritative cybersecurity standards, manuals, handbooks, and literary works. We present the unanimous meaning and construct of the term cyber threat. Our results reveal that although their definitions are mostly consistent, most of them lack the inclusion of disinformation in their list/glossary of cyber threats. We then proceeded to dissect the phenomenon of disinformation through the lens of cyber threat epistemology; it displays the presence of the necessary elements required (i.e., threat agent, attack vector, target, impact, defense) for its appropriate classification. To conjunct this, we have also included an in-depth comparative analysis of disinformation and its similar nature and characteristics with the prevailing and existing cyber threats. We, therefore, argue for its recommendation as an official and actual cyber threat. The significance of this paper, beyond the taxonomical correction it recommends, rests in the hope that it influences future policies and regulations in combatting disinformation and its propaganda. Full article
(This article belongs to the Special Issue Automatic Disinformation Detection on Social Media Platforms)
10 pages, 415 KiB  
Data Descriptor
A Dataset of Dropout Rates and Other School-Level Variables in Louisiana Public High Schools
by Michael Stein, Michael Leitner, Jill C. Trepanier and Kory Konsoer
Data 2022, 7(4), 48; https://0-doi-org.brum.beds.ac.uk/10.3390/data7040048 - 12 Apr 2022
Cited by 1 | Viewed by 4702
Abstract
Students dropping out of high school is a nationwide problem in the United States, plaguing communities and often greatly reducing the prospects of a quality life for those students who do not complete their high school education. The state of Louisiana consistently has [...] Read more.
Students dropping out of high school is a nationwide problem in the United States, plaguing communities and often greatly reducing the prospects of a quality life for those students who do not complete their high school education. The state of Louisiana consistently has among the highest public high school dropout rates in the United States and, often, the highest. This massive dataset of school variables covering a duration of five academic years (2014–2015 to 2018–2019) was originally compiled with the intention of identifying the factors that correlate with high school dropouts in Louisiana public high schools, specifically. However, it can be useful to any researchers interested in analyzing school-level data concerning a wide range of variables beyond merely dropout rates. This dataset also contains socioeconomic demographics, financial variables, class size, and much more. The correlation analyses ultimately revealed many intriguing insights into the relationships between the tested variables and the dropout rates. Full article
(This article belongs to the Special Issue Education Data Mining)
Show Figures

Figure 1

11 pages, 17964 KiB  
Data Descriptor
Dataset: Roundabout Aerial Images for Vehicle Detection
by Enrique Puertas, Gonzalo De-Las-Heras, Javier Fernández-Andrés and Javier Sánchez-Soriano
Data 2022, 7(4), 47; https://0-doi-org.brum.beds.ac.uk/10.3390/data7040047 - 12 Apr 2022
Cited by 5 | Viewed by 4550
Abstract
This publication presents a dataset of Spanish roundabouts aerial images taken from a UAV, along with annotations in PASCAL VOC XML files that indicate the position of vehicles within them. Additionally, a CSV file is attached containing information related to the location and [...] Read more.
This publication presents a dataset of Spanish roundabouts aerial images taken from a UAV, along with annotations in PASCAL VOC XML files that indicate the position of vehicles within them. Additionally, a CSV file is attached containing information related to the location and characteristics of the captured roundabouts. This work details the process followed to obtain them: image capture, processing, and labeling. The dataset consists of 985,260 total instances: 947,400 cars, 19,596 cycles, 2262 trucks, 7008 buses, and 2208 empty roundabouts in 61,896 1920 × 1080 px JPG images. These are divided into 15,474 extracted images from 8 roundabouts with different traffic flows and 46,422 images created using data augmentation techniques. The purpose of this dataset is to help research into computer vision on the road, as such labeled images are not abundant. It can be used to train supervised learning models, such as convolutional neural networks, which are very popular in object detection. Full article
Show Figures

Figure 1

51 pages, 24884 KiB  
Article
A Collection of 30 Multidimensional Functions for Global Optimization Benchmarking
by Vagelis Plevris and German Solorzano
Data 2022, 7(4), 46; https://0-doi-org.brum.beds.ac.uk/10.3390/data7040046 - 11 Apr 2022
Cited by 11 | Viewed by 5921
Abstract
A collection of thirty mathematical functions that can be used for optimization purposes is presented and investigated in detail. The functions are defined in multiple dimensions, for any number of dimensions, and can be used as benchmark functions for unconstrained multidimensional single-objective optimization [...] Read more.
A collection of thirty mathematical functions that can be used for optimization purposes is presented and investigated in detail. The functions are defined in multiple dimensions, for any number of dimensions, and can be used as benchmark functions for unconstrained multidimensional single-objective optimization problems. The functions feature a wide variability in terms of complexity. We investigate the performance of three optimization algorithms on the functions: two metaheuristic algorithms, namely Genetic Algorithm (GA) and Particle Swarm Optimization (PSO), and one mathematical algorithm, Sequential Quadratic Programming (SQP). All implementations are done in MATLAB, with full source code availability. The focus of the study is both on the objective functions, the optimization algorithms used, and their suitability for solving each problem. We use the three optimization methods to investigate the difficulty and complexity of each problem and to determine whether the problem is better suited for a metaheuristic approach or for a mathematical method, which is based on gradients. We also investigate how increasing the dimensionality affects the difficulty of each problem and the performance of the optimizers. There are functions that are extremely difficult to optimize efficiently, especially for higher dimensions. Such examples are the last two new objective functions, F29 and F30, which are very hard to optimize, although the optimum point is clearly visible, at least in the two-dimensional case. Full article
Show Figures

Figure 1

23 pages, 6564 KiB  
Article
Classification of Building Types in Germany: A Data-Driven Modeling Approach
by Abhilash Bandam, Eedris Busari, Chloi Syranidou, Jochen Linssen and Detlef Stolten
Data 2022, 7(4), 45; https://0-doi-org.brum.beds.ac.uk/10.3390/data7040045 - 09 Apr 2022
Cited by 10 | Viewed by 4914
Abstract
Details on building levels play an essential part in a number of real-world application models. Energy systems, telecommunications, disaster management, the internet-of-things, health care, and marketing are a few of the many applications that require building information. The essential variables that most of [...] Read more.
Details on building levels play an essential part in a number of real-world application models. Energy systems, telecommunications, disaster management, the internet-of-things, health care, and marketing are a few of the many applications that require building information. The essential variables that most of these models require are building type, house type, area of living space, and number of residents. In order to acquire some of this information, this paper introduces a methodology and generates corresponding data. The study was conducted for specific applications in energy system modeling. Nonetheless, these data can also be used in other applications. Building locations and some of their details are openly available in the form of map data from OpenStreetMap (OSM). However, data regarding building types (i.e., residential, industrial, office, single-family house, multi-family house, etc.) are only partially available in the OSM dataset. Therefore, a machine learning classification algorithm for predicting the building types on the basis of the OSM buildings’ data was introduced. Although the OSM dataset is the fundamental and most crucial one used for modeling, the machine learning algorithm’s training was performed on a dataset that was prepared by combining several features from three other datasets. The generated dataset consists of approximately 29 million buildings, of which about 19 million are residential, with 72% being single-family houses and the rest multi-family ones that include two-family houses and apartment buildings. Furthermore, the results were validated through a comparison with publicly available statistical data. The comparison of the resulting data with official statistics reveals that there is a percentage error of 3.64% for residential buildings, 13.14% for single-family houses, and −15.38% for multi-family houses classification. Nevertheless, by incorporating the building types, this dataset is able to complement existing building information in studies in which building type information is crucial. Full article
(This article belongs to the Topic Methods for Data Labelling for Intelligent Systems)
Show Figures

Figure 1

13 pages, 1644 KiB  
Article
Using Social Media to Detect Fake News Information Related to Product Marketing: The FakeAds Corpus
by Noha Alnazzawi, Najlaa Alsaedi, Fahad Alharbi and Najla Alaswad
Data 2022, 7(4), 44; https://0-doi-org.brum.beds.ac.uk/10.3390/data7040044 - 07 Apr 2022
Cited by 9 | Viewed by 4476
Abstract
Nowadays, an increasing portion of our lives is spent interacting online through social media platforms, thanks to the widespread adoption of the latest technology and the proliferation of smartphones. Obtaining news from social media platforms is fast, easy, and less expensive compared with [...] Read more.
Nowadays, an increasing portion of our lives is spent interacting online through social media platforms, thanks to the widespread adoption of the latest technology and the proliferation of smartphones. Obtaining news from social media platforms is fast, easy, and less expensive compared with other traditional media platforms, e.g., television and newspapers. Therefore, social media is now being exploited to disseminate fake news and false information. This research aims to build the FakeAds corpus, which consists of tweets for product advertisements. The aim of the FakeAds corpus is to study the impact of fake news and false information in advertising and marketing materials for specific products and which types of products (i.e., cosmetics, health, fashion, or electronics) are targeted most on Twitter to draw the attention of consumers. The corpus is unique and novel, in terms of the very specific topic (i.e., the role of Twitter in disseminating fake news related to production promotion and advertisement) and also in terms of its fine-grained annotations. The annotation guidelines were designed with guidance by a domain expert, and the annotation is performed by two domain experts, resulting in a high-quality annotation, with agreement rate F-scores as high as 0.815. Full article
(This article belongs to the Special Issue Automatic Disinformation Detection on Social Media Platforms)
Show Figures

Figure 1

7 pages, 1264 KiB  
Data Descriptor
Data on Gastrointestinal and Claw Disorders as Possible Predictive Factors in Beef Cattle and Veal Calves’ Health and Welfare
by Luisa Magrin, Barbara Contiero, Giulio Cozzi and Flaviana Gottardo
Data 2022, 7(4), 43; https://0-doi-org.brum.beds.ac.uk/10.3390/data7040043 - 06 Apr 2022
Viewed by 1803
Abstract
Today, consumers have a growing concern about the welfare of beef cattle, and specific schemes have been proposed to assess their wellbeing during the fattening. On-farm assessments can be integrated and partially replaced by animal-based measures recorded postmortem at the abattoir. Postmortem organ [...] Read more.
Today, consumers have a growing concern about the welfare of beef cattle, and specific schemes have been proposed to assess their wellbeing during the fattening. On-farm assessments can be integrated and partially replaced by animal-based measures recorded postmortem at the abattoir. Postmortem organ inspection data are of value, as several lesions can be reflective of subclinical diseases not easily detected in the live animal. The present data collection aimed to evaluate the slaughterhouse prevalence and location of hoof, gastric, hepatic, and liver lesions in beef cattle and veal calves and retrospectively associated this information with the animals’ housing and feeding management systems. Individual data on gastrointestinal and claw disorders of beef cattle (bulls and heifers) and veal calves were collected through a postmortem inspection by trained veterinarians directly at the slaughter line. Around 15 animals/batch, belonging to 97 batches of young bulls, 56 batches of beef heifers, and 41 batches of veal calves were inspected in three slaughterhouses located in Northern Italy during 30 sampling days, and information on the animals’ rearing systems were gathered a posteriori from farmer interviews. The implementation of this recording system should promote a continuous improvement of beef cattle management from a health and welfare perspective. Full article
Show Figures

Figure 1

22 pages, 7069 KiB  
Data Descriptor
Climate Data to Support the Adaptation of Buildings to Climate Change in Canada
by Abhishek Gaur and Michael Lacasse
Data 2022, 7(4), 42; https://0-doi-org.brum.beds.ac.uk/10.3390/data7040042 - 06 Apr 2022
Cited by 7 | Viewed by 4769
Abstract
Climate change will continue to bring about unprecedented climate extremes in the future, and buildings and infrastructure will be exposed to such conditions. To ensure that new and existing buildings deliver satisfactory performance over their design lives, their performance under current and future [...] Read more.
Climate change will continue to bring about unprecedented climate extremes in the future, and buildings and infrastructure will be exposed to such conditions. To ensure that new and existing buildings deliver satisfactory performance over their design lives, their performance under current and future projected climates needs to be assessed by undertaking building simulations. This study prepares climate data needed for building simulations for 564 locations by bias-correcting the Canadian Regional Climate Model version 4 (CanRCM4) large ensemble (LE) simulations with reference to observations. Technical validation results show that bias-correction effectively reduces the bias associated with CanRCM4-LE simulations in terms of their marginal distributions and the inter-relationship between climate variables. To ensure that the range of projected climate change impacts are encompassed within these data sets, and to furthermore provide building moisture and energy reference years, the reference year files were prepared from bias-corrected CanRCM4-LE simulations and are comprised of a typical meteorological year for building energy applications, a typical and extreme moisture reference year, a typical downscaled year, an extreme warm year, and an extreme cold year. Full article
Show Figures

Figure 1

7 pages, 1238 KiB  
Data Descriptor
Dataset: Variable Message Signal Annotated Images for Object Detection
by Enrique Puertas, Gonzalo De-Las-Heras, Javier Sánchez-Soriano and Javier Fernández-Andrés
Data 2022, 7(4), 41; https://0-doi-org.brum.beds.ac.uk/10.3390/data7040041 - 01 Apr 2022
Cited by 2 | Viewed by 2852
Abstract
This publication presents a dataset consisting of Spanish road images taken from inside a vehicle, as well as annotations in XML files in PASCAL VOC format that indicate the location of Variable Message Signals within them. Additionally, a CSV file is attached with [...] Read more.
This publication presents a dataset consisting of Spanish road images taken from inside a vehicle, as well as annotations in XML files in PASCAL VOC format that indicate the location of Variable Message Signals within them. Additionally, a CSV file is attached with information regarding the geographic position, the folder where the image is located and the text in Spanish. This can be used to train supervised learning computer vision algorithms such as convolutional neural networks. Throughout this work, the process followed to obtain the dataset, image acquisition and labeling and its specifications are detailed. The dataset constitutes 1216 instances, 888 positives and 328 negatives, in 1152 jpg images with a resolution of 1280 × 720 pixels. These are divided into 756 real images and 756 images created from the data-augmentation technique. The purpose of this dataset is to help in road computer vision research since there is not one specifically for VMSs. Full article
Show Figures

Figure 1

7 pages, 1836 KiB  
Data Descriptor
Dataset of Annotated Virtual Detection Line for Road Traffic Monitoring
by Ivars Namatēvs, Roberts Kadiķis, Anatolijs Zencovs, Laura Leja and Artis Dobrājs
Data 2022, 7(4), 40; https://0-doi-org.brum.beds.ac.uk/10.3390/data7040040 - 31 Mar 2022
Cited by 2 | Viewed by 4035
Abstract
Monitoring, detection, and control of traffic is a serious problem in many cities and on roads around the world and poses a problem for effective and safe control and management of pedestrians with edge devices. Systems using the computer vision approach must ensure [...] Read more.
Monitoring, detection, and control of traffic is a serious problem in many cities and on roads around the world and poses a problem for effective and safe control and management of pedestrians with edge devices. Systems using the computer vision approach must ensure the safety of citizens and minimize the risk of traffic collisions. This approach is well suited for multiple object detection by automatic video surveillance cameras on roads, highways, and pedestrian walkways. A new Annotated Virtual Detection Line (AVDL) dataset is presented for multiple object detection, consisting of 74,108 data files and 74,108 manually annotated files divided into six classes: Vehicles, Trucks, Pedestrians, Bicycles, Motorcycles, and Scooters from the video. The data were captured from real road scenes using 50 video cameras from the leading video camera manufacturers at different road locations and under different meteorological conditions. The AVDL dataset consists of two directories, the Data directory and the Labels directory. Both directories provide the data as NumPy arrays. The dataset can be used to train and test deep neural network models for traffic and pedestrian detection, recognition, and counting. Full article
Show Figures

Figure 1

21 pages, 11095 KiB  
Article
OpenStreetMap Contribution to Local Data Ecosystems in COVID-19 Times: Experiences and Reflections from the Italian Case
by Marco Minghini, Alessandro Sarretta and Maurizio Napolitano
Data 2022, 7(4), 39; https://0-doi-org.brum.beds.ac.uk/10.3390/data7040039 - 31 Mar 2022
Cited by 7 | Viewed by 3376
Abstract
Data and digital technologies have been at the core of the societal response to COVID-19 since the beginning of the pandemic. This work focuses on the specific contribution of the OpenStreetMap (OSM) project to address the early stage of the COVID-19 crisis (approximately [...] Read more.
Data and digital technologies have been at the core of the societal response to COVID-19 since the beginning of the pandemic. This work focuses on the specific contribution of the OpenStreetMap (OSM) project to address the early stage of the COVID-19 crisis (approximately from February to May 2020) in Italy. Several activities initiated by the Italian OSM community are described, including: mapping ‘red zones’ (the first municipalities affected by the emergency); updating OSM pharmacies based on the authoritative dataset from the Ministry of Health; adding information on delivery services of commercial activities during COVID-19 times; publishing web maps to offer COVID-19-specific information at the local level; and developing software tools to help collect new data. Those initiatives are analysed from a data ecosystem perspective, identifying the actors, data and data flows involved, and reflecting on the enablers and barriers for their success from a technical, organisational and legal point of view. The OSM project itself is then assessed in the wider European policy context, in particular against the objectives of the recent European strategy for data, highlighting opportunities and challenges for scaling successful approaches such as those to fight COVID-19 from the local to the national and European scales. Full article
(This article belongs to the Special Issue A European Approach to the Establishment of Data Spaces)
Show Figures

Figure 1

16 pages, 7283 KiB  
Data Descriptor
Comprehensive Data via Spectroscopy and Molecular Dynamics of Chemically Treated Graphene Nanoplatelets
by Olasunbo Z. Farinre, Hawazin Alghamdi, Swapnil M. Mhatre, Mathew L. Kelley, Adam J. Biacchi, Albert V. Davydov, Christina A. Hacker, Albert F. Rigosi and Prabhakar Misra
Data 2022, 7(4), 38; https://0-doi-org.brum.beds.ac.uk/10.3390/data7040038 - 29 Mar 2022
Viewed by 2306
Abstract
Graphene nanoplatelets (GnPs) are promising candidates for gas sensing applications because they have a high surface area to volume ratio, high conductivity, and a high temperature stability. The information provided in this data article will cover the surface and structural properties of pure [...] Read more.
Graphene nanoplatelets (GnPs) are promising candidates for gas sensing applications because they have a high surface area to volume ratio, high conductivity, and a high temperature stability. The information provided in this data article will cover the surface and structural properties of pure and chemically treated GnPs, specifically with carboxyl, ammonia, nitrogen, oxygen, fluorocarbon, and argon. Molecular dynamics and adsorption calculations are provided alongside characterization data, which was performed with Raman spectroscopy, X-ray photoelectron spectroscopy (XPS), and X-ray diffraction (XRD) to determine the functional groups present and effects of those groups on the structural and vibrational properties. Certain features in the observed Raman spectra are attributed to the variations in concentration of the chemically treated GnPs. XRD data show smaller crystallite sizes for chemically treated GnPs that agree with images acquired with scanning electron microscopy. A molecular dynamics simulation is also employed to gain a better understanding of the Raman and adsorption properties of pure GnPs. Full article
Show Figures

Figure 1

Previous Issue
Next Issue
Back to TopTop