Genetic Variation between Triploid and Diploid Clarias gariepinus (Burchell, 1822) Using RAPD Markers

 ,
,
Abstract
:1. Introduction
2. Materials & Methods
2.1. Triploidy Induction of the Catfish
2.2. DNA Extraction
2.3. PCR Amplification
2.4. Genetic Data Analysis
3. Results and Discussion
4. Conclusions
Author Contributions
Funding
Institutional Review Board Statement
Informed Consent Statement
Data Availability Statement
Acknowledgments
Conflicts of Interest
References
- Rachel, M.J.; Mark, J.S.; John, W.H.; Daniel, D.H. Family, induction methodology and interaction effects on the performance of diploid and triploid chinook salmon (Oncorhynchus tshawytscha). Aquaculture 2004, 234, 123–142. [Google Scholar]
- Okomoda, V.T.; Aminath, L.; Oladimeji, A.S.; Abol-Munafi, A.B.; Alabi, K.I.; Ikhwanuddin, M.; Umaru, J.A.; Hassan, A.; Martins, C.O.; Shahreza, M.S. First report on successful triploidy induction in Clarias gariepinus (Burchell, 1822) using electroporation. Sci. Rep. 2020, 10, 2425. [Google Scholar] [CrossRef] [PubMed] [Green Version]
- Liu, W.; Heasman, M.; Simpson, R. Induction and evaluation of triploidy in the Australian blacklip abalone, Haliotis rubra: A preliminary study. Aquaculture 2004, 233, 79–92. [Google Scholar] [CrossRef]
- Okomoda, V.T.; Pradeep, P.J.; Oladimeji, A.S.; Abol-Munafi, A.B.; Alabi, K.I.; Ikhwanuddin, M.; Martins, C.O.; Umaru, J.A.; Hassan, A. Effect of Electric induced Triploidization on Sex ratio, Growth and Gonad Histology of Red hybrid Tilapia. Aquaculture 2020, 520, 734991. [Google Scholar] [CrossRef]
- Hassan, A.; Okomoda, V.T.; Pradeep, P.J. Triploidy induction by electric shock in Red hybrid Tilapia. Aquaculture 2018, 495, 823–830. [Google Scholar] [CrossRef]
- Normala, J.; Mohd, A.A.; Abol, M.A.B.; Nur, A.A.; Khor, W.; Okomoda, V.T.; Shahreza, M.S. Morphometric variations between triploid and diploid Clarias gariepinus (burchell, 1822). Croat. J. Fish. 2017, 75, 113–121. [Google Scholar] [CrossRef]
- Normala, J.; Mohd, A.A.; Abol, M.A.B.; Nur, A.A.; Khor, W.; Shahreza, M.S. It Is All In The Blood: Erythrocyte Characterization of Triploid and Diploid African Catfish, Clarias gariepinus. J. Fish. Aquat. Sci. 2016, 11, 425–431. [Google Scholar]
- Karami, A.; Christianus, A.; Ishak, Z.; Courtenay, S.C.; Syed, M.A.; Noor Azlina, M.; Noorshinah, H. Effect of triploidization on Juvenile African catfish. Aquac. Int. 2010, 18, 851–858. [Google Scholar] [CrossRef]
- Gheyas, A.A.; Mollah, M.F.A.; Hussain, M.G. Triploidy induction in Stinging catfish Heteropneustes fossilis using cold shock. Asian Fish. Sci. 2001, 14, 323–332. [Google Scholar]
- Barch, M.J.; Knusten, T.; Spurbeck, J.L. The AGT Cytogenetic Laboratory Manual, 3rd ed.; Raven: New York, NY, USA, 1997; pp. 25–50. [Google Scholar]
- Hlics, R.; Muhlig, P.; Claussen, U. The spreading of metaphases is a slow process which leads to a stretching of chromosomes. Cytogenet. Cell Genet. 1997, 76, 167–171. [Google Scholar] [CrossRef]
- Karami, A.; Araghi, P.E.; Syed, M.A.; Wilson, S.P. Chromosome preparation in fish: Effects of fish species and larval age. Int. Aquat. Res. 2015, 7, 201–210. [Google Scholar] [CrossRef] [Green Version]
- Shimizu, Y.; Oshiro, T.; Sakaizumi, M. Electrophoretic studies od diploid, triploid and tetraploid forms of the Japanese silver crucian carp, Carassius auratus langsdorfi. Jpn. J. Ichthyol. 1993, 40, 65–75. [Google Scholar]
- Alcantar-Vazquez, J.P.; Dumas, S.; Puente-Carreon, E.; Pliego-Cortés, H.S.; Peña, R. Induction of triploidy in spotted sand bass (Paralabrax maculatofasciatus Steindachner, 1868) by cold shock. Aquac. Res. 2008, 39, 59–63. [Google Scholar] [CrossRef]
- Jankun, M.; Kuzminski, H.; Furgala-Selezniow, G. Cytologic ploidy determination in fish—An example of two salmonid species. Environ. Biotechnol. 2007, 3, 52–56. [Google Scholar]
- Carman, O.; Oshiro, T.; Takashima, F. Variation in the maximum number of nucleoli in diploid and triploid common carp. Nippon Suisan Gakkaishi 1992, 58, 2303–2309. [Google Scholar] [CrossRef] [Green Version]
- Rocco, L.; Valentino, I.V.; Scapigliati, G.; Stingo, V. RAPD-PCR analysis for molecular characterization and genotoxic studies of a new marine fish cell line derived from Dicentrarchus labrax. Cytotechnology 2014, 66, 383–393. [Google Scholar] [CrossRef] [Green Version]
- Bardacki, F. The use of Random Amplified Polymorphic DNA (RAPD) markers in sex discrimination in Nile tilapia, Oreochromis niloticus (Pisces: Cichlidae). Turk. J. Biol. 2000, 24, 169–175. [Google Scholar]
- Liem, P.T. Breeding Performance and Traits Inheritance of Hybrid Catfish, Clarias macrocephalus and Clarias gariepinus. Ph.D. Thesis, Institute of Tropical Aquaculture, Universiti Malaysia Terengganu, Terengganu, Malaysia, 2008; 212p. [Google Scholar]
- Li, S.F.; Tang, S.J.; Cai, W.Q. Two Rapd-Scar Markers in New Gift Nile Tilapia (Oreochromis Niloticus) implication for selection tracking and strains identification. In Proceedings of the 8th International Symposium on Tilapia in Aquaculture, Cairo, Egypt, 12–14 October 2008; pp. 219–229. [Google Scholar]
- Hatanaka, T.; Galetti, P.M., Jr. RAPD markers indicate the occurrence of structured populations in a migratory freshwater fish species. Genet. Mol. Biol. 2003, 26, 19–25. [Google Scholar] [CrossRef]
- Klinbunga, S.; Yuvanatemiya, V.; Wongphayak, S.; Khetpu, K. Genetic population differentiation of the blue swimming crab Portunus pelagicus (Portunidae) in Thai waters revealed by RAPD analysis. Genet. Mol. Res. 2010, 9, 1615–1624. [Google Scholar] [CrossRef]
- Fagbenro, O.A.; Adedire, C.O.; Owoseeni, E.A.; Ayotunde, E.O. Studies on the biology and aquaculture potential of Feral Catfish Heterobanchus bidorsalis. Trop. Zool. 1993, 6, 67–69. [Google Scholar] [CrossRef] [Green Version]
- Sule, O.D.; Adikwu, I. Embryonic Development in Clarias gariepinus (Buchell, 1822) Under Laboratory Conditions. Anim. Res. Int. 2004, 1, 81–85. [Google Scholar] [CrossRef]
- Bielawski, J.P.; Dorothy, E.P. Randomly amplified polymorphic DNA (RAPD) analysis of Atlantic coast striped bass. Heredity 1997, 78, 32–40. [Google Scholar] [CrossRef] [PubMed]
- Jayasankar, P.; Thomas, P.C.; Paulton, M.P.; Mathew, J. Morphometric and genetic analyzes of Indian Mackerel (Rastrelliger kanagurta) from Peninsular India. India Asian Fish. Sci. 2004, 17, 201–215. [Google Scholar]
- Garg, R.K.; Silawat, N.; Sairkar, P.; Vijay, N.; Mehrotra, N.N. RAPD analysis for genetic diversity of two populations of Mystus vittatus (bloch) of Madhya Pradesh India. Afr. J. Biotechnol. 2009, 8, 4032–4038. [Google Scholar]
- Petjul, K.; Sangdee, A.; Thaewnon-ngiw, B. Using randomly amplified polymorphic DNA polymerase chain reaction of Barbodes spp in Thailand. Online J. Biol. Sci. 2011, 11, 1–6. [Google Scholar] [CrossRef] [Green Version]
- Zhang, G.; Yan, A.; Zou, G.; Luo, Z.; Huang, F. RAPD Analysis of Genetic Diversity of Inbreeding F1 Progeny in Two Artificial Gynogenetic Strains of Silver Carp. 2005. Available online: http://en.cnki.com.cn/Article_en/CJFDTOTAL-SCKX200502003.htm (accessed on 21 September 2012).
- Yue, G.H.; Li, Y.; Chao, T.M.; Chou, R.; Orban, L. Novel microsatellites from Asian sea bass (Lates calcarifer) and their application to broodstock analysis. J. Mar. Biotechnol. 2002, 4, 503–511. [Google Scholar] [CrossRef]
- Okomoda, V.T.; Koh, I.C.C.; Hassan, A.; Amornsakun, T.; Shahreza, M.S. Parentage analysis of the progenies of the reciprocal crosses of Pangasianodon hypophthalmus (Sauvage, 1878) and Clarias gariepinus (Burchell, 1822) using Cytochrome b gene. Jordan J. Biol. Sci. 2019, 12, 107–117. [Google Scholar]
- Romana-Eguia MR, R.; Ikeda, M.; Basiao, Z.U.; Taniguchi, N. Genetic diversity in farmed Asian Nile and red hybrid tilapia stocks evaluated from microsatellite and mitochondrial DNA analysis. Aquaculture 2004, 236, 131–150. [Google Scholar] [CrossRef]


| SN | Primers | No. of Fragment | Fragment Size (bp) | Percentage of Polymorphism | SN | Primers | No. of Fragment | Fragment Size (bp) | Percentage of Polymorphism |
| 1 | OPA-01 | 14 | 400–3000 | 21.43 | 1 | OPB-01 | 22 | 300–2200 | 36.36 |
| 2 | OPA-02 | 10 | 550–2100 | 60.00 | 2 | OPB-02 | 20 | 390–3000 | 25.00 |
| 3 | OPA-03 | 12 | 450–1500 | 33.33 | 3 | OPB-03 | 19 | 320–2600 | 52.63 |
| 4 | OPA-04 | 6 | 340–1000 | 50.00 | 4 | OPB-04 | 25 | 200–3000 | 36.00 |
| 5 | OPA-05 | 17 | 280–2500 | 41.18 | 5 | OPB-05 | 20 | 320–2600 | 55.00 |
| 6 | OPA-06 | 19 | 250–2700 | 42.11 | 6 | OPB-06 | 21 | 300–2000 | 38.10 |
| 7 | OPA-07 | 20 | 400–3000 | 20.00 | 7 | OPB-07 | 16 | 180–1400 | 18.75 |
| 8 | OPA-08 | 21 | 280–2500 | 42.86 | 8 | OPB-08 | 20 | 300–2500 | 30.00 |
| 9 | OPA-09 | 11 | 250–1700 | 27.27 | 9 | OPB-09 | 16 | 700–2500 | 43.75 |
| 10 | OPA-10 | 15 | 340–2500 | 26.67 | 10 | OPB-10 | 22 | 350–2300 | 18.18 |
| 11 | OPA-11 | 19 | 350–3000 | 36.84 | 11 | OPB-11 | 23 | 200–2700 | 39.13 |
| 12 | OPA-12 | 20 | 250–3000 | 45.00 | 12 | OPB-12 | 24 | 200–2400 | 25.00 |
| 13 | OPA-13 | 15 | 300–2700 | 40.00 | 13 | OPB-13 | 14 | 370–3000 | 50.00 |
| 14 | OPA-14 | 20 | 300–1800 | 30.00 | 14 | OPB-14 | 14 | 300–3000 | 42.86 |
| 15 | OPA-15 | 17 | 350–3000 | 35.29 | 15 | OPB-15 | 17 | 330–1700 | 23.53 |
| 16 | OPA-16 | 21 | 190–3000 | 33.33 | 16 | OPB-16 | 13 | 350–2500 | 71.43 |
| 17 | OPA-17 | 21 | 230–3000 | 38.10 | 17 | OPB-17 | 17 | 300–2000 | 23.53 |
| 18 | OPA-18 | 15 | 250–2500 | 46.67 | 18 | OPB-18 | 17 | 350–2000 | 11.76 |
| 19 | OPA-19 | 17 | 200–3000 | 29.41 | 19 | OPB-19 | 22 | 230–2500 | 50.00 |
| 20 | OPA-20 | 17 | 250–3000 | 41.18 | 20 | OPB-20 | 18 | 300–2700 | 50.00 |
| SN | Primers | No. of Fragment | Fragment Size (bp) | Percentage of Polymorphism | SN | Primers | No. of Fragment | Fragment Size (bp) | Percentage of Polymorphism |
| 1 | OPC-01 | 20 | 200–2500 | 35.00 | 1 | OPD-01 | 20 | 500–2800 | 55.00 |
| 2 | OPC-02 | 17 | 300–1700 | 17.65 | 2 | OPD-02 | 22 | 270–2700 | 45.45 |
| 3 | OPC-03 | 17 | 490–3000 | 29.41 | 3 | OPD-03 | 18 | 350–2300 | 33.33 |
| 4 | OPC-04 | 21 | 300–2400 | 23.81 | 4 | OPD-04 | 16 | 300–2300 | 56.25 |
| 5 | OPC-05 | 26 | 200–2500 | 46.15 | 5 | OPD-05 | 17 | 270–2700 | 58.82 |
| 6 | OPC-06 | 19 | 380–3000 | 31.58 | 6 | OPD-06 | 05 | 400–1100 | 60.00 |
| 7 | OPC-07 | 18 | 450–2500 | 27.78 | 7 | OPD-07 | 15 | 370–2600 | 46.67 |
| 8 | OPC-08 | 23 | 220–2500 | 56.52 | 8 | OPD-08 | 18 | 220–1800 | 27.78 |
| 9 | OPC-09 | 17 | 300–3000 | 17.65 | 9 | OPD-09 | 19 | 350–3000 | 47.37 |
| 10 | OPC-10 | 23 | 350–2700 | 21.74 | 10 | OPD-10 | 22 | 350–2700 | 54.55 |
| 11 | OPC-11 | 19 | 320–3000 | 26.32 | 11 | OPD-11 | 22 | 300–3000 | 45.45 |
| 12 | OPC-12 | 19 | 390–2500 | 52.63 | 12 | OPD-12 | 20 | 300–3000 | 75.00 |
| 13 | OPC-13 | 20 | 200–2300 | 25.00 | 13 | OPD-13 | 15 | 470–2200 | 20.00 |
| 14 | OPC-14 | 21 | 300–2500 | 61.90 | 14 | OPD-14 | 13 | 300–2500 | 46.15 |
| 15 | OPC-15 | 21 | 320–2700 | 38.10 | 15 | OPD-15 | 19 | 390–2700 | 26.32 |
| 16 | OPC-16 | 20 | 210–3000 | 45.00 | 16 | OPD-16 | 18 | 280–2500 | 33.33 |
| 17 | OPC-17 | 18 | 300–2500 | 38.89 | 17 | OPD-17 | 12 | 410–2300 | 50.00 |
| 18 | OPC-18 | 15 | 300–1800 | 20.00 | 18 | OPD-18 | 18 | 190–2300 | 22.22 |
| 19 | OPC-19 | 20 | 300–2000 | 25.00 | 19 | OPD-19 | 24 | 400–2700 | 41.67 |
| 20 | OPC-20 | 20 | 320–2400 | 30.00 | 20 | OPD-20 | 21 | 250–2500 | 19.05 |
| Primer | Sequence (5′ to 3′) | Number of Fragment | Fragment Size (bp) | Percentage of Polymoprphism (%) | Number of Genotypte |
|---|---|---|---|---|---|
| OPB 16 | TTTGCCCGGA | 20 | 350–2500 | 80.00 | 48 |
| OPC 14 | TGCGTGCTTG | 35 | 300–2700 | 91.40 | 59 |
| OPD 12 | CACCGTATCC | 24 | 350–3000 | 91.67 | 52 |
| (a) | |||||||||||||||||||||||||||
| Genotype | 1 | 2 | 3 | 4 | 5 | 6 | 7 | 8 | 9 | 10 | 11 | 12 | 13 | 14 | 15 | 16 | 17 | 18 | 19 | 20 | 21 | 22 | 23 | 24 | 25 | ||
| Triploid | 1 | 1 | 1 | 1 | 1 | 1 | 1 | 1 | 1 | 1 | 1 | 1 | 1 | ||||||||||||||
| Diploid | 1 | 1 | 1 | 1 | 1 | 1 | 1 | 1 | 1 | 1 | 1 | 1 | |||||||||||||||
| Genotype | 26 | 27 | 28 | 29 | 30 | 31 | 32 | 33 | 34 | 35 | 36 | 37 | 38 | 39 | 40 | 41 | 42 | 43 | 44 | 45 | 46 | 47 | 48 | ||||
| Triploid | 1 | 1 | 1 | 1 | 1 | 1 | 1 | 1 | 1 | ||||||||||||||||||
| Diploid | 1 | 1 | 1 | 1 | 1 | 1 | 1 | 1 | 1 | 1 | 1 | 1 | 1 | 1 | |||||||||||||
| (b) | |||||||||||||||||||||||||||
| Genotype | 1 | 2 | 3 | 4 | 5 | 6 | 7 | 8 | 9 | 10 | 11 | 12 | 13 | 14 | 15 | 16 | 17 | 18 | 19 | 20 | 21 | 22 | 23 | 24 | 25 | ||
| Triploid | 1 | 1 | 1 | 1 | 1 | 1 | 1 | 1 | 1 | 1 | 1 | 1 | 1 | 1 | 1 | 1 | |||||||||||
| Diploid | 1 | 1 | 1 | 1 | 1 | 1 | 1 | 1 | 1 | ||||||||||||||||||
| Genotype | 26 | 27 | 28 | 29 | 30 | 31 | 32 | 33 | 34 | 35 | 36 | 36 | 37 | 38 | 39 | 40 | 41 | 42 | 43 | 44 | 45 | 46 | 47 | 48 | |||
| Triploid | 1 | 1 | 1 | 1 | 1 | 1 | 1 | 1 | 1 | 1 | 1 | ||||||||||||||||
| Diploid | 1 | 1 | 1 | 1 | 1 | 1 | 1 | 1 | 1 | 1 | 1 | 1 | 1 | ||||||||||||||
| Genotype | 49 | 50 | 51 | 52 | 53 | 54 | 55 | 56 | 57 | 58 | 59 | ||||||||||||||||
| Triploid | 1 | 1 | 1 | ||||||||||||||||||||||||
| Diploid | 1 | 1 | 1 | 1 | 1 | 1 | 1 | 1 | |||||||||||||||||||
| (c) | |||||||||||||||||||||||||||
| Genotype | 1 | 2 | 3 | 4 | 5 | 6 | 7 | 8 | 9 | 10 | 11 | 12 | 13 | 14 | 15 | 16 | 17 | 18 | 19 | 20 | 21 | 22 | 23 | 24 | 25 | 26 | 27 |
| Triploid | 1 | 1 | 1 | 1 | 1 | 1 | 1 | 1 | 1 | 1 | 1 | 1 | 1 | 1 | |||||||||||||
| Diploid | 1 | 1 | 1 | 1 | 1 | 1 | 1 | 1 | 1 | 1 | 1 | 1 | 1 | ||||||||||||||
| Genotype | 28 | 29 | 30 | 31 | 32 | 33 | 34 | 35 | 36 | 37 | 38 | 39 | 40 | 41 | 42 | 43 | 44 | 45 | 46 | 47 | 48 | 49 | 50 | 51 | 52 | ||
| Triploid | 1 | 1 | 1 | 1 | 1 | 1 | 1 | 1 | |||||||||||||||||||
| Diploid | 1 | 1 | 1 | 1 | 1 | 1 | 1 | 1 | 1 | 1 | 1 | 1 | 1 | 1 | 1 | 1 | 1 | ||||||||||
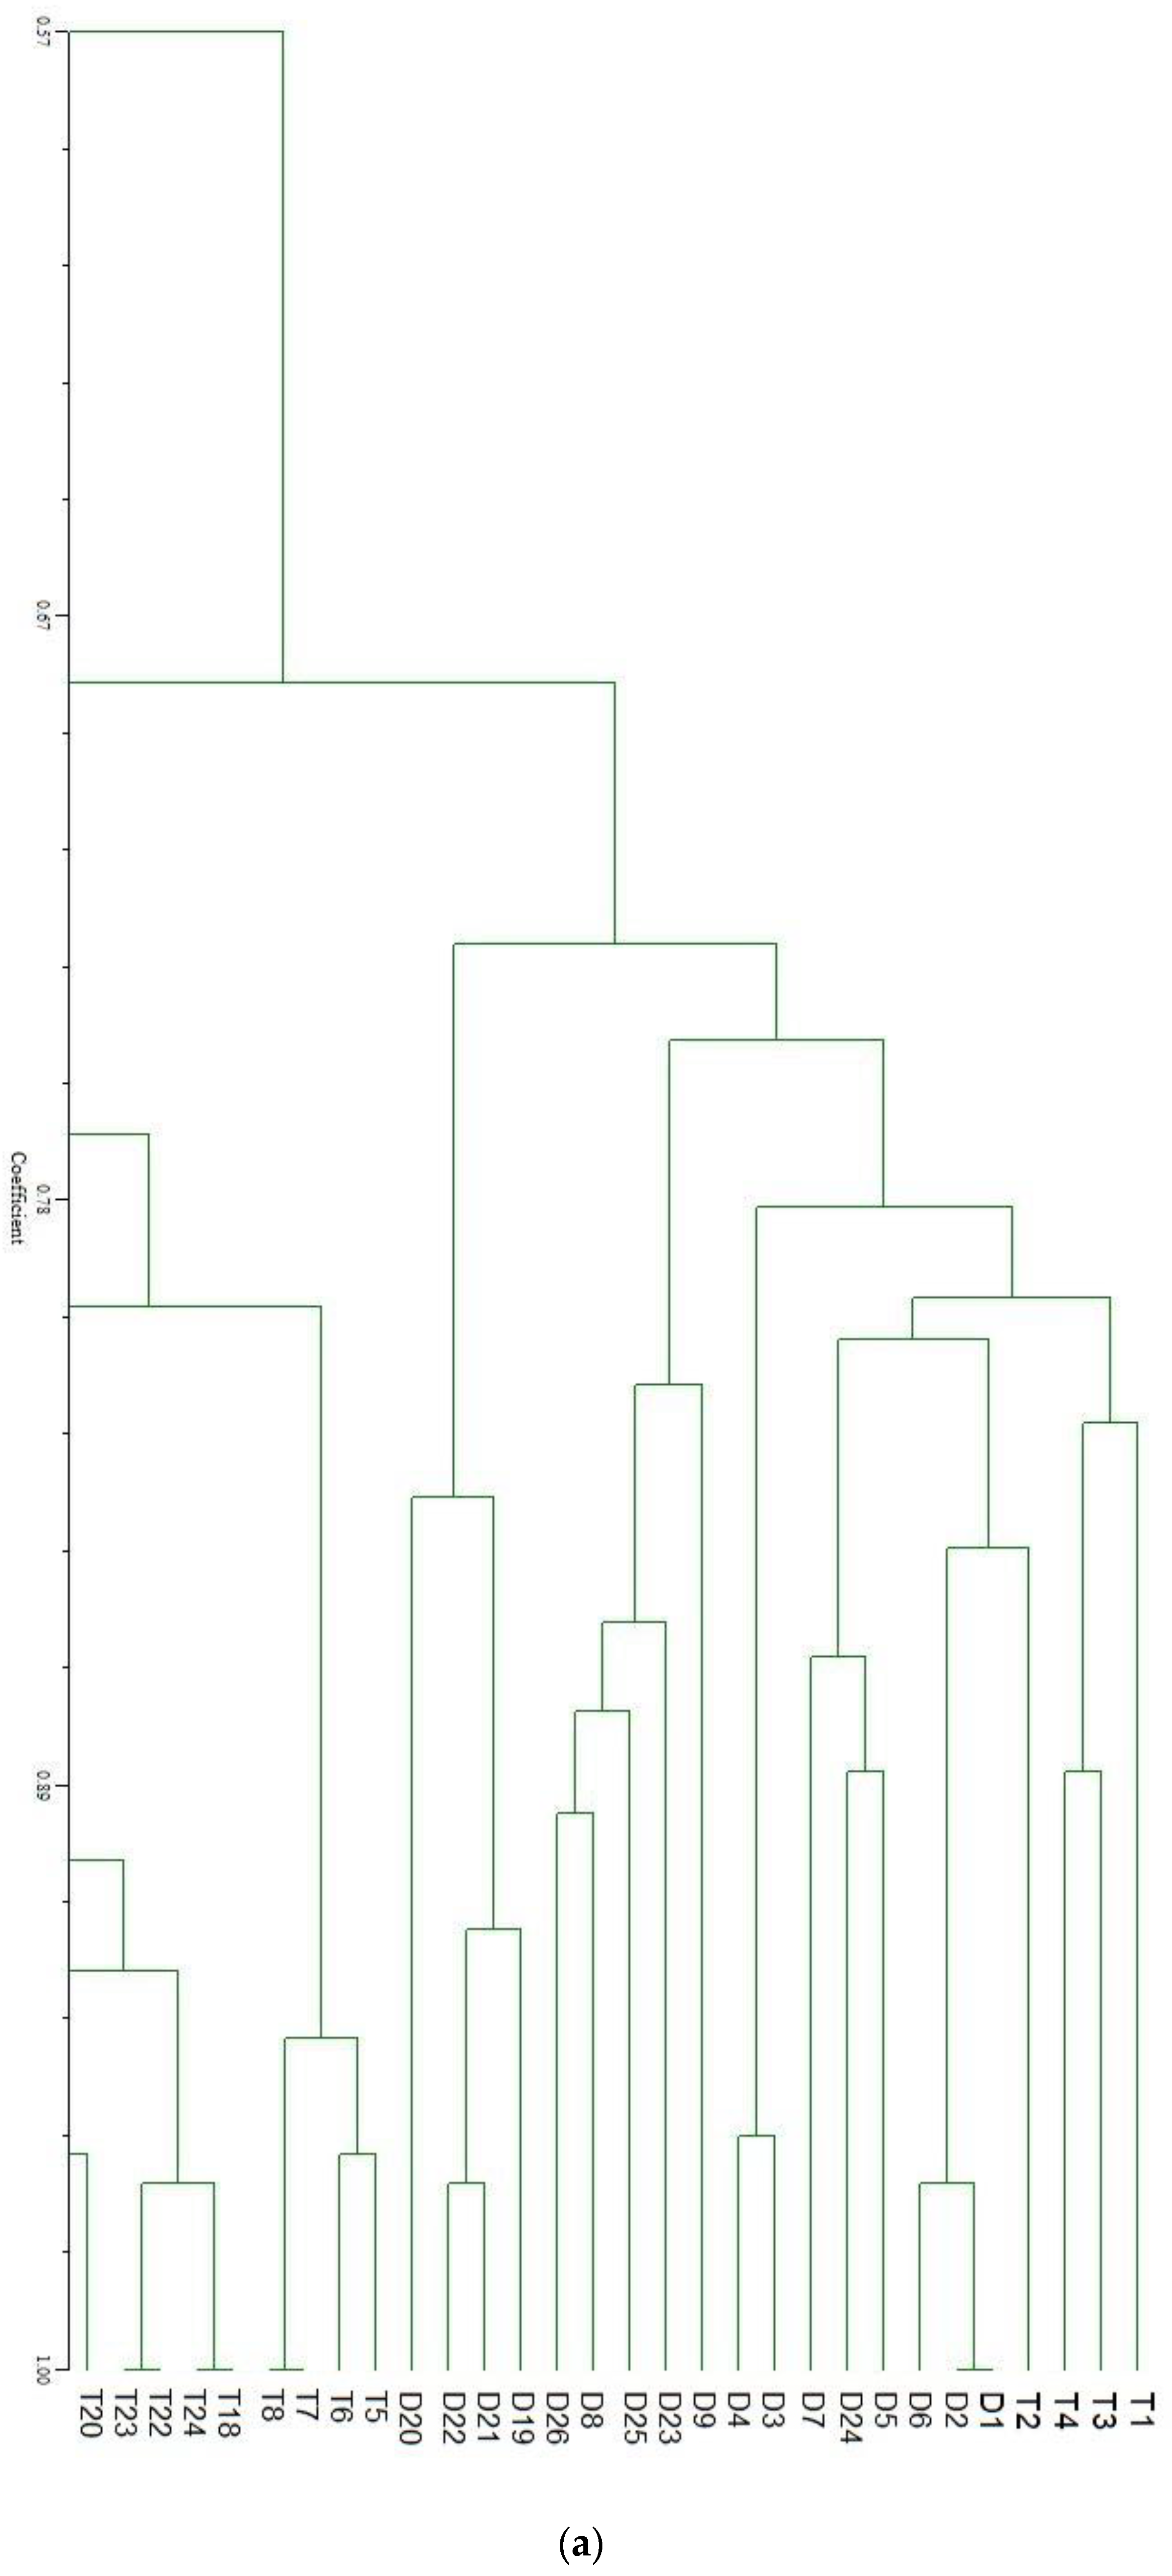
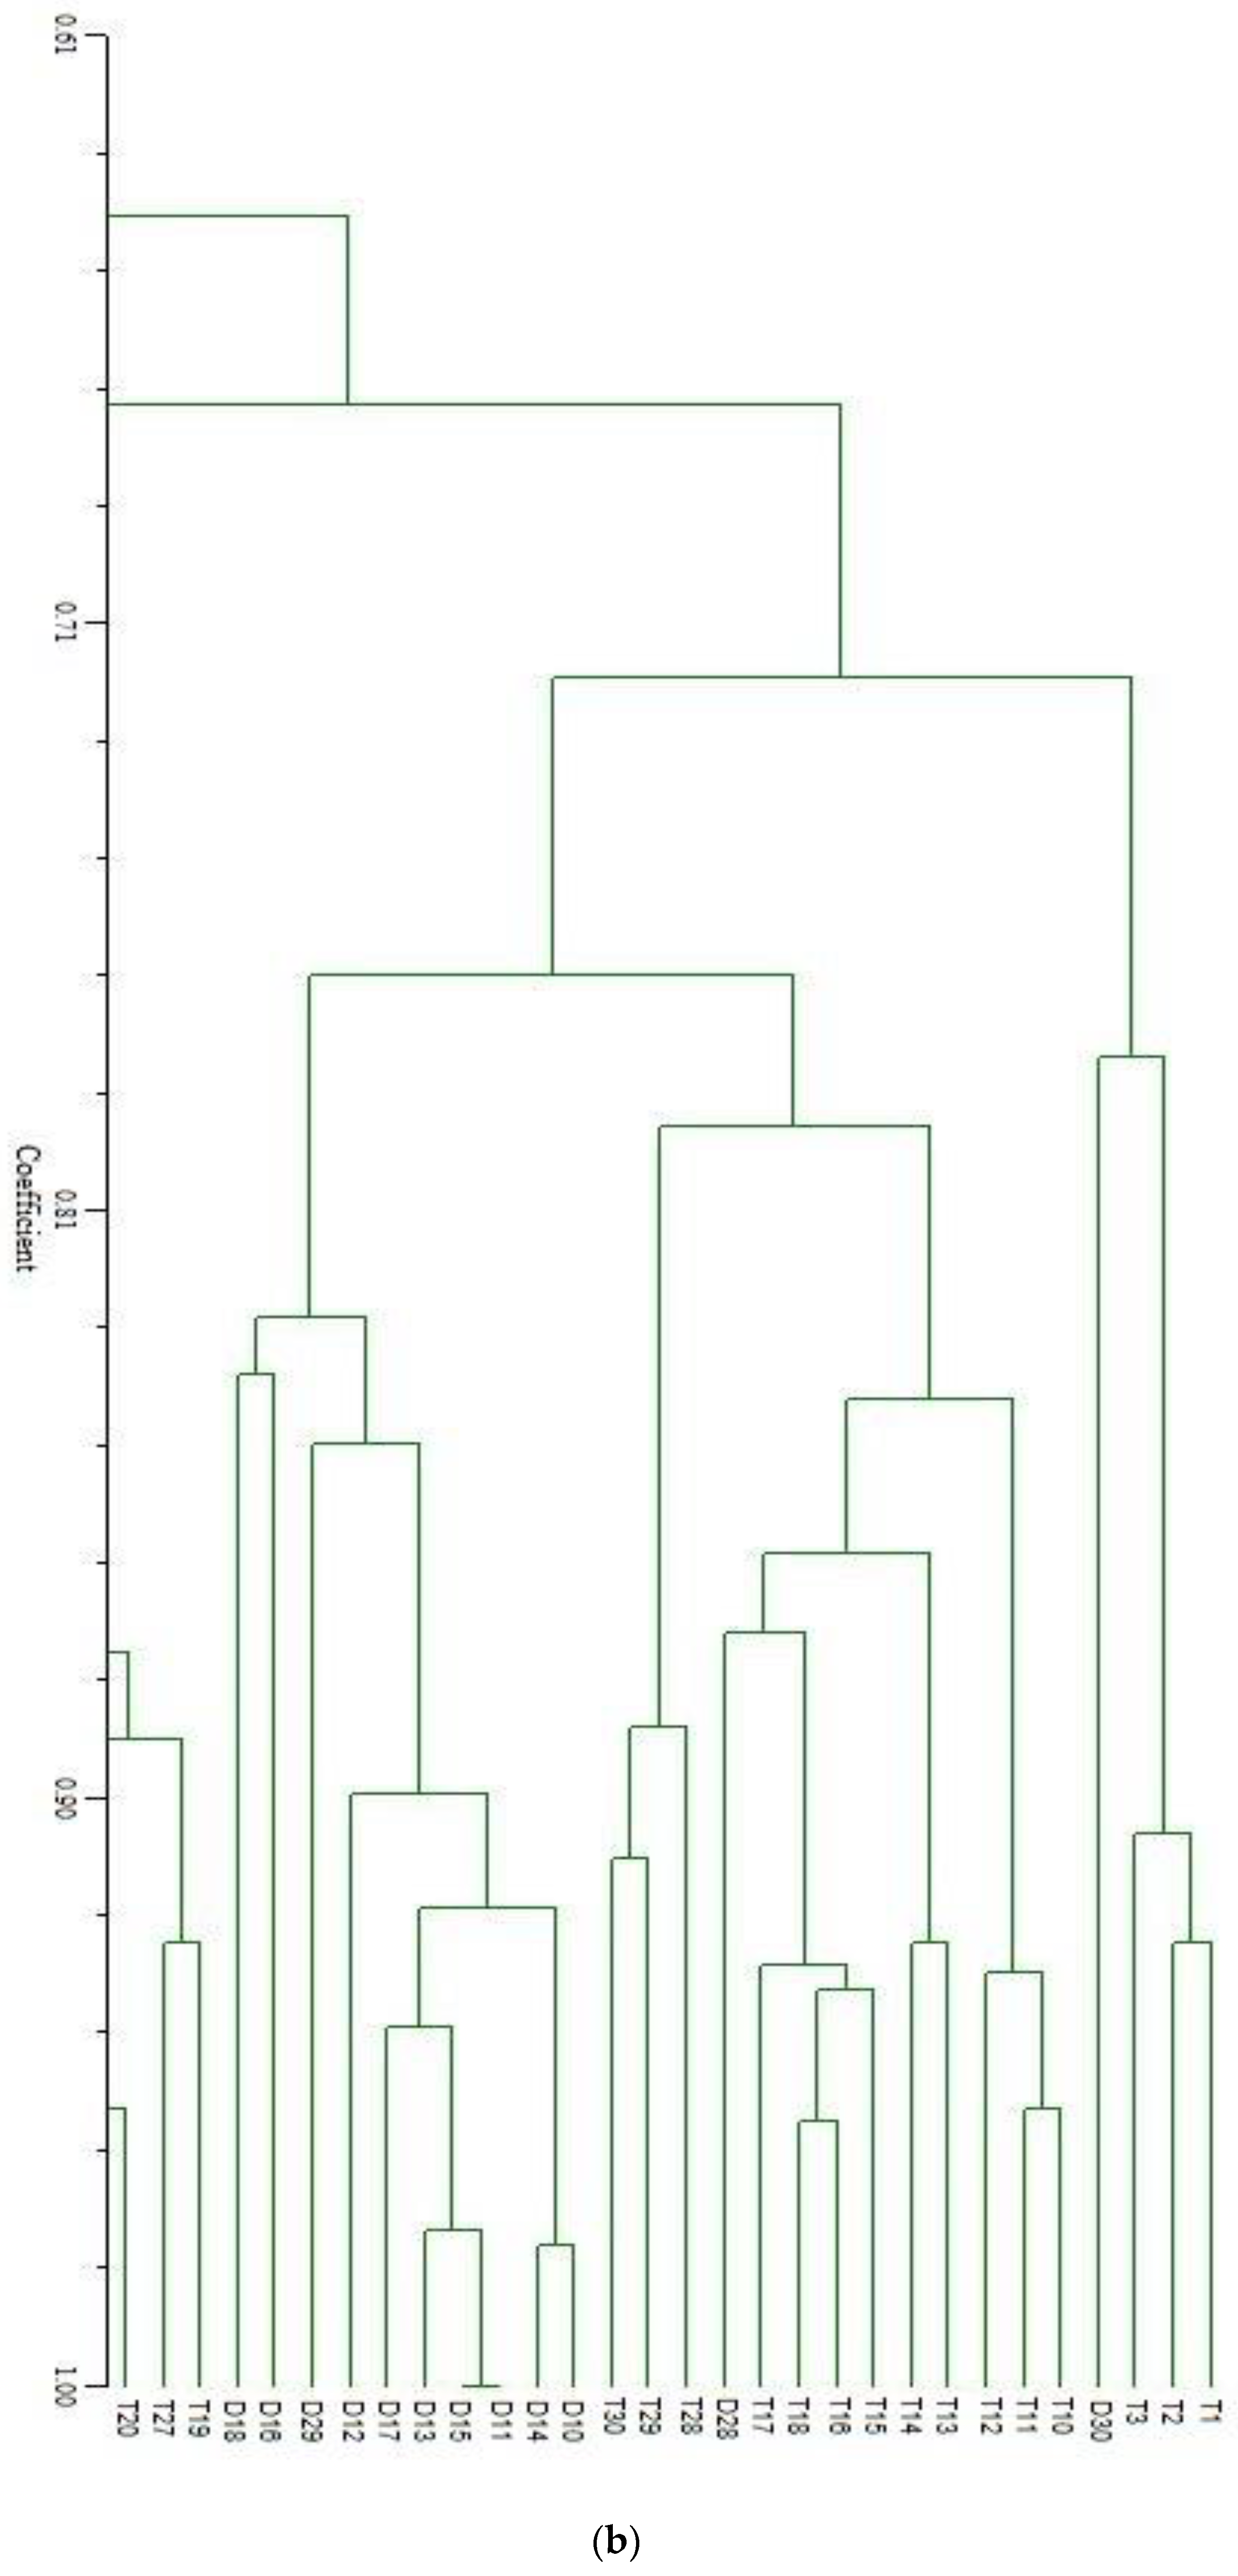
| Primer | Triploid Population | Diploid Population | Triploid and Diploid Population |
|---|---|---|---|
| OPB16 | 0.370–0.969 | 0.333–0.968 | 0.348–0.897 |
| OPC14 | 0.432–0.956 | 0.457–0.976 | 0.378–0.913 |
| OPD12 | 0.667–0.971 | 0.483–0.968 | 0.533–0.968 |
Publisher’s Note: MDPI stays neutral with regard to jurisdictional claims in published maps and institutional affiliations. |
© 2021 by the authors. Licensee MDPI, Basel, Switzerland. This article is an open access article distributed under the terms and conditions of the Creative Commons Attribution (CC BY) license (http://creativecommons.org/licenses/by/4.0/).
Share and Cite
Normala, J.; Okomoda, V.T.; Mohd, A.A.; Nur, A.A.; Abol-Munafi, A.B.; Md Sheriff, S. Genetic Variation between Triploid and Diploid Clarias gariepinus (Burchell, 1822) Using RAPD Markers. Vet. Sci. 2021, 8, 75. https://0-doi-org.brum.beds.ac.uk/10.3390/vetsci8050075
Normala J, Okomoda VT, Mohd AA, Nur AA, Abol-Munafi AB, Md Sheriff S. Genetic Variation between Triploid and Diploid Clarias gariepinus (Burchell, 1822) Using RAPD Markers. Veterinary Sciences. 2021; 8(5):75. https://0-doi-org.brum.beds.ac.uk/10.3390/vetsci8050075
Chicago/Turabian StyleNormala, Jalil, Victor Tosin Okomoda, Azizul Alim Mohd, Asma Ariffin Nur, Ambok Bolong Abol-Munafi, and Shahreza Md Sheriff. 2021. "Genetic Variation between Triploid and Diploid Clarias gariepinus (Burchell, 1822) Using RAPD Markers" Veterinary Sciences 8, no. 5: 75. https://0-doi-org.brum.beds.ac.uk/10.3390/vetsci8050075