Interactions between a H2 Molecule and Carbon Nanostructures: A DFT Study


1
Department of Materials Science, Montanuniversität Leoben, Franz-Josef-Straße 18, A-8700 Leoben, Austria
2
Materials Center Leoben Forschung GmbH, Roseggerstraße 12, A-8700 Leoben, Austria
*
Author to whom correspondence should be addressed.
C 2020, 6(1), 16; https://0-doi-org.brum.beds.ac.uk/10.3390/c6010016
Submission received: 24 February 2020
/
Revised: 18 March 2020
/
Accepted: 18 March 2020
/
Published: 24 March 2020
(This article belongs to the Collection Carbon-Based Materials for Hydrogen Production, Storage and Conversion)
Abstract
:On a long path of finding appropriate materials to store hydrogen, graphene and carbon nanotubes have drawn a lot of attention as potential storage materials. Their advantages lie at hand since those materials provide a large surface area (which can be used for physisorption), are cheap compared to metal hydrides, are abundant nearly everywhere, and most importantly, can increase safety to existing storage solutions. Therefore, a great variety of theoretical studies were employed to study those materials. After a benchmark study of different van-der-Waals corrections to Generalized Gradient Approximation (GGA), the present Density Functional Theory (DFT) study employs Tkatchenko–Scheffler (TS) correction to study the influence of vacancy and Stone–Wales defects in graphene on the physisorption of the hydrogen molecule. Furthermore, we investigate a large-angle (1,0) grain boundary as well as the adsorption behaviour of Penta-Octa-Penta (POP)-graphene.
1. Introduction
On the quest for environmentally-friendly energy generation, chemical energy released during formation of a water molecule out of hydrogen atoms reacting with atmospheric oxygen has been proposed as a possible route. For any practical usage, however, it is critical to solve a question of storing hydrogen. The currently available technology using high-pressure tanks is too risky for, e.g., automobile applications, and therefore alternative solutions are needed. Here, carbon-based nano-structured materials have been suggested as promising candidates for hydrogen storage [1]. In fact, it was the discoverers [2] of graphene themselves, who first showed that the novel 2D material could store hydrogen easily at cryogenic temperatures and release it again at higher temperatures [3]. Consequently, the adsorption properties of pristine graphene [4,5,6,7,8,9] were extensively studied previously both experimentally as well as theoretically. In order to tune the material response further, chemical as well as structural modifications to graphene can be introduced. These include, e.g., metal decoration [10,11,12,13] or application of perforated graphene [14,15]. The present study thus focuses on the latter area which has not been thoroughly explored yet. In doing so, we consider impact of structural defects on the local adsorption properties and try to extract simple rule-of-thumb guidelines which can be used to steer further optimization of the carbon-based materials for H storage.
Namely, we investigated a single vacancy and a Stone–Wales defect [16,17] as examples for point defects. As a more complex structural line defect, we considered also an energetically favorable [18] symmetric large angle grain boundary composed of (1,0) dislocations. Such defects in graphene were studied before with respect to their impact on mechanical or electronic properties [18,19,20,21,22], here we newly present their impact on the H adsorption capacity of graphene. Based on the results obtained from the (1,0) grain boundary we furthermore investigated Penta-Octa-Penta (POP-)graphene as a graphene modification containing no hexagons, which was theoretically predicted by Wang et al. and proposed to be a promising candidate for lithium-ion batteries [23].
All our calculations include an impact of long-range dispersion (van-der-Waals) forces as an add-on to standard density functional theory calculations using Tkatchenko–Scheffler (TS) method [24]. As this method is not (yet) widely employed, we started with a benchmark study of the hydrogen adsorption on pristine graphene, whereby we could compare our data with literature data [4], which provides a useful reference for any future studies using TS method.
Finally, in order to explain the different adsorption behavior of the studied structural defects, we implemented the TS method using the SciPy [25,26] stack, by which we can demonstrate that the changes in electronic structure result in only minor contributions to the van-der-Waals-like interactions.
2. Computational Methods
All quantum-mechanical calculations were carried out with the Vienna Ab-initio Simulation Package (VASP) [27,28]. The exchange and correlation functional was treated at generalized gradient approximation level parametrised by Perdew–Burke–Ernzerhof (PBE-GGA) [29,30]. The projector augmented wave (PAW) method [31,32] was used to describe the electron-ion interactions. The used cutoff energy of the plane-wave basis set was tested for convergence of the total energy to ≈0.1 meV/at. The tests were carried out by employing -centred k-mesh sampling of the Brillouin zone for hexagonal cells (graphene), and Monkhorst-Pack [33] mesh for rectangular cells. The meshes used in the present study are summarized in Table 1. In order to take into account also the van-der-Waals interaction, various dispersion correction methods (DFT-D2 [34], DFT-D3 [35], DFT-TS [24,36]) implemented in VASP were tested for their ability to reproduce experimental lattice parameters of graphite and graphene. The results of the benchmark study are shown in Table A1. Based on these results, all subsequent geometric optimizations were performed using the Tkatchenko-Scheffler (DFT-TS) method, performance of which was assessed already in various previous studies for carbon structures [37,38,39]. Geometric optimizations were carried out by employing a conjugate gradient algorithm with an energy convergence criterion of eV (per simulation box). The energy convergence criterion for self-consistency of the electronic loop was set eV (per simulation box). To minimize periodic-boundary image interactions we used a 25 Å vacuum layer along the c axis for all cells, as well as a supercell of a standard 2-atom graphene unit cell.
2.1. Graphene Adsorption Curves
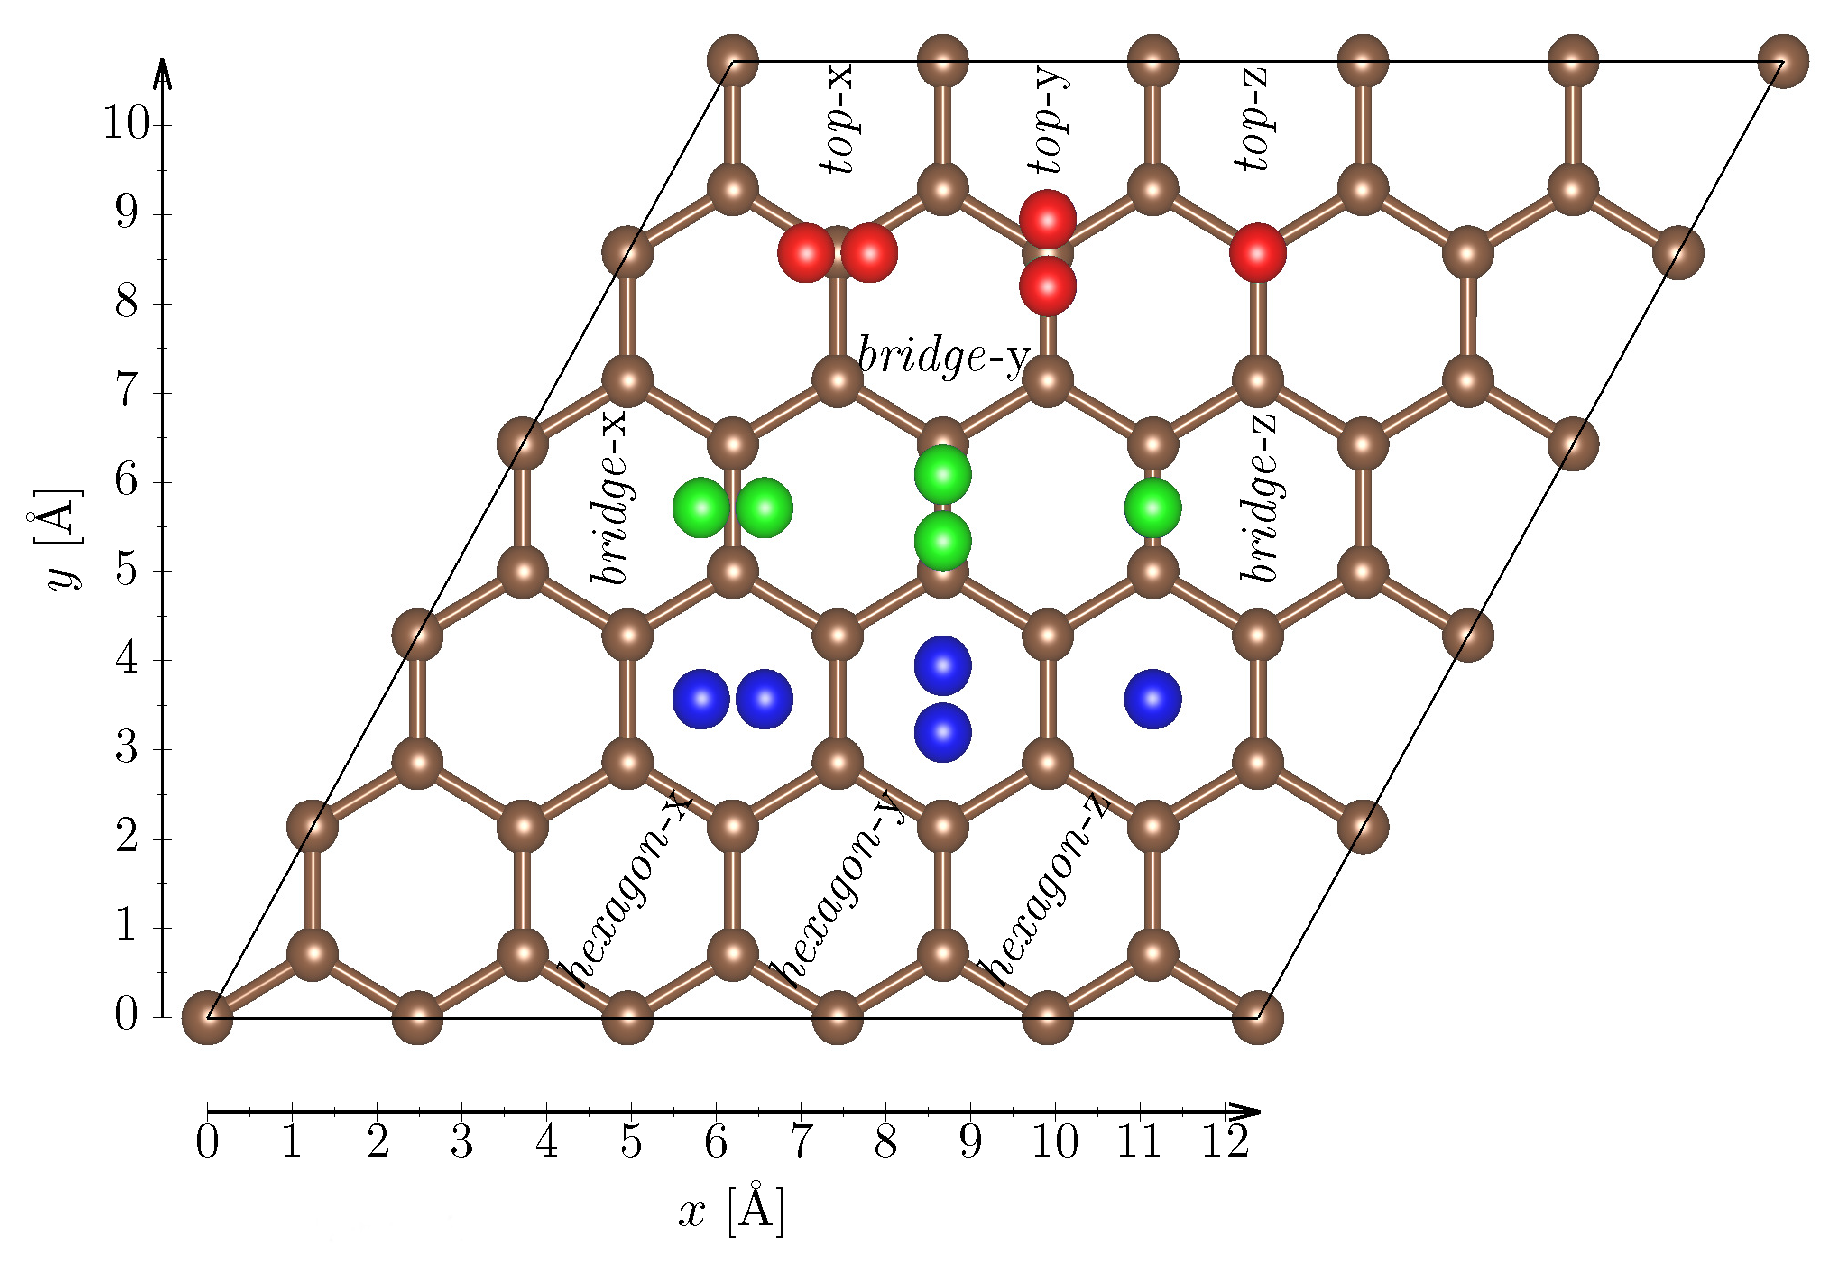
In order to study the adsorption of the H molecule, the hydrogen molecule was placed in different alignments on three different adsorption sites (Figure 1). Directly above a carbon atom, hereafter referred to as a top site, above a bond between two carbon atoms (a bridge site) and above the centre of a hexagon (a hexagon site). In the x(y)-alignment, the H molecule longitudinal axis is parallel(perpendicular) to the a lattice vector, while in the v-alignment the molecule is parallel to the c lattice vector of the simulation cell. Here we note that all other papers just examine only 6 different configurations [4,40,41,42], corresponding to the three adsorption sites and x and v-alignments. Indeed, also our calculations show that the x and y alignments yield identical results, and therefore hereafter we present them as h-alignment. We also note that our setup could, in principle, provide also information as a function of rotational degree of freedom similar to, e.g., Ref. [43]. However, in the case of the adsorption maps being investigated here, such procedure becomes computationally prohibitive and hence we stick to one special alignment. For each of the resulting 9 H configurations, the following procedure was applied:
- Fully relax the position and geometry of the H molecule, while keeping the C atoms in the graphene plane fixed.
- Vary the height of the molecule with fixed geometry above the graphene sheet ranging from 2 Å to 12 Å.
- Calculate the interaction energy as:
where refers to the bond-length obtained from the full relaxation of the molecule. The energy for the hydrogen molecule with bond-length of , which corresponds to the theoretical equilibrium bond-length, was obtained from a separate calculation. Therefore, the two H atoms of an isolated H molecule were separated, while for each separation the total energy was calculated. To obtain consistent results we employed DFT-TS correction, with a -point only k-mesh to avoid interactions originating from periodic boundary conditions.
In the following paragraphs, refers to the minimum of the interaction energy curve , where the height above the graphene plane, , denotes the vertical distance between graphene and the center of mass of the H molecule.
2.2. Adsorption Maps
All adsorption maps shown in this work have been calculated with z-direction (perpendicular to the graphene plane) H molecule alignment, in order provide data which is comparable to literature. In order to minimize computational effort, only an irreducible wedge of the supercell was sampled for each system and subsequently unfolded to span the whole supercell (see Table 2). For each sampling point, adsorption energy was calculated for at least 7 different molecule heights around the expected minimum, and fitted with a cubic fit in order to obtain the corresponding adsorption energy and height. Figure 3 shows clips of the calculated adsorption maps.
3. Results
3.1. Hydrogen Adsorption on Pristine Graphene
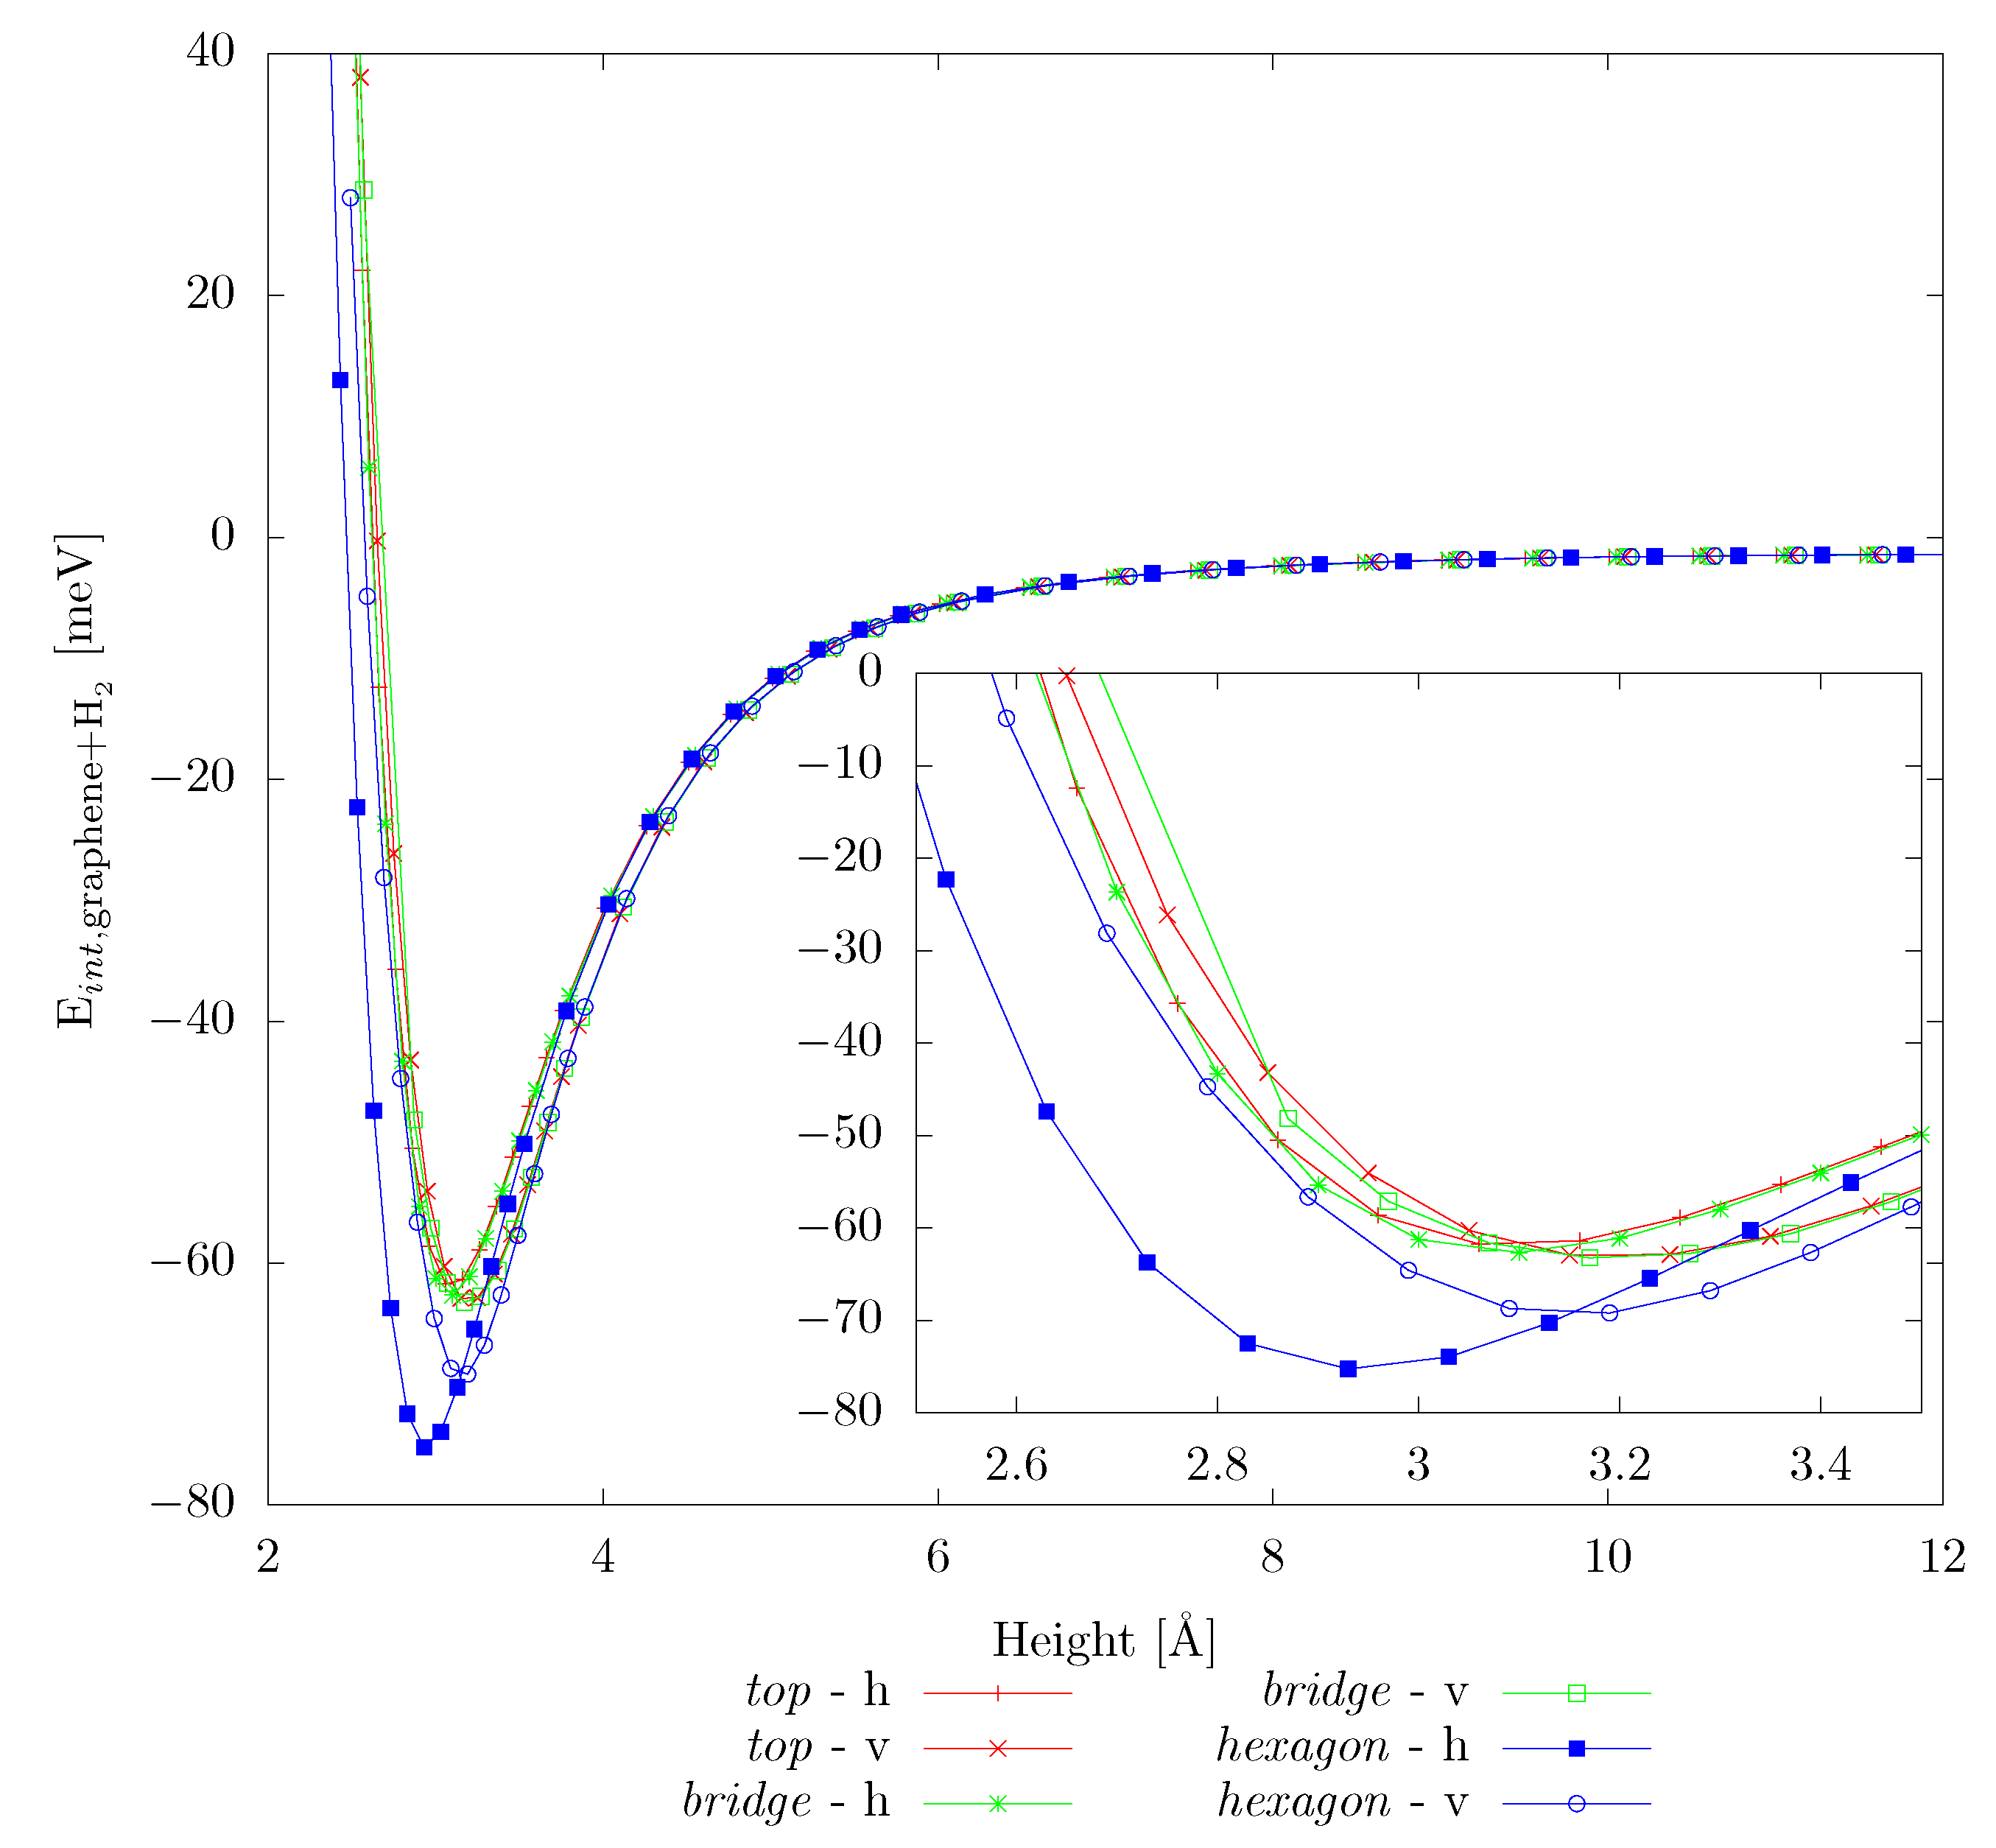
As mentioned above, we start with testing the DFT-TS method against literature data, which was obtained by employing Grimme’s D3 method (DFT-D3). Similarly to the previous works [4,8,40,41,42,44], we consider 3 high-symmetry adsorption sites (hexagon–centre of a hexagon, top–above a C atom, bridge–above a C–C bond), with both horizontal and vertical molecule alignment. The results for H physisorption on pristine graphene are summarized in Table 3 and the complete adsorption curves are shown Figure 2. Our values are in good agreement with previous works [4,42], however our work suggests the hexagon-h alignment to be the most favorable in contrast to the hexagon-v geometries reported previously. We note that also the equilibrium adsorption heights are in reasonable agreement between the DFT-TS (used in the present study) and DFT-D3 employed previously [41,42], except for the hexagon-h arrangement. Here, the DFT-TS yields somewhat tighter binding ( compared to for the DFT-D3 method), as well as a stronger adsorption tendency. The same study was also carried out for POP-graphene, with in total nine adsorption sites (Figure A1). The corresponding results are shown in Figure A2.
3.2. Adsorption Maps and Pristine Graphene
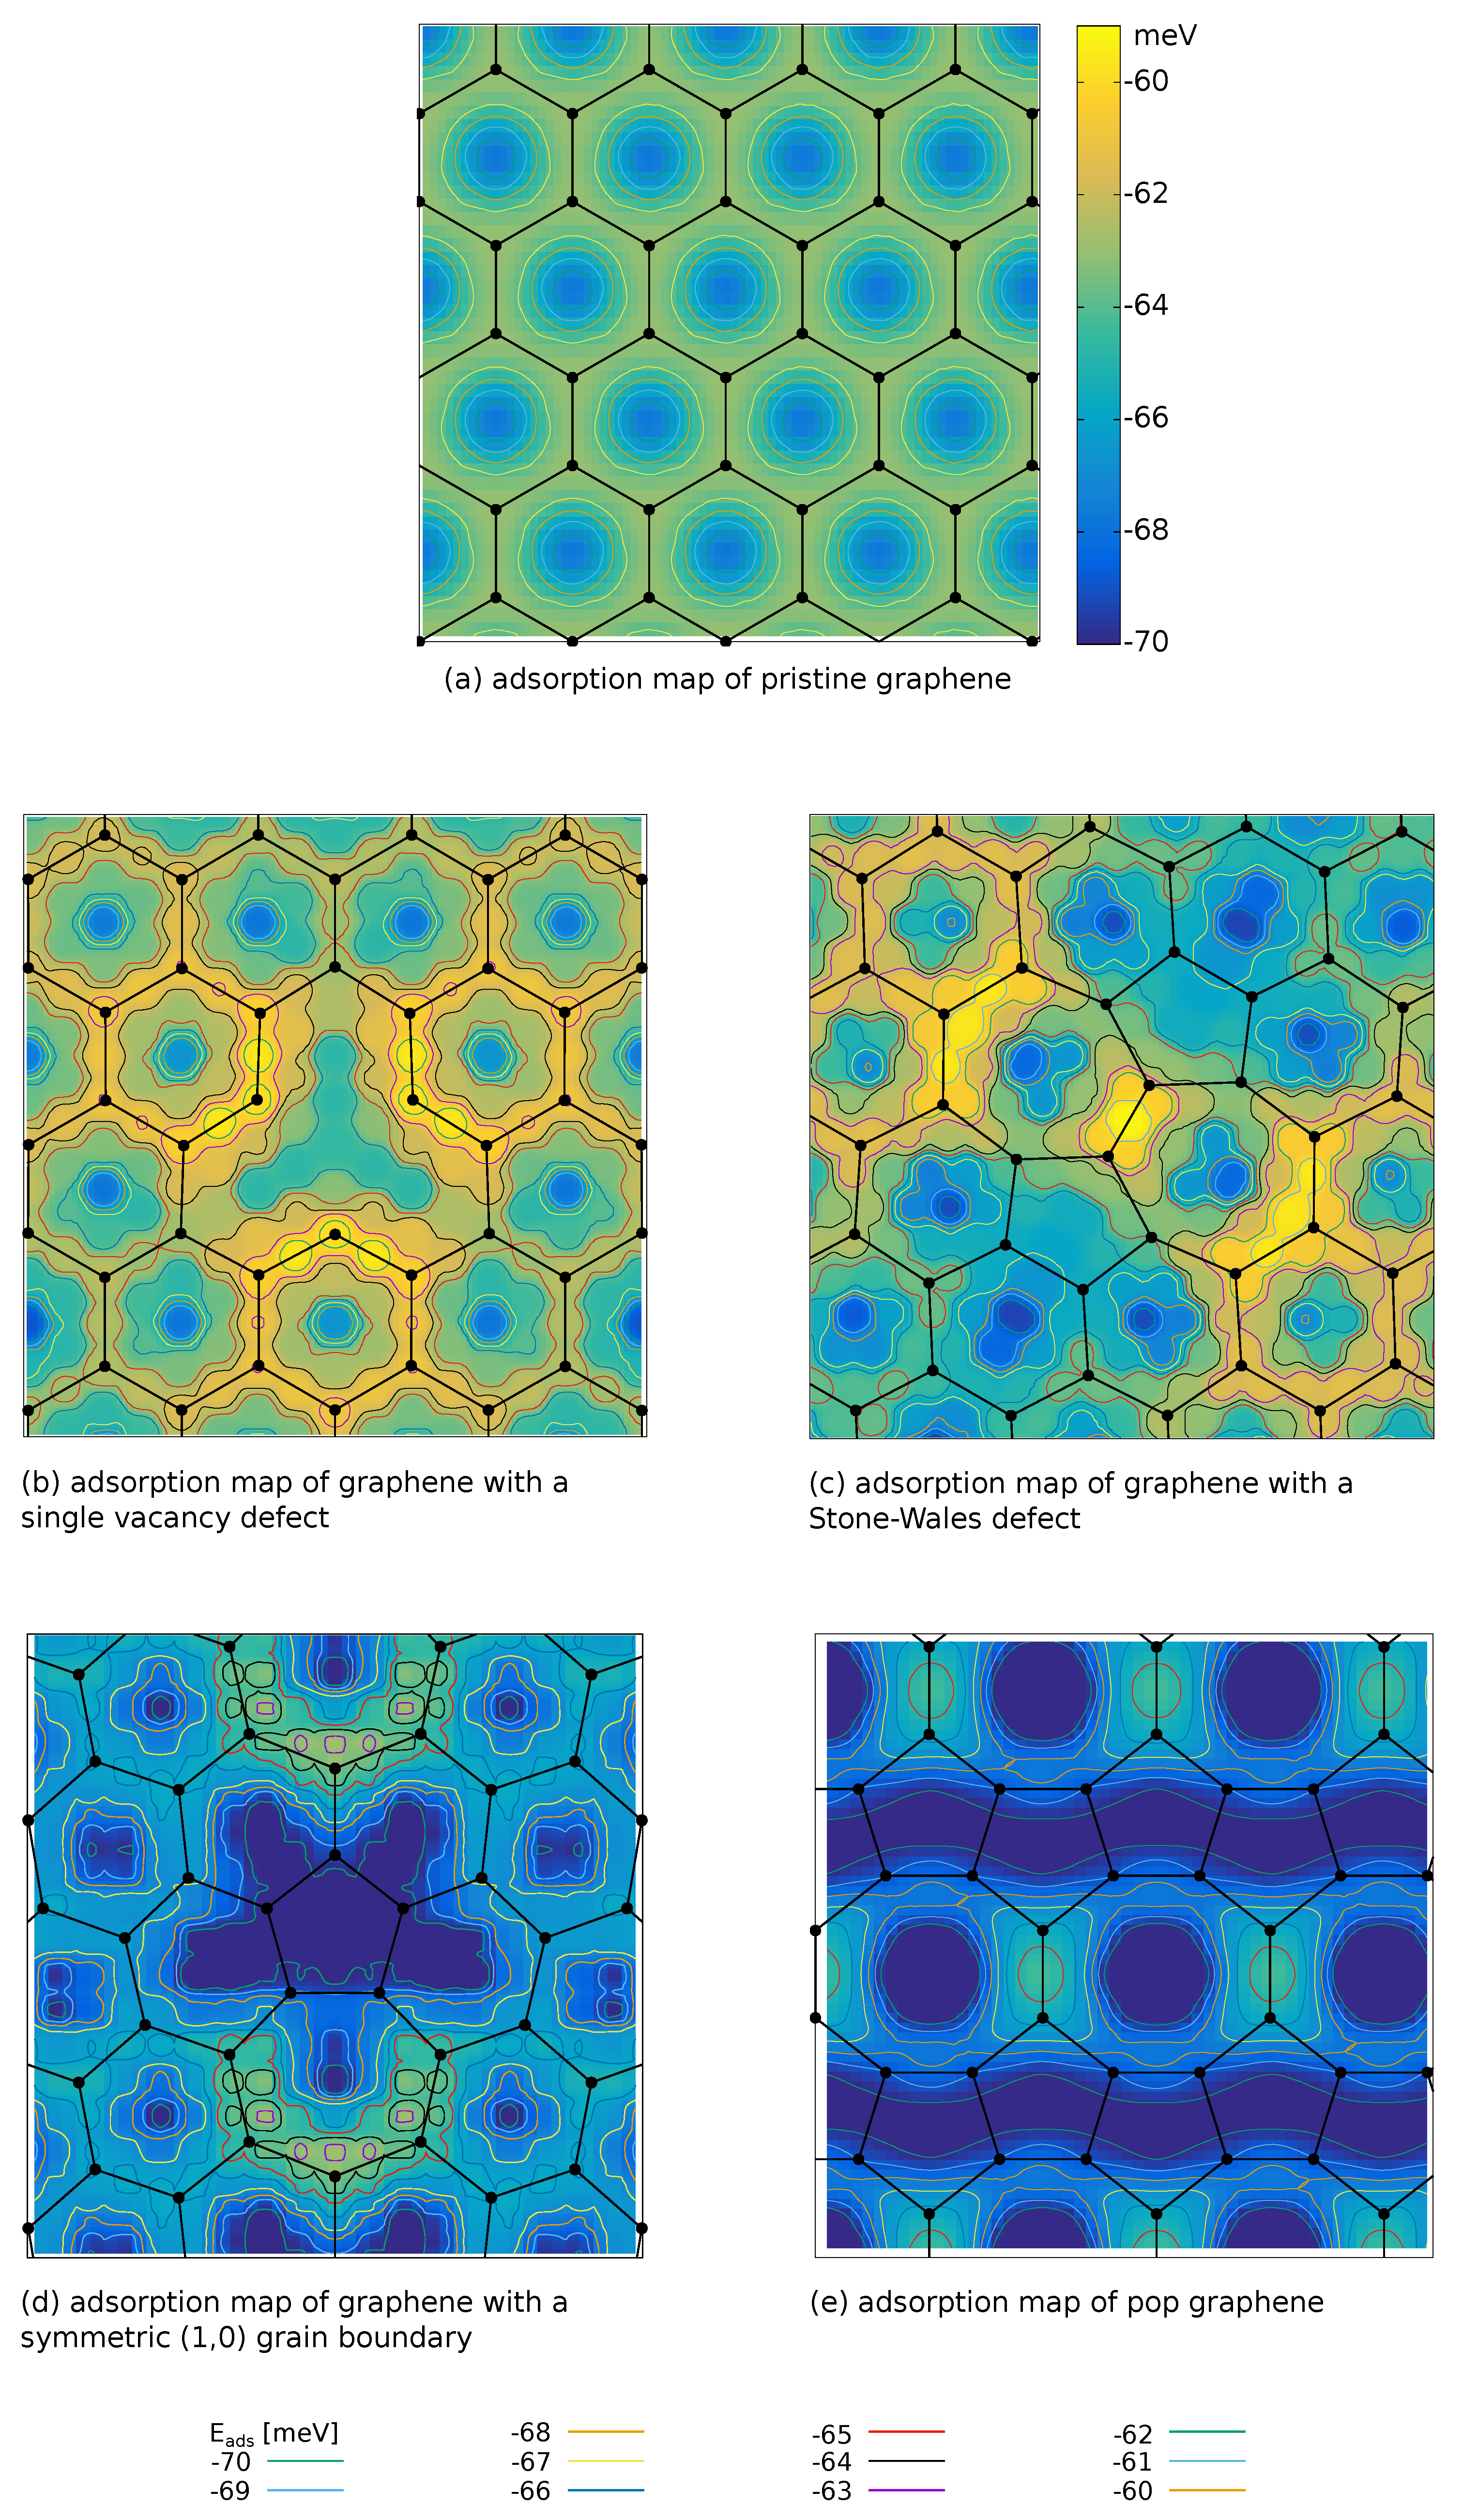
The main focus of the present work is to investigate the role of defects on the adsorption properties. The adsorption maps were obtained for the H molecule in hexagon-v configuration (cf. Section 2.2). Figure 3 shows only Å clips of the calculated supercells, for the full adsorption maps we refer the reader to the supplementary material. The color-code and the contour lines refer to the adsorption energy and are consistent throughout the whole manuscript to allow for an easy comparison between different adsorption scenarios in various figures.
As a measure to quantify the adsorption capacity improvement compared with pristine graphene, we used the fraction of the adsorption area which exhibits more negative adsorption energy (i.e., stronger physisorption) than the minimum of graphene:
where A is the adsorption area per supercell. This quantification is motivated by one of the main graphene advantages, namely its vast surface area, which is also relevant for other carbon nanostructures. The adsorption area is expected to correlate with the hydrogen storage capacity. Nevertheless, the area with strong adsorption capability (at K, see last column in Table 4) is only one of the parameters influencing the adsorption capacity. For example, external parameters such as temperature or pressure, or interaction with other H molecules are also influencing the overall H uptake, and thus we refrain from its direct relation to the hydrogen storage capacity.
As a first step, we evaluated the adsorption energy, , for the pristine graphene supercell in order to get a reference value for comparison. According to Table 3 and Figure 2 the adsorption map (Figure 3a) clearly shows that the minimum of the adsorption energy is in the center of hexagon, while the absolute value around bonds (bridge sites) and carbons atoms (top sites) exhibits a weaker interaction (difference ≈H).
3.3. Point Defects
Although single vacancies are hard to observe experimentally [45], they are easily tractable with DFT. It turns out that the investigated single vacancy lowers the adsorption strength in its direct adjacency with respect to the pristine-like graphene, as highlighted by the yellowish regions around the defect in Figure 3b. However, the region of influence is spatially very confined, since the adsorption energy values around second nearest neighboring hexagons already approach those of pristine graphene. Furthermore, Figure 3b suggests that the H molecule is less likely to be adsorbed at those hexagons which are directly adjacent to the single vacancy defect, from an energetic point of view. Furthermore, there is no improvement of the minimum adsorption energy (Table 4), the lowest value occurs along the bonds to the hexagons adjacent to the defect.
Another very common point defect in hexagonal two-dimensional materials, and thus also observed experimentally [45,46], is a rotated bond which yields the Stone–Wales defect (Figure 3c). The highest value of the adsorption energy (i.e., the weakest physisorption) of the whole cell is predicted along the heptagon bonds, although the quantitative differences compared to the highest value in pristine graphene (see Table 4) are small (). Furthermore, we observe a narrow spatial confinement of the region with changed adsorption properties. Similarly to the vacancy, no qualitative improvement around the Stones-Wales defect can be observed as, e.g., there is no nearby region with improved adsorption behavior (). The only location with potentially improved adsorption are the hexagons adjacent to the pentagons, however, the quantitative improvement compared to pristine graphene (≈) is negligible. Interestingly the single vacancy defect weakens the minima in the adjacent hexagons, such that the surface area which lies around the graphene minimum (fourth and fifth column in Table 4) while it remains constant for the Stone–Wales defect, when comparing the values to those of pristine graphene. Nevertheless the comparison of the values of the single vacancy and Stone–Wales defect clearly shows a reduction of the adsorption capabilities.
3.4. Line Defects
Inspection of the last column of Table 4 reveals that point defects do not result in areas with lowered adsorption energy compared to pristine graphene. Moreover, the adsorption landscape is apparently more undulating as demonstrated by smaller fractions of the surface with adsorption energies close to the lowest adsorption energy. Such behaviour can even counteract physisorption, hence we continue with investigating other defects, namely the grain boundary as a representative of line defects. This is still tractable with DFT with reasonable computational demands. Due to the periodic boundary conditions, the simulation cell contains two boundaries, whose cores are apart. Figure 3e shows a clip around the grain boundary core which itself forms a heptagon-pentagon-2 hexagon line. The minima of adsorption are located in the centers of the hexagons neighboring with the pentagons. Furthermore, the blueish color of Figure 3e, indicating less spatial confinement of the line defect, when compared to the point defects, is underpinned by the number from Table 4. For this defect already nearly one third of the area lies below the minimum graphene level.
3.5. Globally Modified Graphene
The adsorption maps of the symmetric tilt grain boundaries reveal that when measuring adsorption by the adsorption energy, a qualitative enhancement occurs around regions with pentagonal arrangement of the carbon atoms. A recently proposed globally modified graphene composed of ordered pentagons and octagons, POP-graphene, seems therefore a promising candidate for enhancing the H adsorption. Indeed, our calculations predict very good adsorption behavior in the pentagons area (see Figure 3e), the absolute minimum is located in the center of the octagons. With an absolute value of , this minimum is the strongest of all structures investigated in the present study. Consequently, the POP-graphene shows stronger adsorption throughout the whole super cell with of area exhibiting lower than ). Moreover, the highest absolute value of (weakest adsorption) is just a few meV away from the minimum of pristine graphene , resulting that the whole cell is lying below the and over 70% of the surface below the border respectively.
4. Discussion
In this section we try to analyze the origin of the improved adsorption of the POP-graphene as well as the apparent local adsorption enhancement cased by point defects (Figure 3). There are two possible sources: (1) change in the electron distribution within carbon-structure due to defects, that affects the polarizability; (2) pure geometry, i.e., arrangement of the C atoms. Inspecting Equation (1), the former contribution should mostly cancel out as it affects (by almost the same amount) both terms and . Therefore, the change in adsorption behavior should be linked to the changed interaction between the molecule and the graphene structure which is mainly van-der-Waals-like. This can be demonstrated, e.g., by comparing the adsorption energies the top-v configuration with (Table 3) and without (pure GGA-PBE) TS correction, which agrees well with previously published data [40,42].
To bring more insight, we now analyze different contributions to the adsorption energy taking POP-graphene as an example. As the total interaction energies may be splitted up into a small PBE contribution and a dispersion part arising from the vdW corrections one can rewrite it to:
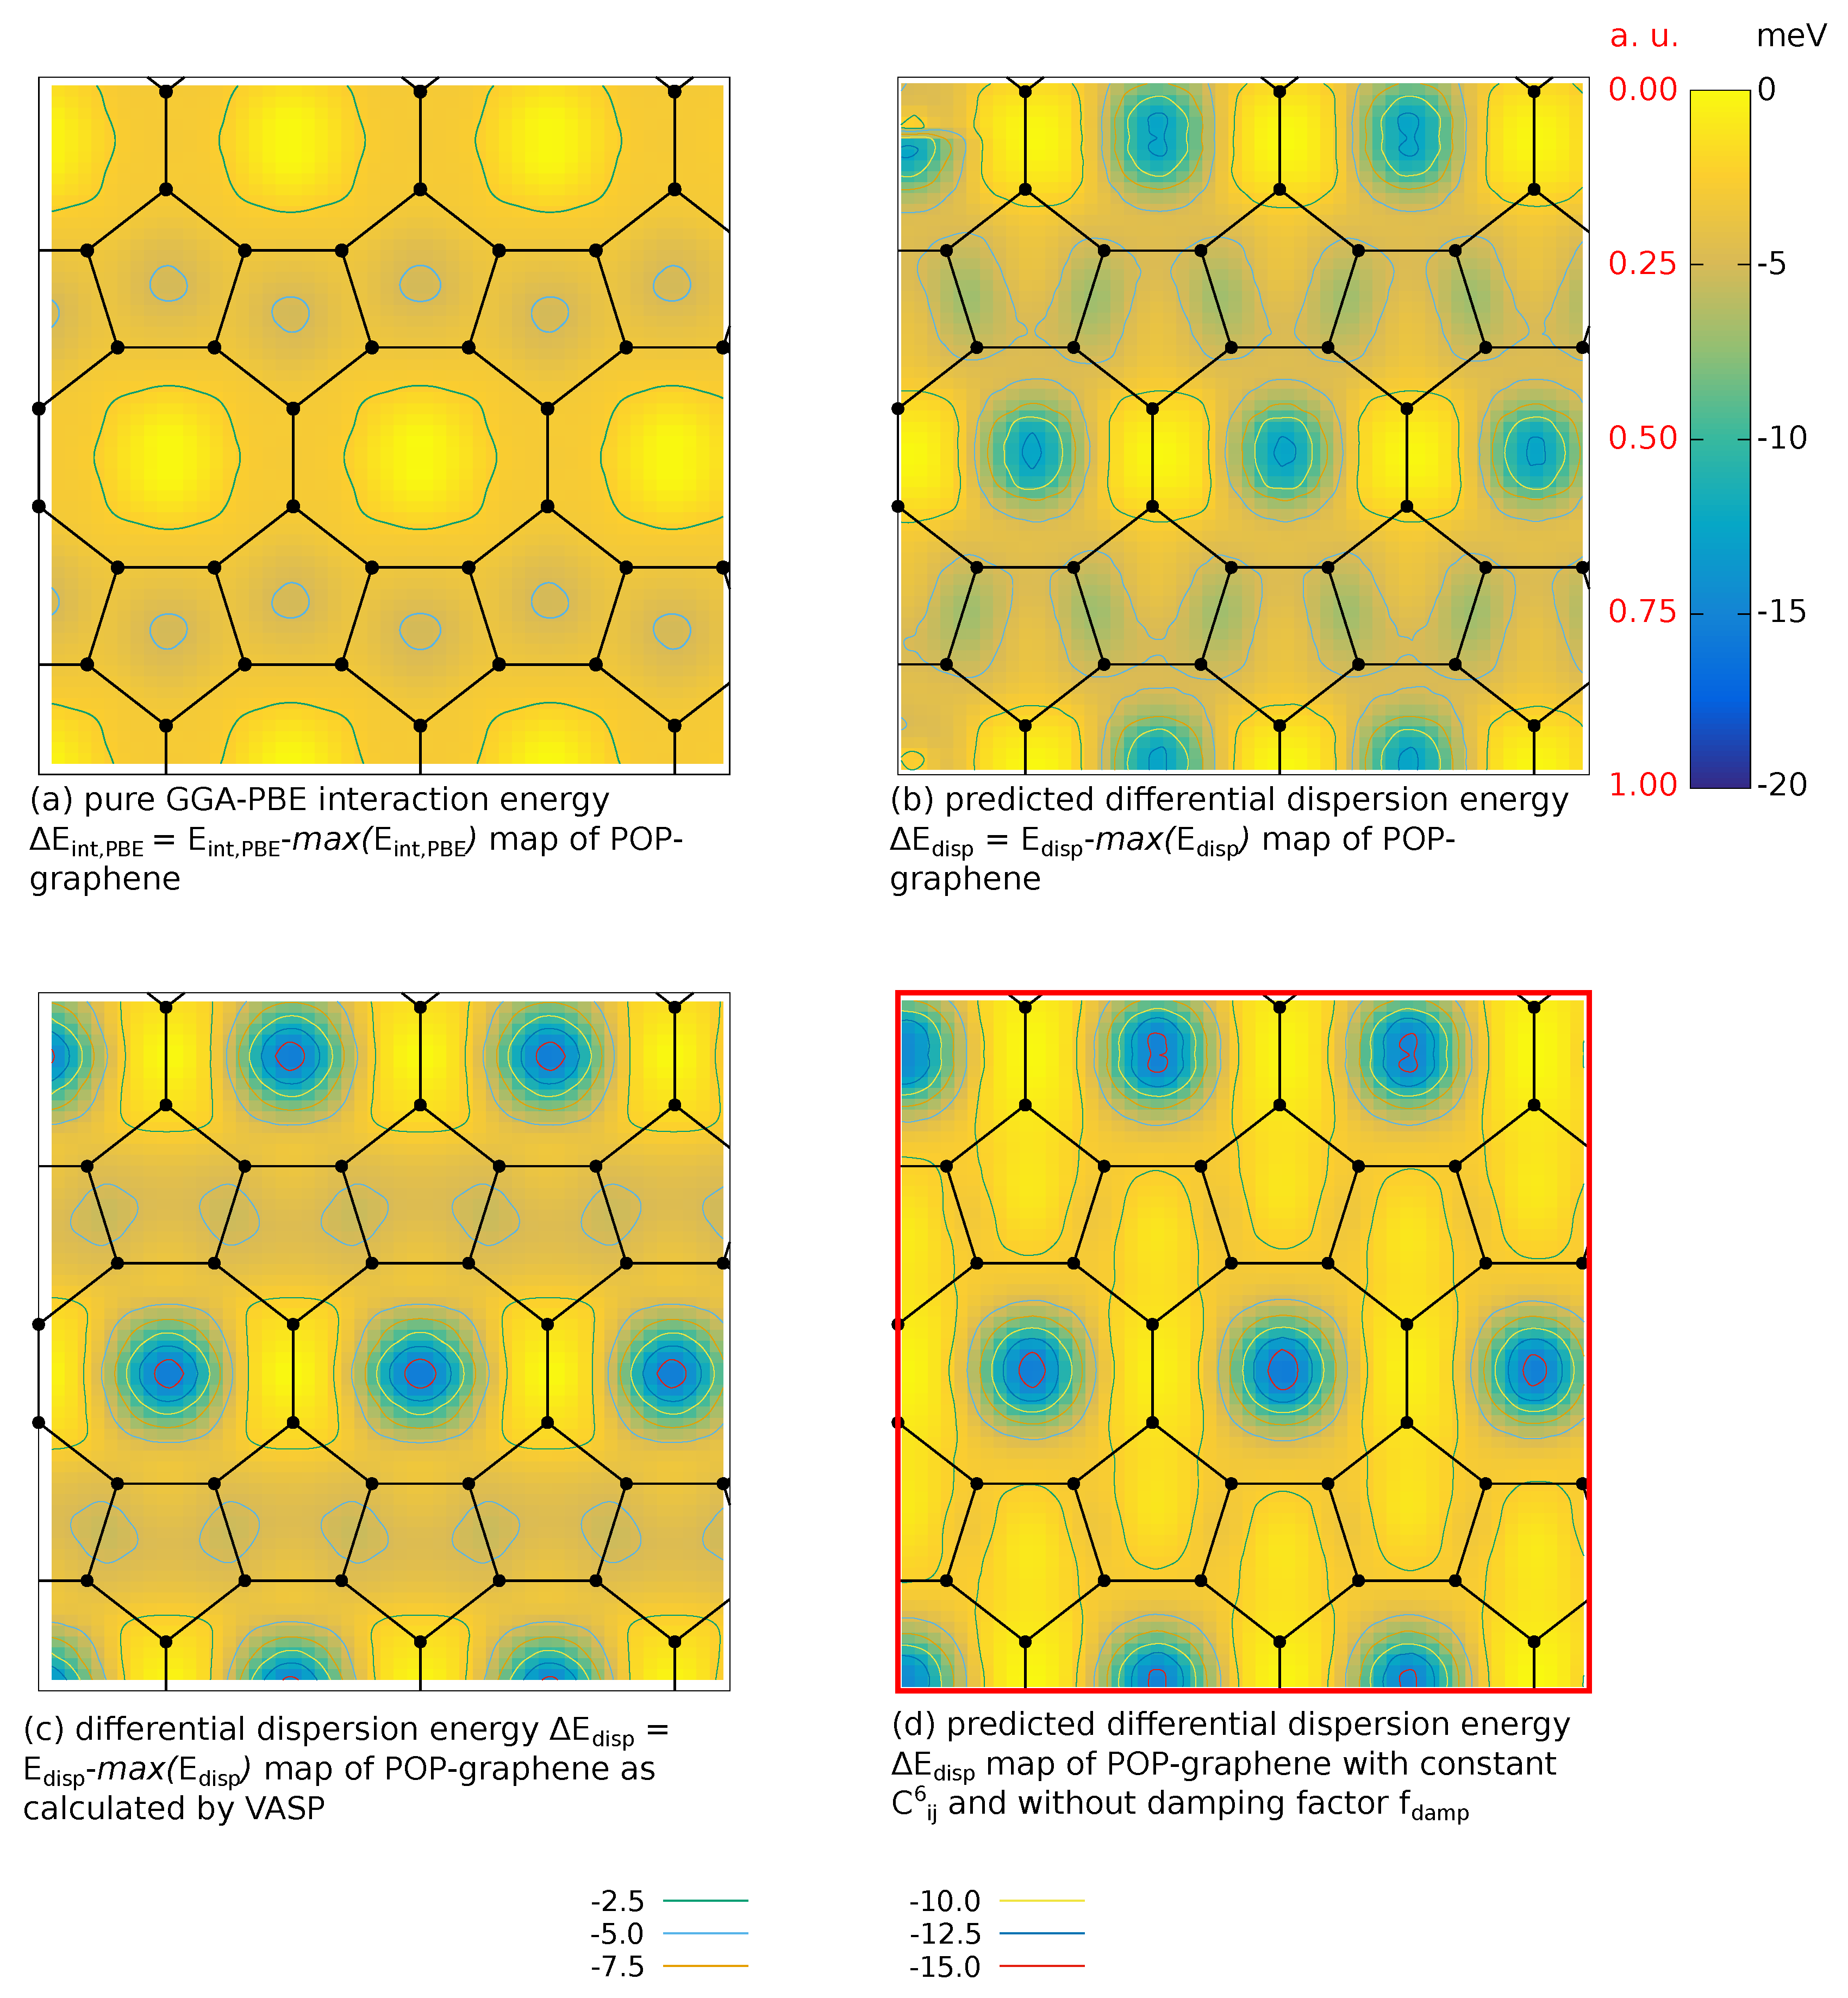
where is a constant term throughout the whole simulation cell, and is found to be for POP-graphene. Firstly, we extracted the “adsorption maps” for pure GGA-PBE without any vdW correction. These values are shown in Figure 4a as relative values with respect to the maximum value identified on the whole adsorption surface (). This way we hope to highlight the “topology” changes due to different levels of approximation. Most importantly, the adsorption surface for the pure GGA-PBE is rather flat with the difference between the maxima and minima being with the minima (darkest regions) being located in the centres of the pentagons. This is clearly different from the vdW part of the adsorption energy (Figure 4c): the adsorption minima are located in the centres of octagons and their relative depth is . The adsorption surface maxima are located on the sides between octagons, same as in the case of the full adsorption surface (Figure 3e). Therefore, we ascribe the main origin of the adsorption maps topology to the vdW dispersion interaction.
As the next step we calculated dispersion energy for a hydrogen molecule for each sampling point according to Grimme’s D2 method [34].
To keep things simple, only contributions (sum over ) from neighboring cells were taken into account. The parameters for the damping function , d, and were chosen according to the recommendations in the VASP manual [47].
Moreover, since the present work employed the TS vdW method, which essentially differs by the way how the dispersion coefficients are calculated (from the charge density instead of constants), the values were taken as calculated by VASP. Nonetheless, following the derivation in Ref. [24], it is possible to show that the variation of the dispersion coefficients is expected to be negligible. The dispersion coefficients within the TS method are calculated according to the following equations:
where is the polarizability of an isolated atom i and the dispersion coefficient for a pair of those atoms. Due to a assumption of a linear dependence between polarizablilty and effective volume [48] of the atom (obtained by employing Hirshfeld partitioning [49]), the effective volume is the only quantity which is calculated from the charge-density in order to obtain the dispersion coefficients. Therefore, plugging Equations (6) and (7) into Equation (8) reveals the linear dependence between and
Here, and are the polarizability and dispersion coefficient of an isolated atoms i, respectively, and can be found tabulated [50]. The dispersion coefficients for the POP-graphene differ only in a range of , caused by only small variations of the effective volume. Consequently the contribution arising from the changed electronic structure is rather small.
Comparing Figure 4b (calculated according to Equations (4) and (5) Figure 4c (full TS-VASP dispersion) suggests that the essential contributions to the adsorption surface topology are captured by the analytical form of Equation (4). Here, the geometry enters two terms: on the one hand directly through the term, and secondly through the damping coefficient. Setting the dispersion as well as damping coefficients to a constant value, Equation (4) simplifies to
Thus, in Figure 4d the topology corresponding to only the geometry of the POP-graphene is shown, as given by Equation (10) (minimum-to-maximum scaled to fit the colour bar of the other dispersion maps). Clearly, the adsorption features such as preferred adsorption sites are related simply to the geometrical arrangement of the atoms involved in evaluation of the van-der-Waals dispersion, the major contribution to the adsorption energy.
5. Conclusions
After showing that our DFT-TS study is in good agreement with previous work [4], we could show that point defects such as single vacancies and Stone–Wales defects weaken the H adsorption in their closest neighbourhood, however, the effects remain spatially confined. On the contrary, the impact of a grain boundary on the adsorption properties is widespread, thus showing superior absolute values and large regions with enhanced adsorption properties as compared with the pristine graphene. POP-graphene, an example of a graphene derivative, outperforms even the grain boundary in terms of the enhanced area and the adsorption energies (adsorption is stronger). Furthermore, we showed explicitly by analyzing the effective atom volumes of POP-graphene, that the influence of the electronic structure to the dispersion correction has only a negligible impact. Hence no qualitative differences can be expected when employing the DFT-D3 method instead of the DFT-TS one, being also the reason for the aforementioned good agreement with previous literature on graphene. As a consequence, the changes in the adsorption capabilities mainly arise from the different geometrical arrangement of the carbon atoms in the investigated structures.
Author Contributions
Conceptualization, D.G. and D.H.; methodology, D.G.; validation, D.G., M.N.P. and D.H.; investigation, D.G. and T.D.; resources, D.H.; writing—original draft preparation, D.G.; writing—review and editing, D.H., M.N.P. and T.D.; visualization, D.G.; supervision, D.H.; funding acquisition, M.N.P. and D.H. All authors have read and agree to the published version of the manuscript.
Funding
The author gratefully acknowledges the financial support under the scope of the COMET program within the K2 Center “Integrated Computational Material, Process and Product Engineering (IC-MPPE)” (Project No. 859480). This program is supported by the Austrian Federal Ministries for Transport, Innovation and Technology (BMVIT) and for Digital and Economic Affairs (BMDW), represented by the Austrian research funding association (FFG), and the federal states of Styria, Upper Austria and Tyrol.
Acknowledgments
The computational results presented have been achieved (in part) using the Vienna Scientific Cluster 3 (VSC-3).
Conflicts of Interest
The authors declare no conflict of interest.
Appendix A. Benchmark Study of Different van-der-Waals Corrections in VASP

Table A1.
Benchmark study of different van-der-Waals corrections implemented in VASP in order to reproduce the experimental lattice parameters of graphite. (D2 = DFT-D2, D3 = DFT-D3, D3-BJ = DFT-D3 with Becke-Jonson (rational) damping, TS = Tkatchenko-Scheffler method, TS+IHiPart = Tkatchenko-Scheffler method with iterative Hirshfeld partitioning, MBD=Many-body dispersion energy method (MBD@rSC), dDsC = density-dependent-dispersion-correction method). IVDW refers to the setting of the van-der-Waals-method correction tag in the VASP control input file (INCAR). The last two rows show the deviation norm as well as the percentage norm. A -centered k-mesh was used in combination very fine FFT-grid was used (increased setting for NGXF, NGYF, NGZF parameters, and a cut-off energy of 1100 eV) in order to get accurate energies and forces.
| Method | Unit | None | D2 | D3 | D3-BJ | TS | TS+IHiPart | MBD | dDsC |
|---|---|---|---|---|---|---|---|---|---|
| IVDW | 0 | 10 | 11 | 12 | 20 | 21 | 202 | 4 | |
| 7.978 | 6.447 | 6.952 | 6.709 | 6.708 | 6.710 | 6.743 | 6.707 | ||
| 1.270 | 0.261 | 0.244 | 0.001 | 0.000 | 0.002 | 0.035 | 0.001 | ||
| % | 18.933 | 3.891 | 3.637 | 0.015 | 0.000 | 0.030 | 0.522 | 0.015 | |
| 2.467 | 2.463 | 2.466 | 2.466 | 2.460 | 2.460 | 2.461 | 2.455 | ||
| 0.006 | 0.002 | 0.005 | 0.005 | 0.001 | 0.001 | 0.000 | 0.006 | ||
| % | 0.244 | 0.081 | 0.203 | 0.203 | 0.041 | 0.041 | 0.000 | 0.244 | |
| 1.270 | 0.261 | 0.244 | 0.005 | 0.001 | 0.002 | 0.035 | 0.006 | ||
| % | 18.934 | 3.892 | 3.643 | 0.204 | 0.041 | 0.050 | 0.522 | 0.244 | |
Appendix B. Adsorption POP-graphene
Figure A1.
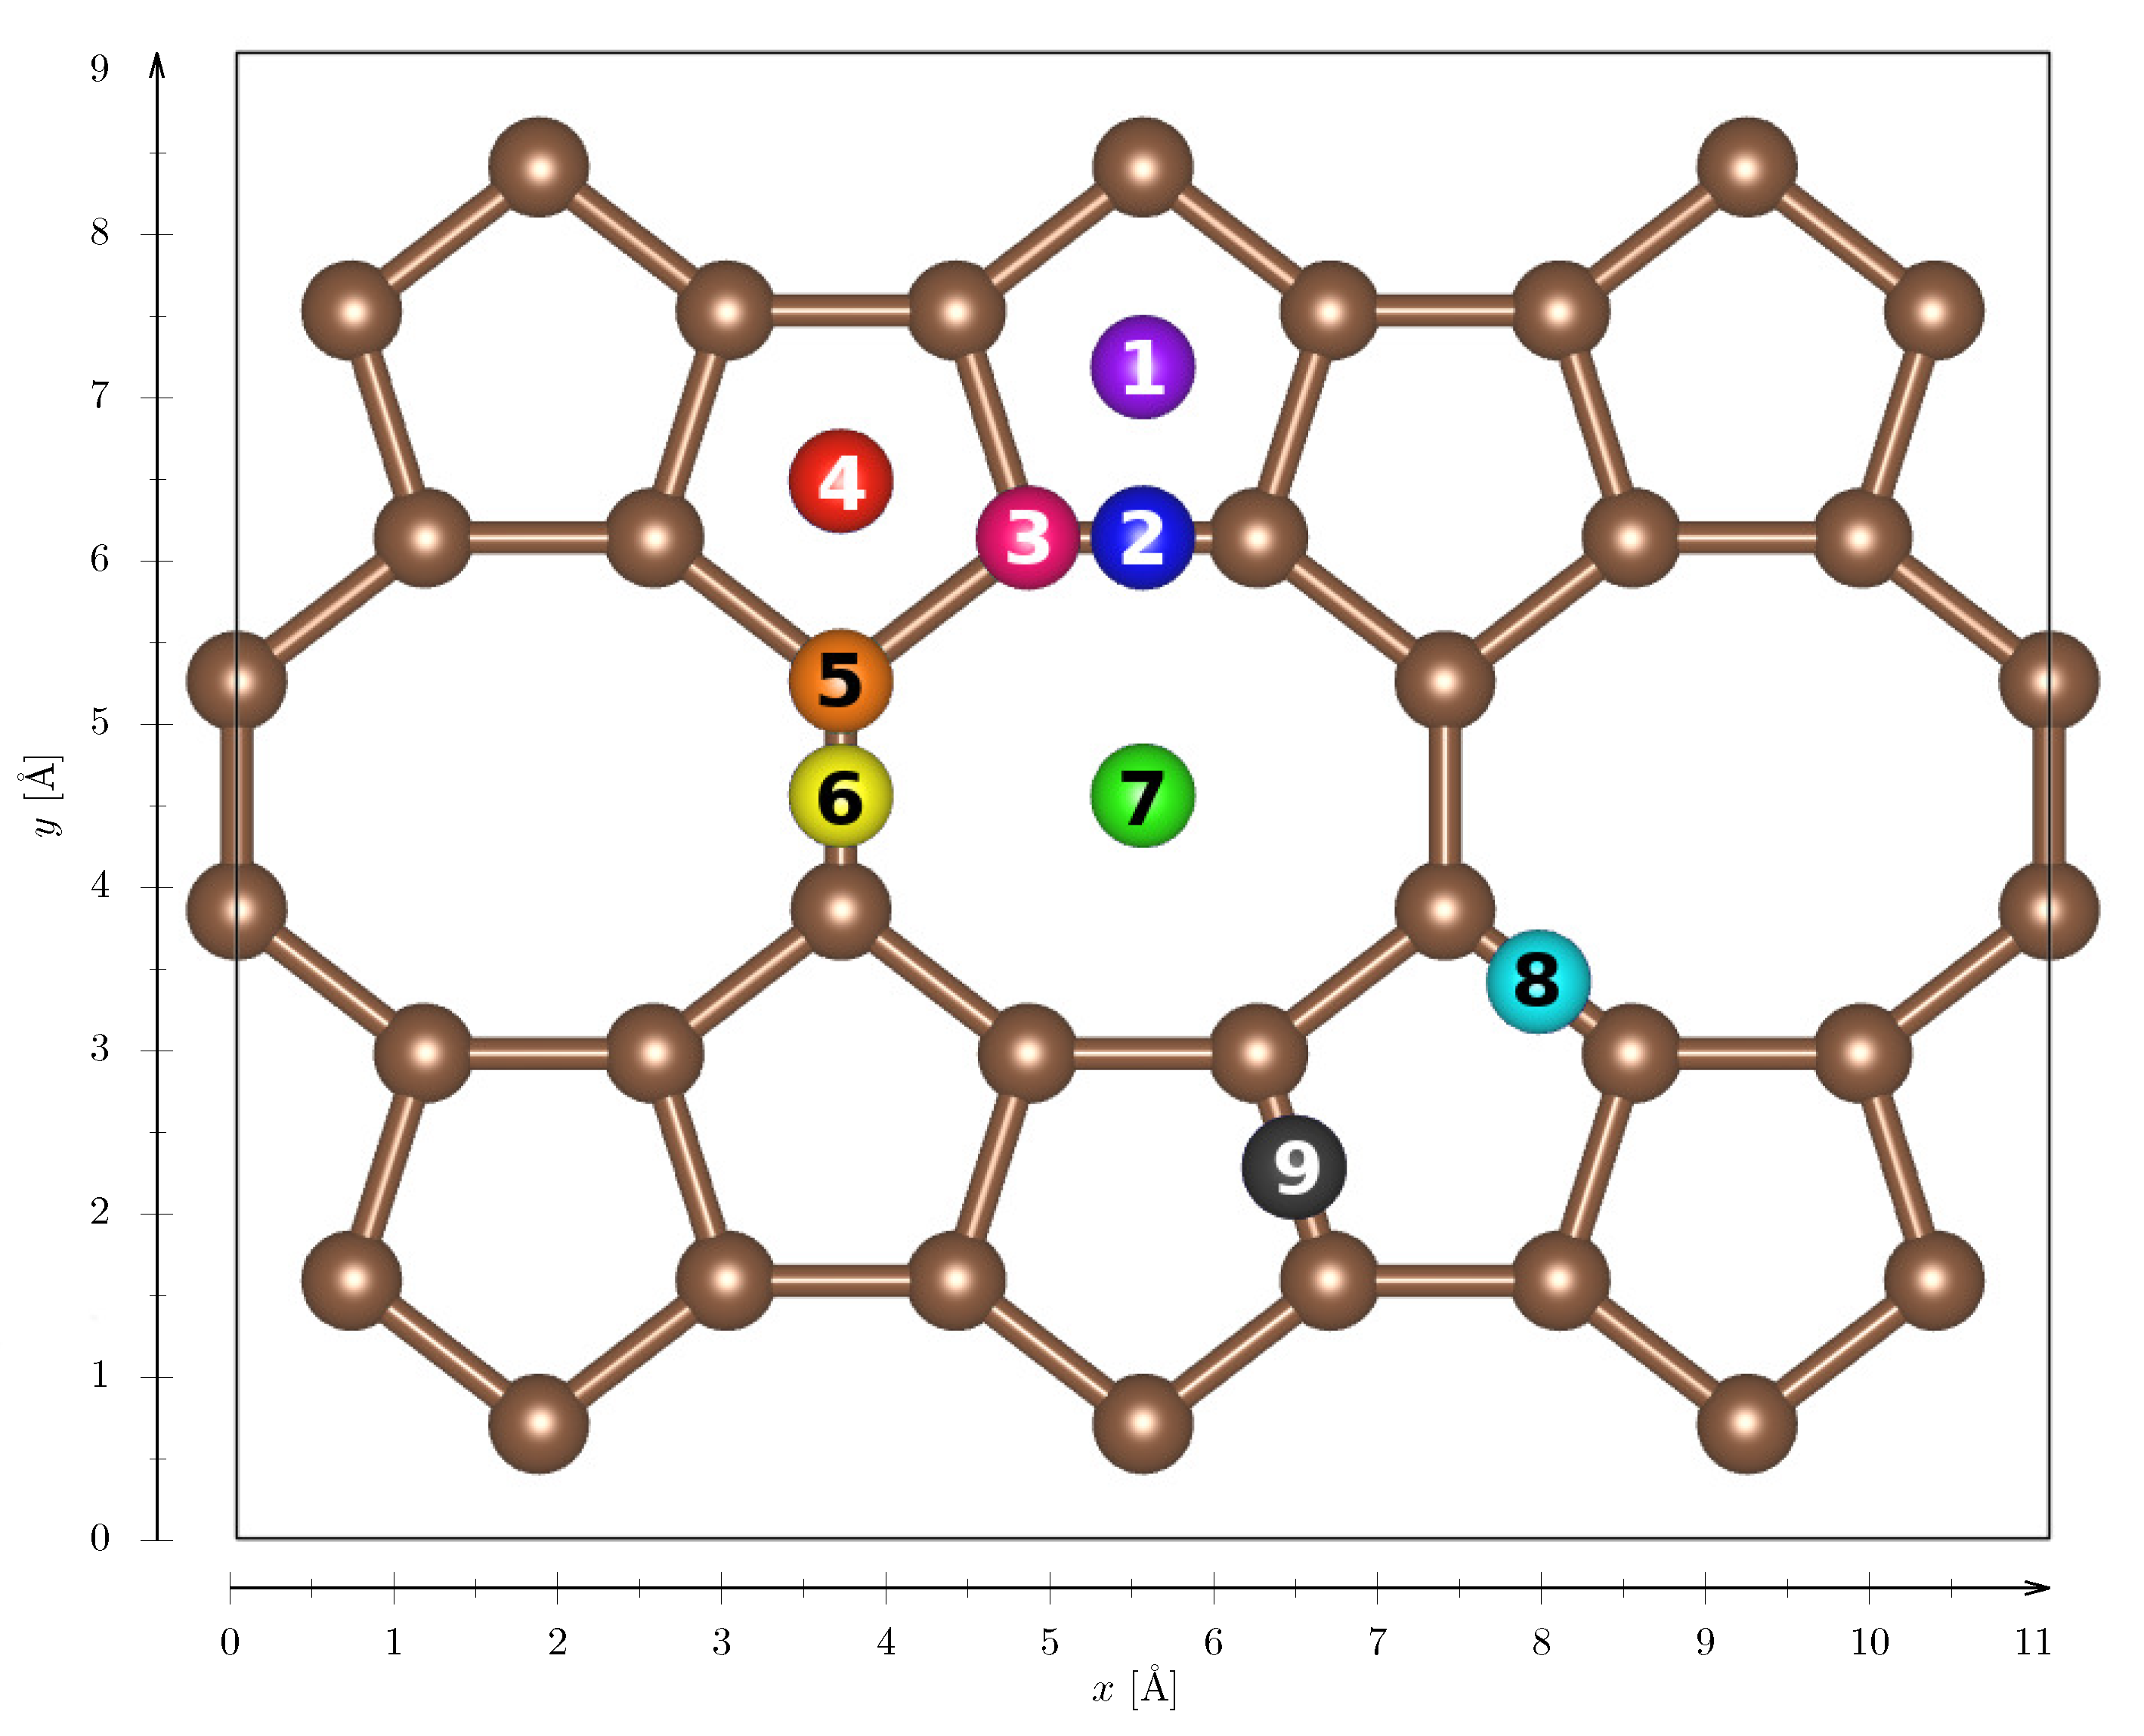
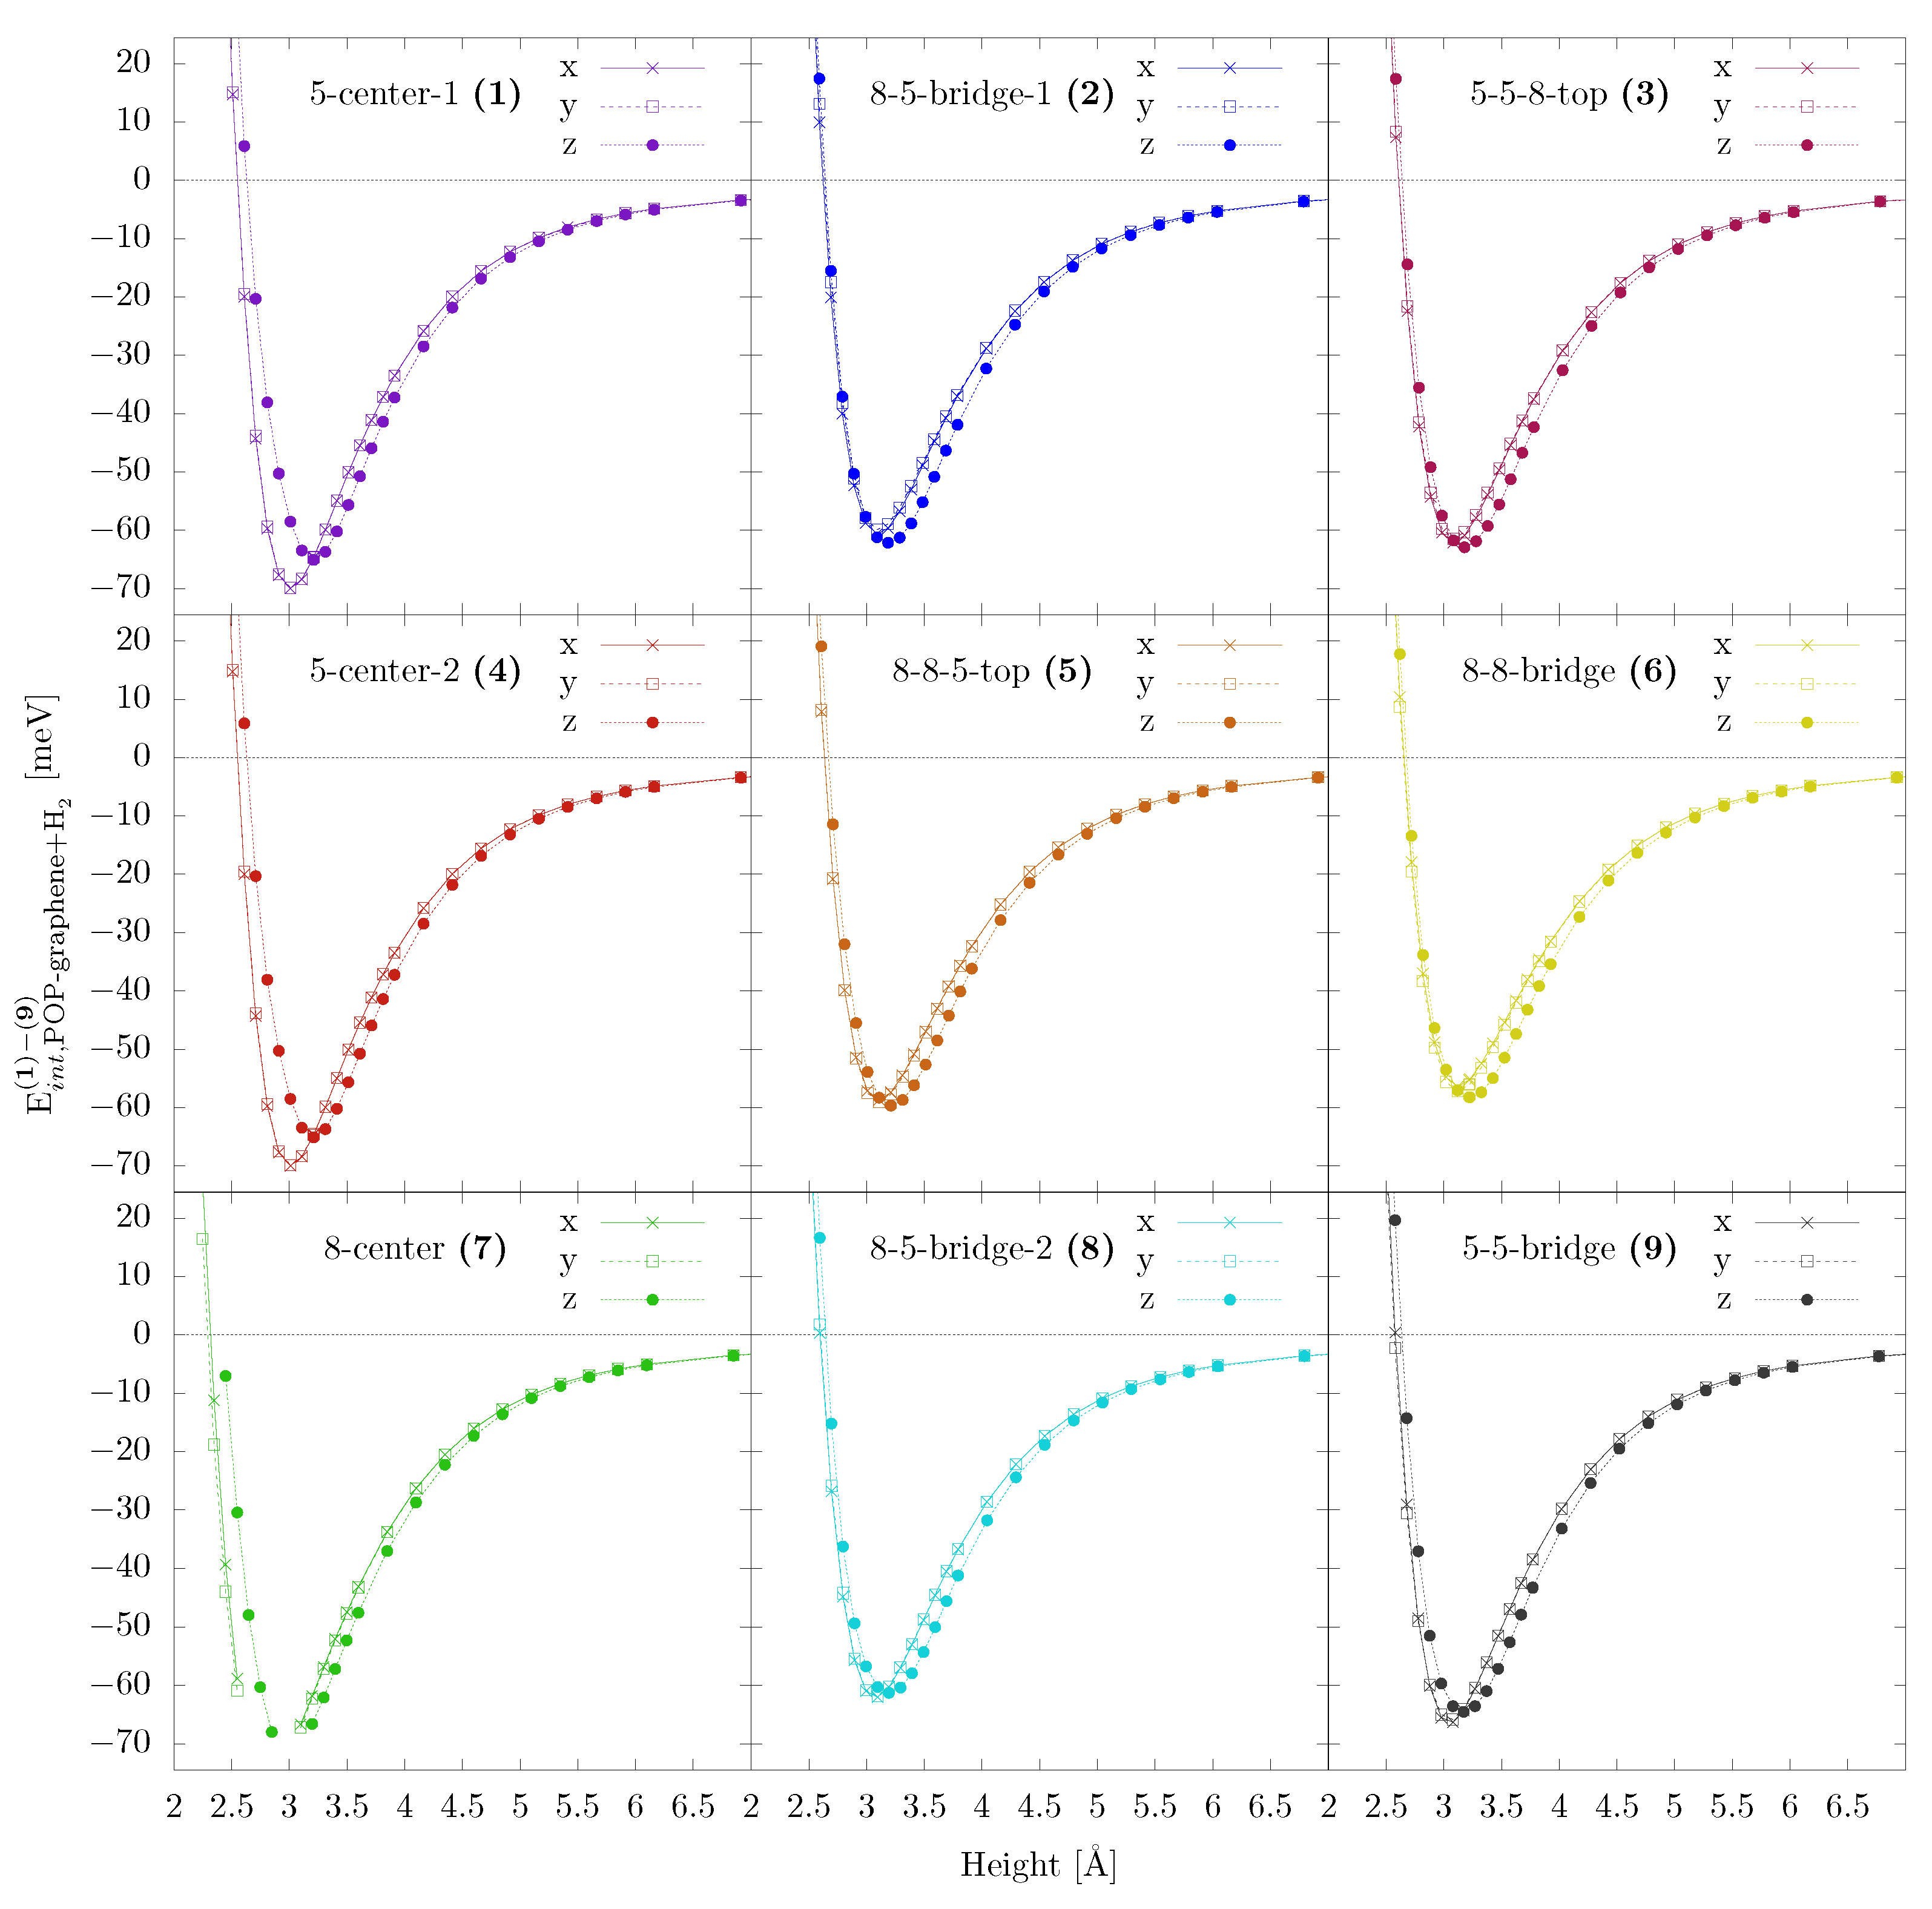
Schematic view of adsorption sites on POP-graphene. The colored balls represent the adsorption sites, where the number inside represents the sites’ index. The interaction energies were calculated for all three (x, y and z) alignments of the H molecule axis. The data is presented in Figure A2.
Figure A1.
Schematic view of adsorption sites on POP-graphene. The colored balls represent the adsorption sites, where the number inside represents the sites’ index. The interaction energies were calculated for all three (x, y and z) alignments of the H molecule axis. The data is presented in Figure A2.

Figure A2.
Interaction energies for (x, y and z) alignment of the H molecule on different adsorption sites on POP-graphene (as shown in Figure A1). The colors of the the balls in Figure A1, labelling special positions, corresponds width the colors of the curves. The numbers in the figure titles represents the corresponding carbon structure (5=pentagon, 8=octagon), e.g., 8-8-bridge is bond between two adjacent octagons.

References
- Bastos-Neto, M.; Patzschke, C.; Lange, M.; Möllmer, J.; Möller, A.; Fichtner, S.; Schrage, C.; Lässig, D.; Lincke, J.; Staudt, R.; et al. Assessment of hydrogen storage by physisorption in porous materials. Energy Environ. Sci. 2012, 5, 8294–8303. [Google Scholar] [CrossRef]
- Novoselov, K.S. Electric Field Effect in Atomically Thin Carbon Films. Science 2004, 306, 666–669. [Google Scholar] [CrossRef] [PubMed] [Green Version]
- Geim, A.K.; Novoselov, K.S. The rise of graphene. Nat. Mater. 2007, 6, 183–191. [Google Scholar] [CrossRef] [PubMed]
- Petrushenko, I.K.; Petrushenko, K.B. Hydrogen adsorption on graphene, hexagonal boron nitride, and graphene-like boron nitride-carbon heterostructures: A comparative theoretical study. Int. J. Hydrogen Energy 2018, 43, 801–808. [Google Scholar] [CrossRef]
- Mattera, L.; Rosatelli, F.; Salvo, C.; Tommasini, F.; Valbusa, U.; Vidali, G. Selective adsorption of 1H2 and 2H2 on the (0001) graphite surface. Surf. Sci. 1980, 93, 515–525. [Google Scholar] [CrossRef]
- Rangel, E.; Sansores, E. Theoretical study of hydrogen adsorption on nitrogen doped graphene decorated with palladium clusters. Int. J. Hydrogen Energy 2014, 39, 6558–6566. [Google Scholar] [CrossRef]
- Nguyen, M.T. Reactivity of Graphene and Hexagonal Boron Nitride In-Plane Heterostructures with Oxygen: A DFT Study. ChemPhysChem 2014, 15, 2372–2376. [Google Scholar] [CrossRef]
- Petrushenko, I.K. A DFT Study of Hydrogen Adsorption onto Graphene: Effect of Nitrogen Doping. J. Nano- Electron. Phys. 2017, 9, 03018–1–03018–5. [Google Scholar] [CrossRef] [Green Version]
- Gadipelli, S.; Guo, Z.X. Graphene-based materials: Synthesis and gas sorption, storage and separation. Prog. Mater. Sci. 2015, 69, 1–60. [Google Scholar] [CrossRef] [Green Version]
- Bakhshi, F.; Farhadian, N. Co-doped graphene sheets as a novel adsorbent for hydrogen storage: DFT and DFT-D3 correction dispersion study. Int. J. Hydrogen Energy 2018, 43, 8355–8364. [Google Scholar] [CrossRef]
- Holec, D.; Kostoglou, N.; Tampaxis, C.; Babic, B.; Mitterer, C.; Rebholz, C. Theory-guided metal-decoration of nanoporous carbon for hydrogen storage applications. Surf. Coat. Technol. 2018, 351, 42–49. [Google Scholar] [CrossRef]
- Samantaray, S.S.; Sangeetha, V.; Abinaya, S.; Ramaprabhu, S. Enhanced hydrogen storage performance in Pd3Co decorated nitrogen/boron doped graphene composites. Int. J. Hydrogen Energy 2018, 43, 8018–8025. [Google Scholar] [CrossRef]
- Wu, D.; Yang, B.; Ruckenstein, E.; Chen, H. Functionalization: An Effective Approach to Open and Close Channels for Electron Transfer in Nitrogenated Holey Graphene C2N Anodes in Sodium-Ion Batteries. J. Phys. Chem. Lett. 2019, 10, 721–726. [Google Scholar] [CrossRef] [PubMed]
- Baburin, I.A.; Klechikov, A.; Mercier, G.; Talyzin, A.; Seifert, G. Hydrogen adsorption by perforated graphene. Int. J. Hydrogen Energy 2015, 40, 6594–6599. [Google Scholar] [CrossRef] [Green Version]
- Wang, S.; Yang, B.; Chen, H.; Ruckenstein, E. Reconfiguring graphene for high-performance metal-ion battery anodes. Energy Storage Mater. 2019, 16, 619–624. [Google Scholar] [CrossRef]
- Stone, A.; Wales, D. Theoretical studies of icosahedral C60 and some related species. Chem. Phys. Lett. 1986, 128, 501–503. [Google Scholar] [CrossRef]
- Thrower, P. The study of defects in graphite by transmission electron microscopy. Chem. Phys. Carbon 1969, 5, 217–320. [Google Scholar]
- Yazyev, O.V.; Louie, S.G. Topological defects in graphene: Dislocations and grain boundaries. Phys. Rev. B 2010, 81, 195420. [Google Scholar] [CrossRef] [Green Version]
- Liu, T.H.; Gajewski, G.; Pao, C.W.; Chang, C.C. Structure, energy, and structural transformations of graphene grain boundaries from atomistic simulations. Carbon 2011, 49, 2306–2317. [Google Scholar] [CrossRef]
- Lusk, M.T.; Carr, L. Creation of graphene allotropes using patterned defects. Carbon 2009, 47, 2226–2232. [Google Scholar] [CrossRef] [Green Version]
- Liu, Y.; Yakobson, B.I. Cones, Pringles, and Grain Boundary Landscapes in Graphene Topology. Nano Lett. 2010, 10, 2178–2183. [Google Scholar] [CrossRef] [Green Version]
- Ariza, M.; Ortiz, M. Discrete dislocations in graphene. J. Mech. Phys. Solids 2010, 58, 710–734. [Google Scholar] [CrossRef]
- Wang, S.; Yang, B.; Chen, H.; Ruckenstein, E. Popgraphene: A new 2D planar carbon allotrope composed of 5–8–5 carbon rings for high-performance lithium-ion battery anodes from bottom-up programming. J. Mater. Chem. A 2018, 6, 6815–6821. [Google Scholar] [CrossRef]
- Tkatchenko, A.; Scheffler, M. Accurate molecular van der Waals interactions from ground-state electron density and free-atom reference data. Phys. Rev. Lett. 2009, 102, 6–9. [Google Scholar] [CrossRef] [PubMed] [Green Version]
- Ong, S.P.; Richards, W.D.; Jain, A.; Hautier, G.; Kocher, M.; Cholia, S.; Gunter, D.; Chevrier, V.L.; Persson, K.A.; Ceder, G. Python Materials Genomics (pymatgen): A robust, open-source python library for materials analysis. Comput. Mater. Sci. 2013, 68, 314–319. [Google Scholar] [CrossRef] [Green Version]
- Oliphant, T.E. Python for Scientific Computing. Comput. Sci. Eng. 2007, 9, 10–20. [Google Scholar] [CrossRef] [Green Version]
- Kresse, G.; Hafner, J. Ab initio molecular dynamics for liquid metals. Phys. Rev. B 1993, 47, 558–561. [Google Scholar] [CrossRef]
- Kresse, G.; Furthmüller, J. Efficient iterative schemes for ab initio total-energy calculations using a plane-wave basis set. Phys. Rev. B 1996, 54, 11169–11186. [Google Scholar] [CrossRef]
- Perdew, J.P.; Ernzerhof, M.; Burke, K. Generalized Gradient Approximation Made Simple John. Phys. Rev. Lett. 1996, 77, 3865–3868. [Google Scholar] [CrossRef] [Green Version]
- Perdew, J.P.; Burke, K.; Ernzerhof, M. Generalized Gradient Approximation Made Simple. Phys. Rev. Lett. 1997, 78, 1396. [Google Scholar] [CrossRef] [Green Version]
- Blöchl, P.E. Projector augmented-wave method. Phys. Rev. B 1994, 50, 17953–17979. [Google Scholar] [CrossRef] [Green Version]
- Kresse, G.; Joubert, D. From ultrasoft pseudopotentials to the projector augmented-wave method. Phys. Rev. B 1999, 59, 1758–1775. [Google Scholar] [CrossRef]
- Monkhorst, H.J.; Pack, J.D. Special points for Brillouin-zone integrations. Phys. Rev. B 1976, 13, 5188–5192. [Google Scholar] [CrossRef]
- Grimme, S. Accurate description of van der Waals complexes by density functional theory including empirical corrections. J. Comput. Chem. 2004, 25, 1463–1473. [Google Scholar] [CrossRef] [PubMed]
- Grimme, S.; Antony, J.; Ehrlich, S.; Krieg, H. A consistent and accurate ab initio parametrization of density functional dispersion correction (DFT-D) for the 94 elements H-Pu. J. Chem. Phys. 2010, 132. [Google Scholar] [CrossRef] [PubMed] [Green Version]
- Tkatchenko, A.; Distasio, R.A.; Car, R.; Scheffler, M. Accurate and efficient method for many-body van der Waals interactions. Phys. Rev. Lett. 2012, 108, 1–5. [Google Scholar] [CrossRef]
- Bučko, T.; Lebègue, S.; Hafner, J.; Ángyán, J.G. Improved density dependent correction for the description of London dispersion forces. J. Chem. Theory Comput. 2013, 9, 4293–4299. [Google Scholar] [CrossRef]
- Bučko, T.; Lebègue, S.; Hafner, J.; Ángyán, J.G. Tkatchenko-Scheffler van der Waals correction method with and without self-consistent screening applied to solids. Phys. Rev. B 2013, 87. [Google Scholar] [CrossRef]
- Al-Saidi, W.A.; Voora, V.K.; Jordan, K.D. An Assessment of the vdW-TS Method for Extended Systems. J. Chem. Theory Comput. 2012, 8, 1503–1513. [Google Scholar] [CrossRef]
- Rubes, M.; Bludsky, O. DFT/CCSD(T) Investigation of the Interaction of Molecular Hydrogen with Carbon Nanostructures. ChemPhysChem 2009, 10, 1868–1873. [Google Scholar] [CrossRef]
- Okamoto, Y.; Miyamoto, Y. Ab Initio Investigation of Physisorption of Molecular Hydrogen on Planar and Curved Graphenes. J. Phys. Chem. B 2001, 105, 3470–3474. [Google Scholar] [CrossRef]
- Krishnan, S.; Vadapoo, R.; Riley, K.E.; Velev, J.P. Dispersion-corrected density functional theory comparison of hydrogen adsorption on boron-nitride and carbon nanotubes. Phys. Rev. B 2011, 84. [Google Scholar] [CrossRef] [Green Version]
- Matanović, I.; Belof, J.L.; Space, B.; Sillar, K.; Sauer, J.; Eckert, J.; Bačić, Z. Hydrogen adsorbed in a metal organic framework-5: Coupled translation-rotation eigenstates from quantum five-dimensional calculations. J. Chem. Phys. 2012, 137, 014701. [Google Scholar] [CrossRef] [PubMed]
- Ganji, M.D.; Hosseini-khah, S.M.; Amini-tabar, Z. Theoretical insight into hydrogen adsorption onto graphene: A first-principles B3LYP-D3 study. Phys. Chem. Chem. Phys. 2015, 17, 2504–2511. [Google Scholar] [CrossRef] [PubMed]
- Björkman, T.; Kurasch, S.; Lehtinen, O.; Kotakoski, J.; Yazyev, O.V.; Srivastava, A.; Skakalova, V.; Smet, J.H.; Kaiser, U.; Krasheninnikov, A.V. Defects in bilayer silica and graphene: Common trends in diverse hexagonal two-dimensional systems. Sci. Rep. 2013, 3. [Google Scholar] [CrossRef]
- Kotakoski, J.; Meyer, J.C.; Kurasch, S.; Santos-Cottin, D.; Kaiser, U.; Krasheninnikov, A.V. Stone–Wales-type transformations in carbon nanostructures driven by electron irradiation. Phys. Rev. B 2011, 83. [Google Scholar] [CrossRef] [Green Version]
- Kresse, G.; Furthmüller, J.; Marsman, M. The VASP Manual - Vaspwiki. Available online: https://www.vasp.at/wiki/index.php/The_VASP_Manual (accessed on 23 March 2020).
- Brinck, T.; Murray, J.S.; Politzer, P. Polarizability and volume. J. Chem. Phys. 1993, 98, 4305–4306. [Google Scholar] [CrossRef]
- Hirshfeld, F.L. Bonded-atom fragments for describing molecular charge densities. Theor. Chim. Acta 1977, 44, 129–138. [Google Scholar] [CrossRef]
- Chu, X.; Dalgarno, A. Linear response time-dependent density functional theory for van der Waals coefficients. J. Chem. Phys. 2004, 121, 4083–4088. [Google Scholar] [CrossRef]
Figure 1.
Schematic view of different (high-symmetry) sites for placing hydrogen molecule on graphene (top-red configurations, bridge-green configurations and hexagon-blue configurations).
Figure 1.
Schematic view of different (high-symmetry) sites for placing hydrogen molecule on graphene (top-red configurations, bridge-green configurations and hexagon-blue configurations).

Figure 2.
Interaction energy, , for two different alignments (horizontal, h, and vertical, v) of the H molecule at three adsorption sites (top, bridge, hexagon) on graphene.
Figure 2.
Interaction energy, , for two different alignments (horizontal, h, and vertical, v) of the H molecule at three adsorption sites (top, bridge, hexagon) on graphene.

Figure 3.
Adsorption maps of various graphene variants. The figures (a–e) are all clips of the sampled supercells.
Figure 3.
Adsorption maps of various graphene variants. The figures (a–e) are all clips of the sampled supercells.

Figure 4.
Contributions to the adsorption energy maps. (a) pure PBE-GGA energies, (b) analytical vdW dispersion according to Equations (4) and (5), (c) TS vdW dispersion calculated by VASP, and (d) geometry-dictated topology form the term. The corresponding full adsoprtion energy map is in Figure 3e. Contour lines are plotted every meV.

Table 1.
k-meshes used for sampling the Brillouin zone.
| System | k-Mesh Type | k-Mesh | Supercell |
|---|---|---|---|
| graphene | -centered | ||
| single vacancy | -centered | ||
| Stone–Wales defect | -centered | ||
| grain boundary | Monkhorst-Pack | ||
| POP-graphene | Monkhorst-Pack |
Table 2.
Parameters of the sampling used for constructing the adsorption maps. Sampling lattice refers to the symmetry of the sampling lattice, irreducible wedge defines the directions enclosing the sampling area. Symmetry operations refer to how the irreducible wedge is unfolded in order to sample the whole supercell lattice.
| System | Supercell Lattice | Sampling Lattice | Irreducible Wedge | Samples | Symmetry Operations |
|---|---|---|---|---|---|
| graphene | Å hexagonal | hexagonal | , | 121 | |
| single vacancy | Å hexagonal | triangle | , | 66 | |
| Stone–Wales defect | Å hexagonal | hexagonal (rotated by 30 with respect to the supercell lattice) | , | 110 | |
| grain boundary | Å, Å orthorhombic | rectangular | , | 170 | |
| POP-graphene | Å, Å orthorhombic | rectangular | , | 285 |
Table 3.
Adsorption energies of the H molecule on the three adsorption sites in all here considered configurations (see Figure 1, x- and y-alignments yield the same behaviour and are labelled h). DFT-PBE-D3 values are taken from Ref. [4].
| Configuration | DFT-PBE-TS | DFT-PBE-D3 [4] | |||
|---|---|---|---|---|---|
| Site | Alignment | ||||
| hexagon | v | −69 | 3.15 | −69 | 3.10 |
| bridge | v | −63 | 3.19 | −63 | 3.18 |
| top | v | −62 | 3.19 | −63 | 3.18 |
| hexagon | h | −75 | 2.94 | −67 | 3.10 |
| bridge | h | −63 | 3.09 | −58 | 3.16 |
| top | h | −62 | 3.10 | −57 | 3.16 |
Table 4.
Summary of the adsorption characteristics: minimum and maximum values of adsorption maps for different scenarios (Figure 3, fraction of the surface (in the used supercell) with adsorption energy in the range of adsorption minimum of pristine graphene meV and meV, and fraction of the supercell area with adsorption energy lower than that of pristine graphene. The values of +1 meV and +5 meV, were chosen arbitrarily.
| System | Surface [%] | Increased Surface [%] | |||
|---|---|---|---|---|---|
| min | max | ||||
| graphene | −68.7 | −62.7 | 59.41 | 4.95 | |
| single vacancy | −68.9 | −59.6 | 32.02 | 1.47 | 0.14 |
| Stone–Wales defect | −70.2 | −59.1 | 46.88 | 4.93 | 1.43 |
| grain boundary | −72.6 | −62.4 | 94.09 | 38.48 | 28.23 |
| POP-graphene | −77.4 | −64.2 | 100.00 | 71.39 | 49.91 |
© 2020 by the authors. Licensee MDPI, Basel, Switzerland. This article is an open access article distributed under the terms and conditions of the Creative Commons Attribution (CC BY) license (http://creativecommons.org/licenses/by/4.0/).
Share and Cite
MDPI and ACS Style
Gehringer, D.; Dengg, T.; Popov, M.N.; Holec, D. Interactions between a H2 Molecule and Carbon Nanostructures: A DFT Study. C 2020, 6, 16. https://0-doi-org.brum.beds.ac.uk/10.3390/c6010016
AMA Style
Gehringer D, Dengg T, Popov MN, Holec D. Interactions between a H2 Molecule and Carbon Nanostructures: A DFT Study. C. 2020; 6(1):16. https://0-doi-org.brum.beds.ac.uk/10.3390/c6010016
Chicago/Turabian StyleGehringer, Dominik, Thomas Dengg, Maxim N. Popov, and David Holec. 2020. "Interactions between a H2 Molecule and Carbon Nanostructures: A DFT Study" C 6, no. 1: 16. https://0-doi-org.brum.beds.ac.uk/10.3390/c6010016
Note that from the first issue of 2016, this journal uses article numbers instead of page numbers. See further details here.