Article

On the Problem of “Super” Storage of Hydrogen in Graphite Nanofibers

by
Yury S. Nechaev
1,*,
Evgeny A. Denisov
2,
Alisa O. Cheretaeva
3,
Nadezhda A. Shurygina
1,
Ekaterina K. Kostikova
4,
Andreas Öchsner
5 and
Sergei Yu. Davydov
6
1
G.V. Kurdjumov Centre of Metals Science and Physics, I.P. Bardin Research Institute for Ferrous Metallurgy, Radio Str., 23/9, Build. 2, 105005 Moscow, Russia
2
Solid State Electronics Department, St. Petersburg State University, Universitetskaya Nab. 7/9, 198904 St. Petersburg, Russia
3
Research Institute of Progressive Technologies, Togliatti State University, Belorusskaya Str., 14, 445020 Togliatti, Russia
4
Institute of Applied Mathematical Research, Karelian Research Centre of the Russian Academy of Science, Pushkinskaya Str., 11, 185910 Petrozavodsk, Russia
5
Faculty of Mechanical and Systems Engineering, Esslingen University of Applied Sciences, Kanalstrasse, 33, 73728 Esslingen, Germany
6
Ioffe Physical Technical Institute, RAS, Polytechnicheskaya Str., 26, 194021 St. Petersburg, Russia
*
Author to whom correspondence should be addressed.
Submission received: 26 February 2022 / Revised: 22 March 2022 / Accepted: 27 March 2022 / Published: 29 March 2022
(This article belongs to the Special Issue Carbon Materials for Physical and Chemical Hydrogen Storage)

Abstract

:
This article is devoted to some fundamental aspects of “super” storage in graphite nanofibers (GNF) of “reversible” (~20–30 wt.%) and “irreversible” hydrogen (~7–10 wt.%). Extraordinary results for hydrogen “super” storage were previously published by the group of Rodriguez and Baker at the turn of the century, which been unable to be reproduced or explained in terms of physics by other researchers. For the first time, using an efficient method of processing and analysis of hydrogen thermal desorption spectra, the characteristics of the main desorption peak of “irreversible” hydrogen in GNF were determined: the temperature of the highest desorption rate (Tmax = 914–923 K), the activation energy of the desorption process (Q ≈ 40 kJ mol−1), the pre-exponential rate constant factor (K0 ≈ 2 × 10⁻¹ s−1), and the amount of hydrogen released (~8 wt.%). The physics of hydrogen “super” sorption includes hydrogen diffusion, accompanied by the “reversible” capture of the diffusant by certain sorption “centers”; the hydrogen spillover effect, which provides local atomization of gaseous H2 during GNF hydrogenation; and the Kurdjumov phenomenon on thermoelastic phase equilibrium. It is shown that the above-mentioned extraordinary data on the hydrogen “super” storage in GNFs are neither a mistake nor a mystification, as most researchers believe.

Graphical Abstract

1. Introduction

It is well known that one of the urgent problems of hydrogen energy is that of compact and safe storage of “reversible” hydrogen (i.e., hydrogen with fairly fast extraction kinetics at operating temperatures) on board vehicles with fuel cells. In this regard, the long-term (about 25 years) problem of “super” storage (according to Maeland’s terminology [1]) of “reversible” hydrogen in graphite nanofibers (GNFs) is very topical. The problem was discussed in [1,2,3] considering the role of the largest corporations (including General Motors and Shell) and based on extraordinary (not reproduced by anyone and not properly interpreted) results [4,5,6,7,8,9,10,11,12]. Many researchers (including [13,14,15,16]) consider the results of [4,5,6,7,8,9,10,11,12] to be at least erroneous, since they could neither reproduce these results nor reveal their physics.
The purpose of this work was to return the attention of researchers to the solution of this topical problem by showing that the corrected results [4,5,6,7,8,9,10,11,12] are not a mistake or a mystification, by determining the necessary conditions for their reproduction by other researchers, and also by considering the physics of processes.
In this work, we used a modified (to a certain extent) methodology [17,18,19,20,21,22,23] for the analysis and interpretation of a number of experimental data, including for processing and analysis of thermal desorption (TDS) and thermogravimetric (TG) spectra from [5] for “irreversible” hydrogen in GNF, and also considered the physics [2,17,18,24,25] of “super” storage of hydrogen in GNF, including the spillover effect [26,27,28,29,30] and the G.V. Kurdjumov phenomenon of thermoelastic phase equilibrium [31,32].
One can expect that the conclusions arising from the results of the work will help to reproduce the effect of hydrogen “super” storage in GNF, and modern thermal desorption techniques, such as molecular beam thermal desorption spectrometry (MB-TDS) [33,34], will lead to more accurate experimental results for further theoretical work.

2. Methods

The technique [17,18,19,20,21,22,23] (described in detail in [20]) was developed, in particular, to study the problem noted above [1,2,3]. This technique makes it possible to determine, from TDS and TG spectra [5], the one heating rate (β), activation energies (Q), and pre-exponential factors (K0) of rate constants (K) of desorption processes corresponding to desorption peaks with different temperatures (Tmax) of the maximum desorption rate. It should be noted that when developing this methodology, a number of other works were taken into account, including [35,36,37,38,39].
The developed methodology [17,18,19,20,21,22,23] makes it possible to reveal the physics of desorption processes by thermodynamic analysis of the obtained characteristics of thermal desorption peaks and comparison with the corresponding independent experimental and theoretical data. The technique [20] contains several stages of implementation, including the use of some non-standard reliability criteria and the confirmation and/or the final refinement of the results using numerical simulation methods [23].
The first stage consists of approximating the investigated spectrum by the smallest number of symmetric Gaussians. The second stage consists of determining, in the first-order reaction approximation, for each of the Gaussians noted above (from the temperature dependence of the desorption rate (−dθ/dt) divided by β), the rate constant (K(T)) of hydrogen desorption at various temperatures around Tmax; hence, the values of Q and K0 are determined (using the Arrhenius equation). In this case, the kinetic equation for the first-order reaction is used in the form:
( 1 β ) d θ d t = d θ d T = K θ β = K 0 ( θ β ) exp ( Q R T ) ,
where t is time; T is the absolute temperature; R is the universal gas constant; θ = (C/C0) is the relative average hydrogen concentration in the sample corresponding to the considered Gaussian (for given values of T and t); θ = 1 at t = 0.
The corresponding criterion of reliability (Q*), showing the correspondence of the obtained value of Q to the Kissinger theory [36], can be obtained from the condition of the maximum desorption rate (d2θ/dT2 = 0) in the form:
Q * R T max 2 K ( T max ) β ,
where the quantities Tmax and K(Tmax) can be taken (in a satisfactory approximation) from the results obtained above for the considered Gaussian.
The next stage consists of determining Q and K0 in the second-order reaction approximation for each of the above-mentioned Gaussians. In this case, the kinetic equation for the second-order reaction is used in the form:
( 1 β ) d θ d t = d θ d T = K θ 2 β = K 0 ( θ 2 β ) exp ( Q R T ) .
The reliability criterion (Q*) can be obtained from the condition (d2θ/dT2 = 0) in the form:
Q * 2 R T max 2 θ ( T max ) K ( T max ) β ,
where the value of θ(Tmax) can be taken to be equal to 0.5 (with an error of about 15%).
The final stage is the refinement (and/or confirmation) of the above results using numerical simulation [23] of desorption spectra, taking into account (in the sense of a certain fixation) the values of Q* and K(Tmax). It should be noted that, in this case, the spectra under consideration are approximated not by Gaussians, but by peaks corresponding to first- or second-order processes; the error (scatter of values) in determining Q and ℓn K0 in most cases is about 15%.
The effectiveness of this methodology is confirmed by the results obtained with its help and the recently published results of studies of the thermal desorption of hydrogen in a number of carbon nanostructures and graphite materials [19,20,21,22,25].

3. Results of the Study of a Number of Experimental Data

3.1. Analysis and Interpretation of TDS and TG Spectra of the Rodriguez and Becker Group for “Irreversible” Hydrogen in GNF

The results of processing and analysis (using the technique [20]) of the thermal desorption (TDS) spectrum for “irreversible” hydrogen from [5] are shown in Figure 1a and Table 1. It should be noted that the total (refined) content of “irreversible” hydrogen in GNF samples (CH2Σ ≈ 11 ± 3 wt.%) was determined from the data of [5,8].
The results of processing and analysis [20] of the thermogravimetric (TG) spectrum from [5] are shown in Figure 1b and Table 2. There are reasons (in particular, from the consideration of curves (a), (b), and (c) in Figure 7 in [5]) to believe that peak #3 in Figure 1b is mainly associated with the gasification of carbon atoms and/or oxygen-containing functional complexes (groups). In this case, it should be taken into account that, in [5], when the material was heated in an inert atmosphere at temperatures up to 1300 K, no hydrocarbon products were found. Therefore, the value of the atomic ratio (H/C) for peak #3 (in Figure 1b) can be negligibly small, and there is no need to more accurately approximate this peak.
By comparison, a significant noise level for the spectrum in Figure 1b does not interfere with determining the characteristics of the main hydrogen peak #1 (Figure 1b) with the required (to solve the set goal) accuracy.
Analysis (using the methodology of [20]) of the results obtained (Table 1 and Table 2) for the main process of desorption of “irreversible” hydrogen (peak #1 in Figure 1a,b) from GNF samples [5] shows the process (reaction) of the first order (expression (1)), which corresponds to the following characteristics: Tmax = 914–923 K, Q ≈ 40 kJ mol−1, K0 ≈ 2 × 10⁻¹ s−1, CH2Σ ≈ 8 wt.% (i.e., atomic ratio (H/C) ≈ 1). The analysis shows that the desorption process is limited by hydrogen diffusion, which is accompanied by “reversible” capture [17,18,34,35,36] of the diffusant by certain “centers” of hydrogen chemisorption in GNF. This is comparable to diffusion processes of types I and II (with activation energies QI ≈ 20 kJ mol−1 and QII ≈ 120 kJ mol−1, respectively) considered in [17,18], having open access on the Internet. The resulting desorption activation energy (Q ≈ 40 kJ mol−1, Table 1 and Table 2) is (in addition to the QI and QII values noted above) the effective activation energy of such diffusion and is close (in absolute value) to the binding energy of the diffusant with the corresponding chemisorption “centers” in carbon material [17,18]. Obviously, the “centers” are localized, as it were, between the basic carbon planes in the GNF [5]; at the same time, they are almost completely filled with hydrogen; these basic carbon planes are, as it were, “separated” by layers of chemisorbed hydrogen (as in multilayer graphane [18]).
The characteristic diffusion size for the process under consideration can be estimated (up to an order of magnitude) using the well-known expression [17,36] L ≈ (D0/K0)1/2. In this expression, the value of the pre-exponential factor of the effective diffusion coefficient of hydrogen (D0) in GNF [5] can be in the range of the corresponding values for processes of types I and II in [17,18] (i.e., in the range from D0I ≈ 3 × 10⁻³ cm2 s−1 to D0II ≈ 2 × 103 cm2 s−1), which corresponds to the value L ≈ (1 × 10⁻¹ − 1 × 10²) cm ≈ 1 cm, which corresponds to a certain size of the sample [4,5] (a bundle of graphite nanofibers), leading to the quite acceptable desired value D0 ≈ 5 cm2 s−1.
Similarly [17,18,19,20,21,22,23], one can consider the results of processing (Table 1 and Table 2) of other (less significant) desorption peaks (Figure 1a,b).

3.2. Analysis and Interpretation of the Kinetic Data of the Rodriguez and Becker Group on the “Super” Sorption of “Reversible” Hydrogen (~30 wt.%) in GNF

As follows from the results of processing the kinetic data from [4] on the change in hydrogen pressure in the working chamber during the “super” adsorption of “reversible” hydrogen (at a temperature of about 300 K) for three samples (nos. 1, 2, and 3) of graphite nanofibers with a herringbone-type structure shown in Figure 2, the process proceeds as a first-order reaction with rate constants: K1ads.rev. = 2.7 × 10⁻⁵ s−1, K2ads.rev. = 3.8 × 10⁻⁵ s−1 and K3ads.rev. = 2.8 × 10⁻⁵ s−1, respectively. The characteristic time of “super” adsorption of “reversible” hydrogen (tads.rev. = Kads.rev.−1) here was about 9 h, and the hydrogenation time of the samples was 24 h.
There are reasons to believe that the process is limited by the diffusion of hydrogen over the characteristic distance Lsamp. ≈ 1 cm, corresponding to the sample size [4,5] (a bundle of graphite nanofibers), and is accompanied by “reversible” capture [17,18,36,37,38] of the diffusant by certain sorption “centers” in graphite nanofibers. This leads to an acceptable value of the effective diffusion coefficient of “reversible” hydrogen (Dads.rev. ≈ (Lsamp.2 × Kads.rev.) ≈ 3 × 10⁻⁵ cm2 s−1 corresponding to the type I process noted above (in Section 3.1) [17], and/or “centers” of physical sorption [17,40] in a carbon nanomaterial.
As shown in [4], the time of “super” desorption (at 300 K) of the predominant part of “reversible” hydrogen from GNF samples was about 10 min; the characteristic desorption time of “reversible” hydrogen can be taken (up to an order of magnitude) as tdes.rev. = (1/Kdes.rev.) ≈ 6 × 10² s, where Kdes.rev. is the rate constant of the desorption process (in the approximation of a first-order reaction). Assuming that the process is limited by the diffusion of hydrogen over the characteristic distance Lsamp.≈ 1 cm, corresponding to the sample size [4,5], and is accompanied by “reversible” capture of the diffusant by certain sorption “centers” in graphite nanofibers, we obtain an acceptable value of the effective diffusion coefficient of “reversible” hydrogen (Ddes.rev. ≈ (Lsamp.2 × Kdes.rev.) ≈ 1.7 × 10⁻³ cm2 s−1), which is possible with the “reversible” capture of the diffusant by the “centers” of physical sorption [17,40] in the carbon nanomaterial (see also Section 5 of the article). In this case, the “centers” of chemisorption in GNF [4,5] can apparently have a limiting filling with hydrogen, that is, a certain saturation, which leads to the cessation of their influence on hydrogen diffusion (see Equations (11) and (8′) in [41], having open access on the Internet).

3.3. Consideration of the Kinetic Data of the Rodriguez and Becker Group on X-ray Diffraction

X-ray diffraction experiments carried out by the Rodriguez and Becker group showed (see Figure 12 in [5]) that hydrogenation causes an increase in the interplanar spacing in graphite nanofibers from the initial value a0 = 0.340 nm (before hydrogenation) to ahyd. = 0.347 nm (after hydrogenation for 24 h and removal of “reversible” hydrogen). Such an expansion of the lattice is obviously due to the “super” adsorption of “irreversible” hydrogen up to a certain content of Chyd ≈ 8 wt.%, corresponding to desorption peak #1 in Figure 1a (see Section 3.1 and also Appendix A: Cavity model). In this case, it can be assumed that (ahyd.a0) = χ × Chyd., where the coefficient of proportionality χ ≈ 9 × 10⁻⁴ nm wt.%−1.
It was shown (see Figure 12 in [5]) that desorption aging (of hydrogenated samples) for t1 = 24 h in air at a temperature of 300 K leads to the value of the interplanar spacing of a24 = 0.345 nm and the corresponding content of “irreversible” hydrogen C24, and desorption aging for t2 = 48 h leads to a48 = 0.342 nm and a hydrogen content of C48. Within the framework of such a model, it can be shown that [(ahyd.a24)/((ahyd.a48)] = [(1 − exp (−24K))/(1 − exp (−48K))], where K (h−1) is the rate constant of the desorption process at 300 K, which is considered in the first-order reaction approximation.
Substitution of the experimental values of the interplanar distance leads to the value [(ahyd.a24)/((ahyd.a48)] = 0.4, which differs significantly from the limiting (at K → 0) value of lim [(1 − exp (−24K))/(1 − exp (−48K))] = 0.5. It should be noted that the value [(ahyd.a24)/((ahyd.a*48)] = 0.5 if we use the possible (within the measurement error) value of the interplanar distance a*48 = 0.343 nm (instead of a48 = 0.342 nm).
To estimate the rate constant (at 300 K) of the process under consideration, one can use the expression K = −(1/t) ln (Ct/Chyd.), where the desorption time t is 24 and 48 h, and the corresponding hydrogen content Ct is C24 = 5.6 wt.% and C48 = 2.2 wt.% (or C*48 = 3.3 wt.%). From here we obtain (up to an order of magnitude) the value K = Kdes.irrev.300K ≈ 1.7 × 10⁻² h−1, corresponding to the characteristic desorption time of ~60 h.
This value of the rate constant for the desorption of “irreversible” hydrogen (Kdes.irrev.300K) is in satisfactory agreement with the kinetic data of the group of Rodriguez and Becker on the change in the pore size distribution in GNF samples, where the desorption period at 300 K was 92 h (see Figure 11 in [5]).
In addition, it should be emphasized that such a value of the rate constant (Kdes.irrev.300K ≈ 4.6 × 10⁻⁶ s−1) is two orders of magnitude higher than the rate constant at 300 K obtained using the characteristics (Q and K0) for the desorption peak #1 (See Figure 1a and Table 1).
The analysis shows that the desorption process is limited by the diffusion of hydrogen along the characteristic distance Lsamp. ≈ 1 cm, corresponding to the size of the sample [5] (a bundle of graphite nanofibers), and is accompanied by “reversible” capture of the diffusant by certain sorption “centers” in graphite nanofibers. This leads to an acceptable value of the effective diffusion coefficient of “irreversible” hydrogen at 300 K (Ddes.irrev. 300K ≈ (Lsamp.2 × Kdes.irrev.300K) ≈ 5 × 10⁻⁶ cm2 s−1), which is expected in the case of “reversible” capture of the diffusant with chemisorption “centers” in GNF corresponding to the type I process in [17] and/or “centers” of physical sorption [17,40].

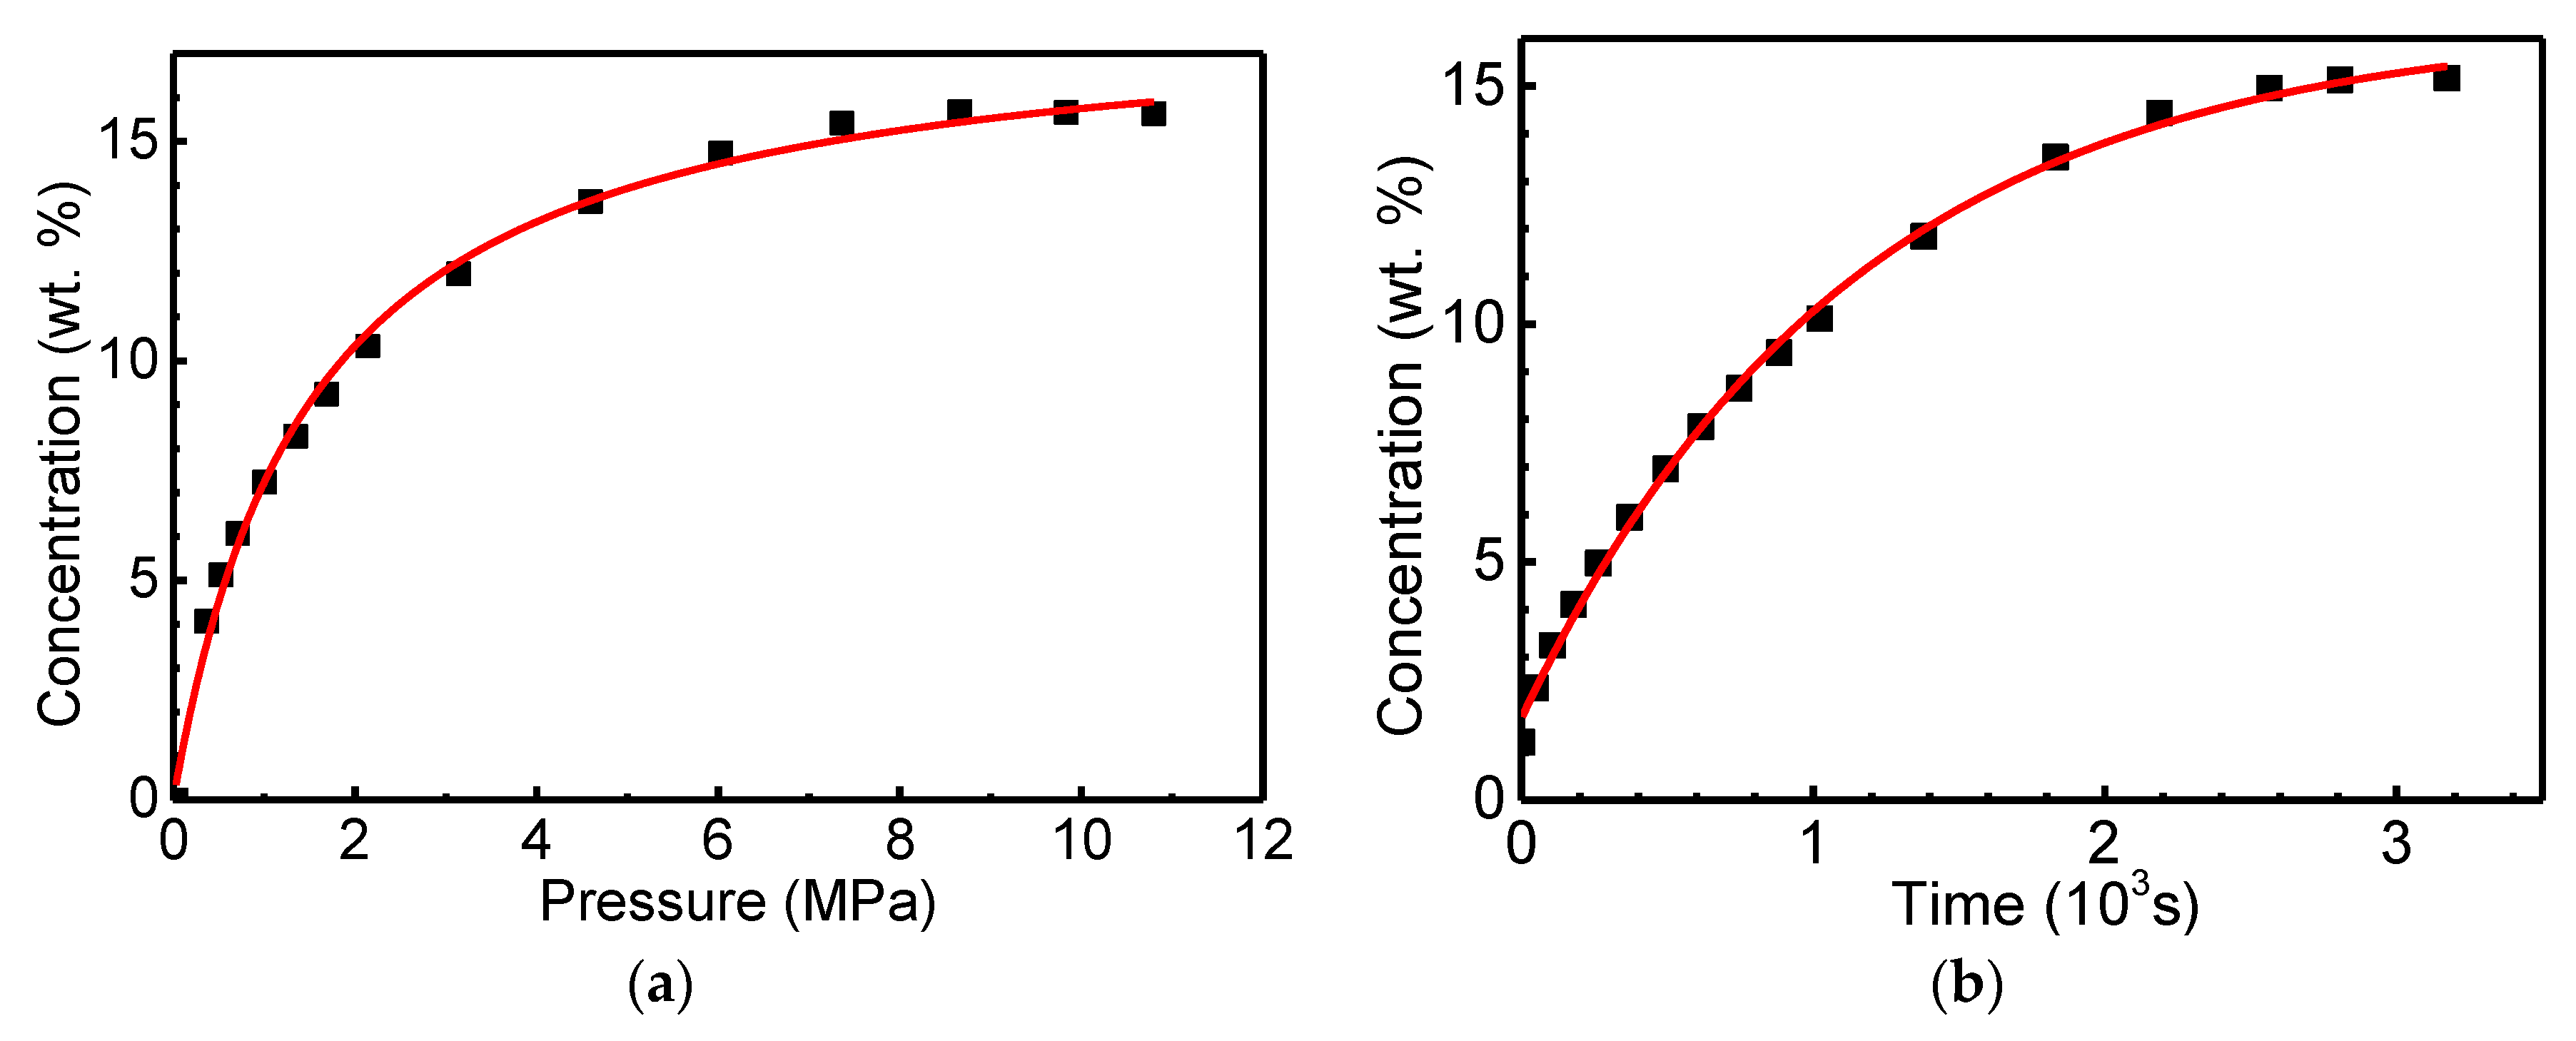
3.4. Consideration of the Results of the Gupta’s Group on the “Super” Sorption of “Reversible” Hydrogen (~17 wt.%) in GNF

The data obtained by Gupta’s group [10,11] on multiple “super” sorption of “reversible” hydrogen in graphite nanofibers and presented (to a certain extent) in Figure 3 and Figure 4 can be regarded as a satisfactory reproduction of the data [5,8] of the Rodriguez and Becker group (see Section 3.2). There is a correspondence (within the same order of magnitude) both in the amount of “reversible” hydrogen (~15 wt.% and ~17 wt.% (see Figure 3a and Figure 4)), and in the value of the characteristic time of its desorption at 300 K (tdes.rev. = Kdes.rev.−1 ≈ 1 × 10³ s, where Kdes.rev. is the rate constant of the desorption process obtained from the kinetic data in Figure 3b.
As shown in [2,17,18,24,25], the TEM results (Figure 4) can be considered as direct experimental evidence (proof) of multiple “super” adsorptions of “reversible” hydrogen (~17 wt.%) in GNF [11]. The similar transmission electron micrographs of GNF were also obtained in the works [9,10]. Detailed consideration of how the micrograph shown in Figure 4 is related to a direct proof of “super” hydrogen adsorption is presented in work [24], and in work [18], which has open access on the Internet.

3.5. Physics of “Super” Storage of “Reversible” Hydrogen in GNF

According to [2,17,18,24,25], the physics of extraordinary results [5,8,10,11] on the “super” storage of “reversible” hydrogen (about 20–30 wt.%) in graphite nanofibers can be associated with the hydrogen spillover effect [26,27,28,29,30], which ensures the atomization of molecular hydrogen and manifests itself near the particles of a metal catalyst in GNF samples, and with the G.V. Kurdjumov phenomenon of thermoelastic phase equilibrium [31,32]. In this case, there is a thermoelastic “megabar” compression (up to a solid state) of molecular hydrogen localized in lenticular nanocavities (see Figure 4) between the base carbon layers of the material, which occurs due to the association energy of atoms hydrogen penetrating into closed nanocavities through certain defects in the graphene material (see [18,22,42]). In this regard, it should be noted that the hydrogen molecules formed in closed nanocavities cannot escape from them, since only atomic hydrogen passes through defects, while a certain purification of hydrogen used for hydrogenation of GNF samples takes place.
Detailed consideration of how the spillover effect and the Kurdjumov phenomenon in the thermal elastic phase equilibrium may be active in the nanocavities, to clarify the claimed high density of hydrogen storage, is presented in work [24], and also in work [18], which has open access on the Internet. It can be also considered as a direct comparison between the theoretical and experimental analyses of the results.

4. Analysis of TDS Data for “Irreversible” Hydrogen in GNF

The results of processing and analysis of TDS data [13,14], which were obtained by Rzepka et al. with the advisory participation of Becker [8], are shown in Figure 5 and in Table 3.
The obtained characteristics of the main desorption peak #1.6 in Figure 5 (Tmax, Q, K0, CH2; see Table 3) are very different from the analogous characteristics of the main desorption peak #1.1a in Figure 1a (see Table 1), i.e., peak type #1.1a is absent in the TDS spectrum for GNF samples [13,14].
In [13], in particular, the authors noted (on p. 8) that Rodriguez and Becker [5,7] considered the presence of a certain high-temperature desorption peak to be an indicator (attribute) of a material for “super” storage of “reversible” hydrogen, while they [5,7] associated this peak with a relatively small part of the stored hydrogen, which could be released only at high temperatures, i.e., with the presence of a relatively small amount of “irreversible” hydrogen. Obviously, Rodriguez and Becker [5,7] had in mind the desorption peak of type #1.1a (see Figure 1a and Table 1), but they did not determine the characteristics (Q and K0) of this peak.
It should be emphasized that such desorption of a relatively small amount of “irreversible” hydrogen (corresponding to a peak of type #1.1a) from hydrogenated GNF was also noted in the works of the Gupta group [9,10,11,12].
The peak of type #1.1a was absent in the GNF TDS spectra in [13,14] (see Figure 3), so it was not possible to reproduce the results of [5,8,10,11] on the “super” storage of “reversible” hydrogen in GNF.
In works [13,14] (with the participation of Becker [8] as a consultant) the lowest (among the known values; see Figure 3 in the analytical review [17]) value of the amount of hydrogen adsorbed by graphite nanofibers (about 0.1 wt.%) was obtained by the Tibbetts group [16] (from the Research Center of the General Motors Corporation (see [2,3])).
In this regard, it should also be emphasized that typical results on hydrogen storage in GNF (see Figure 3 in [17]), obtained by other researchers, were reproduced by the group of Rodriguez and Becker (see Figure 5 in [5], where the quantity of hydrogen is ~2 wt.%, and Figure 4 in [43], where the quantity of hydrogen is ~3 wt.%.
As noted in [17], in order to reproduce the extraordinary results [5,8,10,11] of the Rodriguez–Becker and Gupta groups on the “super” storage of “reversible” hydrogen (~20–30 wt.%), it is necessary to disclose the treatment they used to activate the GNF, which ensures the appearance of the #1.1a-type peak in the TDS spectra (see Figure 1a). It is also necessary to study, with the use of recent theoretical and experimental techniques, the data [5] about the effect of cycle experiments on the GNF hydrogen absorption/desorption characteristics (Figures 5, 6, 9 and 10 in [5]), the pore size distribution measurements (Figure 11 in [5]), the effect of surface properties on the hydrogen adsorption on GNF (Figures 13 and 14 in [5]), and some others.

5. Conclusions

  • The study carried out in this work (using the methodology and results of [17,18,19,20,21,22,23,24,25]) of a number of kinetic and thermodynamic aspects (fundamentals) related to solving the problem of “super” storage of hydrogen in graphite nanofibers (GNF) [1,2,3] shows that the results obtained in works [5,6,7,8,9,10,11,12], i.e., the extraordinary experimental results (accumulation of about 20–30 wt.% of “reversible” hydrogen and about 7–10 wt.% of “irreversible” hydrogen), are neither a mistake nor a mystification.
  • It is shown that the physics of accumulation of ~20–30 wt.% of “reversible” high-density hydrogen intercalated in nanocavities between the base carbon layers in GNF is connected with the Kurdjumov phenomenon and the spillover effect in terms of thermoelastic phase equilibrium.
  • The conducted study shows that there is a real possibility of reproducing the earlier extraordinary experimental results [5,6,7,8,9,10,11,12], but only if the details of the technologies used in these works for activating GNF are revealed, which led to the appearance of a type #1 thermal desorption peak in the material (Figure 1a) corresponding to “irreversible” chemisorbed hydrogen (in an amount of ~8 wt.%) with certain kinetic and thermodynamic characteristics.
  • In this regard, further experimental and theoretical studies are needed.
  • There are reasons ([1,2,3] and others) to believe that, in the foreseeable future, these technologies will be used by one of the largest automotive companies to gain a great competitive advantage.

Author Contributions

Conceptualization, Y.S.N., E.A.D., A.Ö. and S.Y.D.; methodology, Y.S.N., E.A.D. and E.K.K.; software, E.K.K., E.A.D., N.A.S. and A.O.C.; validation, Y.S.N., S.Y.D., E.A.D. and A.O.C.; formal analysis, A.Ö., S.Y.D. and N.A.S.; investigation, E.A.D., E.K.K., N.A.S. and A.O.C.; resources, Y.S.N. and E.A.D.; data curation, E.A.D., N.A.S., A.O.C. and E.K.K.; writing—original draft preparation, Y.S.N.; writing—review and editing, A.Ö., E.A.D. and A.O.C.; visualization, S.Y.D. and A.Ö.; supervision, Y.S.N.; project administration, Y.S.N.; funding acquisition, Y.S.N. All authors have read and agreed to the published version of the manuscript.

Funding

This work was financially supported by the Russian foundation for basic research (Project # 18-29-19149 mk).

Institutional Review Board Statement

Not applicable.

Informed Consent Statement

Not applicable.

Data Availability Statement

All data analyzed during this study are included in this published article.

Conflicts of Interest

The authors declare no conflict of interest.

Appendix A. Cavity Model

Let us consider three regions confined with graphene monolayers. We assume that the topmost and bottommost layers of graphene are fixed and immovable. Molecular hydrogen can be pumped into the central interplanar region (region 2) (or pumped out of this region).
Let us now consider three states of the central region 2. In the state a, there is no hydrogen in region 2. Van der Waals interaction with Lennard-Jones potential takes place between the carbon atoms of adjacent planes: V L J j a ( z ) = 4 ε [ ( σ / z ) 12 ( σ / z ) 6 ] , where j = 1, 2, 3 numbers the regions, z 0 = d 0 = 2 6 σ 1.12 σ is the equilibrium interplanar distance (in graphite d0 = 3.35 Å) and ε is the value of the interplanar bond energy. The force constant corresponding to the Lennard-Jones potential is k L J 75 ε / d 0 2 60 ε / σ 2 .
In state b, a certain amount of molecular hydrogen is injected into region 2, which creates pressure P H 2 2 b = n H 2 k B T , where n H 2 is the concentration of hydrogen molecules, T is the absolute temperature, and kB is the Boltzmann constant. The interplanar repulsion of region 2, caused by pressure P H 2 2 b , is counteracted by specific (per unit area) van der Waals forces of attraction equal to: f 22 = k L J Δ d b / S , f 12 = f 32 = k L J Δ d b / 2 S , where Δ d b = d b d 0 and S = 3 3 a 0 2 / 4 ≈ 2.62 Å2 is the area per carbon atom in graphene, a0≈ 1.42 Å is the distance between adjacent carbons in graphene. Then, the total specific compression force is equal to f 2 b = 2 k L J Δ d b / S .
In addition to molecular hydrogen, there is atomic chemisorbed hydrogen localized on the inner surfaces of graphene planes that confine region 2, whose atoms have charges q. Assuming for simplicity that the charges localized on opposite graphene planes are separated from each other by a distance d0, we obtain the specific electrostatic repulsion force f e l 2 b = q 2 / ε H 2 d b 2 S , where ε H 2 is the dielectric permittivity caused by the polarization of hydrogen molecules. Then, the equilibrium condition in the case b has the form:
P H 2 2 b + f e l 2 b f 2 b = 0 .
In the state c, there is no molecular hydrogen after pumping out, but chemisorbed atomic hydrogen remains, so there is an unshielded electrostatic repulsion f e l 2 c = q 2 / 2 d c 2 S , where we assumed that there is only one chemisorbed hydrogen atom per unit cell of graphene (as is the case in graphane). Electrostatic repulsion is counteracted by van der Waals forces f 2 c = 2 k L J Δ d c / S , where Δ d c = d c d 0 . The equilibrium condition in the case c has the form:
f e l 2 c f 2 c = 0 .
Now the values Δ d b and Δ d c can be determined based on the expressions obtained above. Let us enter the following parameter:
δ Δ d b Δ d c d 0 A 150 ε , A = P H 2 2 b S d 0 ( Z e ) 2 2 d 0 ( 1 1 ε H 2 ) ,
where we assume the charge of the chemisorbed hydrogen atom q = Ze (e—elementary charge). From (A3), it follows that δ > 0 at T > T * = ( Z e ) 2 ( 1 1 / ε H 2 ) / 2 k B d 0 2 S n H 2 and δ < 0 at T < T * .
Let us make some numerical estimates: e 2 / 2 d 0 2.15   eV , S d 0 8.78 Å3. Further, P H 2 2 b S d 0 = N H 2 2 k B T , where N H 2 2 is the number of H2 molecules in a parallelepiped with a base area S and height d0. Assuming the volume of a hydrogen molecule ~1 Å3, we obtain N H 2 2 7 and P H 2 2 qb S d 0 50 k B T . For T = 500   K , we obtain P H 2 2 b S d 0 2.16   eV , so that P H 2 2 qb S d 0 e 2 / 2 d 0 (this estimate corresponds to Z = 1 and ε H 2 > > 1 ). Thus, the value of δ (both magnitude and sign) depends on the parameters | Z | < 1 , ε H 2 > 1 and T . Model estimates for the adsorption of a single hydrogen atom on single sheet graphene [44] give Z ~ 0.2 0.4 . Numerical calculations performed within the framework of various variants of DFT (density functional theory) lead to noticeably different results. Further, the value of ε H 2 for such a specific hydrogen medium (more similar, at least, to a viscous liquid, if not to an amorphous solid formation, than to a gas [25]) is absolutely unknown. Taking into account these two circumstances, we can only assume that the value of A lies in the interval A ~0.01–2 eV. Both theoretical estimates [45] and experimental data [46] show that ε 0.52   meV / atom . Hence for ε H 2 > > 1 we get δ ~ 0   ( Z = 1 ) 0.25   ( Z = 0 ) .

References

  1. Maeland, A.J. The storage of hydrogen for vehicular use—A review and reality check. Int. Sc. J. Altern. Energy Ecol. 2002, 1, 19–29. [Google Scholar]
  2. Nechaev, Y.S.; Yurum, A.; Tekin, A.; Yavuz, N.K.; Yürüm, Y.; Veziroglu, T.N. Fundamental Open Questions on Engineering of “Super” Hydrogen Sorption in Graphite Nanofibers: Relevance for Clean Energy Applications. Am. J. Anal. Chem. 2014, 5, 1151–1165. [Google Scholar] [CrossRef] [Green Version]
  3. Nechaev, Y.S.; Makotchenko, V.G.; Shavelkina, M.B.; Nechaev, M.Y.; Veziroglu, A.; Veziroglu, T.N. Comparing of Hydrogen On-Board Storage by the Largest Car Companies, Relevance to Prospects for More Efficient Technologies. Open J. Energy Effic. 2017, 6, 73–79. [Google Scholar] [CrossRef] [Green Version]
  4. Chambers, A.; Park, C.; Baker, R.T.K.; Rodriguez, N.M. Hydrogen Storage in Graphite Nanofibers. J. Phys. Chem. B 1998, 102, 4253–4256. [Google Scholar] [CrossRef]
  5. Park, C.; Anderson, P.E.; Chambers, A.; Tan, C.D.; Hidalgo, R.; Rodriguez, N.M. Further Studies of the Interaction of Hydrogen with Graphite Nanofibers. J. Phys. Chem. 1999, 103, 10572–10581. [Google Scholar] [CrossRef]
  6. Rodriguez, N.M.; Baker, R.T.K. Storage of Hydrogen in Layered Nanostructures. U.S. Patent 5653951, 5 August 1997. [Google Scholar]
  7. Rodriguez, N.M.; Baker, R.T.K. Method for Introducing Hydrogen into Layered Nanostructures. U.S. Patent 6159538, 12 December 2000. [Google Scholar]
  8. Baker, R.T.K. Encyclopedia of Materials: Science and Technology; Elsevier: Amsterdam, The Netherlands, 2005; 932p. [Google Scholar]
  9. Gupta, B.K.; Srivastava, O.N. Synthesis and hydrogenation behavior of graphitic nanofibers. Int. J. Hydrogen Energy 2000, 25, 825–830. [Google Scholar] [CrossRef]
  10. Gupta, B.K.; Srivastava, O.N. Further Studies on Microstructural Characterization and Hydrogenation Behavior of Graphitic Nanofibers. Int. J. Hydrogen Energy 2001, 26, 857–862. [Google Scholar] [CrossRef]
  11. Gupta, B.K.; Tiwari, R.S.; Srivastava, O.N. Studies on Synthesis and Hydrogenation Behavior of Graphitic Nanofibers Prepared through Palladium Catalyst Assisted Thermal Cracking of Acetylene. J. Alloys Comp. 2004, 381, 301–308. [Google Scholar] [CrossRef]
  12. Gupta, B.K.; Srivastava, O.N. New carbon variants: Graphitic nanofibers (nano-springs, nano-shoeckers) as hydrogen storage materials. Int. Sci. J. Altern. Energy Ecol. 2006, 5, 63. [Google Scholar]
  13. Rzepka, M.; Bauer, E.; Reichenauer, G.; Schliermann, T.; Bernhardt, B.; Bohmhammel, K.; Braue, W. Hydrogen Storage Capacity of Catalytically Grown Carbon Nanofibers. J. Phys. Chem. B 2005, 109, 14979–14989. [Google Scholar] [CrossRef]
  14. Reichenauer, G.; Rzepka, M.; Bauer, E.; Schliermann, T.; Bernhardt, B.; Bohmhammel, K.; Braue, W. Hydrogen storage capacity of catalytically grown carbon nanofibers. In Proceedings of the International Conference on Carbon, Aberdeen, UK, 6–21 July 2006. [Google Scholar]
  15. Hirscher, M.; Becher, M.; Haluska, M.; Quintel, A.; Skakalova, V.; Choi, Y.-M.; Fink, J. Hydrogen Storage in Carbon Nanostructures. J. Alloys Comp. 2002, 330, 654–658. [Google Scholar] [CrossRef]
  16. Tibbetts, G.G.; Meisner, G.P.; Olk, C.H. Hydrogen storage capacity of carbon nanotubes, filaments, and vapor-grown fibers. Carbon 2001, 39, 2291–2301. [Google Scholar] [CrossRef]
  17. Nechaev, Y.S. The nature, kinetics, and ultimate storage capacity of hydrogen sorption by carbon nanostructures. Phys. Usp. 2006, 49, 563–591. [Google Scholar] [CrossRef]
  18. Nechaev, Y.S.; Veziroglu, T.N. On the hydrogenation-dehydrogenation of graphene-layer-nanostructures: Relevance to the hydrogen on-board storage problem. Int. J. Phys. Sci. 2015, 10, 54–89. [Google Scholar] [CrossRef] [Green Version]
  19. Nechaev, Y.S.; Alexandrova, N.M.; Shurygina, N.A.; Cheretaeva, A.O.; Kostikova, E.K.; Öchsner, A. On characteristics and physics of processes of thermal desorption of deuterium from isotropic graphite at 700–1700 K. J. Nucl. Mater. 2020, 535, 152162. [Google Scholar] [CrossRef]
  20. Nechaev, Y.S.; Alexandrova, N.M.; Cheretaeva, A.O.; Kuznetsov, V.L.; Öchsner, A.; Kostikova, E.K.; Zaika, Y.V. Studying the thermal desorption of hydrogen in some carbon nanostructures and graphite. Int. J. Hydrogen Energy 2020, 45, 25030–25042. [Google Scholar] [CrossRef]
  21. Nechaev, Y.S.; Alexandrova, N.M.; Shurygina, N.A.; Cheretaeva, A.O.; Denisov, E.A.; Kostikova, E.K. Studying the States of Hydrogen in Graphene, Graphite, and Steels. Bull. Russ. Acad. Sci. Phys. 2021, 85, 771–775. [Google Scholar] [CrossRef]
  22. Nechaev, Y.S.; Denisov, E.A.; Shurygina, N.A.; Cheretaeva, A.O.; Kostikova, E.K.; Davydov, S.Y.; Öchsner, A. Revealing Hydrogen States in Carbon Structures by Analyzing the Thermal Desorption Spectra. C 2022, 8, 6. [Google Scholar] [CrossRef]
  23. Zaika, Y.V.; Kostikova, E.K.; Nechaev, Y.S. Hydrogen thermal desorption peaks: Modeling and interpretation. Tech. Phys. 2021, 66, 210–220. [Google Scholar] [CrossRef]
  24. Nechaev, Y.S.; Alexandrova, N.M.; Shurygina, N.A.; Cheretaeva, A.O. On manifestation & physics of the Kurdjumov and spillover effects in carbon nanostructures, under intercalation of high density hydrogen. Fuller. Nanotub. Carbon Nanostruct. 2020, 28, 233–237. [Google Scholar] [CrossRef]
  25. Nechaev, Y.S.; Denisov, E.A.; Shurygina, N.A.; Cheretaeva, A.O.; Kostikova, E.K.; Davydov, S.Y. On the Physics and Atomic Mechanisms of Molecular Hydrogen Intercalation into Graphite Nanofibers. JETP Lett. 2021, 114, 337–340. [Google Scholar] [CrossRef]
  26. Yang, R.T.; Wang, Y. Catalyzed Hydrogen Spillover for Hydrogen Storage. J. Am. Chem. Soc. 2009, 131, 4224–4226. [Google Scholar] [CrossRef] [PubMed]
  27. Zacharia, R.; Rather, S.; Hwang, S.W.; Nahm, K.S. Spillover of physisorbed hydrogen from sputter-deposited arrays of platinum nanoparticles to multi-walled carbon nanotubes. Chem. Phys. Lett. 2007, 434, 286–291. [Google Scholar] [CrossRef]
  28. Zhou, C.; Wu, J.; Nie, A.; Forrey, R.C.; Tachibana, A.; Cheng, H. On the Sequential Hydrogen Dissociative Chemisorption on Small Platinum Clusters: A Density Functional Theory Study. J. Phys. Chem. C 2007, 111, 12773–12778. [Google Scholar] [CrossRef]
  29. Zielinski, M.; Wojcieszak, R.; Monteverdi, S.; Mercy, M.; Bettahar, M.M. Hydrogen storage in nickel catalysts supported onactivated carbon. Int. J. Hydrogen Energy 2007, 32, 1024–1032. [Google Scholar] [CrossRef]
  30. Karim, W.; Spreafico, C.; Kleibert, A.; Gobrecht, J.; VandeVondele, J.; Ekinci, Y.; van Bokhoven, J.A. Catalyst support effects on hydrogen spillover. Nature 2017, 541, 68–71. [Google Scholar] [CrossRef]
  31. Lobodyuk, V.A.; Estrin, E.I. Martensitic Transformations; Cambridge International Science Publishing: Cambridge, UK, 2014; 538p, ISBN 9781907343995. [Google Scholar]
  32. Koval’, Y.M. Features of Relaxation Processes During Martensitic Transformation. Usp. Fiz. Met. 2005, 6, 169–196. [Google Scholar] [CrossRef] [Green Version]
  33. Lobo, R.F.M.; Santos, D.M.F.; Sequeira, C.A.C.; Ribeiro, J.H.F. Molecular Beam-Thermal Desorption Spectrometry (MB-TDS) Monitoring of Hydrogen Desorbed from Storage Fuel Cell Anodes. Materials 2012, 5, 248–257. [Google Scholar] [CrossRef]
  34. Lobo, R.F.M.; Berardo, F.M.V.; Ribeiro, J.H.F. Molecular beam-thermal hydrogen desorption from palladium. Rev. Sci. Instr. 2010, 81, 043103. [Google Scholar] [CrossRef]
  35. Habenschaden, E.; Küppers, J. Evaluation of flash desorption spectra. Surf. Sci. 1984, 138, L147–L150. [Google Scholar] [CrossRef]
  36. Wei, F.-G.; Enomoto, M.; Tsuzaki, K. Applicability of the Kissinger’s formula and comparison with the McNabb–Foster model in simulation of thermal desorption spectrum. Comput. Mater. Sci. 2012, 51, 322–330. [Google Scholar] [CrossRef]
  37. Legrand, E.; Oudriss, A.; Savall, C.; Bouhattate, J.; Feaugas, X. Towards a better understanding of hydrogen measurements obtained by thermal desorption spectroscopy using FEM modelling. Int. J. Hydrogen Energy 2015, 40, 2871–2881. [Google Scholar] [CrossRef]
  38. Ebihara, K.-I.; Kaburaki, H.; Suzudo, T.; Takai, K. A numerical study on the validity of the local equilibrium hypothesis in modelling hydrogen thermal desorption spectra. ISIJ Int. 2009, 49, 1907–1913. [Google Scholar] [CrossRef] [Green Version]
  39. Zhao, X.; Outlaw, R.A.; Wang, J.J.; Zhu, M.Y.; Smith, G.D.; Holloway, B.J. Thermal desorption of hydrogen from carbon nanosheets. J. Chem. Phys. 2006, 124, 194704. [Google Scholar] [CrossRef] [Green Version]
  40. Nayyar, I.; Ginovska, B.; Karkamkar, A.; Gennett, T.; Autrey, T. Physi-Sorption of H2 on Pure and Boron–Doped Graphene Monolayers: A Dispersion–Corrected DFT Study. C 2020, 6, 15. [Google Scholar] [CrossRef] [Green Version]
  41. Nechaev, Y.S. Characteristics of hydride-like segregates of hydrogen at dislocations in palladium. Phys. Uspekhi 2001, 44, 1189–1198. [Google Scholar] [CrossRef]
  42. Hu, S.; Lozada-Hidalgo, M.; Wang, F.C.; Mishchenko, A.; Schedin, F.; Nair, R.; Hill, W.; Boukhvalov, D.W.; Katsnelson, M.I.; Dryfe, R.A.W.; et al. Proton transport through one-atom-thick crystals. Nature 2014, 516, 227–230. [Google Scholar] [CrossRef] [Green Version]
  43. Lueking, A.D.; Yang, R.T.; Rodriguez, N.M.; Baker, R.T.K. Hydrogen Storage in Graphite Nanofibers: Effect of Synthesis Catalyst and Pretreatment Conditions. Langmuir 2004, 20, 714–721. [Google Scholar] [CrossRef]
  44. Davydov, S.Y.; Sabirova, G.I. Adsorption of hydrogen, alkali metal, and halogen atoms on graphene: Adatom charge calculation. Techn. Phys. Lett. 2011, 37, 515–518. [Google Scholar] [CrossRef]
  45. Liu, Z.; Liu, J.Z.; Cheng, Y.; Li, Z.; Wang, L.; Zheng, Q. Interlayer binding energy of graphite: A mesoscopic determination from deformation. Phys. Rev. B 2012, 85, 205418. [Google Scholar] [CrossRef] [Green Version]
  46. Wang, W.; Dai, S.; Li, X.; Yang, J.; Srolovitz, D.J.; Zheng, Q. Measurement of the cleavage energy of graphite. Nat. Commun. 2015, 6, 7853. [Google Scholar] [CrossRef] [PubMed] [Green Version]
Figure 1. Processing (using the technique [20]) of thermal desorption (TDS) and thermogravimetric (TG) data from [5] for “super” desorption of “irreversible” hydrogen from GNF samples with a herringbone structure (see Figure 2 in [5]). (a) Fitting by three Gaussians (peaks ##1–3) of the TDS spectrum (β = 0.17 K s−1) for samples subjected to hydrogenation in gaseous H2 (at 300 K, 11–4 MPa, 24 h); the red curve corresponds to the sum of three peaks. (b) Fitting by three Gaussians (peaks ##1–3) of the temperature derivative of the TG spectrum for samples subjected to hydrogenation in gaseous H2 (at 300 K, 11–4 MPa, 24 h) and subsequent heating (β = 0.17 K/s) in He; the red curve corresponds to the sum of three peaks.
Carbon 08 00023 g001
Figure 2. Processing (in the first-order reaction approximation) of kinetic data from [4] on the change in hydrogen pressure in the working chamber during “super” adsorption of “reversible” hydrogen (at a temperature of about 300 K) for three samples of graphite nanofibers with a “herringbone” structure.
Carbon 08 00023 g002
Figure 3. Processing of thermodynamic and kinetic data from [10] on the “super” sorption of “reversible” hydrogen (~15 wt.%) for GNF samples with a “plate” structure (see Figure 4) subjected to hydrogenation (24 h) in gaseous molecular hydrogen (at a pressure of 12 MPa and a temperature of 300 K) and subsequent dehydrogenation with a decrease in hydrogen pressure to 0.1 MPa: (a) processing of adsorption data in the approximation of the sorption isotherm of the Henry–Langmuir type [17]; (b) processing of thermal desorption data in the first-order reaction approximation.
Carbon 08 00023 g003
Figure 4. A micrograph of graphite nanofibers [11] subjected to hydrogenation (24 h) in gaseous molecular hydrogen at a pressure of 12 MPa and a temperature of 300 K to a content of “reversible” hydrogen of ~17 wt.%. The sizes of lenticular nanocavities in one of the nanofibers are shown, which are necessary for estimating (see works [2,17,18,24]) the volume of such nanocavities and the density of “reversible” hydrogen localized in them.
Carbon 08 00023 g004
Figure 5. Approximation by two Gaussians of the thermal desorption spectrum (kinetic curves 0.08 wt.% and 0.02 wt.% from Figure 18 in [13]) for sample #3 GNF with a herringbone structure (Table 3 in [13]), subjected to the action of gaseous molecular hydrogen at a pressure of 13 MPa and subsequent heating from 293 K (β = 0.10 K s−1) to a stop and isothermal holding at 1173 K.
Carbon 08 00023 g005
Table 1. The results of processing [20] of three peaks (Figure 1a) in the approximation of reactions of the first and second orders. Here γ is the proportion of the peak in the spectrum; (H/C) is the atomic ratio (hydrogen/carbon) corresponding to the hydrogen content (CH2 = γ∙CH2Σ) for the given peak; CH2Σ ≈ 11 ± 3 wt.% (from [5,8]).
Peak
#
Tmax,
K
Reaction
Order
Q,
kJ mol−1
K0,
s−1
K(Tmax),
s−1
Q*,
kJ mol−1
γCH2,
wt.%
(H/C)
1914139.01.5 × 10−19 × 10−4390.768.41.1
277.55.1 × 1012 × 10−377.5
2103611994.2 × 1074 × 10−31980.020.20.02
23988.8 × 10177 × 10−3396
3116111268.5 × 1022 × 10−31250.222.40.30
22507.0 × 1084 × 10−3250
Table 2. The results of processing [20] of three peaks (Figure 1b) in the approximation of reactions of the first and second orders. Here γ is the proportion of the peak in the spectrum; (H/C) is the atomic ratio (hydrogen/carbon) corresponding to the hydrogen content (wt.%) for a given hydrogen peak, obtained by appropriate integration of this peak.
Peak
#
Tmax,
K
Reaction OrderQ,
kJ mol−1
K0,
s−1
K(Tmax),
s−1
Q*,
kJ mol−1
γwt. %(H/C)
19231432.9 × 10−11 × 10−3430.238.51.1
2871.7 × 1022 × 10−387
2116511521.5 × 1042 × 10−31520.082.90.4
23042.0 × 10114 × 10−3303
3134511491.0 × 1032 × 10−31480.6926
22981.2 × 1091 × 10−3297
Table 3. The results of processing [20] of two peaks (Figure 5) in the approximation of reactions of the first and second orders.
Peak
#
Tmax,
K
Reaction OrderQ,
kJ mol−1
K0,
s−1
K(Tmax),
s−1
Q*,
kJ mol−1
γwt. %(H/C)
1120311631.6 × 1041.3 × 10−31620.960.080.010
23253.6 × 10112.7 × 10−3324
23971684.5 × 1065.1 × 10−3670.040.020.002
21334.1 × 10151.0 × 10−3134
Publisher’s Note: MDPI stays neutral with regard to jurisdictional claims in published maps and institutional affiliations.

