
Hydrogen Storages Based on Graphene Nano-Flakes: Density Functional Theory Approach


Division of Applied Chemistry, Faculty of Engineering, Hokkaido University, Sapporo 060-8628, Japan
C 2022, 8(3), 36; https://0-doi-org.brum.beds.ac.uk/10.3390/c8030036
Submission received: 2 May 2022
/
Revised: 2 June 2022
/
Accepted: 15 June 2022
/
Published: 27 June 2022
(This article belongs to the Special Issue Carbon Materials for Physical and Chemical Hydrogen Storage)
Abstract
:Carbon materials such as graphene, carbon nanotubes, fullerene, and graphene nanoflakes (GNFs) are used for hydrogen storage. The doping of alkali metals to these materials generally increases the accumulation density of molecular hydrogen (H2). However, the reason why the doping enhances the ability of the H2 storage of GNF is not clearly known, although there are some explanations. In addition, the information on the storage capacity of GNF is ambiguous. In the present review article, we introduce our recent theoretical studies on the interaction of GNF with H2 molecules carried out to elucidate the mechanism of hydrogen storage in alkali-doped GNFs. As alkali metals, lithium (Li), sodium (Na), and potassium (K) were examined, and the abilities of hydrogen storage were discussed. Next, the mechanism of Li-diffusion on GNF, which plays a crucial role in Li-battery, was presented. There are several unanswered questions. In particular, does lithium diffuse randomly on GNF? Or is there a specific diffusion path? We present our study, which elucidates the factors governing lithium diffusion on GNF. If the dominant factor is known, it is possible to arbitrarily control the diffusion path of lithium. This will lead to the development of highly functional battery materials. Finally, the molecular design of H adsorption–desorption reversible storage devices based on GNF will be introduced. Elucidating the mechanism of hydrogen storage, Li-diffusion on GNF, and molecular design of storage device is important in understanding the current molecular devices and provide a deeper insight into materials chemistry.

1. Introduction
Molecular hydrogen (H2) is the ultimate clean energy that is abundant in the form of water [1,2,3]. The thermal efficiency of the combustion process of H2 is more than three times higher than that of gasoline (143 vs. 44 MJ/kg) [4]. However, H2 has a wide explosion limit concentration range in air (4–75%) [5], and the volume efficiency of H2 is significantly lower than that of gasoline (0.011 vs. 34.9 MJ/kg). Hence, the safe transportation of hydrogen and high-density H2-storage must be technologically developed quickly to shift to a hydrogen-energy-based society [6,7,8]. Currently, efficient hydrogen storage is a key challenge for the hydrogen economy due to the lack of effective large-capacity hydrogen carriers [9,10].
Carbon nanostructures such as graphene nanoflakes (GNFs) and carbon nanotubes (CNTs) have been widely studied as hydrogen storage media due to their large surface area and light weight [11,12,13,14,15,16]. Single-walled CNTs are known to absorb ca. 5–10 wt% of hydrogen at low temperature (134 K) [12]. However, at room temperature, CNTs are not suitable for H2 storage due to the low binding energy and weak interaction with H2 [17,18].
Recently, alkali metal-doping of carbon nanostructures has attracted attention for its ability to enhance hydrogen storage capacity [19,20,21,22,23,24,25,26]. It was found experimentally that the doping of Li to CNT produces an increase of up to 14 wt% of H2 at room temperature [19]. This value is comparable or greater than those gained in cryoadsorption and metal hydride systems. The Li-doped CNTs have a high hydrogen-uptake capacity and the adsorption–desorption cycle can be repeated with negligible decreases in the adsorption capacity.
Theoretical calculations for systems consisting of Li-doped carbon materials and H2 have been carried out by several groups to elucidate the binding structures and adsorption energies [27,28,29,30,31,32]. Using the density functional theory (DFT) method, Kolmann et al. calculated the binding energy of H2 to the Li-decorated benzene molecule (Li-Bz) in 2008: the binding energy obtained was 4.7 kcal/mol, where Bz is a model of GNF. This calculation was the first original work regarding the carbon material–Li–H2 system [33].
More recently, D’Arcy et al. carried out quantum Monte Carlo simulations to the Bz-Li-(H2)n system (n = 1, and 2), and binding energies were obtained to be 4.5 kcal/mol (n = 1) and 3.2 kcal/mol (n = 2) [34,35]. Using a polycyclic aromatic hydrocarbon (PAH) composed of 14 benzene rings, Zhu et al. calculated the binding energy of the Li atom. The Li atom adsorbed to the surface with a binding energy of 14.8 kcal/mol (n = 1) [21].
In the present review article, we introduce our recent theoretical studies on the interaction between the GNF and H2 molecules. To understand the mechanism of alkali metal-activation in GNFs, the interactions of H2 molecules with metal-doped GNFs were investigated using the DFT method. In particular, a solution to the activation effects of metal doping to GNF is clearly presented. The small to large GNFs composed of 7–37 benzene rings were used. These sizes were similar to those of the real GNFs. As metals, lithium, sodium, potassium, and magnesium were used and the abilities of H2 storage were discussed. Additionally, the mechanism of the Li-diffusion on GNF, which plays a crucial role in the Li-battery, is presented. Does lithium diffuse randomly on GNF? Or is there a specific diffusion path? The factors governing lithium diffusion derived from a quantum chemical point of view are shown. Finally, the molecular design of a H2 adsorption–desorption reversible storage device is proposed. We would like to clearly show that GNFs are useful as hydrogen storage and molecular devices.
2. Hydrogen Storage in Lithium (Li) Doped Graphene Nanoflake (GNF)
Lithium–graphene systems have been utilized as Li-ion batteries [36] and Li-sulfur batteries [37]. In particular, the Li–sulfur battery is expected as next-generation energy storage devices. Carbon materials such as GNFs, CNTs, and fullerene can be used for hydrogen storage. Alkali doping to these materials generally increases their H2-storage density. However, the effects of Li on the H2 storage mechanism and capacity of GNF are not clearly understood. In this section, DFT studies on the mechanism of hydrogen storage due to GNFs doped by Li-metals are presented [38].
PAH was used as a model molecule for GNF, as shown in Figure 1. A GNF composed of 37 benzene rings was used as a model of a GNF, and GNF–M–(H2)n and GNF–M+-(H2)n (M = Li and Na, n = 0–12) clusters were used as hydrogen storage systems. DFT calculations were performed using a Coulomb-attenuating exchange-correlation energy functional (CAM-B3LYP) with a 6-311G(d,p) basis set, which are expressed as CAM-B3LYP/6-311G(d,p).
First, the structure of GNF was optimized, and then M (or M+) was placed in the central region of the GNF. The structures of the GNF–M and GNF–M+ were optimized, where all atoms of the GNF–M+/M were fully optimized. The binding energy of M to GNF is defined as follows:
where E(X) is the total energy of X. If Ebind(M) is positive, M can bind exothermally to GNF. The binding energy of H2 to GNF–M (per one H2 molecule) is defined as follows:
If Ebind(n) is positive, the H2 molecule can bind to GNF–M as an exothermic reaction. The atomic and molecular charges were calculated by the natural population analysis (NPA) method.
2.1. Structures of the Li Doped–GNF
The structures of GNF–M and GNF–M+ (M = Li) were fully optimized. The optimized distance of M from the GNF surface (i.e., height, h) is shown in Table 1. Both the atom and ion (Li and Li+) bond to the hexagonal site of GNF, where six carbon atoms of GNF in the central region orient equivalently to Li and Li+. The heights of Li and Li+ from the graphene surface were h = 1.736 and 1.771 Å, respectively, suggesting that both species are located in similar positions from the surface. The binding energies of Li and Li+ were 17.1 and 52.8 kcal/mol, respectively, indicating that the binding of Li+ to GNF was three times stronger than that of Li. The NPA atomic charges on Li and Li+ were +0.929 and +0.937, respectively, indicating that the net charge of Li on GNF was similar to that of Li+. A large electron transfer (0.929e) occurred from Li to GNF after binding to the surface. These results strongly indicate that the electronic state of the Li atom on GNF was significantly close to that of the Li+ ion on GNF because the Li atom was changed to the Li+ ion on GNF.
The height of the Li atom was slightly lower than that of the Li+ ion. This is due to the fact that Coulomb interaction between Li+ and GNF− is formed by electron transfer from Li to GNF after the binding of Na to GNF: Li + GNF → (Li)+(GNF)− in the case of the Li atom. This interaction causes a shorter Li-GNF distance. In contrast, only charge transfer takes place in the Li + ion: Li+ + GNF → (Li-GNF)+.
2.2. Binding Structures of the Hydrogen Molecules to GNF–Li
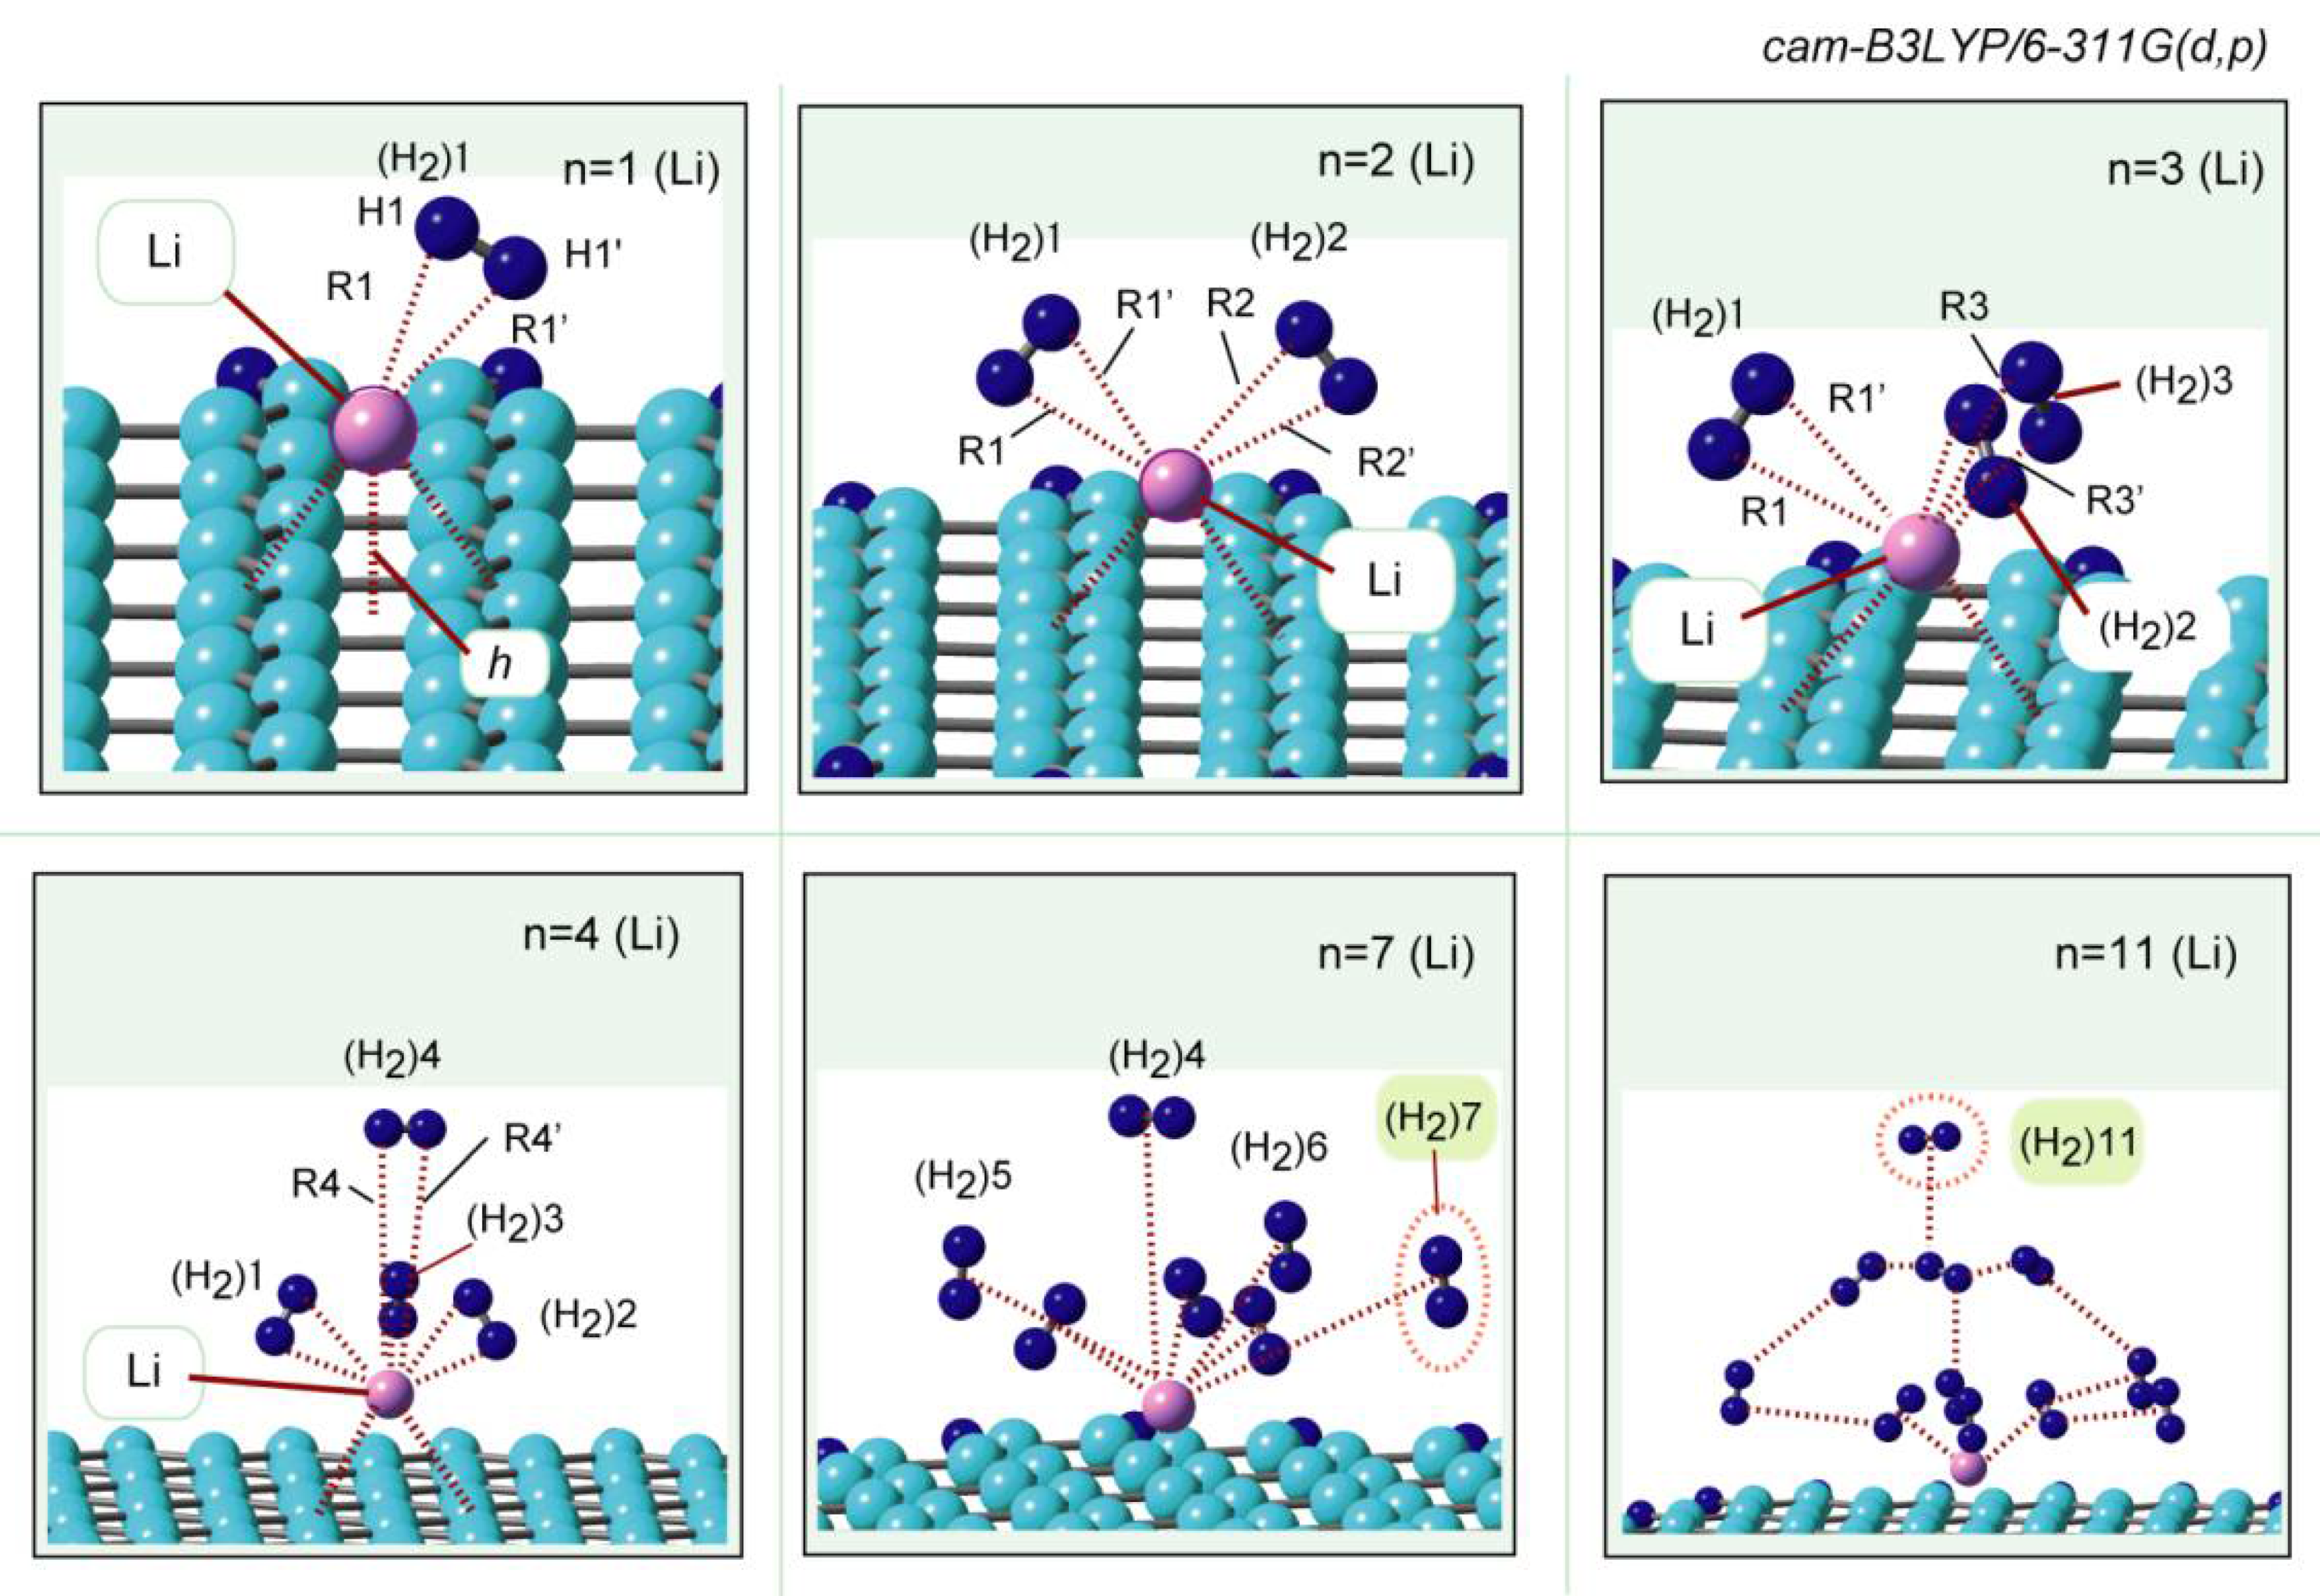
GNF–Li has the ability for the storage of H2 molecules. The binding structures of H2 to GNF–Li are illustrated in Figure 2, where the geometry optimization of GNF–Li–(H2)n (n = 1–12) were carried out at the CAM-B3LYP/6-311G(d,p) level. In n = 1, H2 binds to the Li atom of GNF–Li with a side-on structure. The distance of H2 from Li was 2.027 Å. The binding structures for n = 2 and 3 were also side-on, where the distances of H2 from Li were about 2.080 Å.
The binding distance is 4.080 Å (n = 4), meaning that the first coordination shell is saturated by three H2 molecules (n = 3). In contrast, the fourth hydrogen molecule is weakly bound to the hydrogen molecules in the first coordination shell (n = 1–3). The fifth and sixth hydrogen molecules, (H2)5 and (H2)6, were also bound to H2 in the first shell (n = 1–3). (H2)7 and (H2)11, the seventh and eleventh hydrogen molecules, were located far from the Li atom.
In the case of the lithium ion system GNF–Li+(ion)-H2, similar binding structures and electronic states were obtained due to the fact that the electronic state of GNF–Li+(ion) is very similar to that of GNF–Li(atom).
2.3. Binding Energy of H2 to GNF–Li
Li-doped GNF can store the H2 molecules, as shown in the previous section. This section discusses the bond energy of H2 to GNF–Li. The binding energy of H2 to GNF–Li is given in Figure 3, which is plotted as a function of n. The binding energies for n = 1, 3, and 7 were 3.83, 2.85 and 1.43 kcal/mol (per H2 molecule), respectively. The energy decreased gradually as a function of n and reaches to a constant value at n = 12. These trends strongly suggest that GNF–Li is effective to use as a H2 storage material. GNF–Li can store H2 up to the second coordination shell (n = 1–7), if the threshold of binding energy is assumed to be 1.4 kcal/mol.
In the GNF–Li+–(H2)n lithium ion system, similar energetics were observed. The binding energy in the GNF–Li+(ion) is slightly larger than the Li atom because the magnitude of ionic charge in the GNF–Li+(ion) is slightly larger than GNF–Li(atom).
Next, we considered the effect of the GNF surface on the electronic states of Li. Does graphene promote or decrease the adsorption of hydrogen onto lithium? This is a topic that needs to be elucidated. To understand the effect of GNF on the binding energy between Li and H2, the binding energy of H2 to bare Li was calculated without GNF and the results are plotted in Figure 3 (open squares). The binding energy of H2 to the Li atom is defined as
The binding energies of Li-(H2)n without GNF were significantly lower than those of GNF–Li–(H2)n: 1.35 kcal/mol (n = 4), 0.82 kcal/mol (n = 7) and 0.50 kcal/mol (n = 12).
These results indicate that the lithium is activated by GNF due to electron capture, and the lithium atom behaves as a lithium ion on the GNF surface.
3. Hydrogen Storage in Sodium (Na) Doped GNF
In the previous section, the hydrogen storage mechanism in the GNF–Li system was presented. The Li atom and Li+ ion act as high-efficient hydrogen storage materials. Unfortunately, Li is an expensive metal because of its high shipping cost. In this regard, sodium (Na) is an inexpensive metal despite its similar chemical properties to Li. In this chapter, DFT studies on the hydrogen storage mechanism of Na-doped GNF are presented [39].
3.1. Structures of Na-Doped Graphene Nanoflake
The structures of GNF–Na and GNF–Na+ were optimized at the CAM-B3LYP/6-311G(d,p) level. Both Na and Na+ were bound to the hexagonal sites on the GNF surface. The sites were the same as those of Li on GNF. The Na–surface distance (height of Na from GNF, h), Na–GNF binding energy, and NPA atomic charge of Na are listed in Table 1 together with those of Na+. The heights were calculated to be h = 2.247 (Na) and 2.288 Å (Na+). The positions of the Na atom and Na+ ion were similar to each other, although Na was slightly closer to the surface than Na+. This is due to the Coulomb interaction between Na+ and GNF− in the case of the Na atom. The heights of the Na species were higher than those of the Li species due to the difference in the ionic radii.
The binding energies to GNF were 4.4 (Na) and 37.5 kcal/mol (Na+), respectively, indicating that the binding of Na+ was about nine-times stronger than Na. This is caused by the large electron transfer from Na to GNF after binding (0.98e). The NPA atomic charges were +0.978 (Na) and +0.979 (Na+), respectively. The net atomic charge of Na on GNF was very similar to that of Na+ on GNF. The feature of electron transfer was in good agreement with the GNF–Li (Li+) systems, as summarized in Table 1, where the NPA atomic charges on the Li and Li+ adsorbed on GNF were +0.929 and +0.937, respectively.
3.2. Binding Structures of the Hydrogen Molecules to GNF–Na
The structures of H2 bound to GNF–Na (n = 1–6) are illustrated in Figure 4. The geometries of GNF–Na–(H2)n (n = 1–12) were calculated at the CAM-B3LYP/6-311G(d,p) level. The first H2 molecule (n = 1) was bound to Na with a side-on structure, and distance of H2 from Na was 2.415 Å, where two hydrogen atoms of H2 were equivalently bound to Na.
The similar side-on structures were found from the second to fourth H2 molecules, (H2)2-(H2)4. The fifth H2 molecule, (H2)5 was bound to Na from the orthogonal position of the surface when n = 5, with a distance of 2.833 Å, which was longer than those of (H2)1–4; clearly, the first coordination shell was saturated at n = 4. The fifth and sixth H2 molecules were bound to H2 molecules in the first shell. (H2)5 and (H2)6 were not directly bound to Na (the distances between the sixth H2 molecule and Na and the nearest H2 molecule were 5.037 and 3.625 Å, respectively. Side-on coordination structures were observed in all clusters (n = 7–12).
3.3. Binding Energies of H2 to GNF–Na
Figure 5 shows the binding energy of H2 to GNF–Na (per H2 molecule) plotted as a function of n. The first addition of H2 (n = 1) to GNF–Na caused the binding energy of 2.72 kcal/mol. The energy decreased gradually with increasing n. The values of binding energies were 2.67 (n = 2), 2.50 (n = 3), 2.34 (n = 4), and 2.01 kcal/mol (n = 5). In larger systems, the binding energies for n = 8, 10, and 12 were 1.45, 1.22, and 1.03 kcal/mol, respectively. Thus, the binding energies in the larger systems were larger than 1.0 kcal/mol, suggesting that the GNF–Na system can store H2 molecules.
The binding energies of CHF-Na+ (ion) are slightly larger than those of CNF-Na (atom), and the curve of binding energies are similar to each other. Both atom and ion can bind H2 as storage, as well as the Li system.
4. Hydrogen Storage in Potassium (K) Doped GNF
The adsorption mechanism of H2 to GNF–M (Li and Na) was presented in the previous sections. Both Li and Na can trap efficiently H2 molecules. Potassium (K) is also an alkali metal. In this section, the adsorption of H2 to GNF–K is discussed.
4.1. Structures of K-Doped GNF
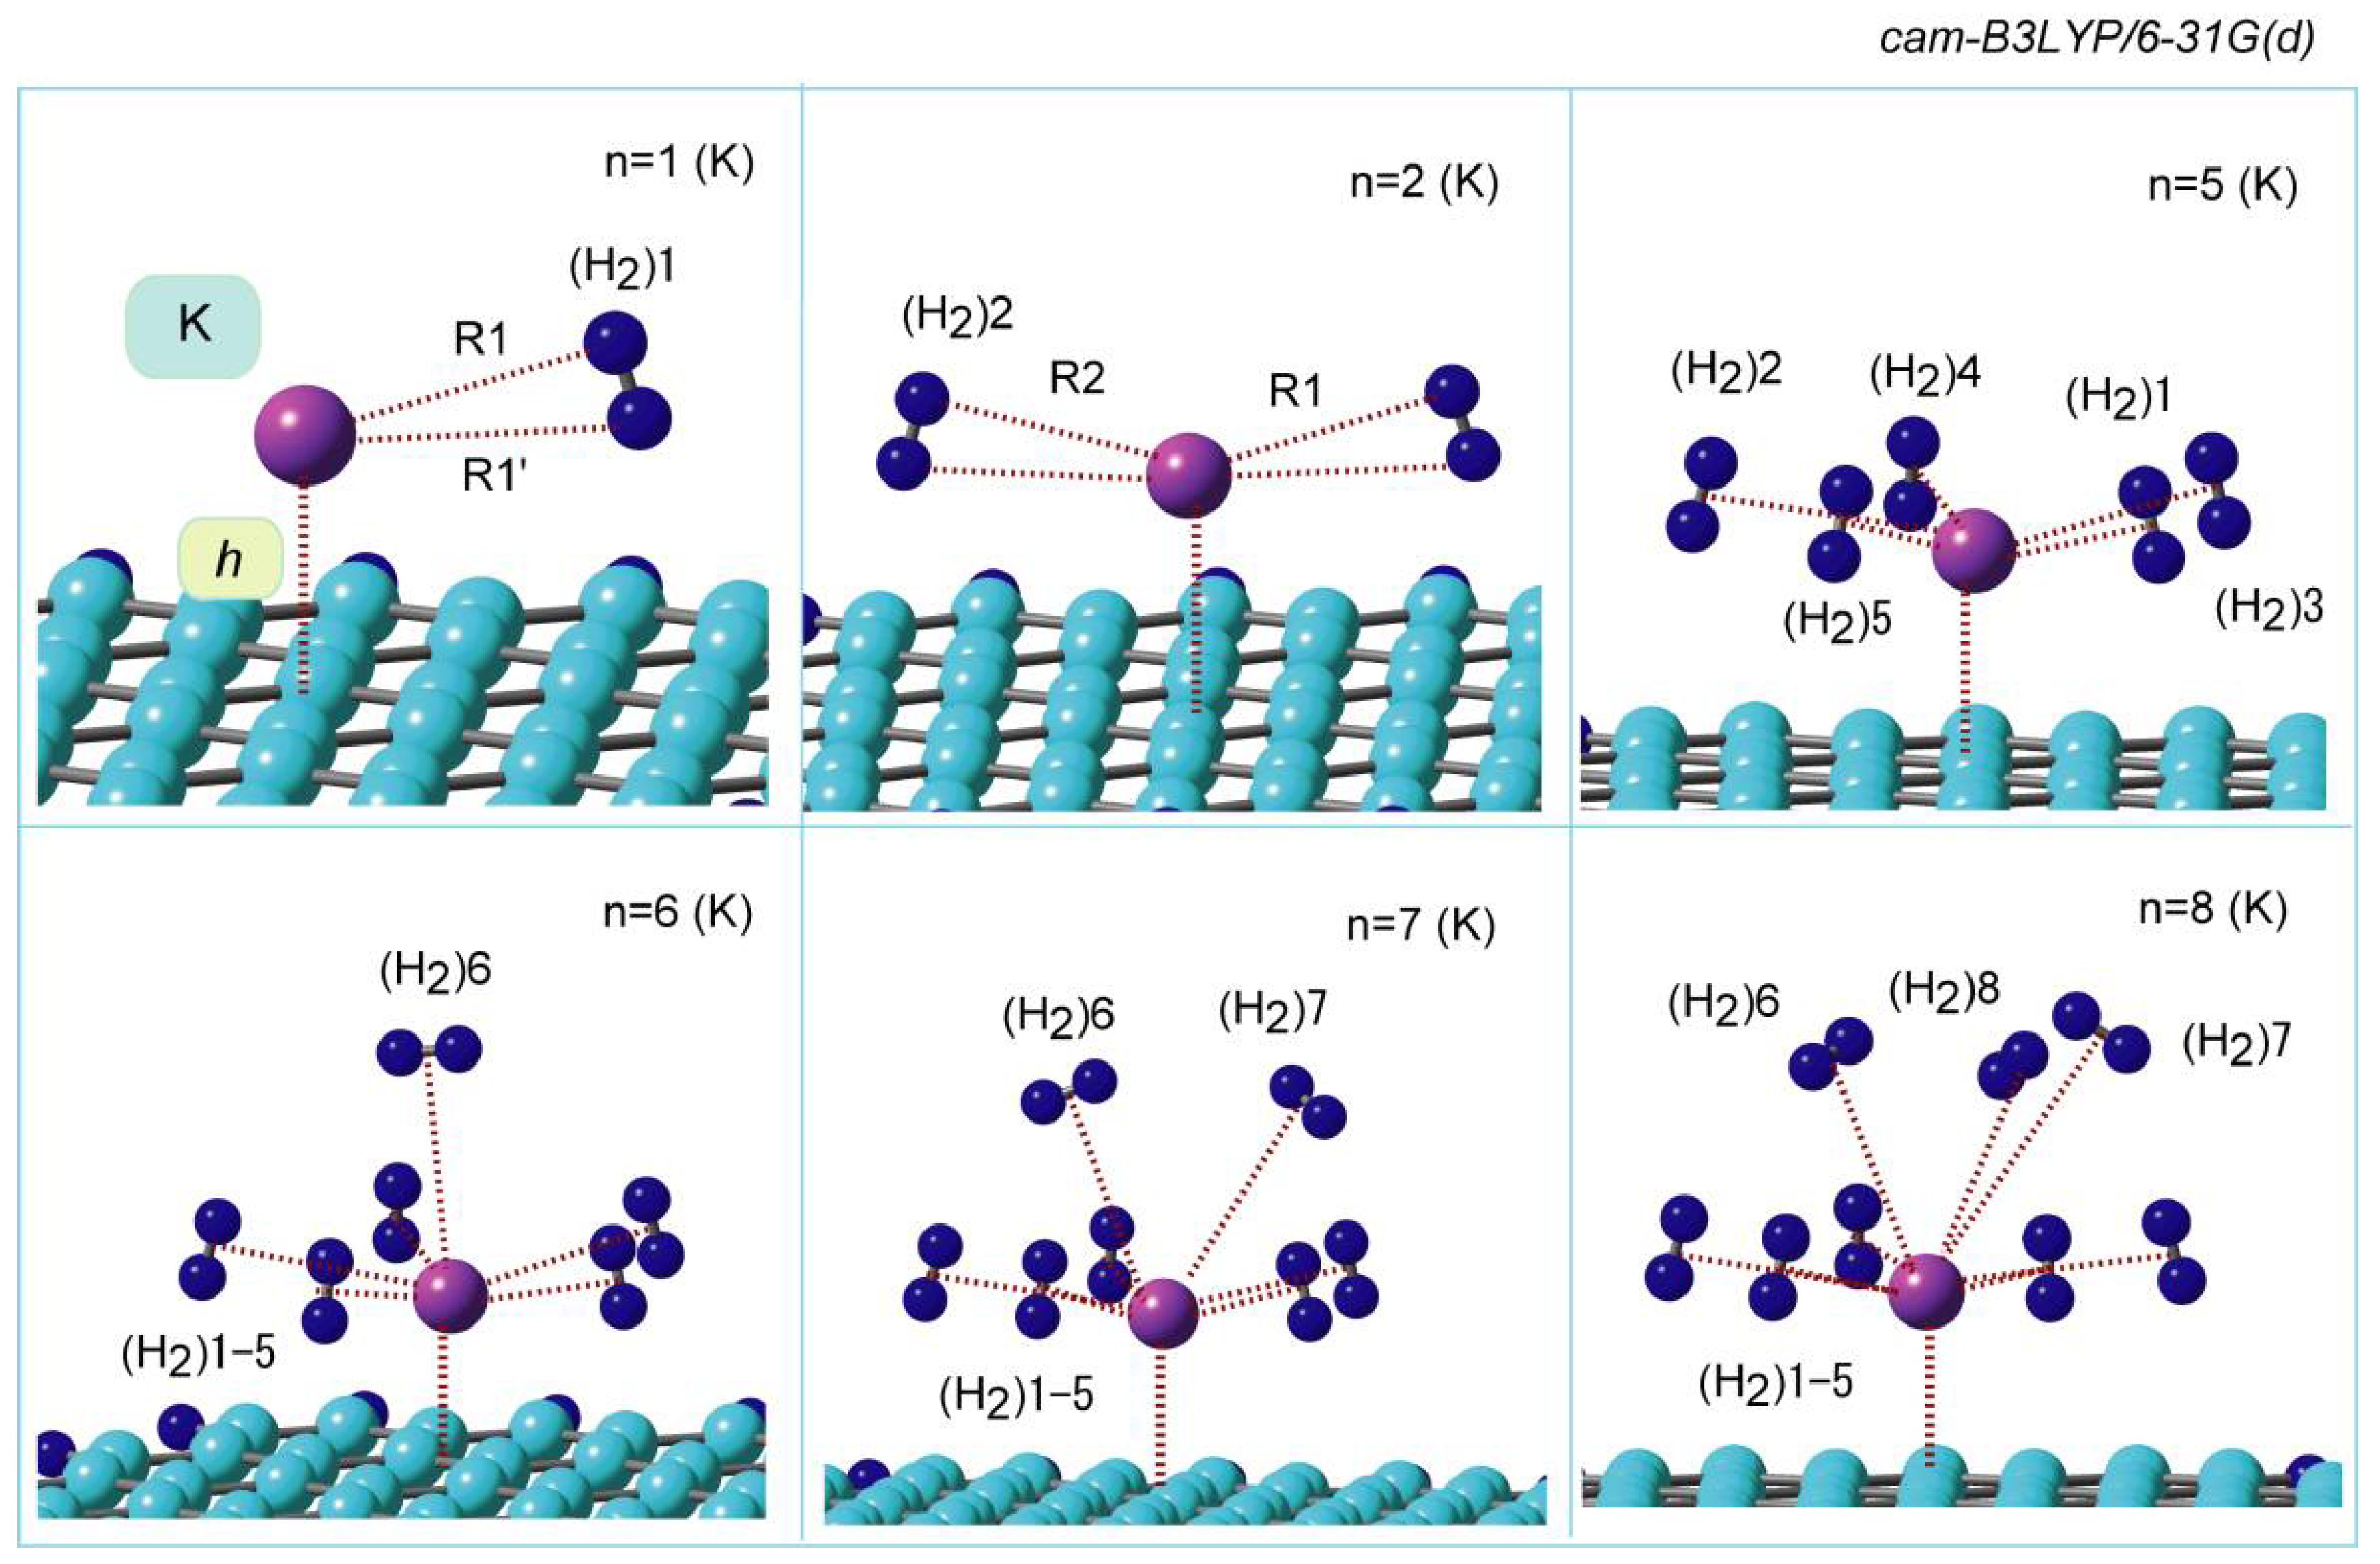
The optimized structures of GNF–K–(H2)n are illustrated in Figure 6. The first hydrogen molecule, (H2)1, was bound to K with a side-on form (n = 1). The distances of the hydrogen atoms of (H2)1 were 3.035 and 3.126 Å from K on GNF. In n = 2, two H2 molecules were bound to K with the side-on forms as well as n = 1. The distances of (H2)1 and (H2)2 from K were R1 = 3.043 and R2 = 3.044 Å, which were close to those of n = 1 (3.035 Å). The coordination structures and distances for n = 1 to 5 were similar to each other. The sixth and seventh H2 molecules, (H2)6-7 were oriented from the vertical position of GNF–K, as shown in Figure 6 (n = 6 and 7). However, the distances of (H2)6-7 from K were 3.163 Å, which was also close to those of n = 1–5, meaning that these hydrogen molecules are located in the first coordination shell around K.
The drastic change in the bond distance took place at n = 8, where the distance of (H2)8 from K was 4.121 Å, indicating that the first coordination shell was saturated at n = 7.
In the case of K+ (ion), similar binding structures were also obtained. This was due to the fact that the K atom is changed to the K+ ion when K binds to the GNF surface as well as Li and Na.
4.2. Comparison of Binding Energies in GNF–M–H2 (M = Li, Na, and K)
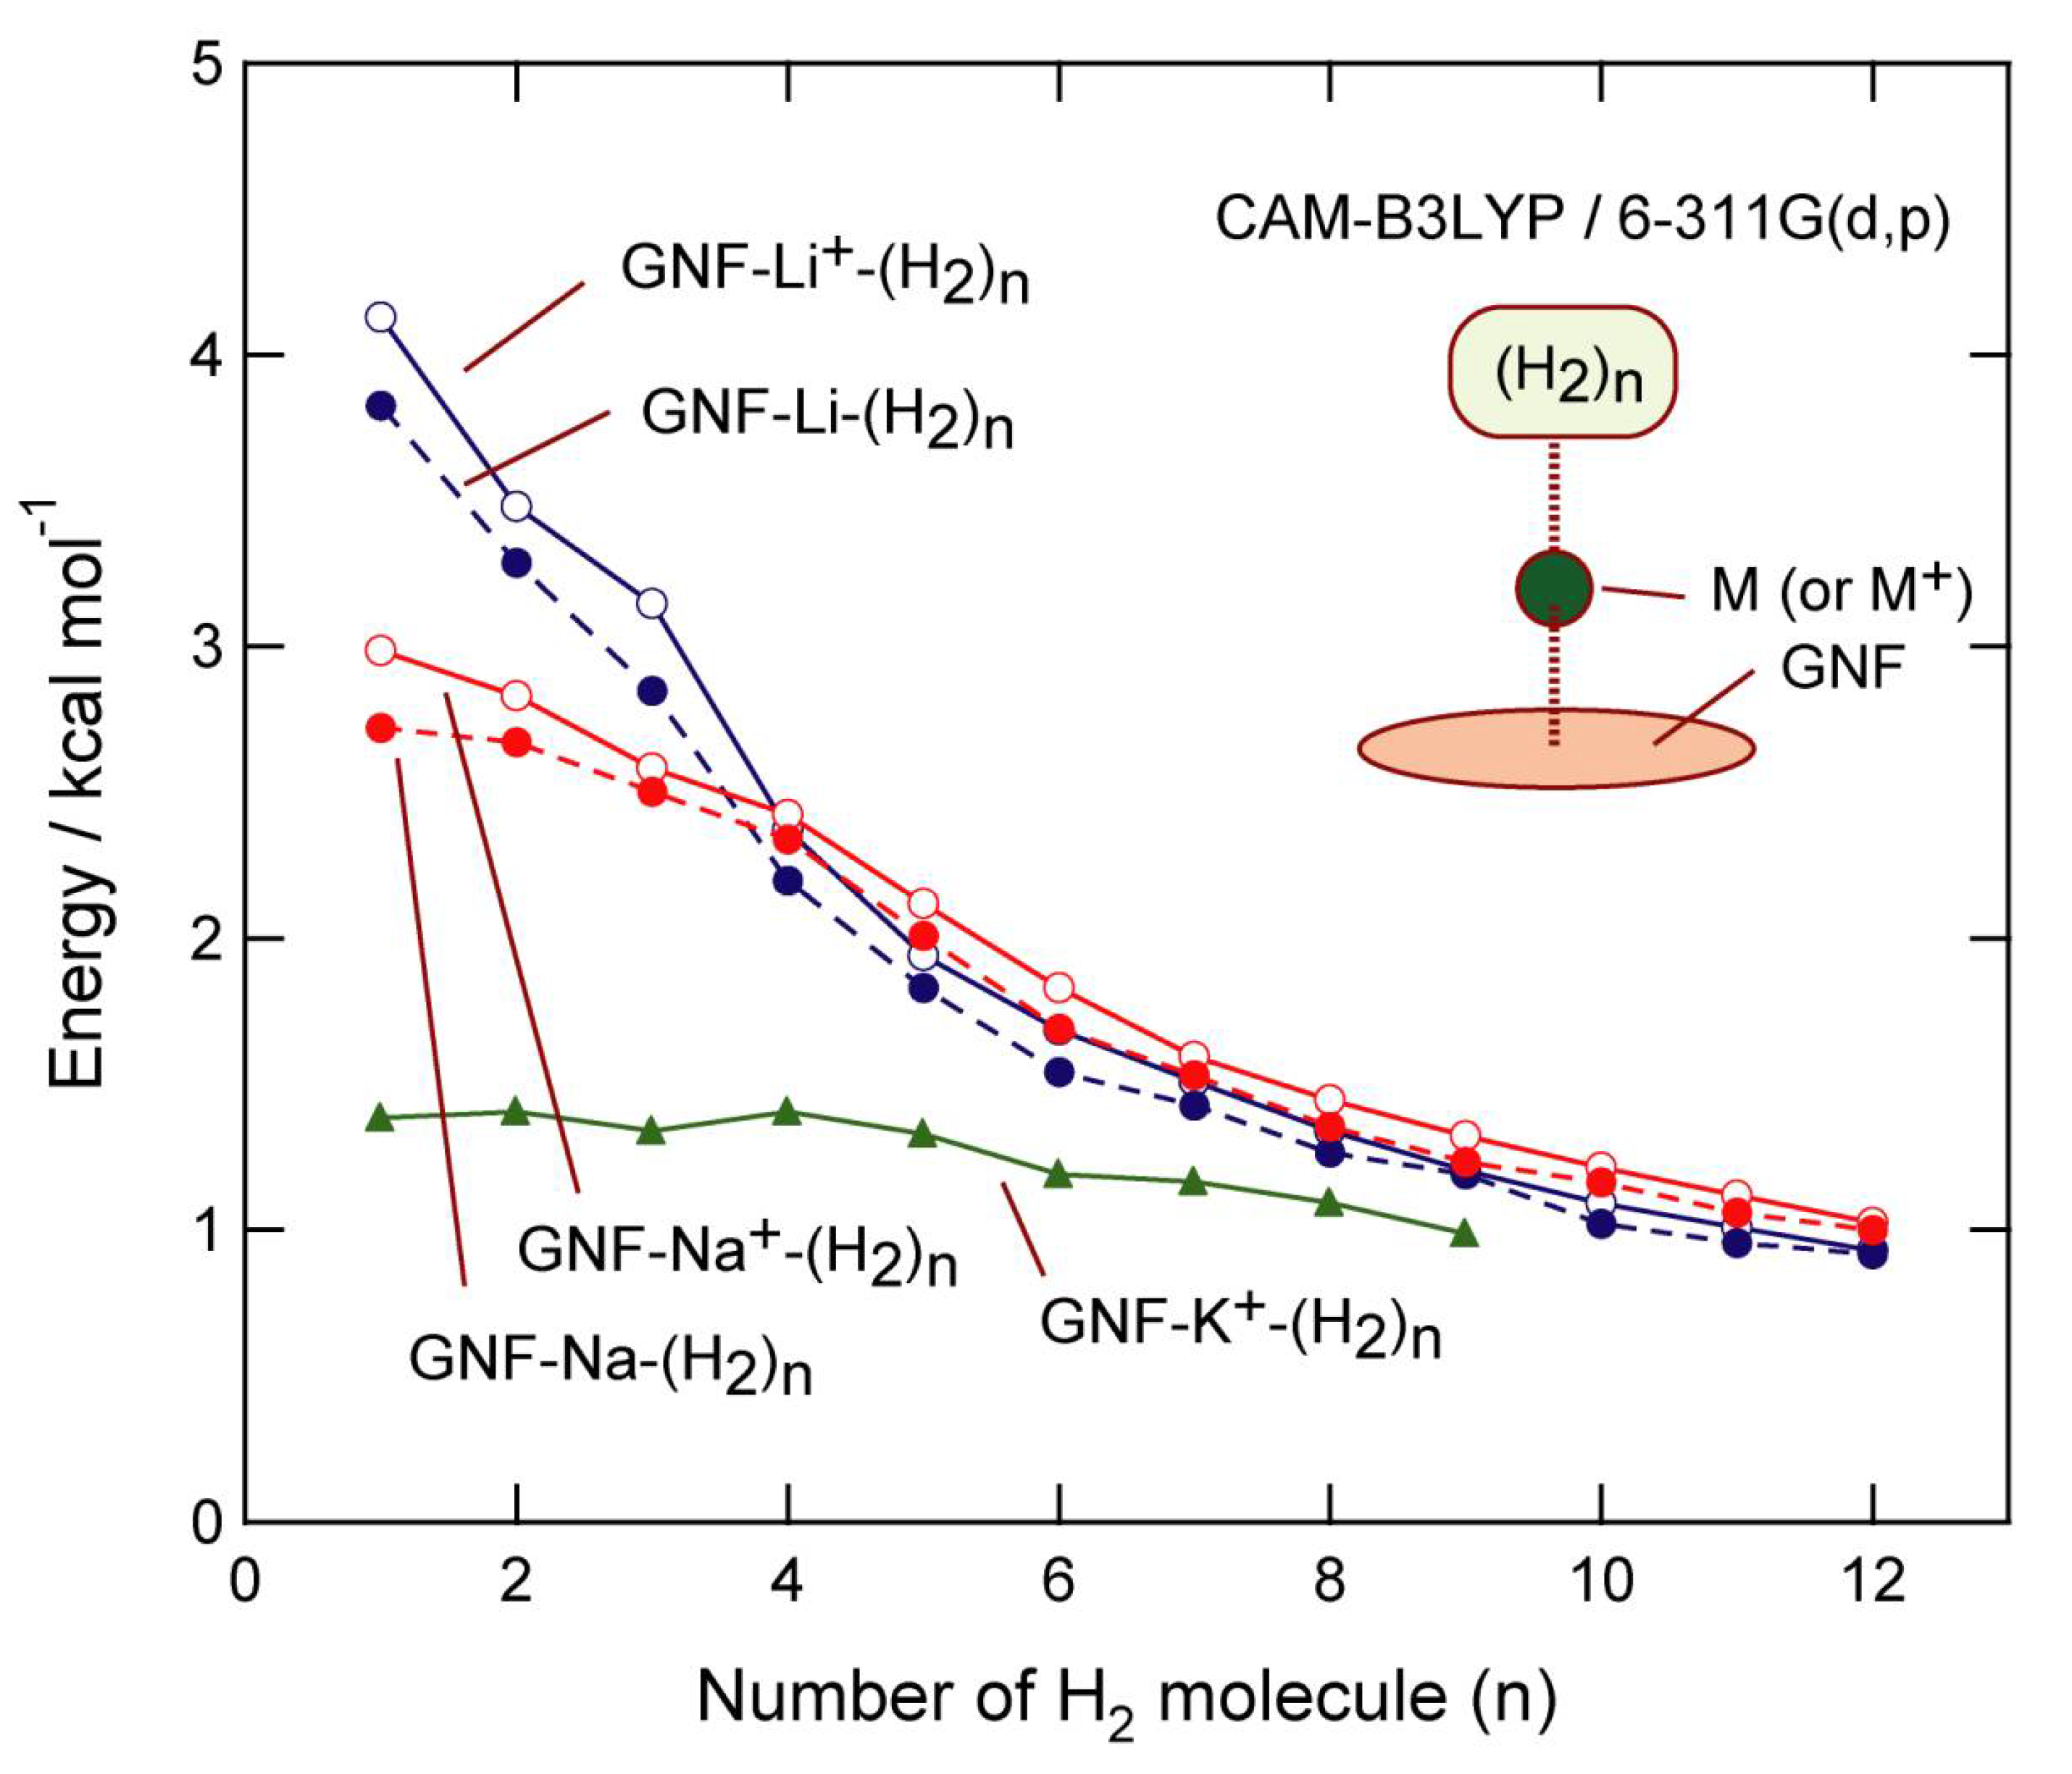
The binding energies of H2 to GNF–M or GNF–M+ (M = Li, Na, and K) are summarized in Figure 7, which are plotted as a function of n (per H2 molecule). In GNF–Li–H2, the binding energies were 3.83 (n = 1), 3.29 (n = 2), 2.85 (n = 3), 2.20 (n = 4), and 1.83 kcal/mol (n = 5). The corresponding energies in the GNF–Na–H2 system were 2.72 (n = 1), 2.67 (n = 2), 2.50 (n = 3), 2.34 (n = 4), and 2.01 kcal/mol (n = 5).
These features suggest that the interaction of H2 with GNF–Li is stronger than that of GNF–Na for n = 1–3. The interactions were comparable for both Li and Na at n = 4. In the larger systems (n = 5–12), GNF–Na interacted strongly with H2. Thus, GNF–Na had a higher H2-storage ability than GNF–Li. The Na+ ionic system, GNF–Na+-(H2)n, showed similar features (Figure 7).
In the case of the Na–(H2)n system without GNF, the binding energies of (H2)n to Na were close to zero, suggesting that GNF clearly enhances the binding nature through electron transfer from Na to GNF. The reaction is expressed as GNF + Na → (GNF)−-Na+.
Thus, it can be clearly demonstrated that GNF–Na is a suitable candidate for efficient H2 storage for various applications in the hydrogen economy. It can be concluded that sodium is an alternative to lithium for this purpose.
For comparison, the hydrogen adsorption capacity of K+ was examined [40]. The binding energy of H2 to GNF–K+ is plotted in Figure 7. The binding energies in GNF–K+ were lower than those of GNF–Li+ and GNF–Na+. However, the values were always higher in energy than 1.0 kcal/mol, which was also higher than the binding energy of H2 to GNF without K. These features indicate that GNF–K+ is also possible as a H2 storage [40].
The DFT calculations demonstrated that alkali metal (Li, Na, and K) decorated GNFs can be utilized as H2 storage materials. In particular, Li and Na showed efficient storage capacities.
5. Diffusion of Li and Li–(H2)n on GNF Surface
In the Li-ion battery, Li can diffuse on the surface of carbon materials and is stored in binding sites. Therefore, the elucidation of the mechanism of diffusion of Li on a graphene surface is important in developing a high-performance Li-battery. In particular, does lithium diffuse randomly over GNF? Or is it directional? The dominant factors of lithium diffusion will be discussed. In this section, the diffusion mechanism of Li and Li including H2 molecules on the GNF surface will be discussed [41,42,43,44].
5.1. Diffusion of Li Species on GNF
Figure 8A represents the potential energy curves (PECs) along the low energy diffusion paths of the Li+ ion and Li atom on GNF. Heights of Li+ and Li were set to the optimized geometries for binding sites (1.777 and 1.729 Å, respectively). The diffusion barriers for Li+ and Li atom derived from the PECs were 9.5 and 11.5 kcal/mol, respectively. In both species, saddle points were located in the bond center between the carbon–carbon (C–C) atoms of GNF. These points correspond to the node of the highest occupied molecular orbital (HOMO) of GNF–Li+. A diffusion for the Y-axis direction was higher in energy than that for the X-axis. In a previous paper [42], we proposed a diffusion model where the Li+ ion diffuses along the node of HOMO. The present results support our model.
The accurate barrier heights were calculated using the full geometry optimizations of the transition state (TS). The optimized structures of the TSs for Li species on GNFs are shown in Figure 8B (Li+ ion), and Figure 8C (Li atom), and the barrier heights for Li species are given in Table 2. Both the Li+ ion and Li atom were located at the centers of the C–C bonds of GNF, and the heights of the Li+ ion and Li atom from the surface of GNF were calculated to be h = 2.025 and 2.070 Å, respectively. The imaginary frequencies were 154.6 i and 154.7 i cm−1 (for the Li+ ions and Li atoms, respectively). The diffusion barriers including zero-point energies (ZPEs) were calculated to be 5.90 (Li+) and 6.84 kcal/mol (Li) on GNF. These lower barriers suggest that the Li species could diffuse easily on the graphene surface at room temperature. The size dependence on the diffusion barrier was small in the GNF–Li system.
The HOMO of the GNF–Li+ is illustrated as an iso-surface in Figure 9, together with a trajectory of the Li+ diffusion on GNF (i.e., diffusion path), which is given as a dotted red curve. The trajectory was calculated at 300 K by means of the direct ab initio molecular dynamics (AIMD) method [42]. At time zero, Li+ was located at the center of GNF. The Li+ ion started to diffuse when temperature was applied. Then, it reached the edge region of the GNF after 1.0 ps.
By comparing the diffusion path with the HOMO, it was found that the Li+ ion diffuses along a node of HOMO of GNF–Li+. This is due to the fact that the 2p orbital of Li+ (precisely, Li+ takes a sp2-like orbital on GNF, as shown in Figure 9 (right)) interacts strongly with HOMO during the diffusion process. The orbital degeneracy in GNF is solved by thermal activation and interaction with the Li+ (the high symmetry of GNF is broken). Thus, the Li+ ion does not move as a random walk, but diffuses regularly along the node of HOMO. With increasing temperature, the diffusion of Li+ approaches random walking because HOMO is being replaced by several orbitals due to the thermal activation.
5.2. Diffusion of Li–H2 Species on GNF
As shown in the previous section, the lithium ion can diffuse on the GNF surface under the thermal condition due to a low diffusion barrier. The Li+ ion diffuses along the node of HOMO of GNF–Li+ due to the low energy path. In this section, the effects of H2 on the diffusion barrier of Li+ on the GNF surface are examined. Namely, the diffusion of hydrogenated lithium, Li+–(H2)n, is discussed [38].
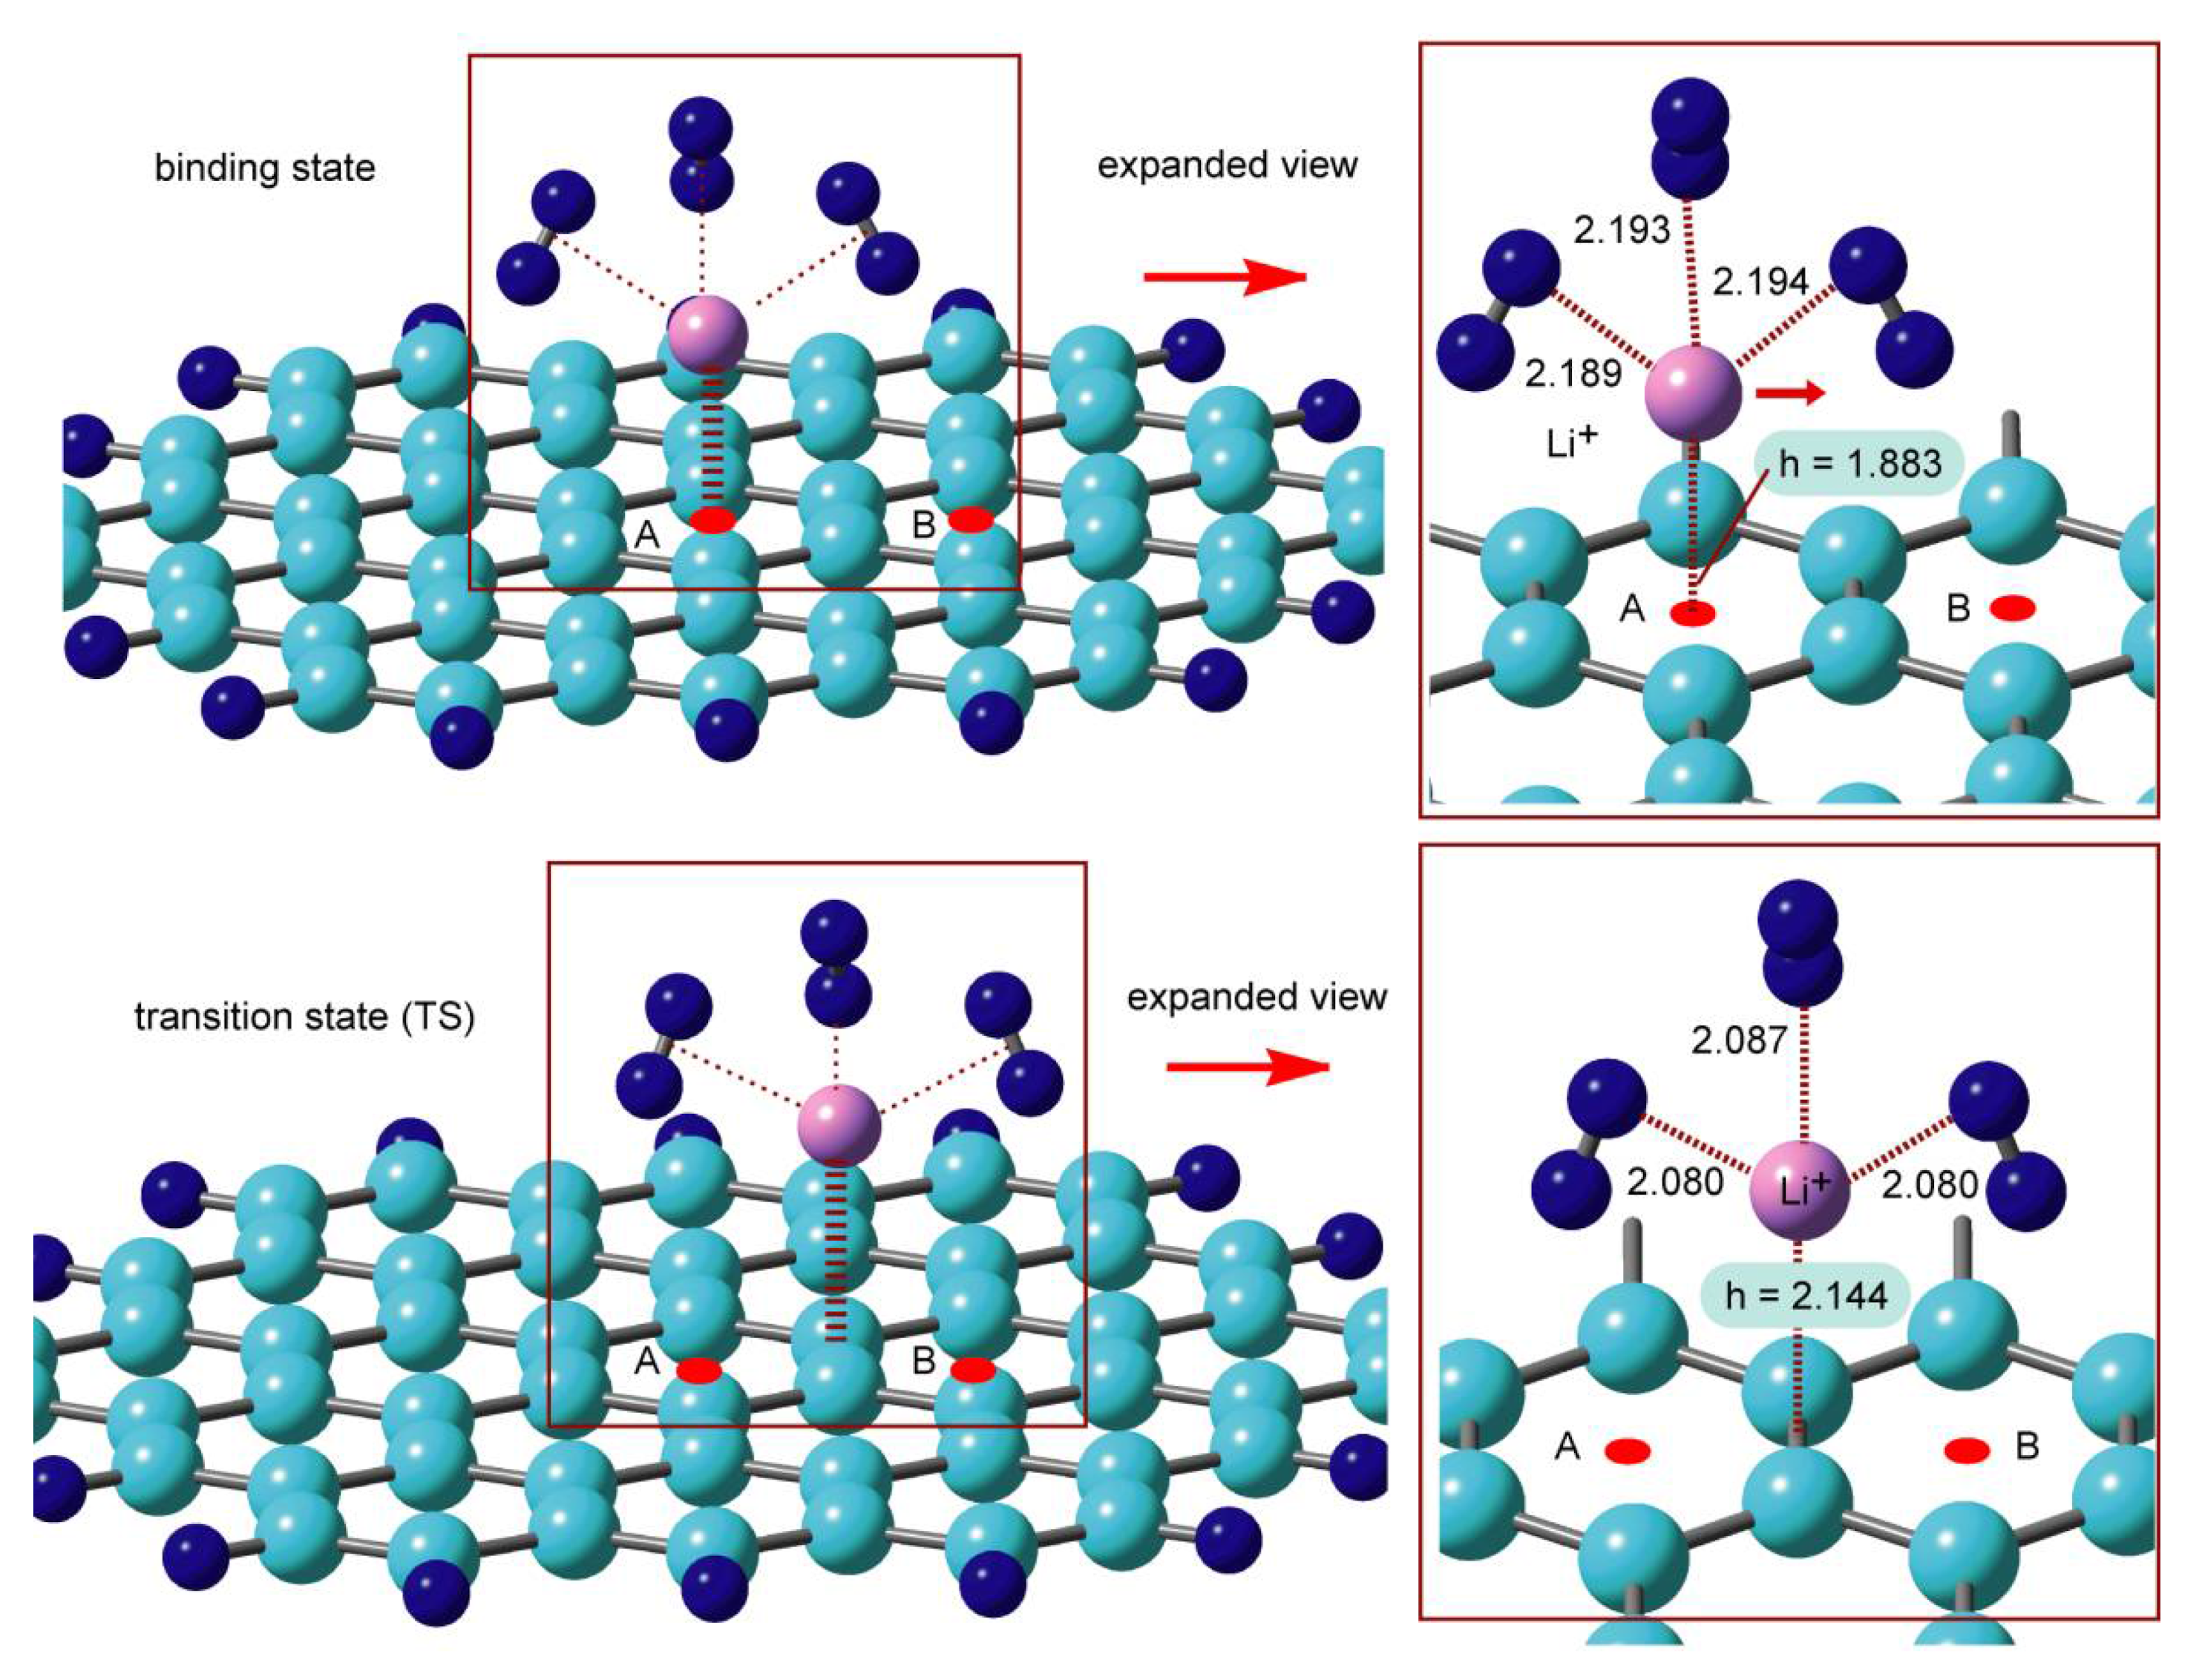
The structures of GNF–Li+–(H2)n (n = 0–4) in the binding state and transition state (TS) were optimized at the CAM-B3LYP/6-311G(d,p) level. The optimized structures for n = 3 are illustrated in Figure 10 as a representative example. The low energy diffusion takes place from point A → point B via TS. In the case of n = 3, the height of Li+ from the surface was h = 1.883 Å. The H2 molecules were bound to Li+ on GNF with the mean intermolecular distance of R = 2.192 Å. In the TS, Li+ was located at the center of the C–C bond with h = 2.144 Å. The distance of H2 was R = 2.082 Å, which was significantly shorter than that of the binding state (2.192 Å). Thus, the Li+ ion in TS was strongly coordinated by H2 molecules.
The diffusion barriers calculated for n = 0–4 (activation barriers) are listed in Table 3. Imaginary frequencies were obtained for all TS structures (n = 0–4), and the normal mode of imaginary frequency corresponded to the translational mode of Li+(H2)n between the benzene rings (A to B positions). The activation barriers for n = 0, 1, 2, 3, and 4 were calculated to be 6.35, 6.35, 4.95, 3.73, 3.62 kcal/mol, respectively, indicating that the diffusion barrier decreased with increasing numbers of hydrogen molecules (n) and became saturated at n = 3–4. The saturation of the first coordination shell at n = 3 resulted in decreased activation energies.
The binding energies of (H2)n to Li+ were calculated for the binding state and TS, and the differences in solvation energies (denoted as ΔEbind) are listed in Table 3. The results suggest that the binding energies in TS were larger than those in the binding state. In particular, the binding energy in TS was the largest at n = 3, and the overall trend showed a decreasing activation energy with an increasing n up to n = 3.
6. Molecular Design of Reversible Hydrogen Storage Device
In the previous sections, the hydrogen storage of the Li, Na, and K-doped GNFs were introduced. In this section, the molecular design of reversible hydrogen storage device based on GNFs is presented. Magnesium has three valence states as neutral, mono, and divalent states expressed as Mg, Mg+, and Mg2+. Here, the molecular devices composed of GNF–Mg were examined as the reversible hydrogen storage device [45].
6.1. Structures of Mg-Doped GNFs
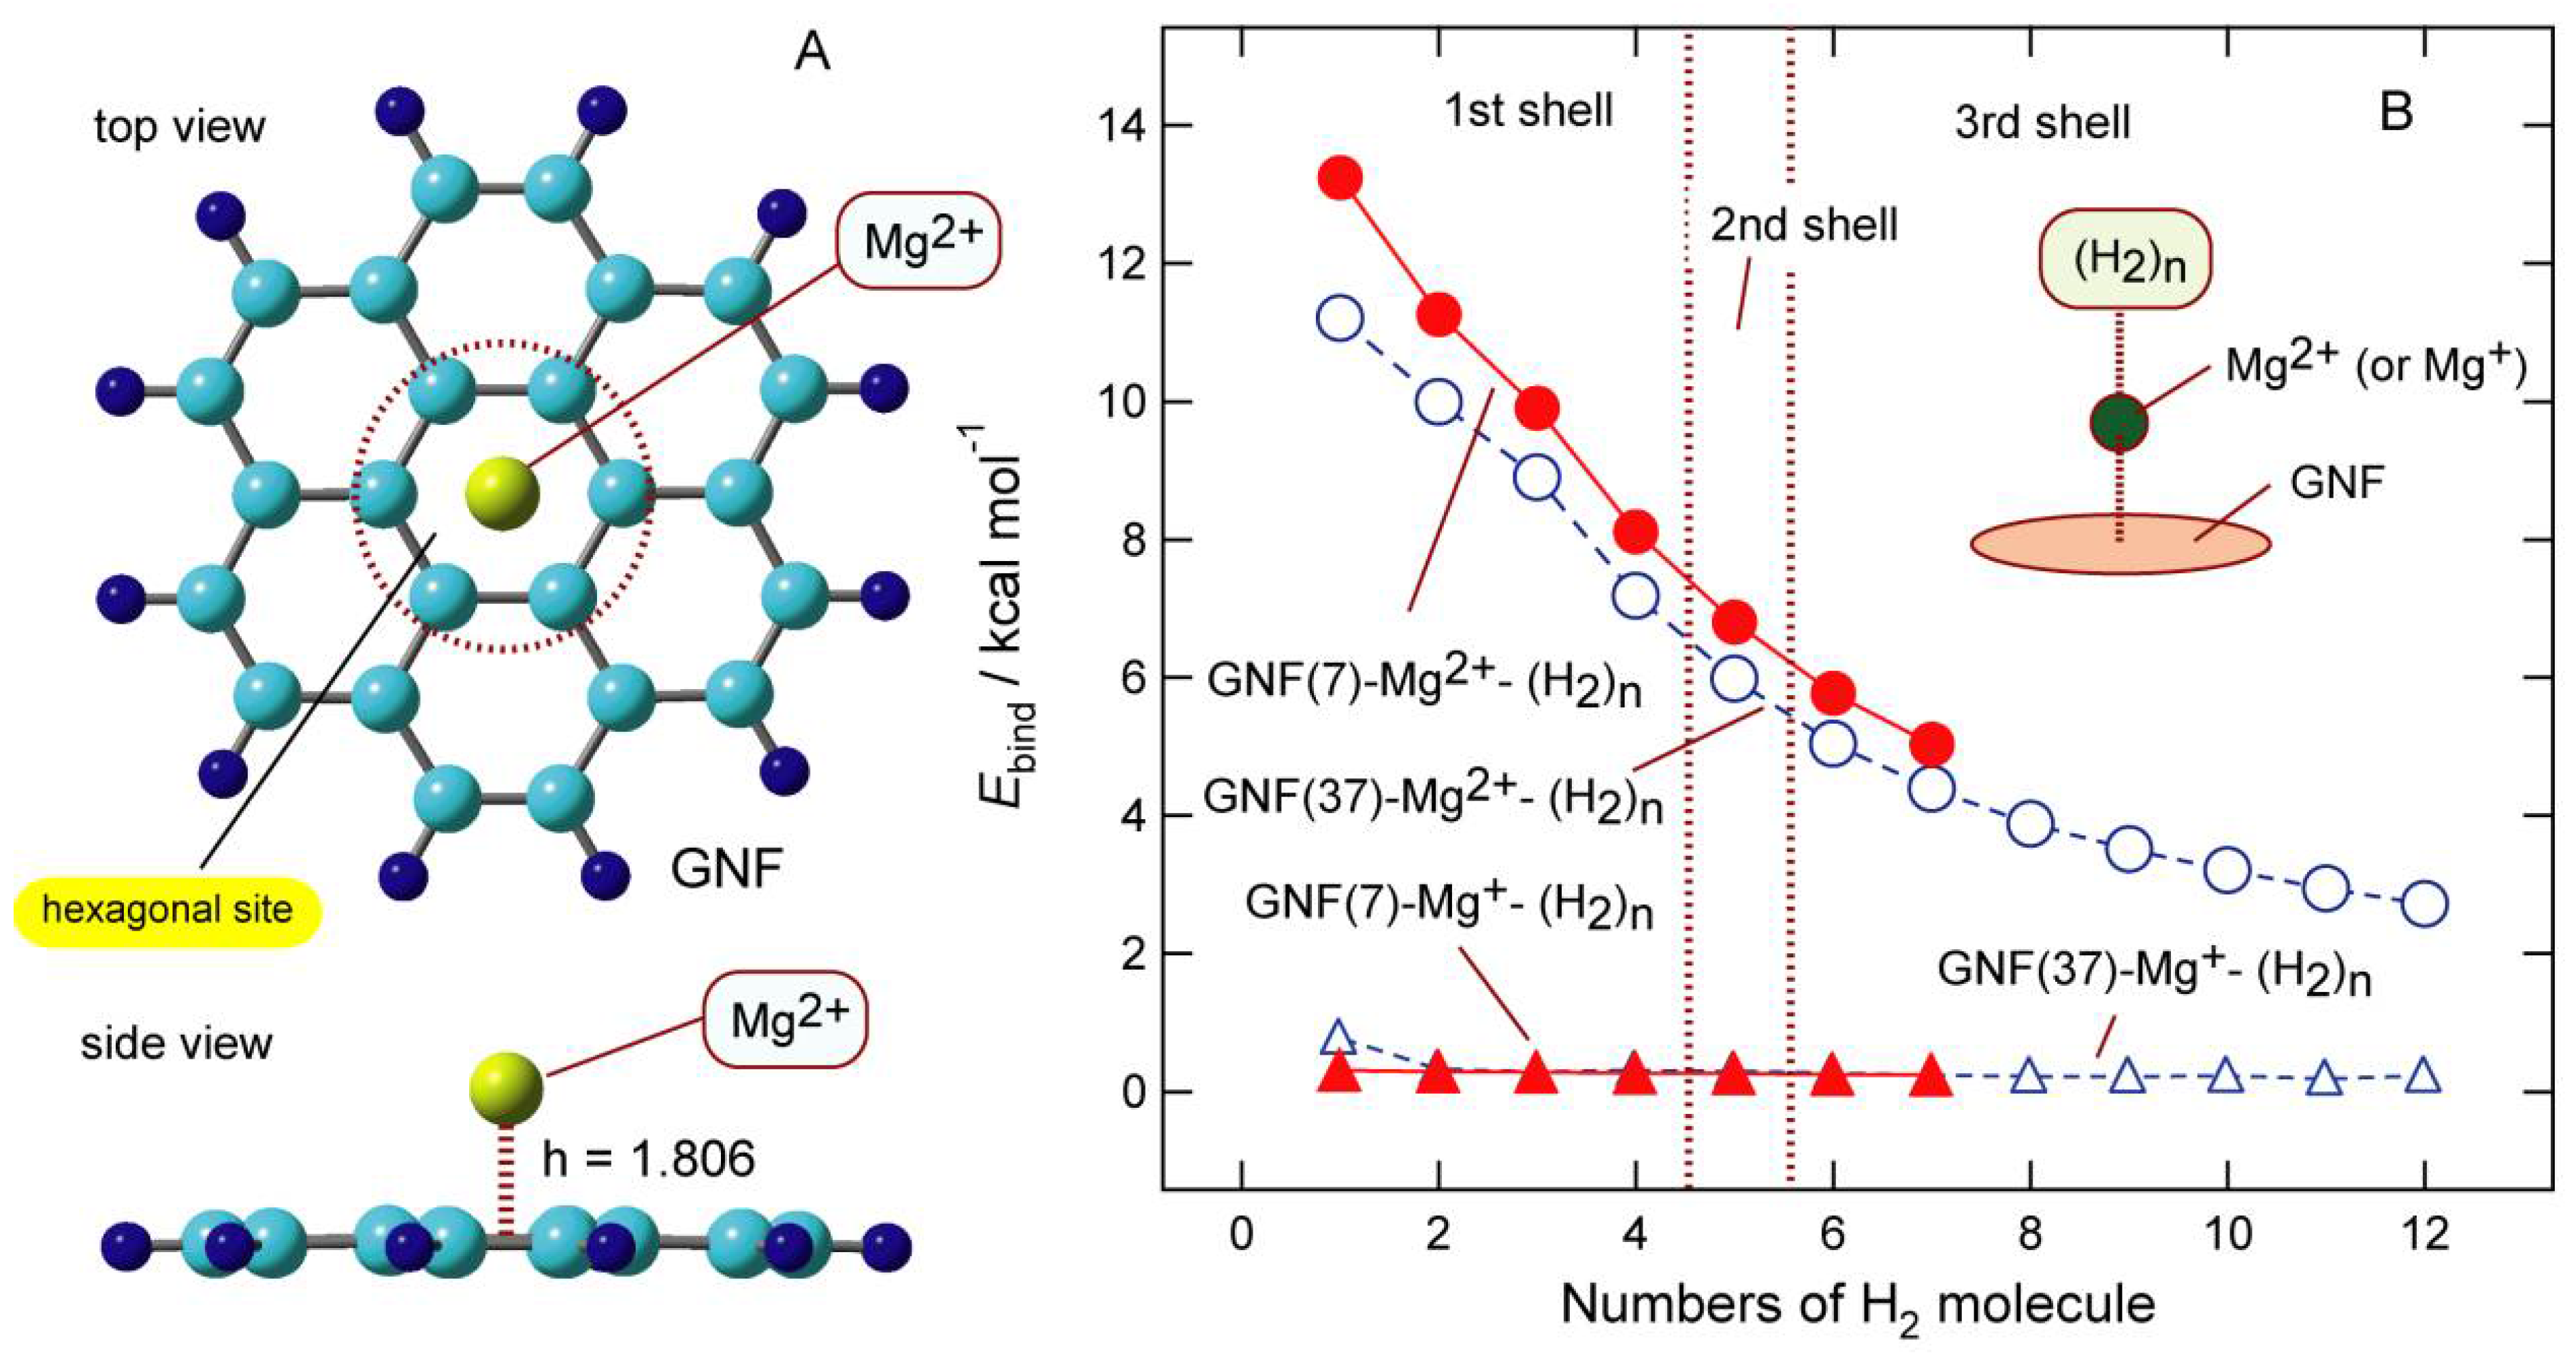
The optimized structures of GNF–Mgm+ (m = 2, 1, and 0) showed that Mg species were bound to the hexagonal site of GNF. The binding energies for m = 0, 1, and were 0.3, 39.9, and 159.8 kcal/mol, respectively, implying that the binding energy is strongly dependent on the charge of Mg. The distances of Mgm+ from the GNF surface (h) were 4.339 (m = 0), 2.214 (m = 1), and 1.806 Å (m = 2), respectively. The binding distance of Mg2+ was shorter than that of Mg+. The binding of Mg was very weak.
The NPA atomic charges on the Mg species were −0.001 (m = 0), +0.960 (m = 1), and +1.882 (m = 2), suggesting that a slight electron transfer occurred from GNF to Mgm+ (m = 1 and 2) after binding. However, the magnitude of electron transfer was negligibly small compared with those of Li and Na.
6.2. Binding Structures and Energies of H2 to GNF–Mgm+ (m = 1 and 2)
The geometries of the GNF–Mg2+–(H2)n systems (n = 1–6) were fully optimized at the CAM-B3LYP/6-311G(d,p) level. Figure 11A shows the binding structures of H2 to GNF–Mgm+ (m = 2). The H2 molecules were bound to Mg2+ with a side-on structure.
The binding energy of H2 to GNF–Mgm+ is plotted in Figure 11B as a function of n. The binding energy of the first addition of H2 to GNF–Mg2+ (n = 1) was 13.22 kcal/mol (per H2 molecule), which gradually decreased as a function of n. The binding energies of the system were 9.99 (n = 3), 6.79 (n = 5), and 5.03 kcal/mol (n = 7). In contrast, the binding energies of GNF–Mgm+–(H2)n (m = 1) were significantly lower than those for m = 2. The binding energies of the system were 0.31 (n = 1), 0.28 (n = 3), 0.26 (n = 5), and 0.24 kcal/mol (n = 7).
These trends strongly indicate that GNF–Mg2+ can be used as a H2 storage material, whereas the ability of GNF–Mg+ was significantly low. Thus, the H2 absorption ability of the GNF–Mgm+ system was significantly changed by the charge of GNF–Mg. The adsorption–desorption was controlled by the molecular charge in the GNF–Mgm+–(H2)n system (m).
6.3. Electron Capture Dynamics of GNF–Mg–H2
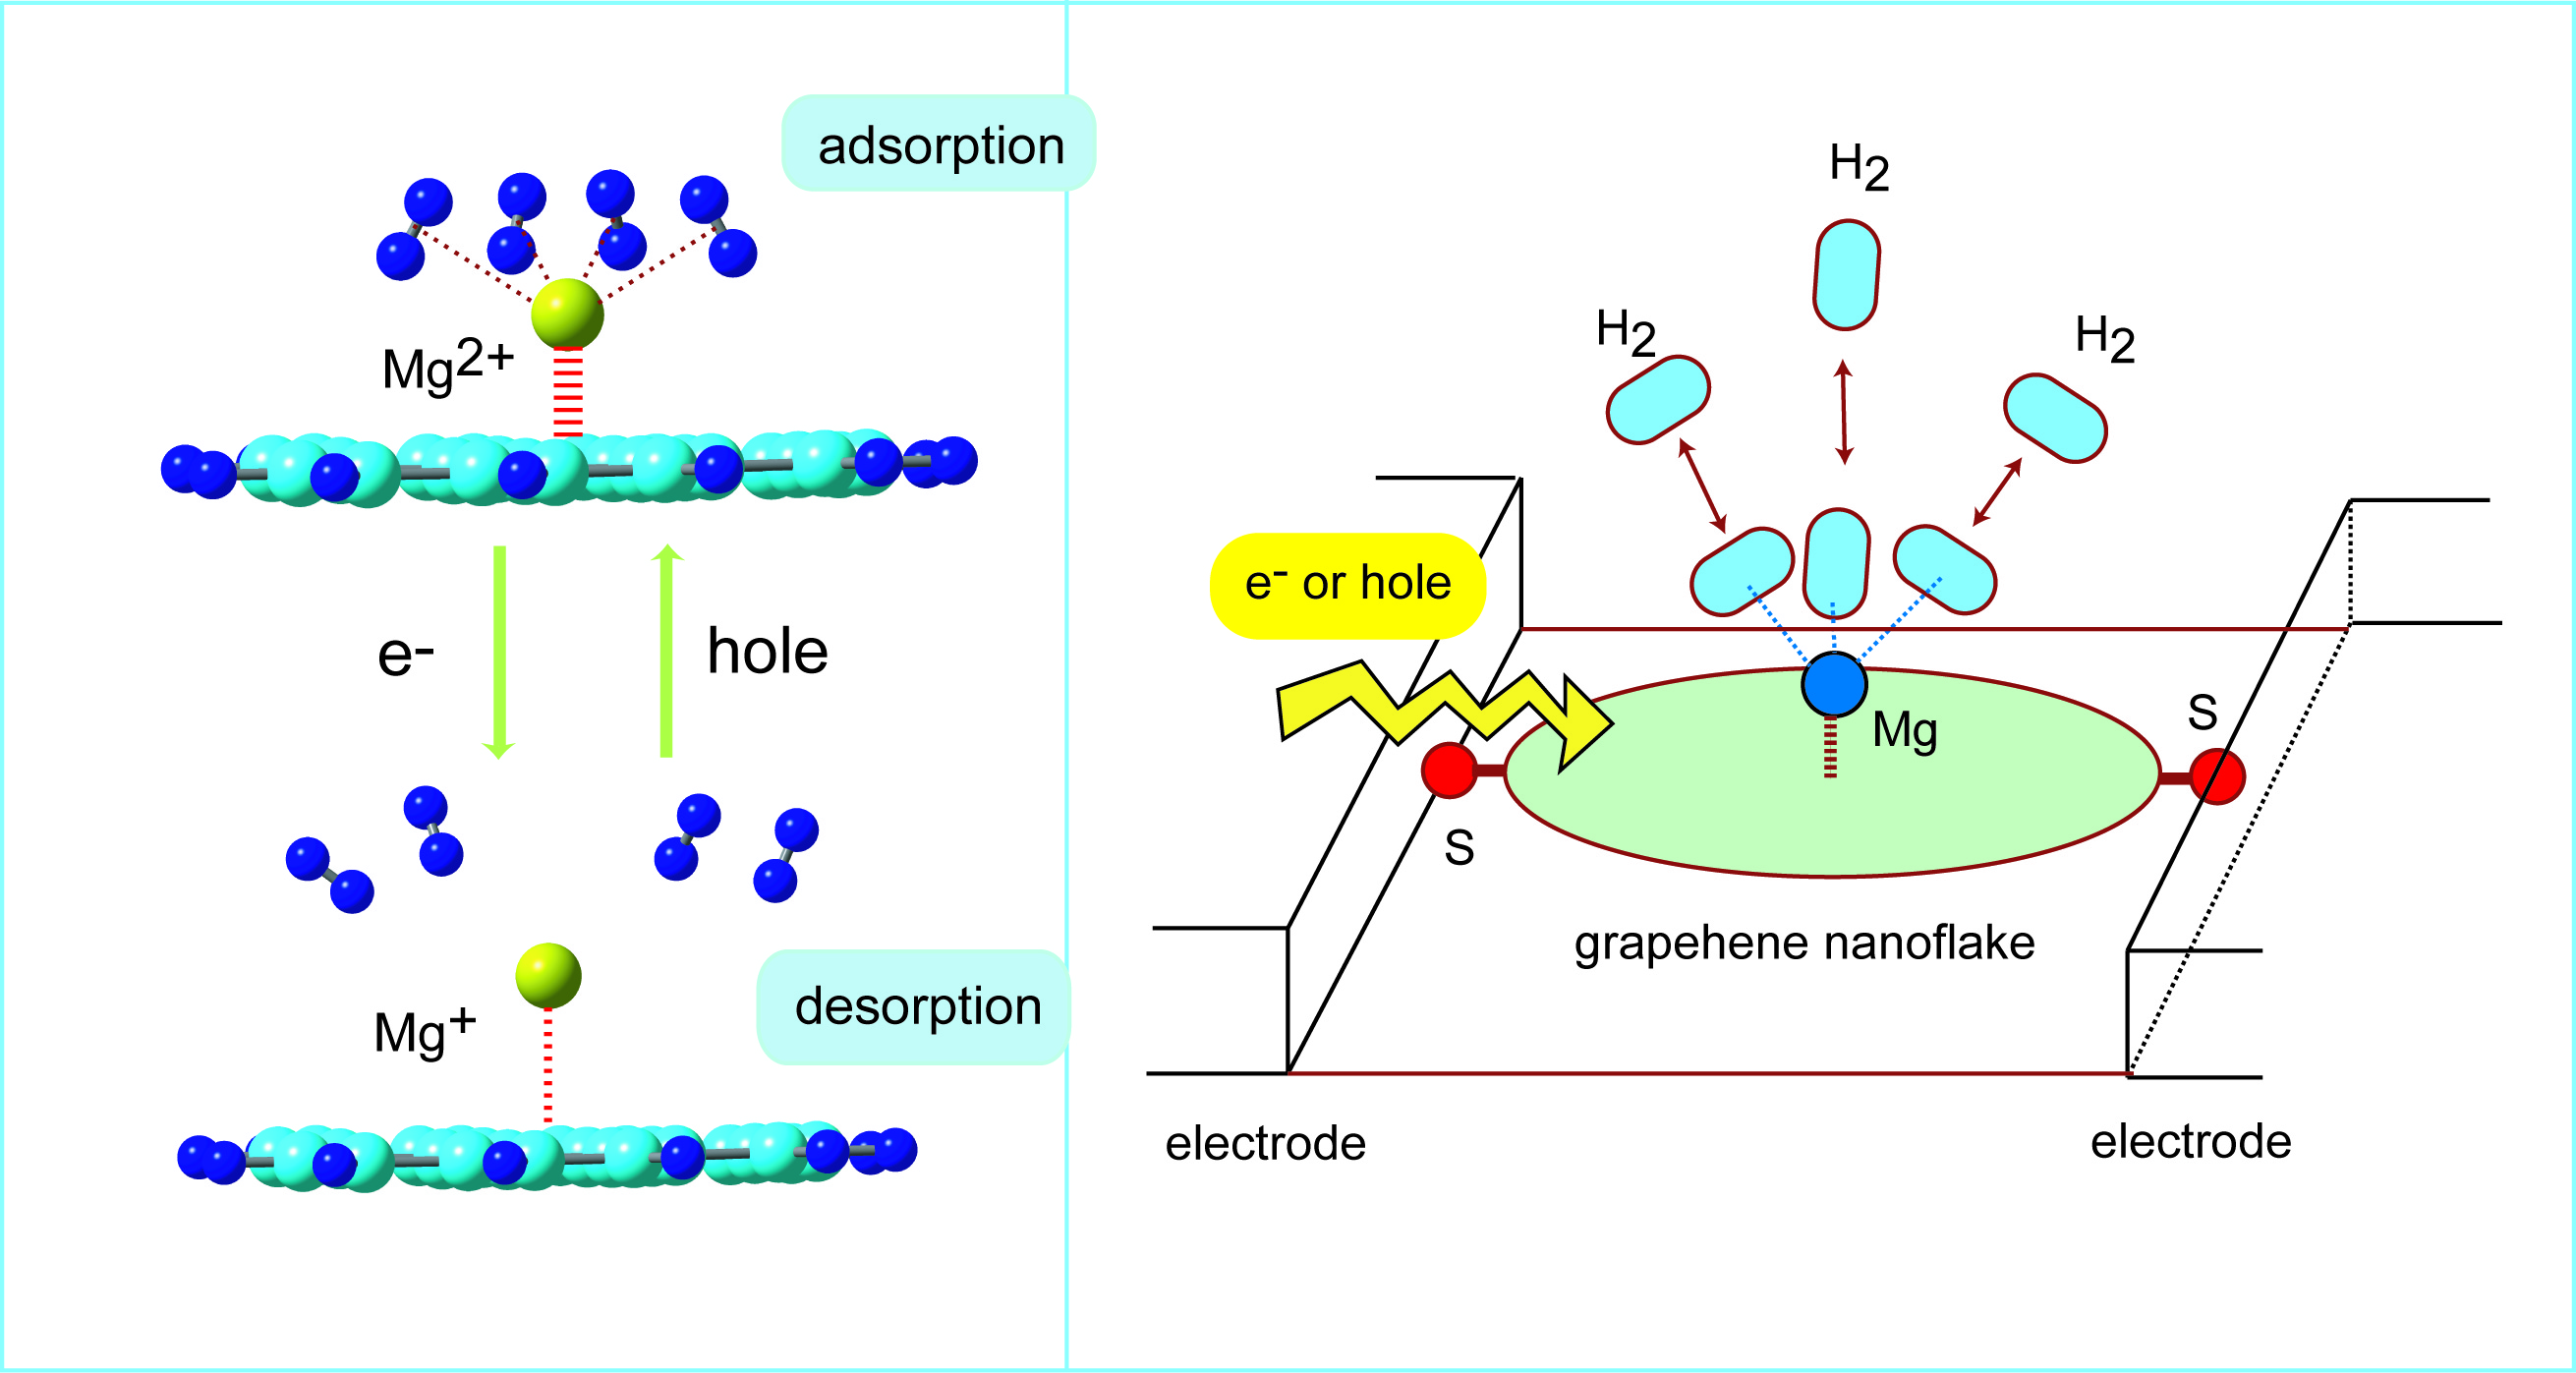
The structure of the GNF–Mg–H2 system is largely dependent on the charge of Mg, as shown in the previous section. This specific property makes the GNF–Mg–H2 system suitable for use as a H2 storage device with adsorption–desorption reversible properties. In the following sections, the direct AIMD calculations [46,47,48] for the electron and hole capture processes of the GNF–Mg–H2 system are described [45].
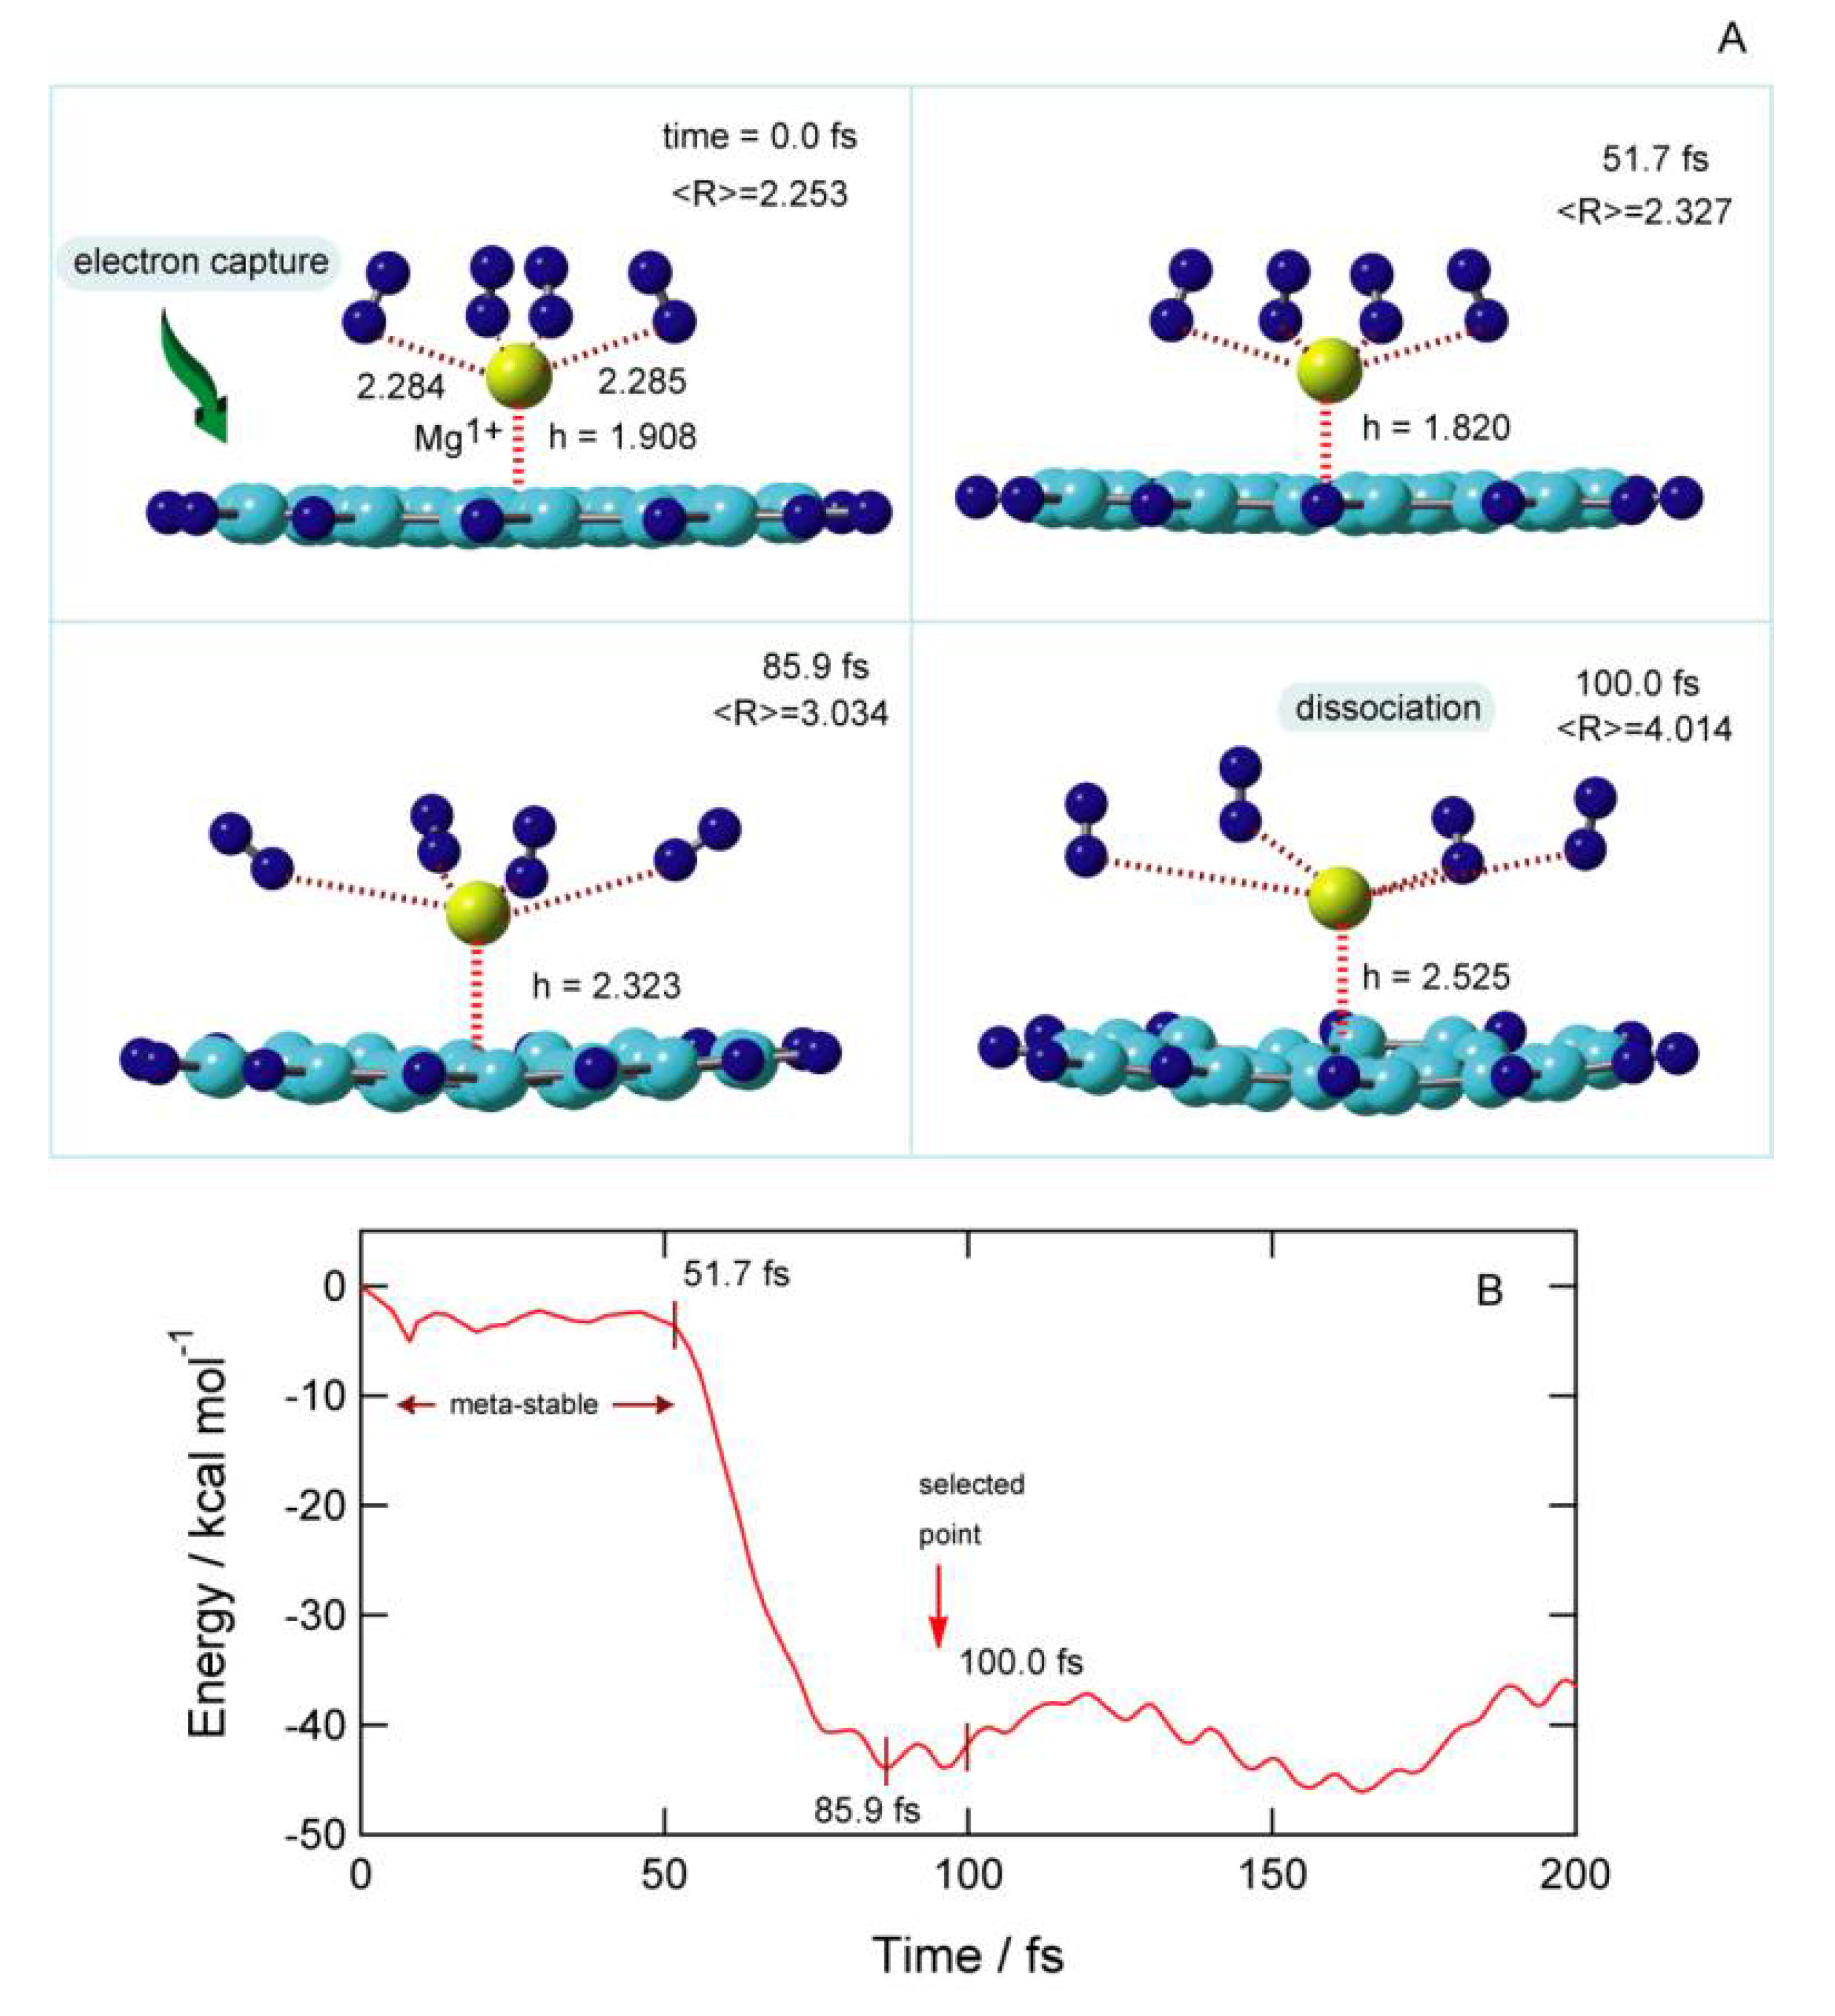
The result of the dynamics calculation for the electron capture of GNF–Mgm+–(H2)4 (m = 2) is given in Figure 12. The snapshots and the potential energy of GNF–Mg+–(H2)4 (m = 1), following vertical electron capture of m = 2, are shown in Figure 12A,B, respectively. The optimized structure of GNF–Mg2+–(H2)4 was chosen as the initial structure at time zero. The average distance between the Mg and H2 molecules was <R> = 2.253 Å at time = 0 fs (before electron capture). The distance between Mg and the GNF surface was h = 1.908 Å. The charge on Mg was suddenly changed from Mg2+ to Mg+ by electron capture. Afterward, the structure was drastically changed as a function of time.
At 51.7 fs, the distance of H2 from Mg+ was slightly increased to <R> = 2.327 Å, and the distance between the Mg+ and the GNF surface was slightly decreased (h = 1.820 Å). The potential energy of the system was varied as a function of time. The zero level corresponded to the total energy of GNF–Mg+–(H2)4 at the vertical electron capture point (time = 0 fs). After the electron capture, the energy was slightly decreased at time = 0–50 fs because a slight structural deformation occurred in this time region. Namely, the meta-stable form of GNF–Mg+–(H2)4 was formed at time = 0–51.7 fs. After that, the energy decreased suddenly up to −45 kcal/mol because the meta-stable form was broken and changed to a stable form. The elongation of the GNF–Mg+ bond and release of H2 from Mg+ occurred. The geometry was changed from meta-stable to stable forms of GNF–Mg+–(H2)4. At 85.9 fs, H2 molecules leaved away from Mg+, where the average distance was <R> = 3.034 Å. At the final stage of the reaction (100 fs), H2 molecules were released from GNF–Mg+ to the gas phase, <R> = 4.014 Å. The interaction of H2 with Mg+ was negligible in this region. Thus, the electron capture of GNF–Mg2+–(H2)4 resulted in the dissociation of H2 from GNF–Mg+–(H2)n, and the time scale of the dissociation was very fast (ca.100 fs). The reaction of electron capture was expressed as follows:
GNF–Mg2+–(H2)n (adsorption) + e− → GNF–Mg+-(H2)n (H2 in the gas phase).
Thus, H2 molecules were released into the gas phase after the electron capture.
6.4. Hole Capture Dynamics of Dissociation System
The hole capture dynamics of GNF–Mgm+–(H2)4 (m = 1) is given in Figure 13. One of the dissociation structures of GNF–Mg+–(H2)4 (in gas phase) was selected as the initial structure at time zero. The selected geometry is shown in Figure 12B by an arrow. Before the hole capture (time = 0 fs), all H2 molecules leaved from Mg+, and the position of Mg2+ leaved from GNF: the average distance of H2–Mg was <R> = 3.704 Å, while the height of Mg+ was h = 2.472 Å. The atomic charge of Mg was drastically changed from Mg+ to Mg2+ by hole capture. Therefore, the whole structure of GNF–Mg–H2 was significantly changed to a relaxed geometry. Of particular importance were the change in the position of hydrogen from Mg and that in the height of Mg from GNF.
After hole capture, Mg2+ gradually approached the surface of the GNF and collided with the GNF at 57.7 fs (height was h = 1.451 Å). At the final stage of the hole capture process (86.6 fs), the distance of Mg from the GNF surface was h = 2.102 Å. The potential energy decreased gradually from 0.0 to −29.0 kcal/mol (time = 0–40.2 fs), as shown in Figure 13B. The energy increased up to −8.0 kcal/mol due to the collision (57.7 fs) and decreased again to −30.0 kcal/mol at the stable point (86.6 fs).
Together with the collision of Mg+ to GNF, H2 molecules were assembled at the center Mg2+. The distance of H2 from Mg2+ was varied as a function of time: <R> = 3.704 Å (time = 0 fs), 3.636 Å (40.2 fs), 3.540 Å (57.7 fs), and 2.787 Å (86.6 fs). Thus, the H2 molecules were fully bound to Mg2+ at 86.6 fs, and the structure was recovered by the addition of H2 to GNF–Mg2+: the average distance was <R> = 2.787 Å. These features indicate that the reverse reaction was completed within 100 fs and is a fast process. The reaction is expressed as follows:
GNF–Mg+ + (H2)n (gas phase) + hole → GNF–Mg2+ − (H2)n (adsorption).
The direct AIMD calculations strongly demonstrated that the charge switching of the GNF–Mg (cation/dication) can control the adsorption–desorption reversible reaction of H2.
6.5. Molecular Design of H2 Adsorption–Desorption Reversible Device
As a summary of this section, a schematic potential energy diagram for the H2-reversible device is given in Figure 14. The initial point of reaction is expressed by point-a: GNF–Mg2+ is surrounded by H2 molecules. The H2 molecules bind strongly to Mg2+ on GNF. If this state can capture an excess electron, the energy level of GNF–Mg2+ is vertically shifted to GNF–Mg+ at point-b. The reaction point is spontaneously lowered from point-b to point-c. H2 molecules are dissociated from GNF–Mg+ to the gas phase at point-c. When GNF–Mg+ takes place in hole capture, the energy state is shifted from points c to d, where the GNF–Mg2+ is formed again. GNF–Mg2+ can strongly capture H2 molecules. The H2 molecules are trapped by GNF–Mg2+. Thus, the control of the electronic states of GNF–Mg allows for a H2 adsorption–desorption reversible device.
7. Comparison with Previous Studies
In 1999, Chen et al. reported that H2 molecules are efficiently trapped by alkali-metal doped CNTs. Since then, many experimental works have been carried out to investigate the hydrogen adsorption on CNTs. The mechanism of H2 binding has also been proposed [49,50,51]. Froudakis proposed a model for the enhancement of alkali doping to CNTs on the basis of the exponential decay of the binding energy [52]. First, the charge transfer from the alkali metal to CNTs occurs by doping, and metal ion polarizes the H2 molecule. This charge-induced dipole interaction causes the higher hydrogen uptake of the doped CNT.
In transition metals (TMs), there are two important interactions between H2 and GNF–TM. One is that the electron in the d-orbital of TM donates to the σ* orbital of H2. The second is that the σ-electron of H2 donates to the unoccupied molecular orbital (LUMO) of TM. These features are dependent on metals.
In the case of the GNF–M–H2 system, a similar electron transfer from M to GNF was found and the metal becomes M+ ions on GNF. The electron of the sigma-orbital of H2 donates slightly to GNF–M+. Next, the charge resonance between M+ and H2 takes place. The binding of H2 is caused by the charge resonance effects.
In the present review article, we introduced the calculated results using PAH. As an analogous study, Seenithurai and Chai calculated the binding energies of H2 to Li-adsorbed acenes using the DFT method [53]. They showed binding energies of 4.8–9.6 kcal/mol (per one H2). These values are slightly larger than those of PAH.
Not only alkali metals but also TMs have recently been tried. Chi et al. reported that the graphene doped by Al metal had a higher capacity for H2 molecules than a bare graphene without metal [54]. Cortés-Arriagada et al. suggested that the Fe-doped graphene exhibited an effective ability for the adsorption of gas molecules such as CO, CO2, SO2, and H2S [55]. Thus, the interactions between the gas molecules and the graphene-based materials could be significantly improved through being doped with metal atoms. A variety of materials are expected to be used in the future.
8. Conclusions
In the present review article, the mechanism of hydrogen storage in alkali doped GNFs were introduced. Three alkali metals, namely, lithium (Li), sodium (Na), and potassium (K), were examined as atoms and ions. In the Li and Na atoms and its ions, H2 was stored efficiently in doped GNFs, indicating that the GNF–Li and GNF–Na systems are effective as hydrogen storage devices. In contrast, the binding energy of H2 to the GNF–K system was lower than those of the Li and Na atoms. However, the binding energy in the GNF–K–H2 system was larger than 1.0 kcal/mol and that of GNF–H2 without K. The K atom and ion enhanced the H2 storage ability of GNF. Therefore, GNF–K can be utilized as a H2 storage device.
As for the diffusion of Li+, the Li+ ion moves along the node of HOMO of GNF–Li+ because the phase of the molecular orbitals of the GNF corresponds to that of Li+. In other words, Li+ diffuses in a regular manner, and the usual classical MD calculation cannot describe this description and it is possible only with MD calculations based on the ab initio level. At higher temperatures, the concept of orbitals disappears and diffusion becomes random.
Next, the molecular design of H2 adsorption–desorption reversible storage device was presented. The molecular device composed of GNF and Mg, GNF–Mg, was examined as the reversible device. Magnesium takes three valence states, neutral, mono, and divalent states expressed as Mg, Mg+, and Mg2+, respectively. GNF–Mg2+ can efficiently store hydrogen molecules, whereas GNF–Mg+ releases H2 molecules to the gas phase. The direct AIMD calculations demonstrated that the reversible process was completed within 100 fs, suggesting that the GNF–Mg system can be utilized as a H2 adsorption–desorption reversible device.
As above-mentioned, GNFs can take on a wide variety of electronic states and reactivity. GNFs show many characteristic properties in materials chemistry. The development of new materials based on GNFs is expected to continue in the future.
The ab initio and DFT calculations are powerful tools for the theoretical design of H2 storage materials. However, as shown in this review, we introduced an ideal system composed of a single molecule of GNF and a single metal atom. In a realistic system, the metal would not be a single atom, but rather several clusters of metal on the GNF surface. In the future, calculations with two or more metals are expected to be performed to approximate the actual system.
In this review article, only hydrogen was treated as an adsorbed molecule. The GNF–metal system could be potentially used for the storage of other molecules. For example, ammonia (NH3), CO, and CO2 are possible adsorbed molecules. Future developments are expected to include diverse applications of graphene–metal systems.
Funding
This project is supported by JSPS KAKENHI (grant numbers 21H05415 and 21K04973).
Institutional Review Board Statement
Not applicable.
Informed Consent Statement
Not applicable.
Data Availability Statement
Not applicable.
Conflicts of Interest
The author declares no conflict of interest.
References
- Shiraz, H.G.; Tavakoli, O. Investigation of graphene-based systems for hydrogen storage. Renew. Sustain. Energy Rev. 2017, 74, 104–109. [Google Scholar] [CrossRef]
- Dahbi, S.; Aziz, A.; Messaoudi, A.; Mazozi, I.; Kassmi, K.; Benazzi, N. Management of excess energy in a photovoltaic/grid system by production of clean hydrogen. Int. J. Hydrogen Energy 2018, 43, 5283–5299. [Google Scholar] [CrossRef]
- Alvin, G.S. A new sustainable hydrogen clean energy paradigm. Int. J. Hydrogen Energy 2018, 43, 4244–4255. [Google Scholar]
- Demirel, Y. Energy: Production, Conversion, Storage, Conservation, and Coupling; Springer: London, UK, 2012. [Google Scholar]
- Liang, W.; Liu, J.; Chung, K.L. On explosion limits of H2/CO/O2 mixtures. Combust. Flame 2017, 179, 130–137. [Google Scholar] [CrossRef] [Green Version]
- Vinzenz, B.-K.; Nathan, N. Microalgal hydrogen production: Prospects of an essential technology for a clean and sustainable energy economy. Photosynth. Res. 2017, 133, 49–62. [Google Scholar]
- Brandon, N.P.; Kurban, Z. Clean energy and the hydrogen economy. Philos. Trans. A Math. Phys. Eng. Sci. 2017, 375, 20160400. [Google Scholar] [CrossRef] [Green Version]
- Ahmad, R.; Saleem, I. Hydrogen generation as a clean energy through hydrolysis of sodium borohydride over Cu-Fe-B nano-powders: Effect of polymers and surfactants. Energy 2017, 126, 830–840. [Google Scholar]
- Chen, L.; Chen, X.F.; Liu, J.; Xiang, P.; Zhuge, F.Y.; Xiao, B.B. Li decorated Be3C2 as light-weight host material for reversible hydrogen storage. Appl. Surf. Sci. 2018, 459, 217–223. [Google Scholar] [CrossRef]
- Kilkis, B.; Kilkis, S. Hydrogen Economy Model for Nearly Net-Zero Cities with Exergy Rationale and Energy-Water Nexus. Energies 2018, 11, 1226. [Google Scholar] [CrossRef] [Green Version]
- Lee, S.M.; An, K.H.; Lee, Y.H.; Seifert, G.; Frauenheim, T. A Hydrogen Storage Mechanism in Single-Walled Carbon Nanotubes. J. Am. Chem. Soc. 2001, 123, 5059–5063. [Google Scholar] [CrossRef]
- Dillon, A.C.; Jones, K.M.; Bekkedahl, T.A.; Kiang, C.H.; Bethune, D.S.; Heben, M.J. Storage of hydrogen in single-walled carbon nanotubes. Nature 1997, 386, 377–379. [Google Scholar] [CrossRef]
- Briggs, N.M.; Barrett, L.; Wegener, E.C.; Herrera, L.V.; Gomez, L.A.; Miller, J.T.; Crossley, S.P. Identification of active sites on supported metal catalysts with carbon nanotube hydrogen highways. Nat. Commun. 2018, 9, 382. [Google Scholar] [CrossRef]
- Hosseini, S.V.; Arabi, H.; Kompany, A. Silicon atom and silicon oxide molecule, within the metallic and semiconducting carbon nanotubes as promising centers candidates for hydrogen adsorption: A DFT theoretical study. Int. J. Hydrogen Energy 2018, 43, 18306–18315. [Google Scholar] [CrossRef]
- Cheng, J.R.; Zhang, L.B.; Ding, R.; Ding, Z.F.; Wang, X.; Wang, Z.; Fang, X. Influence of chemical potential on the computer simulation of hydrogen storage in single-walled carbon nanotube array. Comput. Mater. Sci. 2008, 44, 601–604. [Google Scholar] [CrossRef]
- Cao, D.P.; Wang, W.C. Storage of hydrogen in single-walled carbon nanotube bundles with optimized parameters: Effect of external surfaces. Int. J. Hydrogen Energy 2007, 32, 1939–1942. [Google Scholar] [CrossRef]
- Liu, C.; Fan, Y.Y.; Liu, M.; Cong, H.T.; Cheng, H.M.; Dresselhaus, M.S. Hydrogen storage in single-walled carbon nanotubes at room temperature. Science 1999, 286, 1127–1129. [Google Scholar] [CrossRef] [Green Version]
- Yildirim, T.; Hartman, M.R. Direct observation of hydrogen adsorption sites and nanocage formation in metal-organic frameworks. Phys. Rev. Lett. 2005, 95, 215504. [Google Scholar] [CrossRef] [Green Version]
- Chen, P.; Wu, X.; Lin, J.; Tan, K.L. High H2 Uptake by Alkali-Doped Carbon Nanotubes Under Ambient Pressure and Moderate Temperatures. Science 1999, 285, 91–93. [Google Scholar] [CrossRef]
- Sabir, A.K.; Lu, W.; Roland, C.; Bernholc, J. Ab initio simulations of H2 in Li-doped carbon nanotube systems. J. Phys. Condens. Mat. 2007, 19, 086226. [Google Scholar] [CrossRef] [Green Version]
- Zhu, Z.H.; Lu, G.Q.; Smith, S.C. Comparative study of hydrogen storage in Li- and K-doped carbon materials-theoretically revisited. Carbon 2004, 42, 2509–2514. [Google Scholar] [CrossRef]
- Froudakis, G.E. Why alkali-metal-doped carbon nanotubes possess high hydrogen uptake. Nano Lett. 2001, 1, 531–533. [Google Scholar] [CrossRef]
- Kaiser, A.; Renzler, M.; Kranabetter, L.; Schwarzler, M.; Parajuli, R.; Echt, O.; Scheier, P. On enhanced hydrogen adsorption on alkali (cesium) doped C60 and effects of the quantum nature of the H2 molecule on physisorption. Int. J. Hydrogen Energy 2017, 42, 3078–3086. [Google Scholar] [CrossRef] [Green Version]
- Lee, S.-H.; Jhi, S.-H. A first-principles study of alkali-metal-decorated graphyne as oxygen-tolerant hydrogen storage media. Carbon 2015, 81, 418–425. [Google Scholar] [CrossRef]
- Gopalsamy, K.; Subramanian, V. DFT Study of hydrogen storage on Li- and Na-doped C59B. Int. J. Hydrogen Energy 2014, 39, 2549–2559. [Google Scholar] [CrossRef]
- Teprovich, J.A.; Knight, D.A.; Peters, B.; Zidan, R. Comparative study of reversible hydrogen storage in alkali-doped fulleranes. J. Alloys Compd. 2013, 580, S364–S367. [Google Scholar] [CrossRef]
- Ghosh, A.; Debnath, T.; Ash, T.; Das, A.K. Multiple Li+ and Mg2+ decorated PAHs: Potential systems for reversible hydrogen storage. RSC Adv. 2017, 7, 9521–9533. [Google Scholar] [CrossRef] [Green Version]
- Ghosh, S.; Padmanabhan, V. Hydrogen storage in Titanium-doped single-walled carbon nanotubes with Stone-Wales defects. Diam. Relat. Mater. 2017, 77, 46–52. [Google Scholar] [CrossRef]
- Zhang, Y.; Cheng, X. Hydrogen storage property of alkali and alkaline-earth metal atoms decorated C24 fullerene: A DFT study. Chem. Phys. 2018, 505, 26–33. [Google Scholar] [CrossRef]
- Zhang, Y.; Cheng, X. A novel hydrogen storage medium of Ca-coated B40: First principles study. Int. J. Hydrogen Energy 2018, 43, 15338–15347. [Google Scholar] [CrossRef]
- Gopalsamy, K.; Subramanian, V. Hydrogen storage capacity of alkali and alkaline earth metal ions doped carbon based materials: A DFT study. Int. J. Hydrogen Energy 2014, 6, 2549–2559. [Google Scholar] [CrossRef]
- Seenithurai, S.; Pandyan, R.K.; Kumar, S.V.; Saranya, C.; Mahendran, M. Li-decorated double vacancy graphene for hydrogen storage application: A first principles study. Int. J. Hydrogen Energy 2014, 39, 11016–11026. [Google Scholar] [CrossRef]
- Kolmann, S.J.; Chan, B.; Jordan, M.J.T. Modelling the interaction of molecular hydrogen with lithium-doped hydrogen storage materials. Chem. Phys. Lett. 2008, 467, 126–130. [Google Scholar] [CrossRef]
- D’Arcy, J.H.; Kolmann, S.J.; Jordan, M.J.T. “Plug-and-Play” potentials: Investigating quantum effects in (H2)2-Li+-benzene. J. Chem. Phys. 2015, 143, 074311. [Google Scholar] [CrossRef]
- Lindoy, L.P.; Kolmann, S.J.; D’Arcy, J.H.; Crittenden, D.L.; Jordan, M.J.T. Path integral Monte Carlo simulations of H2 adsorbed to lithium-doped benzene: A model for hydrogen storage materials. J. Chem. Phys. 2015, 143, 194302. [Google Scholar] [CrossRef] [Green Version]
- Averianov, T.; Pomerantseva, E. Composite Li-ion battery cathodes formed via integration of carbon nanotubes or graphene nanoplatelets into chemical preintercalation synthesis of bilayered vanadium oxides. J. Alloys Compd. 2022, 903, 163929. [Google Scholar] [CrossRef]
- Li, Y.D.; Sun, K.; Cheng, P.; Li, J.J.; Liu, D.Q.; He, D.Y. The Synergy of La2O3 Nanoparticles and Graphene for Advanced Li-S Batteries. ChemistrySelect 2022, 7, e202104328. [Google Scholar] [CrossRef]
- Tachikawa, H.; Iyama, T. Mechanism of Hydrogen Storage in the Graphene Nanoflake-Lithium-H2 System. J. Phys. Chem. C 2019, 123, 8709–8716. [Google Scholar] [CrossRef]
- Tachikawa, H.; Yi, H.; Iyama, T.; Yamasaki, S.; Azumi, K. Hydrogen Storage Mechanism in Sodium-Based Graphene Nanoflakes: A Density Functional Theory Study. Hydrogen 2022, 3, 43–52. [Google Scholar] [CrossRef]
- Tachikawa, H.; Iyama, T. Reactions of Graphene Nano-flakes in Materials Chemistry and Astrophysics. Physchem 2022, 2, 145–162. [Google Scholar] [CrossRef]
- Tachikawa, H. Mechanism of Li storage on graphene nanoflakes: Density functional theory study. Surf. Sci. 2020, 691, 121489. [Google Scholar] [CrossRef]
- Tachikawa, H.; Shimizu, A. Diffusion dynamics of the Li atom on amorphous carbon: A direct molecular orbital-molecular dynamics study. J. Phys. Chem. B 2006, 110, 20445–20450. [Google Scholar] [CrossRef]
- Tachikawa, H. A direct molecular orbital-molecular dynamics study on the diffusion of the Li ion on a fluorinated graphene surface. J. Phys. Chem. C 2008, 112, 10193–10199. [Google Scholar] [CrossRef]
- Tachikawa, H. Diffusion of the Li+ Ion on C60: A DFT and Molecular Dynamics Study. J. Phys. Chem. C 2011, 115, 20406–20411. [Google Scholar] [CrossRef]
- Tachikawa, H.; Izumi, Y.; Iyama, T.; Azumi, K. Molecular Design of a Reversible Hydrogen Storage Device Composed of the Graphene Nanoflake-Magnesium-H2 System. ACS Omega 2021, 6, 7778–7785. [Google Scholar] [CrossRef]
- Tachikawa, H. Reaction mechanism of an intracluster SN2 reaction induced by electron capture. Phys. Chem. Chem. Phys. 2022, 24, 3941–3950. [Google Scholar] [CrossRef]
- Tachikawa, H. Reactions of Photoionization-Induced CO-H2O Cluster: Direct Ab Initio Molecular Dynamics Study. ACS Omega 2021, 6, 16688–16695. [Google Scholar] [CrossRef]
- Tachikawa, H. Formation of Hydrogen Peroxide from O-(H2O)n Clusters. J. Phys. Chem. A 2021, 125, 4598–4605. [Google Scholar] [CrossRef]
- Wan, C.; Zhou, L.; Xu, S.; Jin, B.; Ge, X.; Qian, X.; Xu, L.; Chen, F.; Zhan, X.; Yang, Y.; et al. Defect engineered mesoporous graphitic carbon nitride modified with AgPd nanoparticles for enhanced photocatalytic hydrogen evolution from formic acid. Chem. Eng. J. 2022, 429, 132388. [Google Scholar] [CrossRef]
- Ren, Z.H.; Zhang, X.; Gao, M.X.; Pan, H.G.; Liu, Y.F. Research Progress in Ti-Based Catalysts-Modified NaAlH4 Hydrogen Storage Materials. Chin. J. Rare Met. 2021, 45, 569–582. [Google Scholar]
- Zhang, J.; Zheng, X.; Yu, W.; Feng, X.; Qin, Y. Unravelling the synergy in platinum-nickel bimetal catalysts designed by atomic layer deposition for efficient hydrolytic dehydrogenation of ammonia borane. Appl. Catal. B Environ. 2022, 306, 121116. [Google Scholar] [CrossRef]
- Froudakis, G.E. Hydrogen storage in nanotubes & nanostructures. Mater. Today 2011, 14, 324–328. [Google Scholar]
- Seenithurai, S.; Chai, J.-D. Effect of Li Adsorption on the Electronic and Hydrogen Storage Properties of Acenes: A Dispersion-Corrected TAO-DFT Study. Sci. Rep. 2016, 6, 3308. [Google Scholar] [CrossRef] [PubMed] [Green Version]
- Chi, M.; Zhao, Y.-P. Adsorption of formaldehyde molecule on the intrinsic and Al-doped graphene: A first principle study. Comput. Mater. Sci. 2009, 46, 1085–1090. [Google Scholar] [CrossRef]
- Cortés-Arriagada, D.; Villegas-Escobar, N.; Ortega, D.E. Fe-doped Graphene Nanosheet as an Adsorption Platform of Harmful Gas Molecules (CO, CO2, SO2 and H2S), and the co-adsorption in O2 environments. Appl. Surf. Sci. 2018, 427, 227–236. [Google Scholar] [CrossRef]
Figure 1.
The graphene nanoflakes used in the present calculations. GNF(m) is the graphene nanoflake composed of m benzene rings. GNF(7), GNF(19), and GNF(37) are coronene (C24H12), circumcoronene (C54H18), and circumcircumcoronene (C96H24), respectively.
Figure 1.
The graphene nanoflakes used in the present calculations. GNF(m) is the graphene nanoflake composed of m benzene rings. GNF(7), GNF(19), and GNF(37) are coronene (C24H12), circumcoronene (C54H18), and circumcircumcoronene (C96H24), respectively.

Figure 2.
The optimized structures of the GNF(37)–Li(atom)–(H2)n (n = 1, 2, 3, 4, 7, and 11). The calculations were performed at the CAM-B3LYP/6-311G(d,p) level. Reprinted with permission from [38]. Copyright 2019 American Chemical Society.
Figure 2.
The optimized structures of the GNF(37)–Li(atom)–(H2)n (n = 1, 2, 3, 4, 7, and 11). The calculations were performed at the CAM-B3LYP/6-311G(d,p) level. Reprinted with permission from [38]. Copyright 2019 American Chemical Society.

Figure 3.
The binding energies of H2 to GNF(37)-Li and GNF(37)-Li+ (per H2 molecule) plotted as a function of the number of hydrogen molecules (n). The open squares represent the binding energies of H2 to the Li atom without GNF, Li(H2)n. Calculations were performed at the CAM-B3LYP/6-311G(d,p) level. Reprinted with permission from [38]. Copyright 2019 American Chemical Society.

Figure 4.
The optimized structures of GNF(37)–Na(atom)–(H2)n (n = 1–6). The calculations were performed at the CAM-B3LYP/6-311G(d,p) level. Reprinted with permission from [39].
Figure 4.
The optimized structures of GNF(37)–Na(atom)–(H2)n (n = 1–6). The calculations were performed at the CAM-B3LYP/6-311G(d,p) level. Reprinted with permission from [39].

Figure 5.
The binding energies of H2 to GNF(37)–Na and GNF(37)–Na+ (per H2 molecule) plotted as a function of the number of hydrogen molecules (n). Calculations were performed at the CAM-B3LYP/6-311G(d,p) level.
Figure 5.
The binding energies of H2 to GNF(37)–Na and GNF(37)–Na+ (per H2 molecule) plotted as a function of the number of hydrogen molecules (n). Calculations were performed at the CAM-B3LYP/6-311G(d,p) level.

Figure 6.
The optimized structures of GNF(37)–K(atom)–(H2)n (n = 1, 2, and 5–8). The calculations were performed at the CAM-B3LYP/6-311G(d,p) level.
Figure 6.
The optimized structures of GNF(37)–K(atom)–(H2)n (n = 1, 2, and 5–8). The calculations were performed at the CAM-B3LYP/6-311G(d,p) level.

Figure 7.
The binding energies of H2 to GNF–M (per H2 molecule) plotted as a function of n (M = Li, Li+, Na, Na+, and K+). Calculations for M = Li, Li+, Na, Na+ were carried out at the CAM-B3LYP/6-311G(d,p) level and for M = K+, it was at the CAM-B3LYP/6-31G(d) level. Reprinted with permission from [39].

Figure 8.
(A) The potential energy curves for the diffusion of the Li+ ion and Li atom along the points a → b path on the surface. The heights of the Li+ ion and Li atom were set to 1.777 and 1.729 Å, respectively. Optimized transition state structures for the diffusion of the (B) Li+ ion and (C) Li atom on GNF(37). The height (h) of Li is given in Å. All calculations were carried out at the CAM-B3LYP/6-311G(d,p) level of theory. Reprinted with permission from [41]. Copyright 2020 Elsevier.

Figure 9.
(Left) Sample trajectory of Li+ on GNF at 300 K (dotted red curve), spatial distribution of HOMO of GNF–Li+, and the phases of HOMO (green and brown colors). (Right) A schematic illustration of the interaction of molecular orbitals between Li+ and GNF during the diffusion. The trajectory calculation was carried out using the direct ab initio molecular dynamics (MD) method. The Li+ ion diffuses along the node of HOMO of the GNF–Li+ system. Reprinted with permission from [42]. Copyright 2006 American Chemical Society.

Figure 10.
The optimized structures of GNF(19)–Li+–(H2)n (n = 3) in the (upper) binding state and (lower) transition state (TS) calculated at the CAM-B3LYP/6-311G(d,p) level. Bond distances are given in Å. Reprinted with permission from [38]. Copyright 2019 American Chemical Society.
Figure 10.
The optimized structures of GNF(19)–Li+–(H2)n (n = 3) in the (upper) binding state and (lower) transition state (TS) calculated at the CAM-B3LYP/6-311G(d,p) level. Bond distances are given in Å. Reprinted with permission from [38]. Copyright 2019 American Chemical Society.

Figure 11.
(A) The optimized structure of the GNF(7)-Mg2+ calculated at the CAM-B3LYP/6-311G(d,p) level. Notation h means the height of Mg species from the GNF surface (in Å). (B) The binding energies of H2 to GNF(7)–Mg2+ and GNF(7)–Mg+ (per H2 molecule) plotted as a function of the number of H2 molecules (n). Dashed lines indicate the binding energies of H2 to GNF(37)–Mgm+ (m = 1 and 2). Reprinted with permission from [45]. Copyright 2021 American Chemical Society.

Figure 12.
(A) Snapshots of GNF–Mg+–(H2)4 following the electron capture of GNF–Mg2+–(H2)4. (B) Time evolution of potential energy of GNF–Mg+-(H2)4. Direct AIMD calculations were carried out at the CAM-B3LYP/6-31G(d) level. The initial geometry was taken from the optimized structure of GNF–Mg2+–(H2)4 (CAM-B3LYP/6-31G(d) level). The distances and heights are in Å. Reprinted with permission from [45]. Copyright 2021 American Chemical Society.

Figure 13.
(A) The snapshots of the GNF–Mg2+–(H2)4 following the hole capture of GNF–Mg+–(H2)4. (B) The time evolution of the potential energy of GNF–Mg2+–(H2)4. Direct AIMD calculations were carried out at the CAM-B3LYP/6-31G(d) level. The initial geometry was taken from one of the structures in the simulation of GNF–Mg+-(H2)4 (indicated by “selected point” in Figure 12). The distances and heights are in Å. Reprinted with permission from [45]. Copyright 2021 American Chemical Society.

Figure 14.
The conceptual diagram for a H2 adsorption–desorption reversible molecular device.


Table 1.
The binding energies of M (or M+) to GNF (Ebind in kcal/mol, M = Li, Na, and K), heights of M from the GNF surface (h in Å), and NPA-determined atomic charges for M on GNF, calculated at the CAM-B3LYP/6-311G(d,p) level.
Table 1.
The binding energies of M (or M+) to GNF (Ebind in kcal/mol, M = Li, Na, and K), heights of M from the GNF surface (h in Å), and NPA-determined atomic charges for M on GNF, calculated at the CAM-B3LYP/6-311G(d,p) level.
| Ebind | Height (h) | NPA | |
|---|---|---|---|
| GNF–Li | 17.1 | 1.736 | +0.929 |
| GNF–Li+ | 52.8 | 1.771 | +0.937 |
| GNF–Na | 4.4 | 2.247 | +0.978 |
| GNF–Na+ | 37.5 | 2.288 | +0.979 |
| GNF–K | 5.3 | 2.649 | +0.979 |
| GNF–K+ | 27.3 | 2.756 | +0.982 |
Table 2.
The diffusion barriers (Ediff in kcal/mol) of the Li species (Li+ ions and Li atoms) on GNFs of several sizes, (GNF(m), m = 14, 19, and 37), where m is the number of benzene rings comprising the GNF. The Ediff + ΔZPE values (in kcal/mol) are the diffusion barrier values after the zero-point energy (ZPE) corrections. All calculations were carried out at the CAM-B3LYP/6-311G(d,p) level of theory.
| m | Ediff (Li+) | Ediff(Li+) + ΔZPE | Ediff(Li) | Ediff (Li) + ΔZPE |
|---|---|---|---|---|
| 14 | 6.17 | 5.74 | 6.11 | 5.59 |
| 19 | 6.35 | 5.83 | 6.55 | 6.06 |
| 37 | 6.26 | 5.90 | 7.33 | 6.84 |
Table 3.
The diffusion (activation) barriers of Li+(H2)n (n = 0–4) on the GNF(19) surface (Ea in kcal/mol) calculated at the CAM-B3LYP/6-311G(d,p) level. The term ΔEbind refers to the differences in binding energies in the transition state (TS) and binding state (per H2 molecule in kcal/mol).
Table 3.
The diffusion (activation) barriers of Li+(H2)n (n = 0–4) on the GNF(19) surface (Ea in kcal/mol) calculated at the CAM-B3LYP/6-311G(d,p) level. The term ΔEbind refers to the differences in binding energies in the transition state (TS) and binding state (per H2 molecule in kcal/mol).
| n | Ea/kcal mol−1 | ΔEbind/kcal mol−1 |
|---|---|---|
| 0 | 6.35 | 0.0 |
| 1 | 6.35 | 0.01 |
| 2 | 4.95 | −0.70 |
| 3 | 3.73 | −0.87 |
| 4 | 3.62 | −0.68 |
Publisher’s Note: MDPI stays neutral with regard to jurisdictional claims in published maps and institutional affiliations. |
© 2022 by the author. Licensee MDPI, Basel, Switzerland. This article is an open access article distributed under the terms and conditions of the Creative Commons Attribution (CC BY) license (https://creativecommons.org/licenses/by/4.0/).
Share and Cite
MDPI and ACS Style
Tachikawa, H. Hydrogen Storages Based on Graphene Nano-Flakes: Density Functional Theory Approach. C 2022, 8, 36. https://0-doi-org.brum.beds.ac.uk/10.3390/c8030036
AMA Style
Tachikawa H. Hydrogen Storages Based on Graphene Nano-Flakes: Density Functional Theory Approach. C. 2022; 8(3):36. https://0-doi-org.brum.beds.ac.uk/10.3390/c8030036
Chicago/Turabian StyleTachikawa, Hiroto. 2022. "Hydrogen Storages Based on Graphene Nano-Flakes: Density Functional Theory Approach" C 8, no. 3: 36. https://0-doi-org.brum.beds.ac.uk/10.3390/c8030036
Note that from the first issue of 2016, this journal uses article numbers instead of page numbers. See further details here.