Article

Manuka Honey with Varying Levels of Active Manuka Factor (AMF) Ratings as an Anaerobic Fermentation Substrate for Limosilactobacillus reuteri DPC16

1
Food Science, School of Chemical Sciences, The University of Auckland, Auckland 1010, New Zealand
2
School of Sciences, Auckland University of Technology, Auckland 1010, New Zealand
3
Department of Chemical and Biochemical Engineering, College of Chemistry and Chemical Engineering, Xiamen University, Xiamen 361005, China
4
Bioactives Research New Zealand Limited, Auckland 1023, New Zealand
5
Riddet Institute, New Zealand Centre of Research Excellence for Food Research, Palmerston North 4474, New Zealand
*
Author to whom correspondence should be addressed.
Fermentation 2021, 7(3), 128; https://doi.org/10.3390/fermentation7030128
Submission received: 30 May 2021 / Revised: 19 July 2021 / Accepted: 21 July 2021 / Published: 26 July 2021
(This article belongs to the Special Issue Fermented Foods and Gut Microbiome)

Abstract

:
Manuka honey is known for its strong antibacterial effect against pathogens but can promote probiotic growth in certain conditions. In a two-factor ANOVA study, AMFTM Manuka honey (Active Manuka Factor: 05+, 10+, 15+ and 20+) was utilised as a substrate for probiotic Limosilactobacillus reuteri DPC16 in an anaerobic batch fermenter for 36 h. The biomass growth in MRS broth was noticeably higher with AMF Manuka honey than invert syrup and control samples without any additional sweetener source. The pH value was significantly lowered below 4.0 only in the AMF samples with the formation of lactic acid as the major metabolite. Other beneficial short-chain fatty acids (SCFA), such as acetic, succinic, and propionic acids, produced during the fermentation, along with the honey saccharides, were quantified by two-dimensional (2-D) nuclear magnetic resonance (NMR) spectroscopy. A significantly (p < 0.05) high biomass in AMF 20+ sample after 36 h, can partly be attributed to the high total sugar and oligosaccharide content in the honey. Importantly, however, no statistically significant difference was observed in the recorded major fermentation outcomes for the different AMF levels. The results, nevertheless, indicate the potential prebiotic efficacy of Manuka honey as a fermentation substrate for the lactobacilli probiotic strain.

1. Introduction

The prebiotic concept has evolved over the years and currently refers to a substrate that selectively promotes the growth of probiotic gut microorganisms, including the lactic acid bacteria (LAB), thus conferring a health benefit to the host [1]. To be considered as prebiotic, the substrate must ideally be non-digestible and have a high fermentation efficacy [1,2]. Furthermore, the health effects include the production of short-chain fatty acids (SCFA) such as acetate, propionate and butyrate, which enhance the absorption of minerals and maintain the barrier integrity to the pathogens and their metabolites [3]. Functional health benefits of probiotics and prebiotics are reinforced by SCFA, which are also known to be anti-inflammatory with immunomodulatory properties, control the appetite, and lower the risk of colon cancer and cardiovascular diseases, among many other health benefits [4,5].
Fermentation of undigested carbohydrates by the action of the anaerobic gut microbiota in the human large intestine yields organic acids and gases (hydrogen, methane, and CO2) as the major metabolites [3,6]. Organic acids provide energy to the epithelial cells and promote intestinal acidification, thus improving the growth of the beneficial microbes over the harmful gut bacteria. Lowering of the pH is a desirable outcome in the human gut since it has several favourable effects, such as inhibiting the production of toxic metabolites released during fermentation by certain Gram-negative anaerobes [7]. Organic acid production (mainly lactic and acetic acid) also contributes positively towards food preservation by providing an unfavourable environment for the proliferation of pH-sensitive pathogens and spoilage bacteria, thereby increasing the product shelf-life [8].
Previous studies on Limosilactobacillus reuteri DPC16, (the recent taxonomic classification of Lactobacillus reuteri DPC16 [9]), which is a probiotic isolated from the faeces of a healthy human, revealed that the antimicrobial activity of the strain against pathogens was pH-dependent [10]. At the low pH generated in MRS broth, SCFAs produced during the fermentation process were responsible for the antimicrobial activity against both Gram-positive and Gram-negative pathogens. However, in glycerol-supplemented media, reuterin (3-hydroxypropionaldehyde), a potent pH-independent antibacterially active compound, is generated. Thus, the efficacy of probiotics against pathogenic bacteria is ascribed to various factors such as the production of organic acids and certain antibacterial substances (aldehydes, hydrogen peroxide and bacteriocins) [8]. These bacteriocins (for example, reuterin produced by L. reuteri) and the SCFAs are also widely researched as food additives and natural food preservatives for improving the product shelf-life, flavour, and quality characteristics [4], in addition to the gut-health benefits.
Honey has natural antimicrobial properties and is also being recognised as a potential prebiotic, since it contains non-digestible oligosaccharides (approx. 5–10% w/w), which can promote the growth of probiotic lactobacilli and bifidobacteria over the pathogenic bacteria [11,12,13,14]. Honey can thus be synergistically effective in inhibiting the growth and activity of undesirable gut bacteria. Manuka honey, derived from the Manuka shrub (Leptospermum scoparium) indigenous to New Zealand, is primarily known for its non-peroxide antimicrobial activity [15]. The characteristic antibacterial activity is on account of various unique components in Manuka honey, and is commonly denoted by the Unique Manuka Factor (UMFTM), Methyl Glyoxal (MGOTM) or Active Manuka Factor (AMFTM) on the packaging label [16,17]. Moreover, the term ‘Active’ Manuka Factor (AMF) indicates overall antimicrobial activity, including those contributed by hydrogen peroxide, but is mainly based on the content of L. reuteri DPC16 fermentation marker (metabolites) in the commercially available Manuka honey [18].
Nuclear magnetic resonance (NMR) investigation is non-invasive and nondestructive, highly accurate and selective, and entails minimal sample preparation [19,20,21]. The technique enables simultaneous detection of complex organic molecules in mixtures, and thus has high repeatability in results for complex sample matrices. The inherently low sensitivity of NMR, when compared with chromatography methods, is overcome by using high-field magnets, cryogenic probes, and advanced polarisation techniques [21]. Recently, there has been a noticeable trend towards quantitative NMR (qNMR) compared with gas and liquid chromatography techniques, and has led to several new studies in the literature on the qNMR methodology [21,22,23].
There are many studies on the antimicrobial components and health effects of honey, and most of them have focused on the unique antibacterial activity of varieties such as Manuka [12,13,15,16]. The efficacy of Manuka honey as a fermentation substrate for probiotics, which is crucial to ascertain its prebiotic efficacy, is yet to be adequately researched. In the present study, Manuka honey was utilised as a substrate for probiotic L. reuteri DPC16 in a pure culture system with the aim to evaluate the effect of the different AMF levels on biomass growth and other fermentation outcomes. It was also aimed to quantify the Manuka honey sugars and the beneficial fermentation products released, such as organic acid metabolites.

2. Materials and Methods

2.1. Microbial Strains, Media and Chemicals

Probiotic L. reuteri DPC16 was provided by Bioactives Research New Zealand. The probiotic strain is maintained at the New Zealand Reference Culture Collection (Accession No. NZRM 4294), Kenepuru Science Centre, Porirua, New Zealand. The culture was stored in the laboratory in MRS broth with 20% glycerol as the cryoprotectant in a −20 °C freezer. For each of the fermentation experiments, the thawed culture was inoculated into freshly prepared MRS broth and incubated for 12 h at 37 °C in a shaking incubator to achieve a cell density of 9 log cfu/mL. The culture was inoculated again in fresh MRS broth and likewise incubated to repeat the step.
Drapac DrKiwi Manuka Honey AMFTM 05+, 10+, 15+, and 20+ (AMF5, AMF10, AMF15, and AMF20) and invert syrup (IS) were procured from the local supermarket or pharmacy. All the honey and invert syrup samples were within the two months of the manufacturing date. de Man, Rogosa, and Sharpe (MRS) broth supplied by Oxoid (Thermo Fisher Biochemicals, Bejing, China) was used as the bacterial growth medium. Analytical standards for organic acids (lactic acid, acetic acid, butyric acid, succinic acid, and propionic acid), and the saccharides (glucose, fructose, sucrose, maltose, nigerose, kojibiose, and panose) were purchased from Sigma Aldrich (Christchurch, New Zealand) and Thermofischer Scientific (Auckland, New Zealand).

2.2. Anaerobic Batch Fermentation

The experiment was designed to study the growth characteristics of probiotic L. reuteri DPC16 in a pure culture system with Manuka honey having different levels of AMF ratings. The fermentation ability of the probiotic (L. reuteri DPC 16) was investigated in a sterilised 2-litre uncontrolled-pH batch-culture fermenter in MRS broth under anaerobic conditions for 36 h. The fermenter was fed with sterile MRS broth, a complex medium for lactobacilli cultivation, which contains mainly yeast extract, vitamins, minerals, amino acids, and glucose (2% w/w). Additional sugar substrate (5.0% w/v) initially supplemented to the respective MRS broth sample was Manuka honey, or invert syrup which mainly consists of glucose, fructose and sucrose in broadly the same ratio as honey (but containing none of the complex honey oligosaccharides). The MRS control sample had no additional sugar source except glucose (from MRS broth). After 24 h, the same substrate (AMF honey or invert syrup) at 2.5% w/v was added again in each of the fermentation cycles.
Inoculation was performed using 1.0% (v/v) starter culture in MRS broth, as described above. Anaerobic conditions were generated and maintained throughout the fermentation period by a constant flow of nitrogen gas through the fermenter. The temperature was monitored and controlled at 37 °C throughout the experiment in the circulating water-jacket vessel. Initial culture volume was 1000 mL, while the stirring rate was 300 rpm. Sampling (10 mL) was done every 4 h after discarding a dead volume (approx. 3 mL) from the sampling outlet. Online parameters such as pH, dissolved oxygen (DO), and temperature were recorded continuously in the fermenter. Offline parameters such as reducing sugar levels and biomass growth were analysed every 12 and 4 h, respectively.

2.3. Biomass Growth

The biomass growth of the probiotic was monitored every 4 h by the dry cell weight (DCW) method. Bacterial cells were harvested after centrifugation at 7000× g for 10 min at 4 °C, and the supernatant obtained was analysed for reducing sugars and organic acids as per the methods described below. Cell pellets were re-suspended in de-ionised water and washed by centrifuging as above. The final supernatant was discarded, and the Eppendorf tubes containing the biomass were kept (partially open) in the hot air oven overnight (12 h) at 65 °C to calculate the DCW (mg/mL).

2.4. Reducing Sugar Quantification

Cell-free supernatant was analysed for reducing sugars by using dinitrosalicyclic acid (DNS) method [24]. Briefly, the cell-free supernatant was diluted 100 times with Type-1 water to ensure that the final reducing sugar concentration ranged between 0 and 1.0 g/L. An equal amount of DNS solution was added to the diluted supernatant (125 µL each) and heated to 90 °C for 5 min. A total of 2 mL of Type-1 water was added after cooling the heated samples in the refrigerator (4 °C) for 5 min. Optical density (OD) measurement was conducted in a spectrophotometer at 540 nm for 200 µL of the final samples. Reducing sugar amount (g/L) was quantified from the regression equation obtained by calibration curves.

2.5. Quantification of Organic Acid Metabolites and Honey Sugars

Samples containing the cell-free supernatants of the MRS broth were analysed for the organic acid metabolites using two-dimensional (2D) NMR spectroscopy. The 1H-13C heteronuclear single quantum correlation (HSQC) experiments were conducted as described in our previous study [17]. Briefly, filtered cell-free supernatants were introduced in 5 mm NMR tubes with D2O (9:1—supernatant:D2O ratio) to a total volume of 500 μL and vortexed thoroughly before analysis on a Bruker Avance III 400 MHz spectrometer (Bruker Scientific Instruments, Billerica, MA, USA) at a temperature of 300 K. H2O was the internal reference of the chemical shift at 4.65 ppm. D2O addition not only facilitated the adjustment of the lock and shim system but also improved the signal-to-noise ratio, yielding superior NMR spectra [20]. Pulse tip-angle calibration using the single-pulse nutation method (Bruker pulsecal routine) was undertaken for each sample [25] (Supplementary Figures S1–S3 Online). Standard curves were constructed using the pure compounds for quantification by heteronuclear NMR (see Supplementary Figure S4 Online for lactic and acetic acids), which entails that for different samples, a comparable weakening of signals occurs throughout the transmission period of magnetisation [23]. Analytical standards used for the quantification of organic acids were also diluted in D2O in the same proportion as the samples. The metabolites produced were calculated by the difference between initial and final concentration (mM) in the supernatant. The pH values of the standard dilutions were adjusted using phosphate buffer (100 mM, pH 7.4) to match the pH range of the samples.
Pure honey and invert sugar samples, including the analytical standards of the targeted saccharides, were diluted to the optimal strength in 66.6 mM sodium phosphate buffer (pH 5.3), before adding D2O (9:1, as described earlier). Controlling the pH and instrument temperature was necessary to ensure the reproducibility of chemical shifts [21] (Supplementary Figures S5–S7 Online). TopSpin Software (Version 4.0) was used to Fourier transform, phase, baseline-correct and integrate the NMR spectra for analysis and quantification. Published data were referred for confirming the assignment of various organic acids and sugar components [20,22]. The observed limit of detection (LOD) and limit of quantification (LOQ) were 100 and 500 µM, respectively, which was comparable to that reported by Hu et al. [20,22] for organic acids. While the chemical shifts in the 1H and 13C signals can be somewhat different from that reported elsewhere in the literature due to the variations in experimental conditions (especially the pH), the correlations in 2D NMR (HSQC) are not affected by the empirical parameters [20].

2.6. Statistical Analysis

Statistical analysis was performed on the triplicate (n = 3) analyses using general linear model (Univariate) in IBM SPSS Statistics (v26). Two-factor analysis of variance (ANOVA) was conducted at a 95% confidence interval to compare the average changes in each of the dependent variables (substrate consumption, biomass growth, and metabolite production) with the ‘main effect’ of the factors (Manuka honey AMF level and fermentation time). A p-value lower than 0.05 was considered as statistically significant for the ‘main effect’ and the ‘simple effect’ (interaction). Duncan’s post hoc multiple comparison test was performed for statistically significant interactions.

3. Results and Discussion

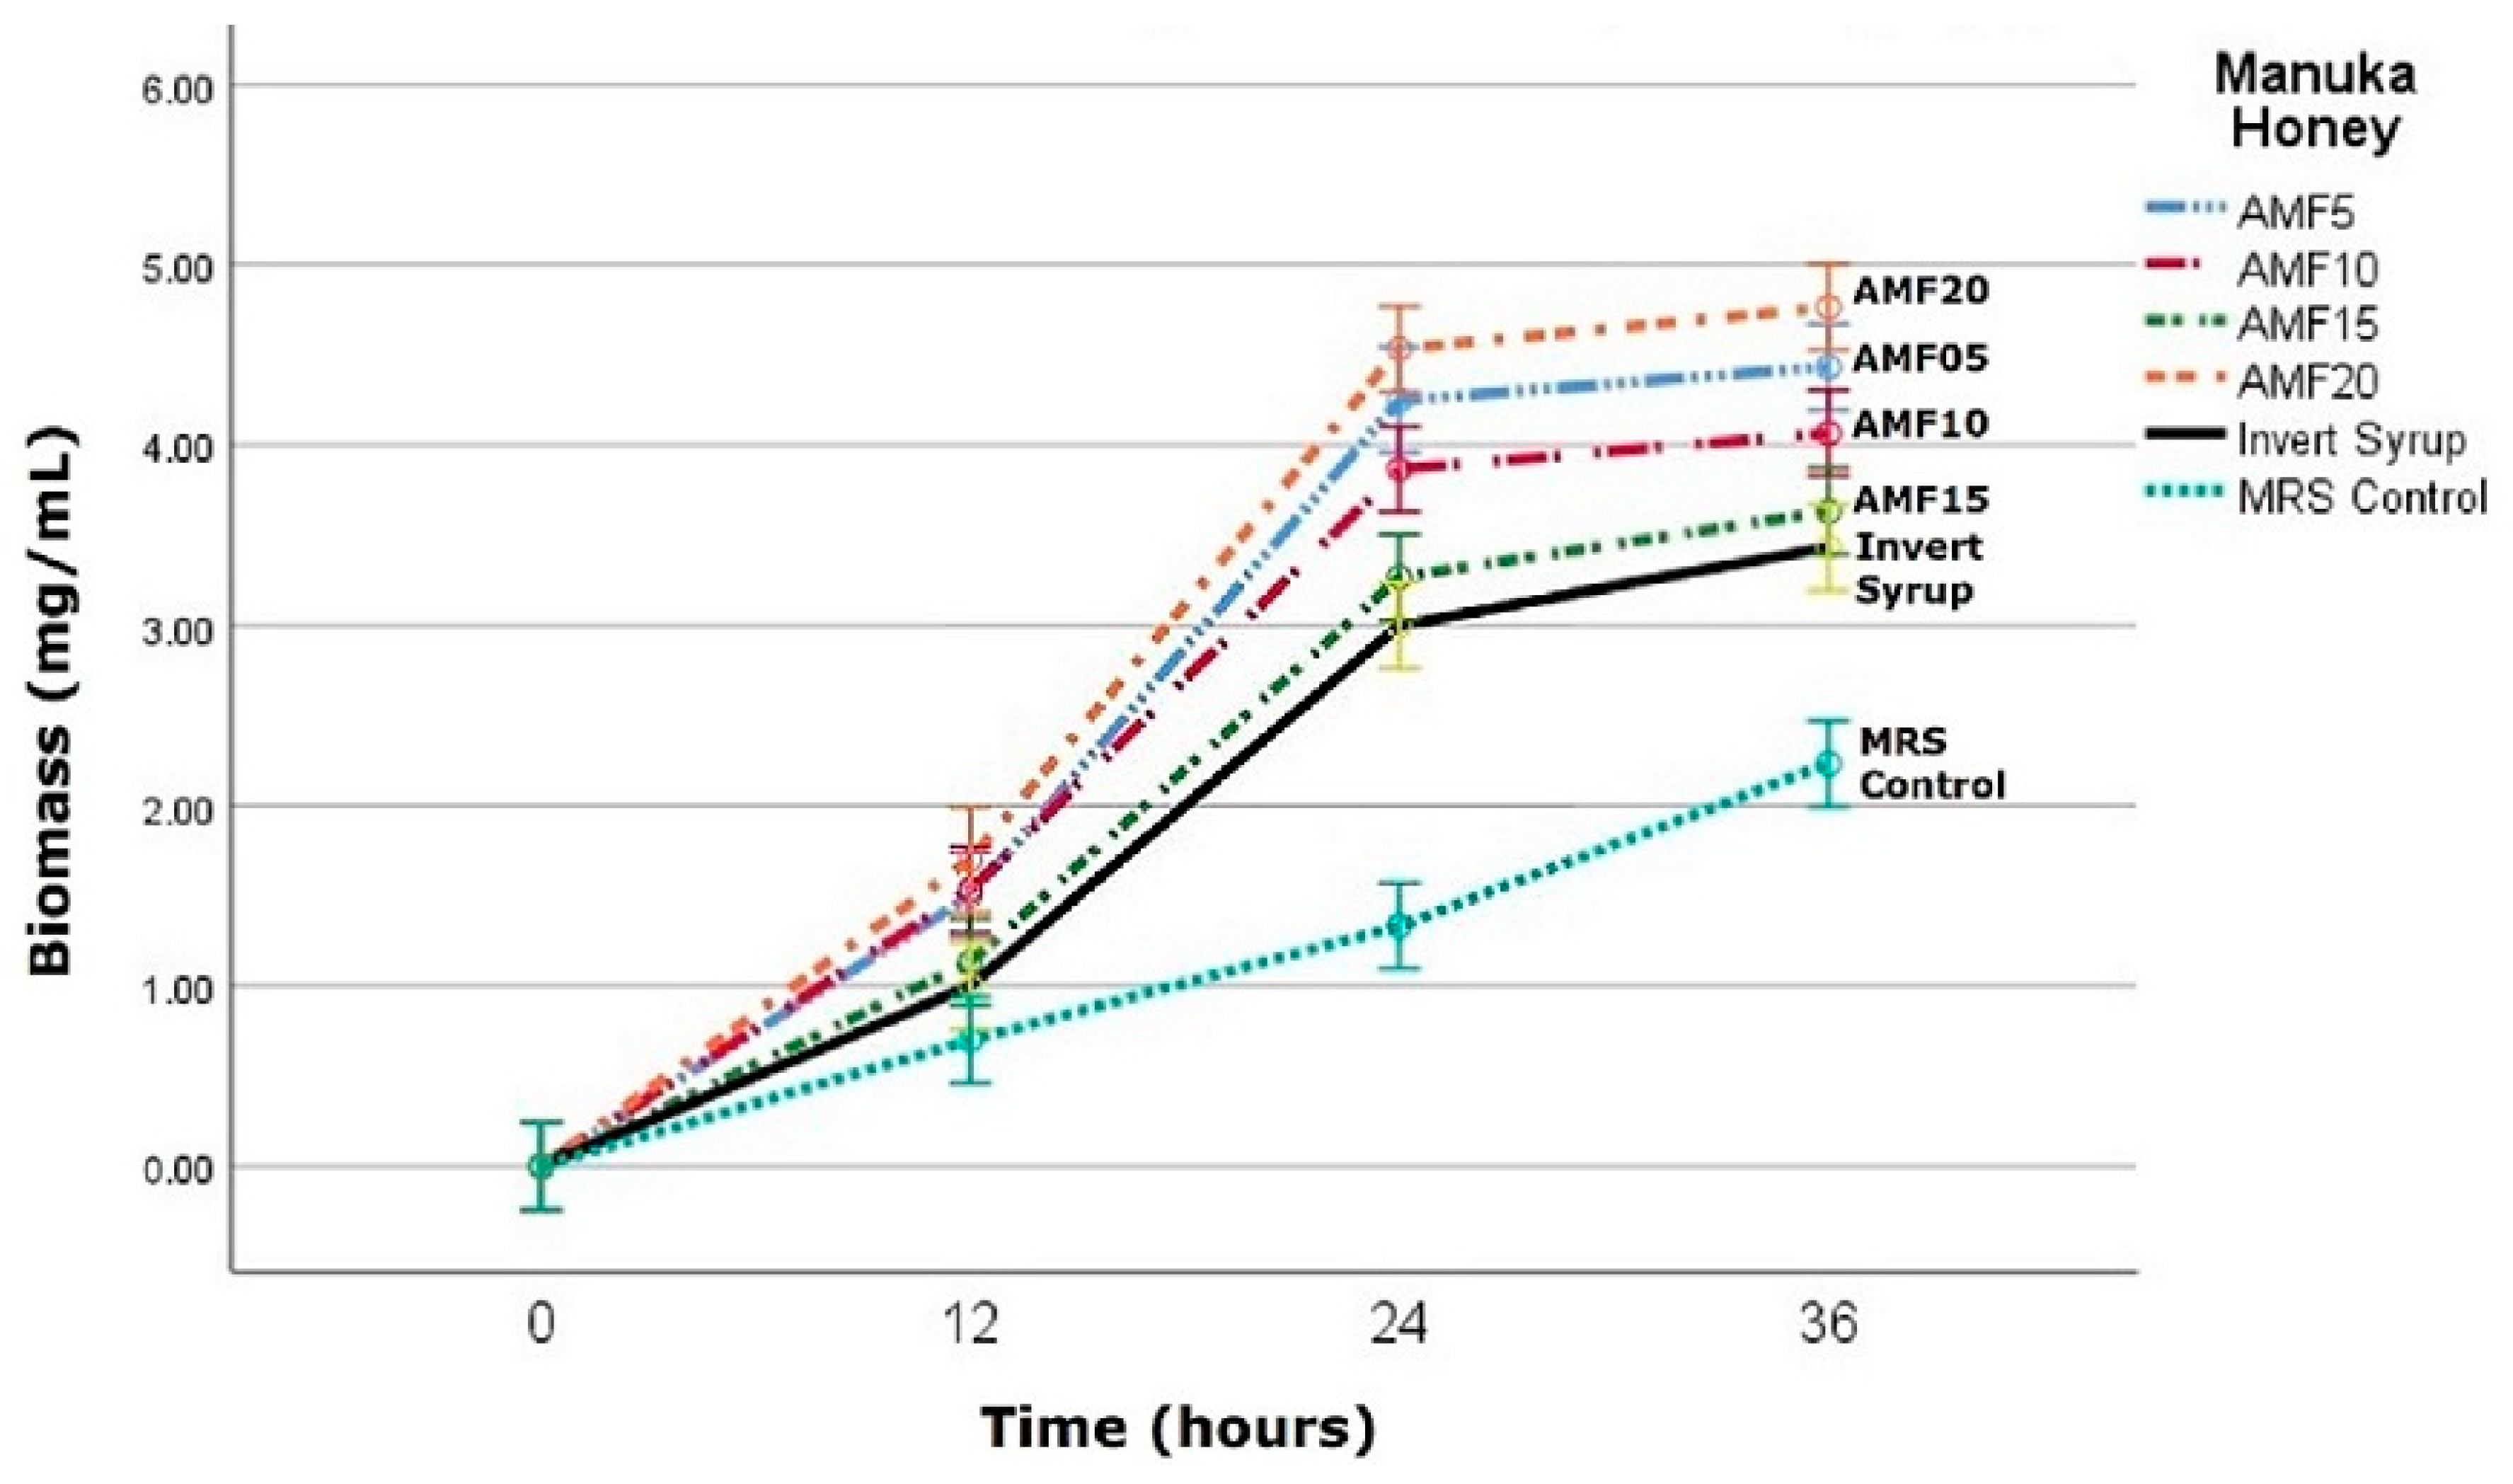
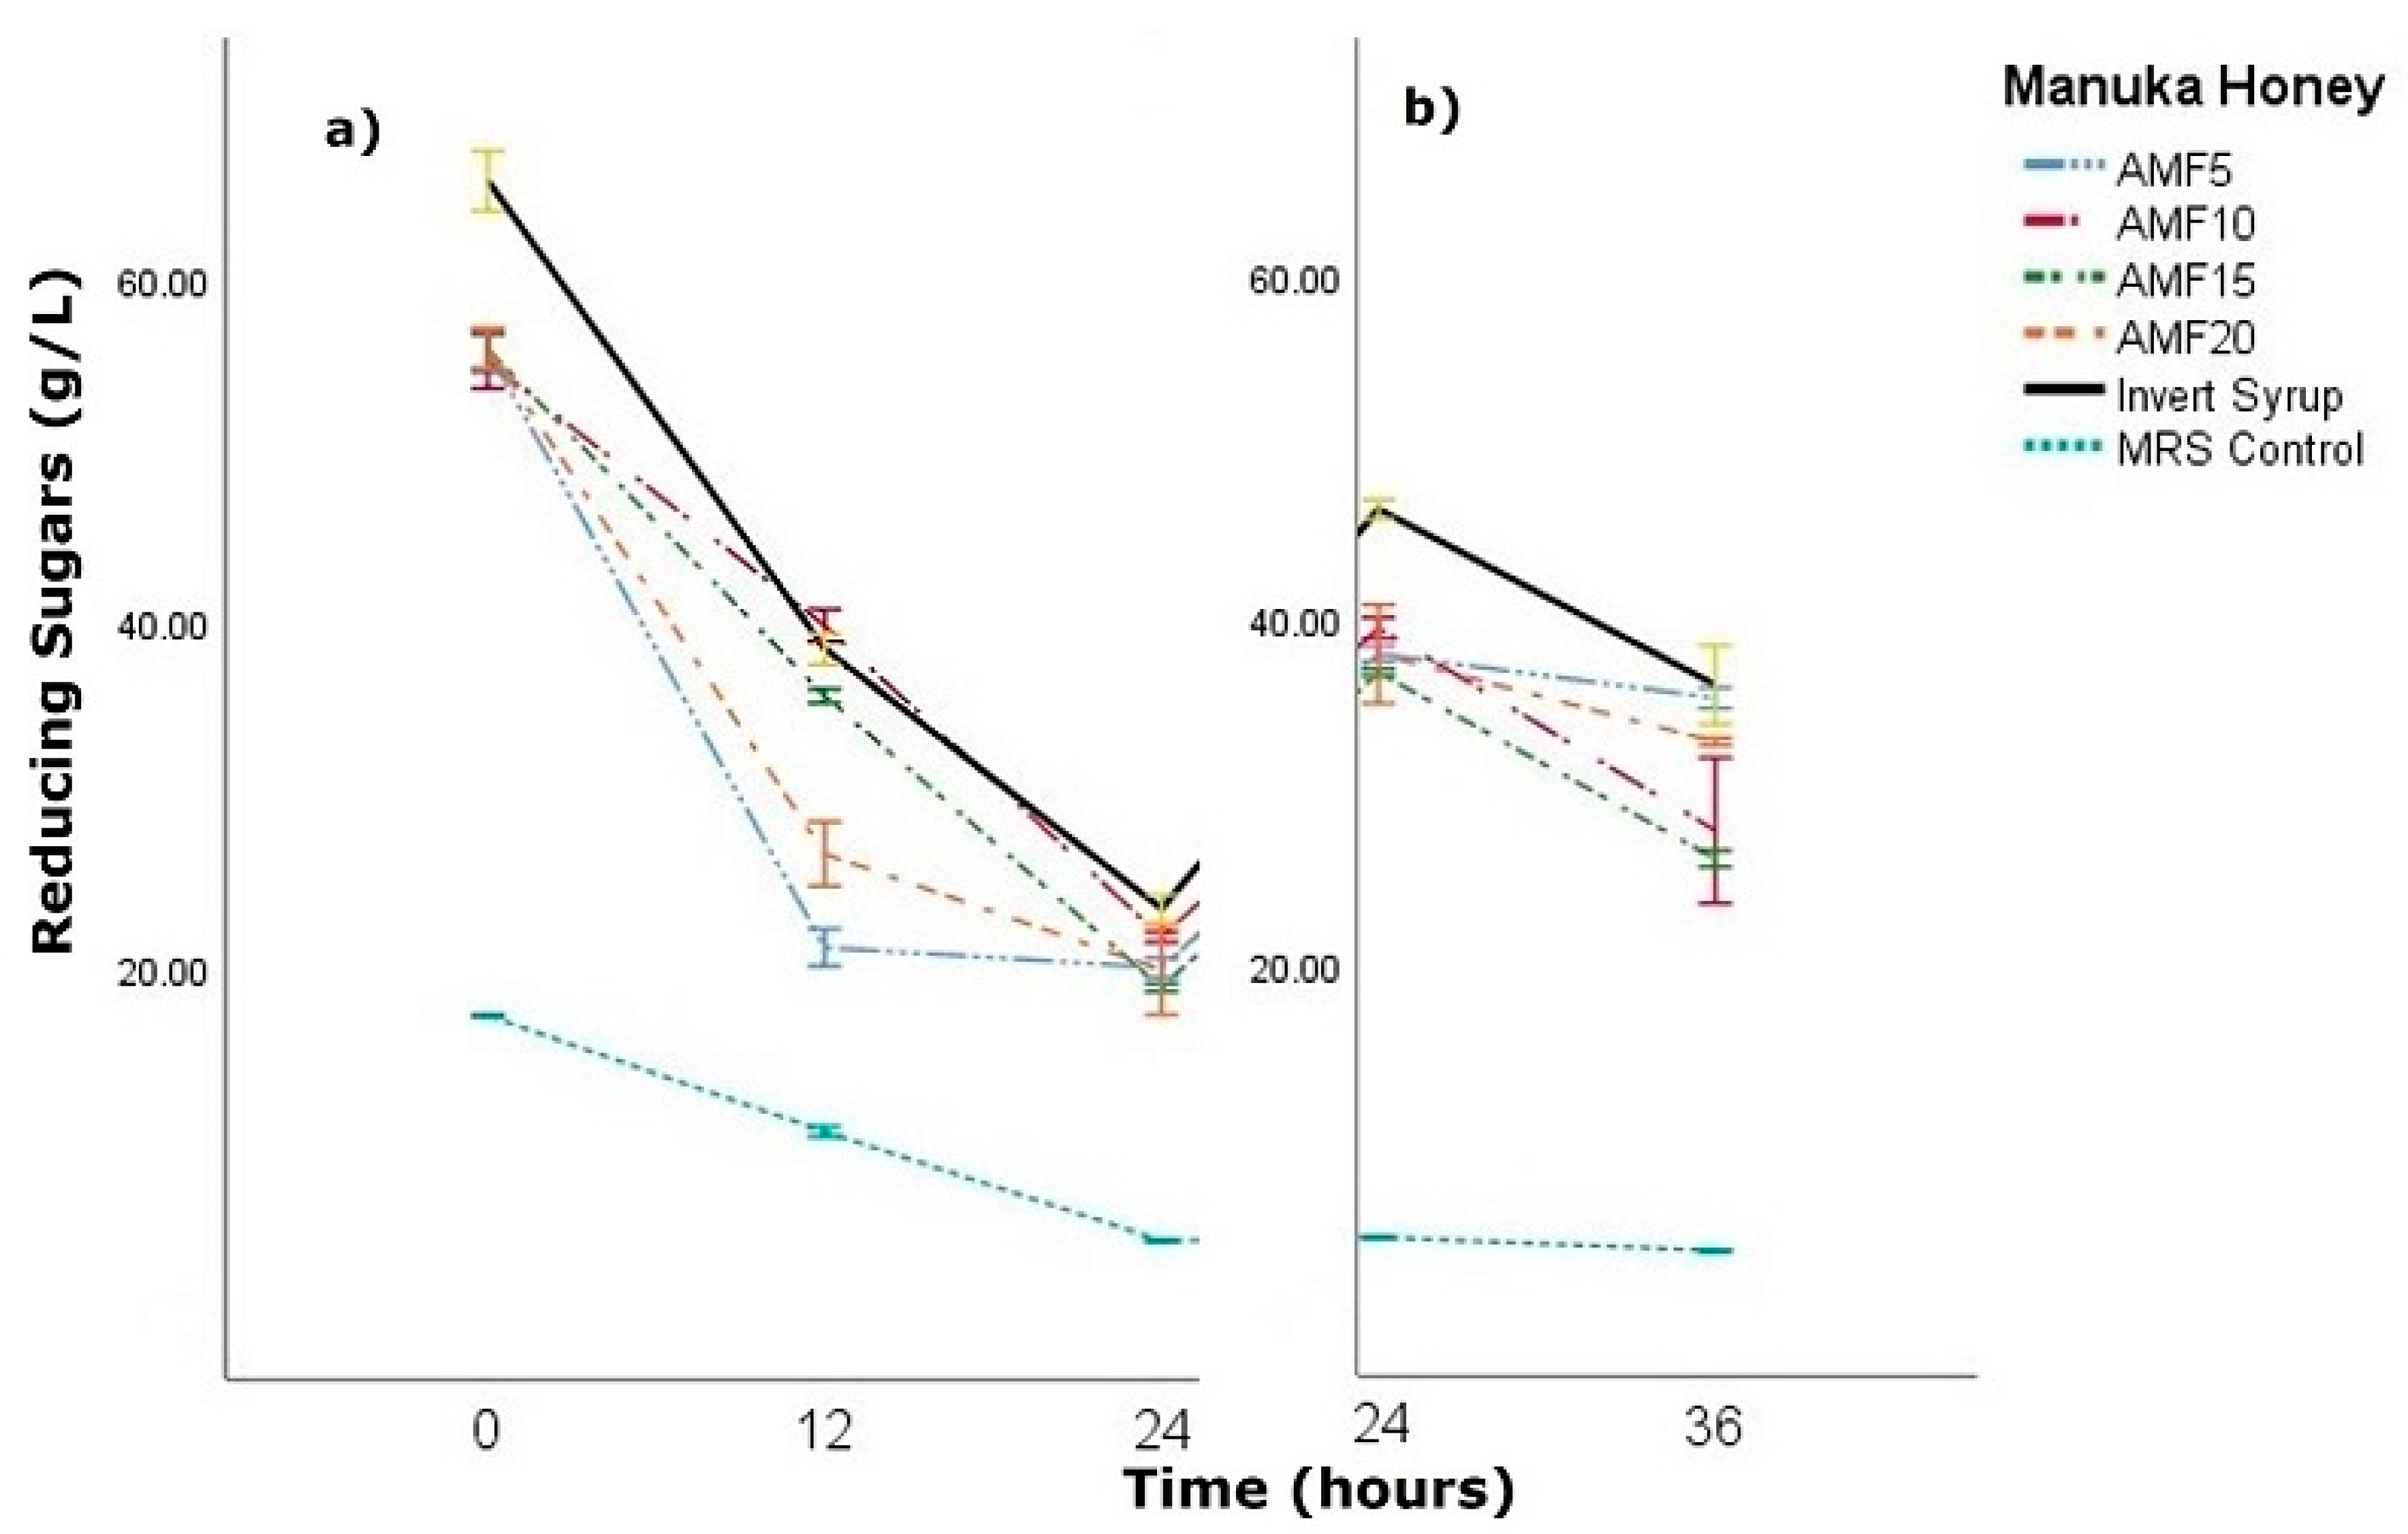
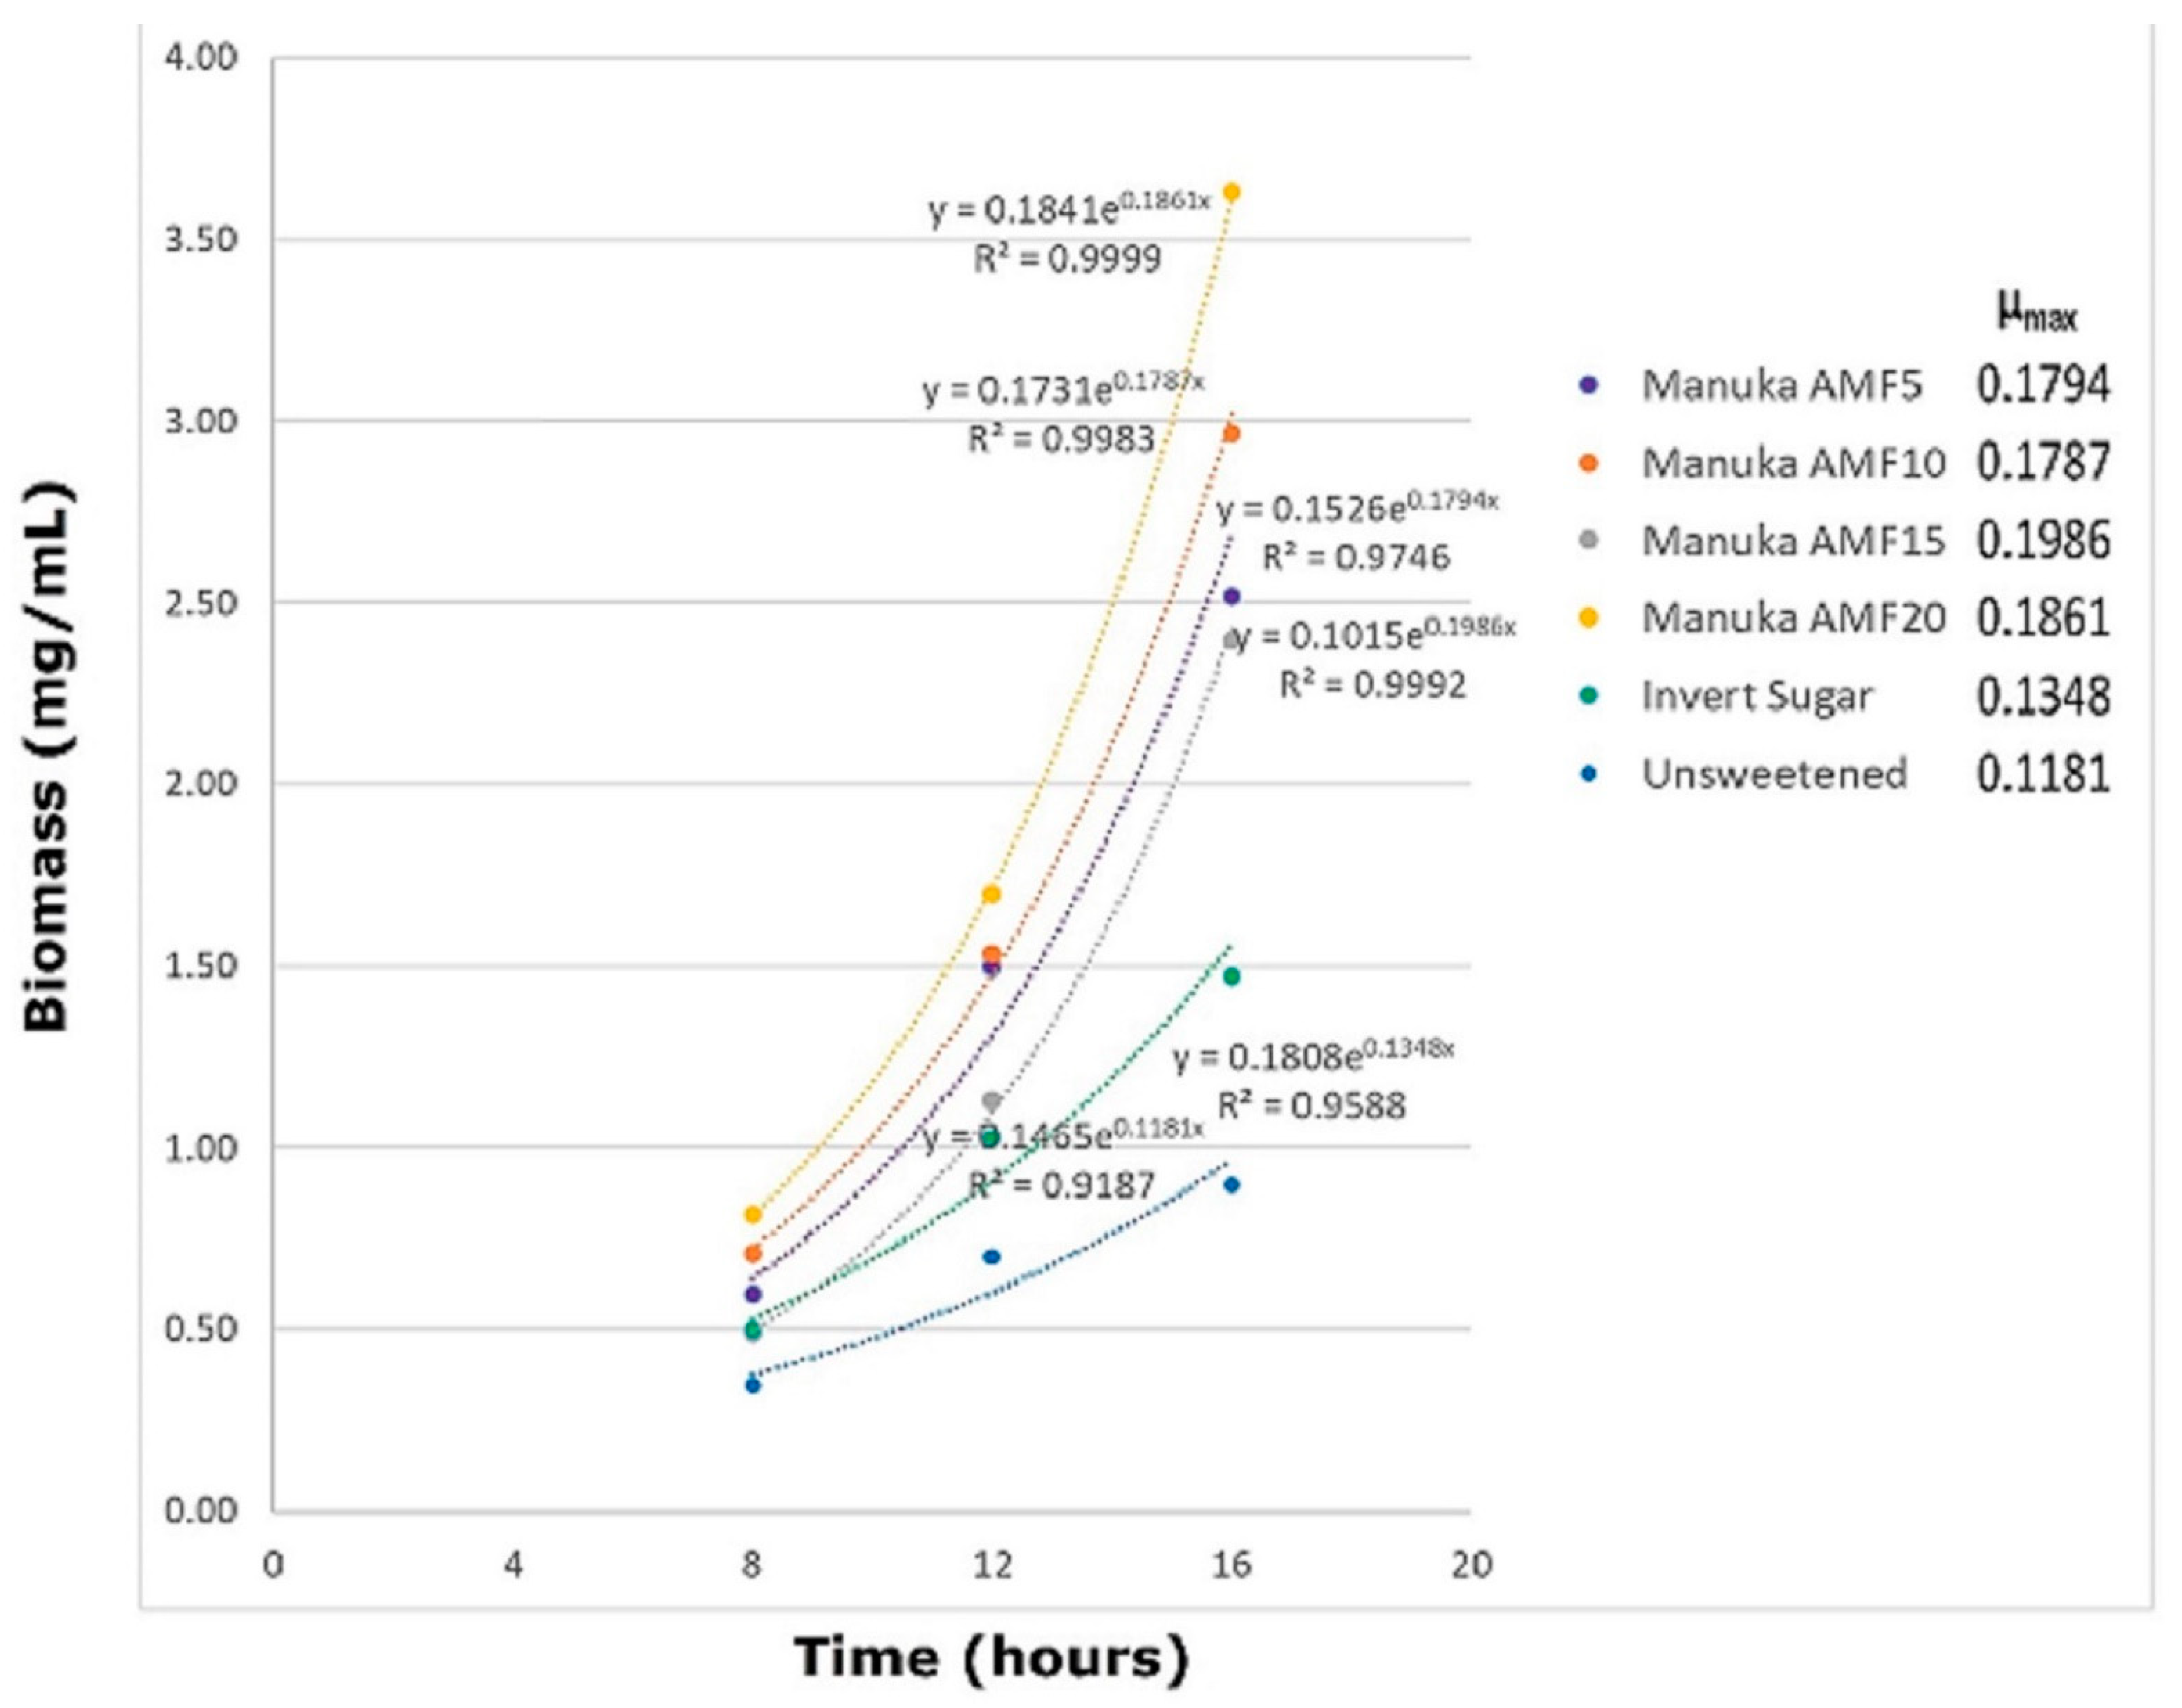
3.1. Substrate Consumption and Biomass Growth

As can be seen in Figure 1, the biomass growth was comparatively limited in the MRS control, which had a sole sugar source (glucose). After 24 h, the biomass increased to 1.33 mg/mL, and further to 2.23 mg/mL after 36 h. A similar trend was observed in the samples with additional carbon sources (IS and AMF). Wherein the biomass was significantly (p < 0.05) higher than in the control sample throughout the fermentation period, and the rate of increase of the biomass was also higher as inferred from the slope of the growth curves and µmax (maximum specific growth rate) (Appendix A Figure A1).
Interestingly, the biomass in all the AMF honey samples was marginally higher than in IS (3.43 mg/mL) after 24 h, but not significantly (p > 0.05) different from each other (AMF 5–20) in all instances. Among the honey samples at the end of the reported fermentation period of 36 h, the biomass was highest in AMF20 at 4.77 mg/mL and lowest in AMF15 at 3.63 mg/mL (p < 0.05). The difference in the biomass in IS (3.43 mg/mL) was not statistically significant (p > 0.05) with AMF15 (3.63 mg/mL) and AMF10 (4.07 mg/mL), but significant (p < 0.05) with AMF5 (4.43 mg/mL) and AMF20 (4.77 mg/mL). Thus, there was no linear pattern observed in the biomass growth depending on the linearly increasing AMF levels. Importantly, this is in broad concurrence with a very recent study on the antibacterial efficacy of varying UMF-grade Manuka honey by Girma et al. [16], which reported no correlation of high UMF (15+) rating with the potency against the pathogens. The researchers had noted that the low UMF (5+) Manuka honey was, within the constraints of the limited sample size in their study, more antibacterially active than the higher grades UMF (10+ and 15+).
The concentration of reducing sugars such as glucose and fructose, which were the major sugar source in all the substrates, since present in Manuka honey and also in invert syrup, steadily decreased with the progress of fermentation until 24 h (Figure 2a). Additional sweetener (2.5% w/v) added at 24 h led to a spike in reducing sugar levels, which receded until the recorded 36 h except in the unsweetened control (Figure 2b). Reducing sugar concentration in IS reduced from 65.6 g/L initially to 23.4 g/L after 24 h and was higher when compared with all the AMF levels of honey (see also Supplementary Figure S8 Online). The total reducing sugar in MRS control decreased from 19.2 g/L initially to 3.38 g/L after 36 h. The higher reducing sugar concentration in IS can be attributed to both the higher levels of the substrate present initially and on account of the comparatively slower increase in the biomass. Furthermore, glucose was reported to be the preferred sugar source for both bifidobacteria and lactobacilli when compared with the alternative fermentable substrates in honey, such as fructose, sucrose, and oligosaccharides [26]. Thus, a change in the concentration of reducing sugars (compared with the other saccharides present), especially when it is not the growth limiting substrate, is a more reliable indicator of the progress of fermentation. The DNS reagent is sensitive to other reducing sugars, such as maltose. However, the minuscule total amount of such reducing sugars, besides glucose and fructose, in honey samples will not affect the conclusions from the study.
A comparable increase in probiotic viable counts of Lactobacillus acidophilus (up to 8.75 log CFU/mL) was reported by de Melo et al. [26] for Brazilian monofloral honey (2–3 % w/v) in MRS broth devoid of glucose. Our previous research with honey in skim milk medium has also revealed significantly (p < 0.01) higher probiotic growth, survival, and activity with UMF 18+ and MGO 550+ grade Manuka honey than with invert syrup or unsweetened control (unpublished data). Additionally, AMF 15+ Manuka honey was reported as a potentially prebiotic combination with L. reuteri DPC16 in a yogurt matrix [17]. Since the premium on Manuka honey increases with the UMF, MGO, or its AMF grade, it is necessary to further study whether the health effects (in vitro and in vivo) also increase with the ratings [16].
It is also important to note that the biomass growth was not adversely affected with a higher dosage (total 7.5% w/v) of antibacterially rated AMF manuka honey. Instead, the exponential growth phase was extended beyond 24 h with the additional substrate. Nutter et al. [27] also reported no growth inhibition on Limosilactobacillus fermentum with Prosopis sp. honey (6.5% w/v) in MRS broth. In the study conducted in 10 mL anaerobic jars, an adverse effect on the LAB growth and titratable acidity was observed at a higher honey concentration of 25% w/v. The bacteriostatic effect was attributed to hydrogen peroxide and phenolic compounds in the Argentinian Prosopis sp. honey, and no intermediate honey concentration was studied. The recent study by Girma et al. [16], also calculated the minimum inhibitory concentration (MIC) of Manuka honey (UMF 5+, 10+ and 15+) against a Gram-positive pathogen (Staphylococcus spp.), which was in the range of 5-15% (w/v) for the different UMFTM grades.

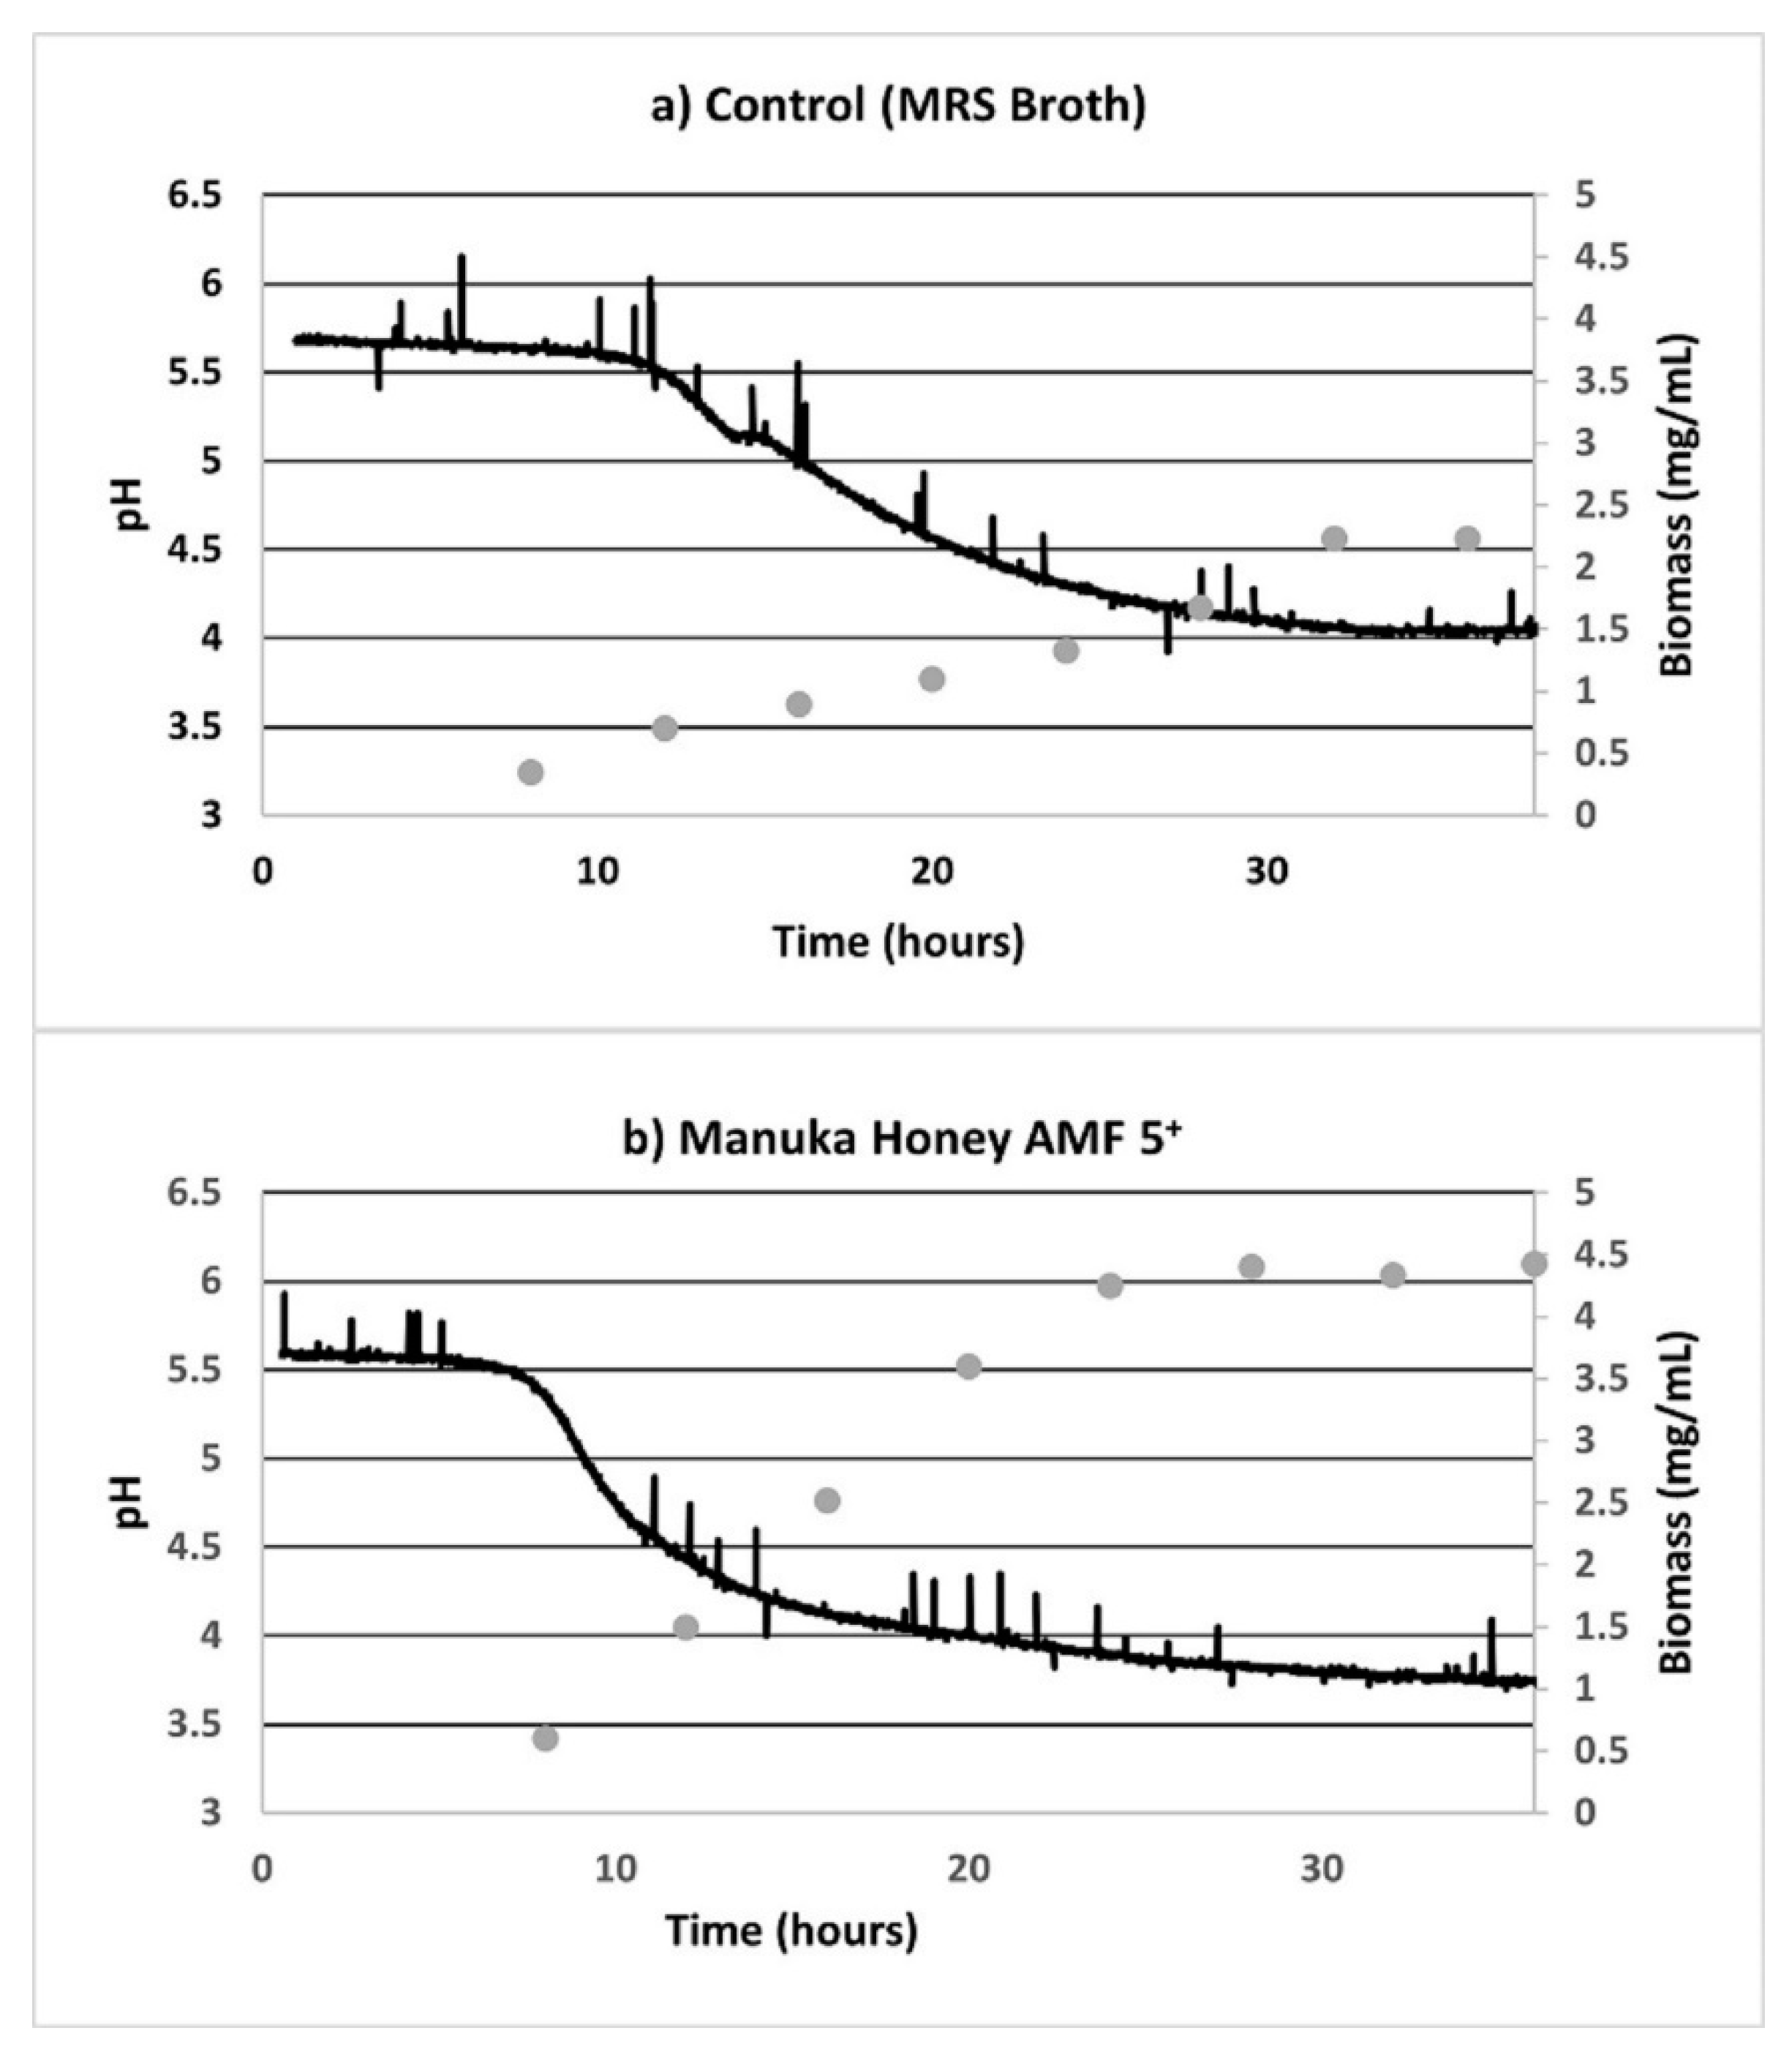
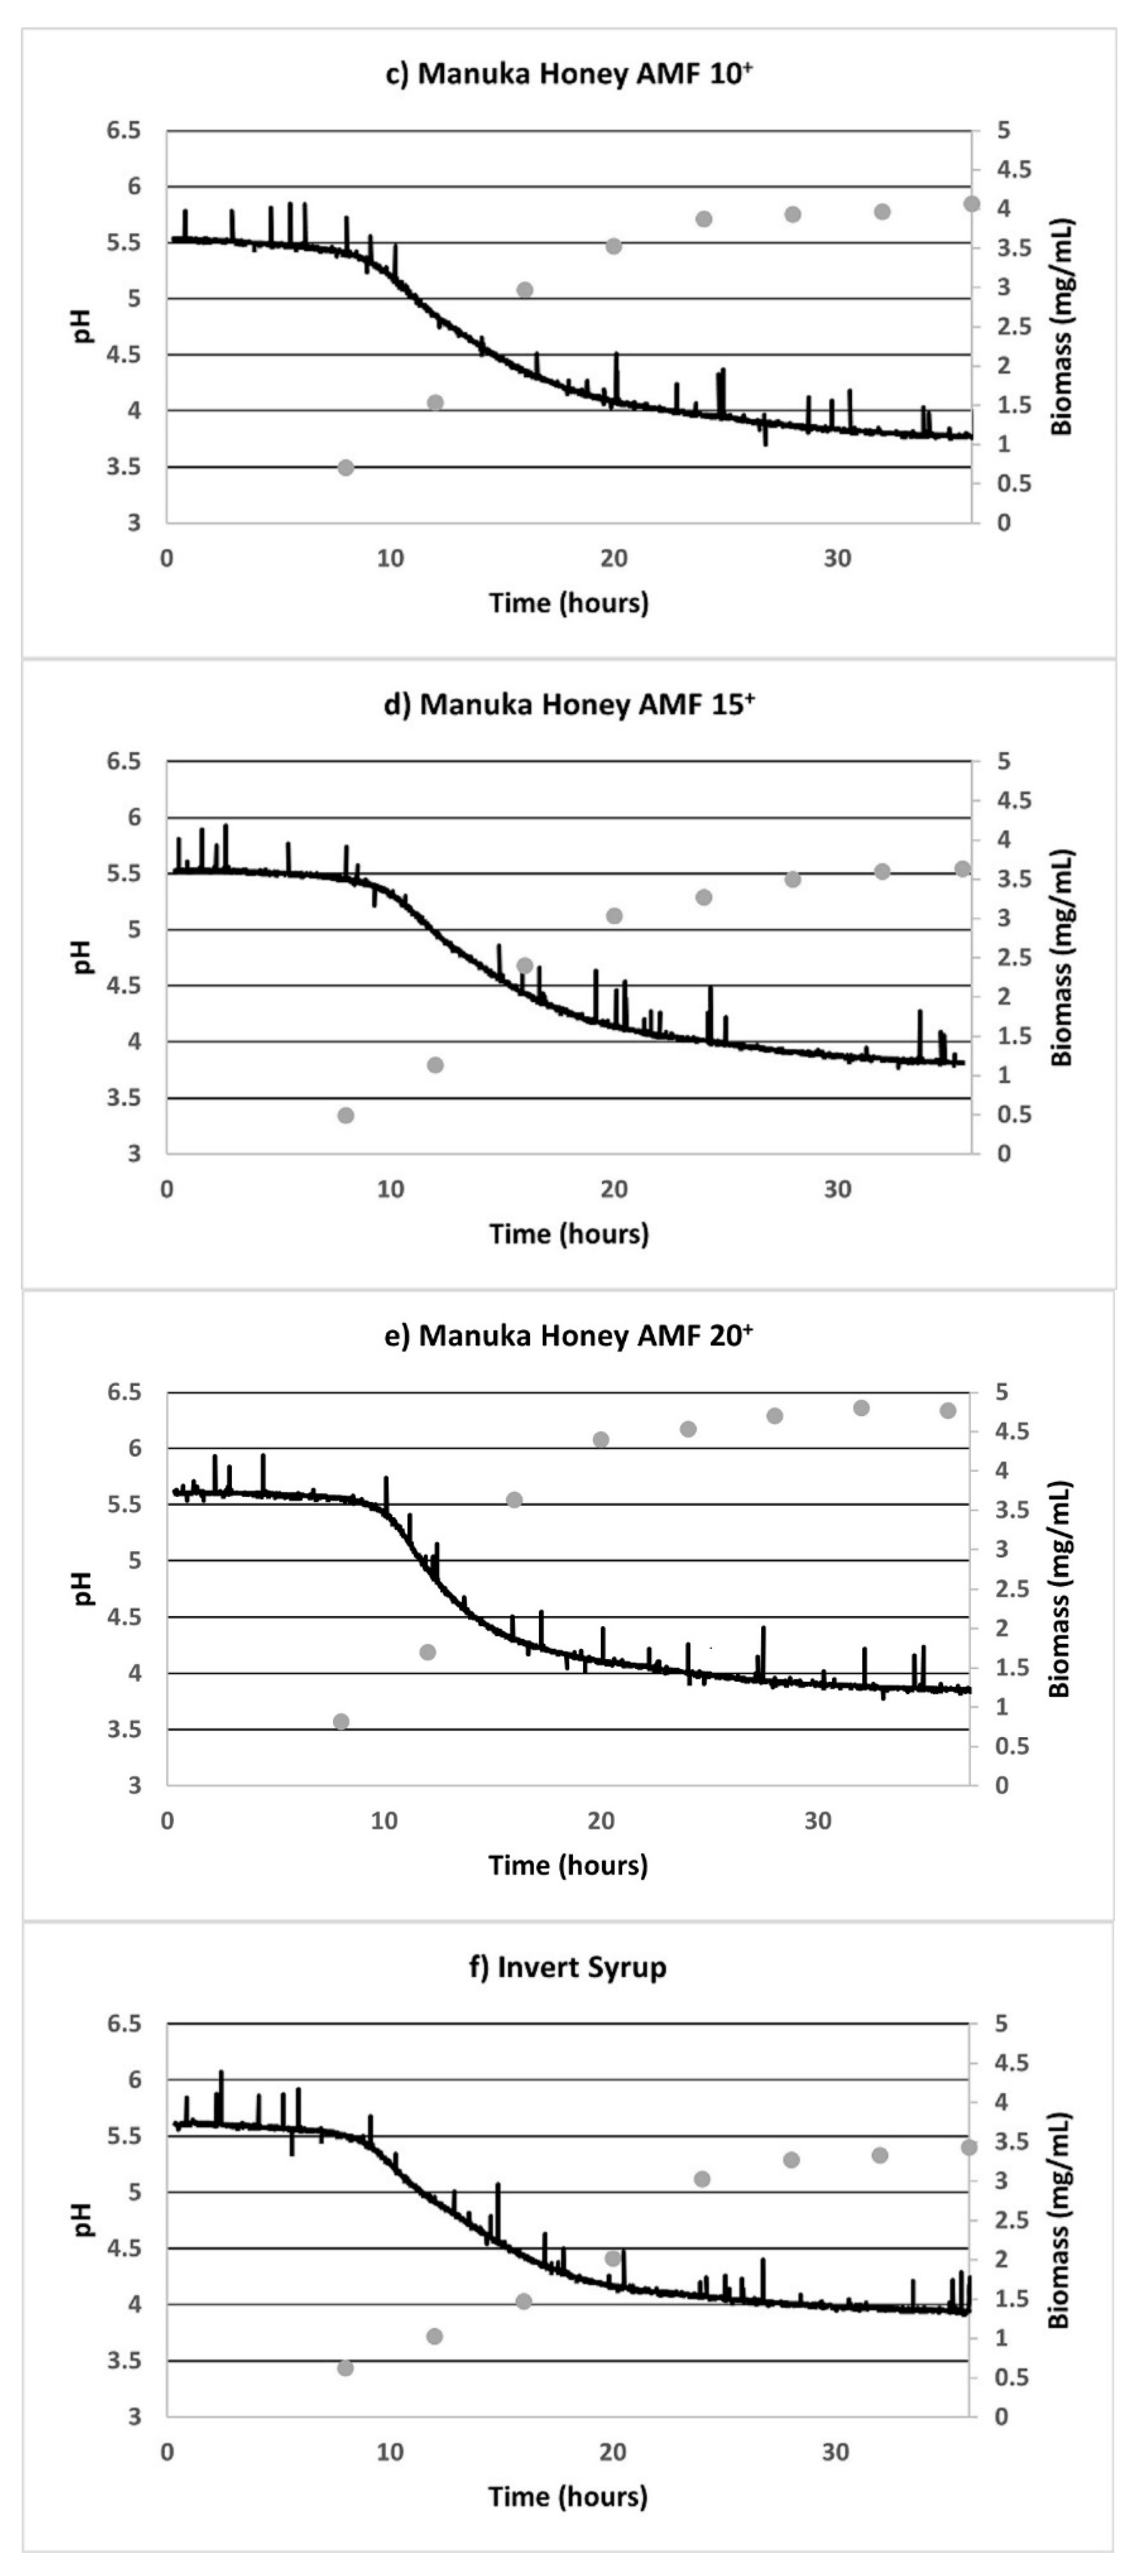
3.2. Fermentation Plots

Online parameters indicated the low DO levels (which were less than 0.5%, when 100% was calibrated as the atmospheric oxygen levels), confirming the anaerobic nature of the fermentation process. Growth curves revealed a lag phase of 12 h, after which the pH values started to decline (Figure 3). The addition of further substrate (2.5% w/v) at 24 h resulted in an increased production of organic acids lowering the pH significantly below 4 (up to the 36th hour) only in cases when AMF Manuka honey was the substrate, but not with IS. Moreover, the biomass growth (as also depicted in Figure 1 and Appendix A Figure A1) depleted in the MRS control sample, since a limited substrate was available for bacterial growth. However, the additional substrate in AMF honey and invert syrup resulted in an extended stationary phase of the biomass growth up to 36 h.
Reducing sugar was not fully consumed at the end of 36 h, even in the MRS control in which no additional sweetener was added (Figure 2). Moreover, the distinctly superior biomass growth in all the AMF samples, compared with the MRS control and IS, is evident in Figure 3 (secondary axis). After 33 h of anaerobic fermentation, the pH values were constant at 4.05 ± 0.02 in the unsweetened sample. Similarly, in the case of the AMF05 sample, which had the highest acidification activity, the pH values did not decrease below 3.77 ± 0.03 after 33 h. For the AMF20 sample, which had the poorest acidification activity among the AMF samples despite the high biomass growth (p > 0.05) among the honey samples, pH values were in the range 3.88 ± 0.03 after 33 h. The pH readings were constant in the aforementioned range (3.74–3.91) for all the AMF samples at the late fermentation stages (after 33 h).
However, it is important to note that the constant pH values did not automatically imply a cessation of bacterial activity and, thus, the organic acid production. The minimal decrease in pH with increasing acidification at the later fermentation stage can be attributed to the buffering action of the high concentrations of the lactic acid metabolite [28]. When the pH of the medium approaches its pKa value (3.85), lactic acid (CH3CH(OH)CO2H) attains equilibrium with the lactate ions (CH3CH(OH)CO2). The lactic acid production in the growth phase thus not only contributed to a rapid decrease in the pH to its pKa value but also increased the buffering capacity of the medium, which then maintained the pH at a more constant level in the later fermentation stages. Furthermore, lactate ions are less inhibitory to the bacterial cells than the non-ionised lactic acid [8,28]. This partly explains why after 24 h, the biomass growth (Figure 1) increased at a higher rate than the pH readings (Figure 3) in all the samples. Bifidobacteria are known to have lower acid tolerance than lactobacilli [29], and the study reaffirms the ability of L. reuteri DPC16 to survive and grow below pH 4.0, which is an important probiotic qualification criterion.

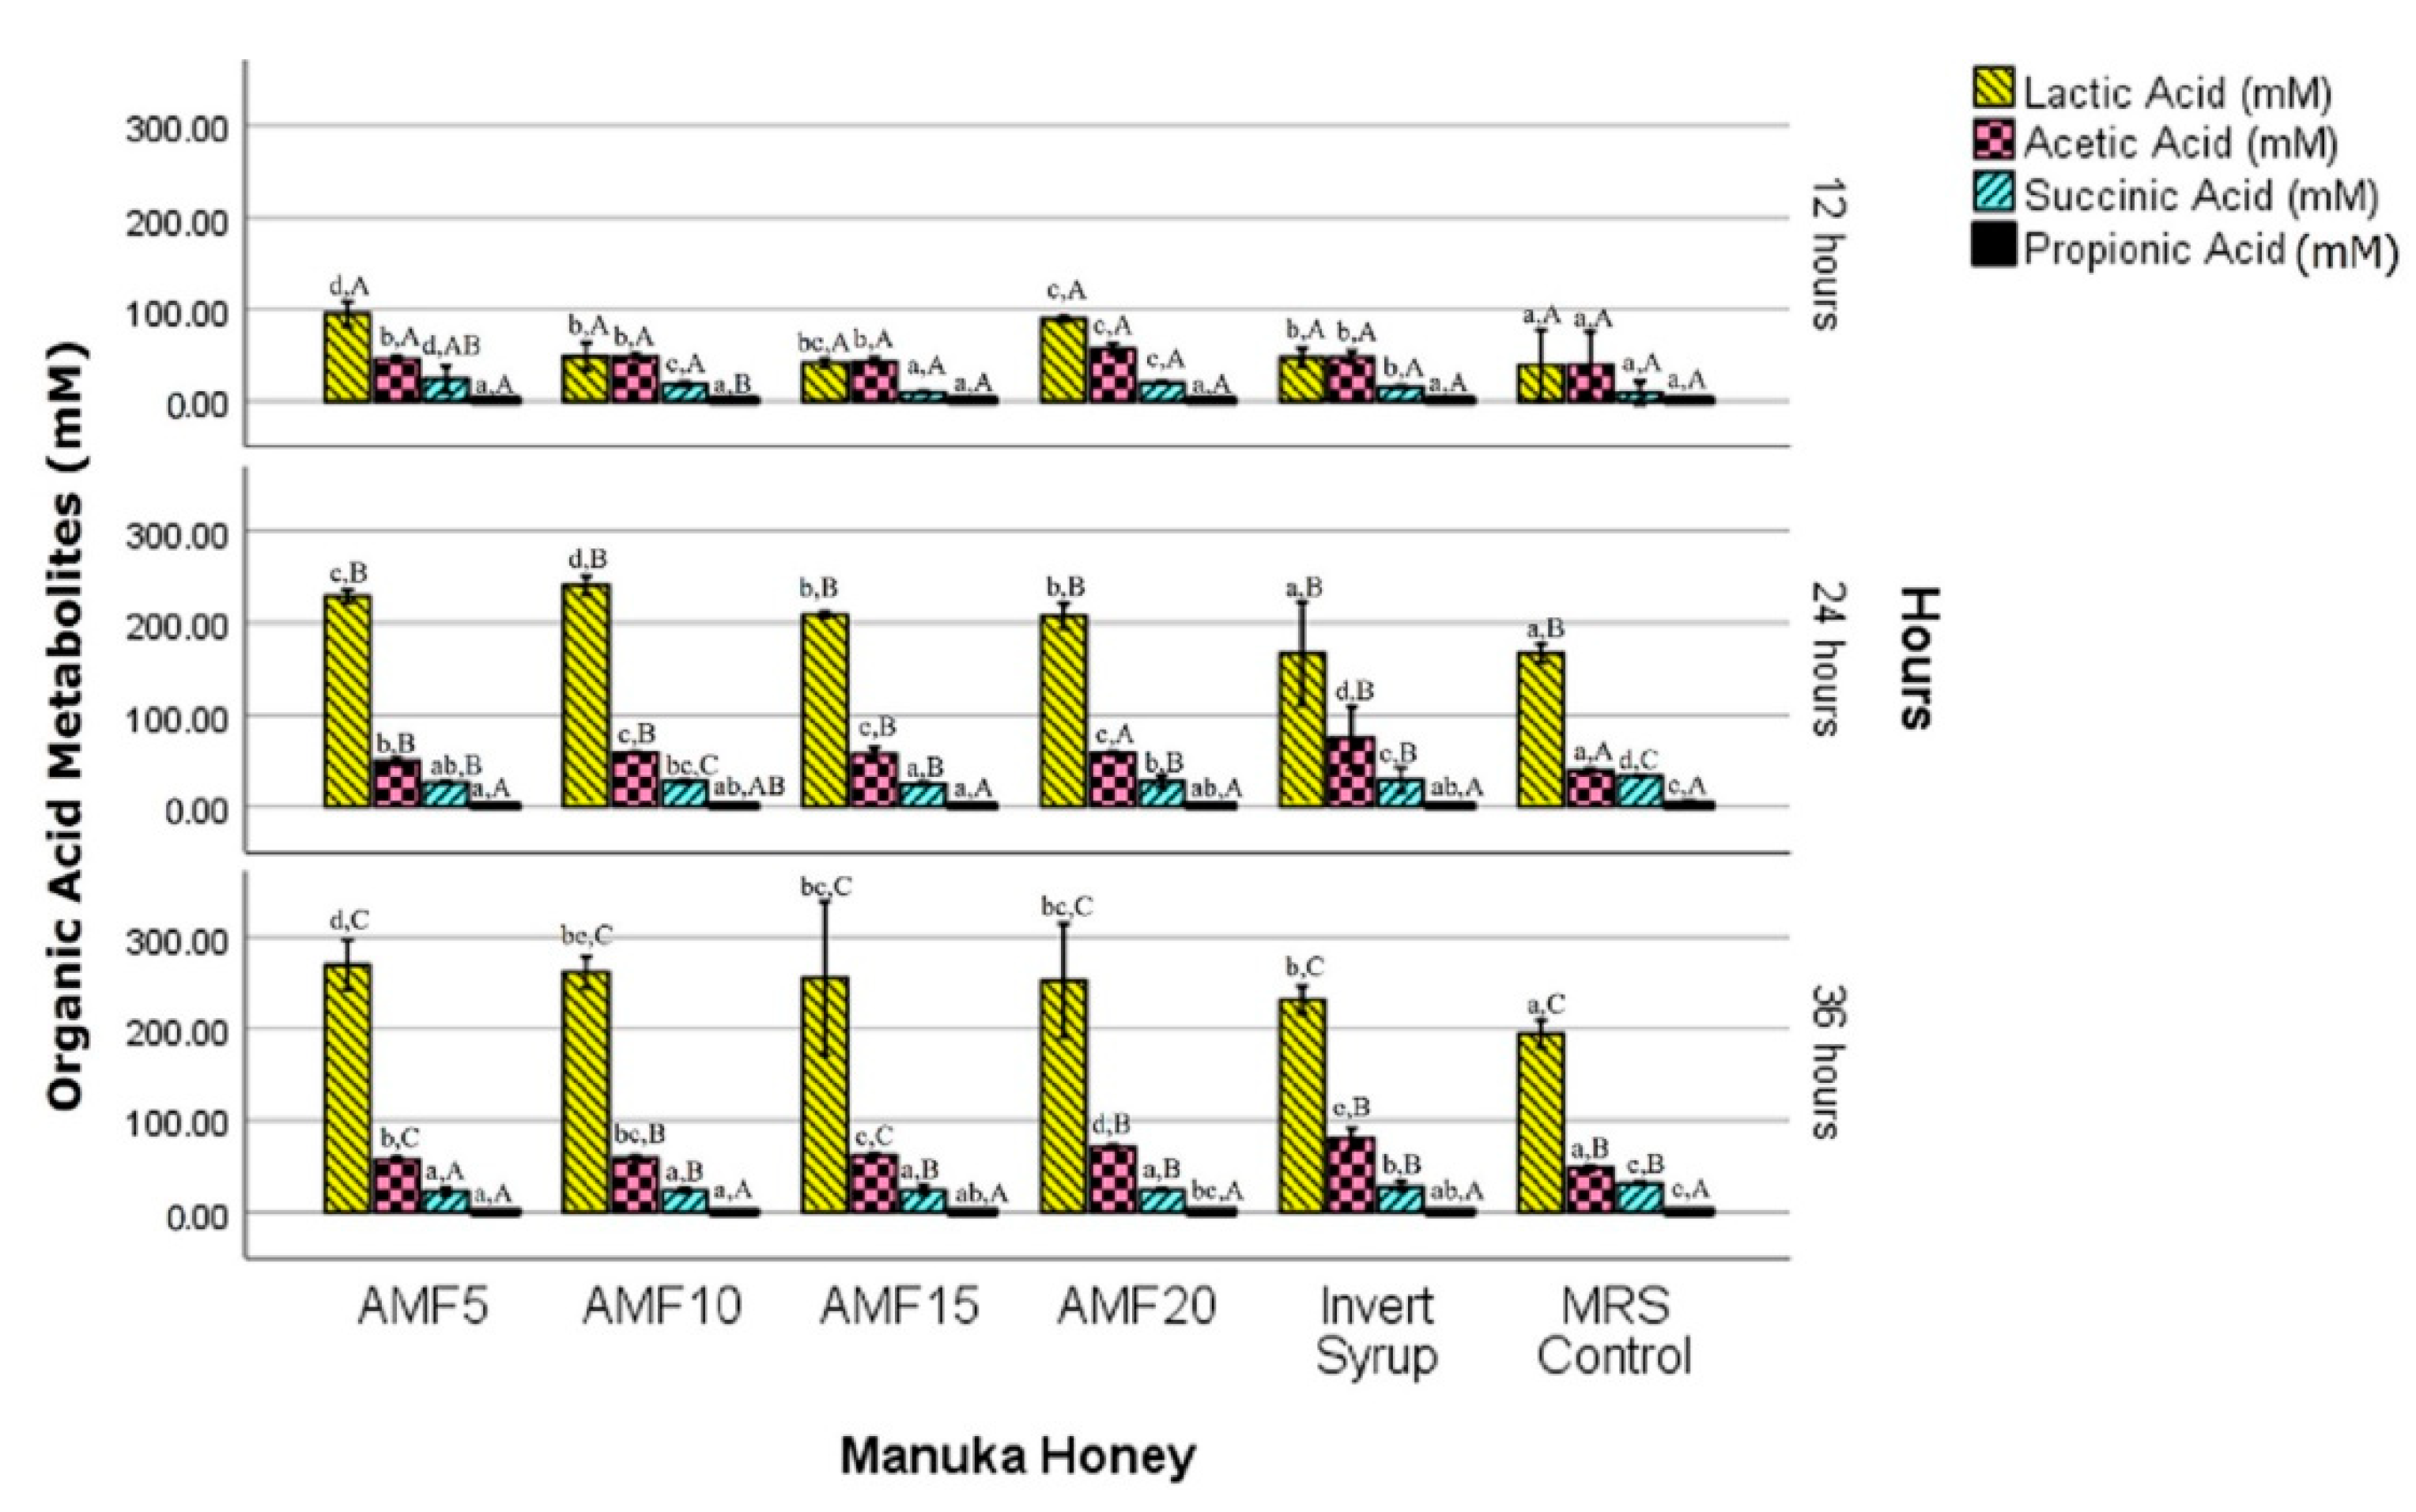
3.3. Beneficial Fermentation Metabolites

Lactobacilli degrade carbohydrates during fermentation, releasing energy in the form of ATP, which is then utilised for organic acid synthesis [28]. Homofermentative LAB ferment the main constituents of honey, fructose, and glucose, to produce mainly lactic and acetic acids [26,27]. The formation of lactic acid as the major metabolite followed by the other SCFA: acetic, succinic, and propionic acids (precisely in that order) was confirmed using NMR quantification (Figure 4). The initial levels of these organic acids in the unfermented MRS broth and the SCFA metabolites (L. reuteri DPC16 fermentation marker) in the pure AMF honey samples [18], were below the limit of quantification of 1H-13C NMR HSQC method (500 µM).
The interaction between the factors (Manuka honey AMF level and fermentation time) was statistically significant (p < 0.01) for all the organic acid metabolites, except propionic acid (p = 0.192). A linearly increasing trend in the concentrations of the major organic acid metabolites (lactic and acetic acids) was observed throughout the entire 36 h period. Succinic acid decreased after 24 h in all the samples, and no clear pattern was observed in the comparatively low quantity of propionic acid that was generated.

3.3.1. Lactic Acid

Lactic acid produced in the AMF honey samples was higher than IS, and the unsweetened controls for the entire 36 h period that was reported in the 12 h intervals, although the differences were not statistically significant in all the instances. This positively correlates with the high biomass growth that was observed in the AMF samples (Figure 1). Interestingly after 36 h, an inverse relation was noted with the lactic acid metabolites released and the AMF levels of Manuka honey. The metabolite level in AMF05 was 269.2 mM, which steadily but non-significantly (p > 0.05) decreased to 252.0 mM in AMF20 (with an increasing AMF level from 5 to 20). The difference in the lactic acid produced with all the AMF samples, and both IS (231.2 mM) and MRS control (194.3 mM) was, nevertheless, statistically significant (p < 0.05). This indicates a more desirable prebiotic potential for the AMF honey samples in promoting the growth of L. reuteri DPC16.
Furthermore, no decrease in the concentration of lactate was observed throughout the fermentation period since there was no possibility of converting lactic acid into other SCFA in the pure culture system, unlike the cross-feeding of other microbes in an in vitro faecal culture system or the in vivo gut environment [30]. In all the samples, the concentrations were significantly (p < 0.05) higher than at the previous level of the fermentation time (12, 24, and 36 h). After 18 h in MRS broth, comparatively high concentrations of lactic acid (400–850 mM), but not acetic acid (25–150 mM), was reported by Zalán et al. [8] for 10 different Lactobacillus strains (not including L. reuteri) under semi-anaerobic fermentation conditions (5% CO2). Moreover in the present study, the decrease in pH was contributed more by lactic acid since not only a higher amount was produced, but also because lactic acid (pKa = 3.86) is a stronger acid compared with acetic acid (pKa = 4.73) [8]. A decrease in the pH value below 4 is critical from a food safety point of view to limit the growth of undesirable microbes. Furthermore, in vivo acidification also has several beneficial effects on the gut, the most important being preventing the pathogens from colonising the large intestine [3,7].

3.3.2. Acetic Acid

After 24 h, a significantly (p < 0.05) higher concentration of acetic acid was produced in IS (73.8 mM), than in AMF (50.3–58.6 mM) or the MRS control (39.4 mM). At the next level of the fermentation time (36 h), the metabolite in IS non-significantly (p > 0.05) increased to 80.3 mM but was nevertheless significantly (p < 0.05) higher than in the AMF (57.2–70.8 mM) and the MRS control (48.1 mM). Acetic acid has an important role in the signalling metabolism of gluconeogenesis and lipogenesis, besides providing energy in the colon [3]. The relative production of lactic acid and acetic acid is dependent on many factors such as the bacterial strain(s), substrate medium, fermentation conditions and stage (time, temperature, pH and oxygen levels) [8,31,32]. Furthermore, bifidobacterial strains are known to produce more acetic acid, whereas lactic acid is the main metabolite of the lactobacilli strains. However, bifidobacteria have also been reported to produce higher amounts of lactate than acetate when the substrate is a simple easily fermentable sugar, while an opposite trend is observed when the energy source is difficult to ferment [29]. Acetic acid production was thus likely affected by the type of carbon source in the present study, with relatively lower amounts generated with Manuka honey, which contains more complex carbohydrates than invert syrup.

3.3.3. Succinic Acid

After 24 h, succinic acid production was significantly (p < 0.05) the highest in MRS control (33.4 mM) among all the samples, which slightly but significantly (p < 0.05) decreased to 31.3 mM after 36 h of fermentation. Interestingly, this trend was observed for the samples with a decrease in concentration (not statistically significant in all the instances) at 36 h from 24.7–29.6 to 22.7–27.8 mM (24 h). The metabolite production can be attributed to the ‘citrate metabolism’, wherein succinic acid is produced to counter the inhibitory effect of lactic acid [28]. Citrate was already present in MRS broth (from ammonium citrate ingredient), and the phenomenon is well documented for the cheese starter culture, Lactococcus lactis. Furthermore, certain species of the gut bacteria, such as Bacteroides ovatus, are reported to increase succinate production with an excess of the carbon source [33], similar to the conditions in the present study.

3.3.4. Propionic Acid

Low amounts of propionic acid were detected in all the samples (910–2594 µM) up to 36 h. The main effect of the Manuka honey AMF level was statistically significant (p = 0.048) but not that of the fermentation time (p = 0.298). Propionate can regulate triglyceride and cholesterol synthesis in the liver, and also contributes to enhanced satiety and gluconeogenesis [3]. The Bacteroides-Prevotella group, commonly prevalent in the gut microbiota, significantly increased the propionic acid levels by the conversion of succinic acid produced during the fermentation of β-glucan [33]. However, this was not observed with L. reuteri DPC16 since the concentration marginally (p > 0.05) decreased after 24 h.

3.3.5. Butyric Acid

Butyric acid is the main energy source for the colonocytes and is increasingly recognised for its role in colon cancer prevention [3,6]. Butyric acid was not produced in any of the AMF, IS, or the MRS control samples, up to 36 h. Previous studies have shown that SCFA production under anaerobic conditions is dependent on the type of sugar substrate available (resistant starch and fructo-oligosaccharides) and the microbiota (Clostridium, Eubacterium, and Fusobacterium sp.) [3,30].

3.4. Honey Sugars Quantification

The sugar and oligosaccharide composition of honey, which is known to be among the most complex in naturally occurring food substances [23], fluctuates depending on its floral origin [14]. The chemical shift of nuclear spin observed in NMR spectroscopy is highly dependent on the chemical structure, and thus the technique is highly amenable for profiling of low-DP isotopic mixtures of honey carbohydrates [23]. However, a high signal overlap is often seen in the 1H proton spectra, since the same monosaccharide units combine to form various oligosaccharides. Nevertheless in the present study, the resolution and sensitivity were improved by employing the 2D HSQC method, which enables the separation of signals in 1H and 13C dimensions [23]. Moreover, there is a transfer of polarisation from 1H to the hetero-nuclei (1H-13C) in HSQC, which further enhances the NMR spectra quality. Similar to the organic acids, the saccharides were identified by overlaying the spectra with the analytical standards under identical settings and also by comparing the chemical shifts with those reported in the literature. Other oligosaccharides qualitatively identified and estimated previously in Manuka honey by Weston and Brocklebank [14] were also quantified in the present study.
The total sugar and oligosaccharide content of AMF20 was significantly (p < 0.05) higher than of all the AMF honeys and invert syrup (Table 1). This was a contributing factor to the significantly higher biomass recorded for AMF20 (Figure 1). No other noticeable difference (p > 0.05) was observed in the fructose (31–36% w/w), glucose (26–31% w/w), or total oligosaccharide (9–11% w/w) content of the pure AMF honey (between groups). Invert syrup, expectedly, had a significantly (p < 0.05) higher amount of sucrose (2.33% w/w) and no other oligosaccharide present. The result for sugars and oligosaccharide composition were in broad agreement with that reported elsewhere in the literature [13,14].
LAB cells are known to gain one extra ATP by utilising fructose as an electron acceptor, which enhances both their growth and metabolic activity [28]. This can thus explain the higher biomass growth (Figure 1) of the heterofermentative L. reuteri DPC16 in the AMF and IS samples (containing fructose) over the unsweetened control, which only had glucose from MRS broth as the sugar source. Compared with IS, the higher probiotic growth-promoting effect of AMF can be attributed to components of honey such as sugars, oligosaccharides, hydrogen peroxide, and certain bioactive phytochemical factors (polyphenols and methylglyoxal) [15,16,26,27]. Although, a limitation of the fermentation experiments, as depicted in Figure 3, was the lack of independent biological replicates. However, the overall fermentation efficacy of AMF Manuka honey was not significantly different from invert syrup. Thus, akin to another potential candidate, β-glucan [33], AMF Manuka honey cannot be considered a standard prebiotic like inulin and oligofructose [1,6], without further research in in vitro faecal (mixed) cultures and in vivo settings.

4. Conclusions

In vitro uncontrolled-pH anaerobic batch fermentation experiments conducted with AMF Manuka honey (5.0 % w/v) as a substrate for probiotic L. reuteri DPC16 reaffirmed the inverse relationship of the bacterial cell biomass with both pH values recorded online and reducing sugar levels depleting with the progress of fermentation during 36 h. After 24 h, the pH values significantly reduced below 4.0 only with the additional AMF substrate (2.5% w/v) but not in the case of IS or MRS control. Significantly higher biomass (p < 0.05) was recorded for AMF20, partly contributed by the high total sugar and oligosaccharides quantified in the honey sample. However, no clear trend was observed in the biomass with a decrease in the AMF level. Nevertheless, the concentration of the major fermentation metabolite, lactic acid, marginally (p > 0.05) decreased (269.3, 261.4, 256.9 and 252.0 mM) with the increasing AMF levels (5, 10, 15, and 20). A potential prebiotic effect correlates with not only the biomass growth but also the SCFA profile (acetate, succinate, propionate, and butyrate) generated by the metabolic activity of the probiotic lactobacilli, which was outlined in the study. To our knowledge, no other in vitro study has reported the effect of different levels of Manuka honey on probiotic growth in a fermenter. Further research is mandated to correlate the UMF, MGO and AMF levels with the prebiotic efficacy and the antibacterial action of Manuka honey, both under in vitro and in vivo experimental conditions.

Supplementary Materials

The following are available online at https://0-www-mdpi-com.brum.beds.ac.uk/article/10.3390/fermentation7030128/s1, Figure S1: NMR assignment of a mixture of short-chain fatty acid (SCFA) analytical standards used for quantification, Figure S2. Asignment of short-chain fatty acid (SCFA) standards in fermented MRS cell-free broth (supernatant), Figure S3. Integral region of lactic acid analytical standard in NMR spectra at different concentrations of 3.125 mM (blue) and 100 mM (red), Figure S4. Standard curves of (a) lactic acid (b) acetic acid for NMR quantification, Figure S5. Typical NMR spectra of fructose standard (green), Manuka honey (red) and invert syrup (blue) samples, Figure S6. Assignment of the NMR spectra of analytical standards of (a) fructose, (b) glucose, (c) sucrose, and (d) gentiobiose at different concentrations, Figure S7. Assignment of the NMR spectra of analytical standards of (a) kojibiose, (b) maltose, (c) turanose, (d) nigerose, (e) D-panose, Figure S8. Correlation between the reducing sugar content in invert syrup samples during the 24 h fermentation in Figure 2a as quantified by DNS method and NMR.

Author Contributions

Conceptualisation, A.M.; data curation, A.M. and T.M.; formal analysis, A.M. and T.M.; funding acquisition, A.M., N.G.-M., Y.G., Q.S. and S.Y.Q.; investigation, A.M. and T.M.; methodology, A.M., N.G.-M. and N.H.; project administration, N.H. and S.Y.Q.; resources, N.H., Y.G., Q.S. and S.Y.Q.; supervision, N.H., Q.S. and S.Y.Q.; validation, N.G.-M. and S.Y.Q.; visualisation, A.M. and N.H.; writing—original draft, A.M.; writing—review and editing, N.G.-M., T.M. and S.Y.Q. All authors have read and agreed to the published version of the manuscript.

Funding

Doctoral research of Anand Mohan was supported by the R&D Fellowship Grant (DPAC1601/PROP-51763-FELLOW-DRAPACNZ) from Callaghan Innovation, New Zealand.

Institutional Review Board Statement

The study did not involve any human subjects and animal experiments.

Informed Consent Statement

The study did not involve any human subjects.

Data Availability Statement

The data that support the outcomes of the study (in addition to that already provided in the Figures, Table, Appendix and Supplementary Materials) are available on request from the corresponding author.

Acknowledgments

The contribution of Huipeng Liu at Xiamen University, China, in setting up the fermentation experiments is duly acknowledged. The first author (AM) acknowledges the travel grant from New Zealand-China Food Protection Network (NZCFPN) for conducting the collaborative research.

Conflicts of Interest

The authors declare no conflict of interest. The funders had no role in the conceptualisation and conduct of the study, data analysis, or in the decision to publish the results. All honey samples were commercially purchased. The probiotic strain (L. reuteri DPC16) and AMF (DrKiwi) honey are also researched by Bioactives Research New Zealand Ltd. (Q.S. and Y.G.) for Drapac NZ.

Appendix A

Figure A1. Fermentation kinetics for biomass (mg/mL) of L. reuteri DPC16 in fermented MRS broth with Manuka honey (AMFTM 5+, 10+, 15+ and 20+), invert syrup and unsweetened control during the exponential growth period (8–16 h). µmax denotes the ‘maximum specific growth rate’ for each sample.
Fermentation 07 00128 g0a1

References

  1. Gibson, G.R.; Hutkins, R.; Sanders, M.E.; Prescott, S.L.; Reimer, R.A.; Salminen, S.J.; Scott, K.; Stanton, C.; Swanson, K.S.; Cani, P.D.; et al. Expert consensus document: The International Scientific Association for Probiotics and Prebiotics (ISAPP) consensus statement on the definition and scope of prebiotics. Nat. Rev. Gastroenterol. Hepatol. 2017, 14, 491–502. [Google Scholar] [CrossRef] [PubMed] [Green Version]
  2. Gibson, G.R.; Roberfroid, M.B. Dietary modulation of the human colonic microbiota: Introducing the concept of prebiotics. J. Nutr. 1995, 125, 1401–1412. [Google Scholar] [CrossRef] [PubMed]
  3. Wang, M.; Wichienchot, S.; He, X.; Fu, X.; Huang, Q.; Zhang, B. In Vitro colonic fermentation of dietary fibers: Fermentation rate, short-chain fatty acid production and changes in microbiota. Trends Food Sci. Technol. 2019, 88, 1–9. [Google Scholar] [CrossRef]
  4. Asarat, M.; Vasiljevic, T.; Ravikumar, M.; Apostolopoulos, V.; Donkor, O. Extraction and Purification of Short-chain Fatty Acids from Fermented Reconstituted Skim Milk Supplemented with Inulin. Food Anal. Methods. 2016, 9, 3069–3079. [Google Scholar] [CrossRef]
  5. Wong, J.M.W.; De Souza, R.; Kendall, C.W.C.; Emam, A.; Jenkins, D.J.A. Colonic health: Fermentation and short chain fatty acids. J. Clin. Gastroenterol. 2006, 40, 235–243. [Google Scholar] [CrossRef] [PubMed]
  6. Wang, X.; Gibson, G.R. Effects of the In Vitro fermentation of oligofructose and inulin by bacteria growing in the human large intestine. J. Appl. Bacteriol. 1993, 75, 373–380. [Google Scholar] [CrossRef]
  7. Shamala, T.R.; Shri Jyothi, Y.; Saibaba, P. Stimulatory effect of honey on multiplication of lactic acid bacteria under in vitro and in vivo conditions. Lett. Appl. Microbiol. 2000, 30, 453–455. [Google Scholar] [CrossRef] [PubMed] [Green Version]
  8. Zalán, Z.; Hudáček, J.; Štětina, J.; Chumchalová, J.; Halász, A. Production of organic acids by Lactobacillus strains in three different media. Eur. Food Res. Technol. 2010, 230, 395–404. [Google Scholar] [CrossRef]
  9. Zheng, J.; Wittouck, S.; Salvetti, E.; Franz, C.M.; Harris, H.M.; Mattarelli, P.; O’Toole, P.W.; Pot, B.; Vandamme, P.; Walter, J. A taxonomic note on the genus Lactobacillus: Description of 23 novel genera, emended description of the genus Lactobacillus Beijerinck 1901, and union of Lactobacillaceae and Leuconostocaceae. Int. J. Syst. Evol. Microbiol. 2020, 70, 2782–2858. [Google Scholar] [CrossRef]
  10. Bian, L.; Molan, A.L.; Maddox, I.; Shu, Q. Antimicrobial activity of Lactobacillus reuteri DPC16 supernatants against selected food borne pathogens. World J. Microbiol. Biotechnol. 2011, 27, 991–998. [Google Scholar] [CrossRef]
  11. Jan Mei, S.; Mohd Nordin, M.S.; Norrakiah, A.S. Fructooligosaccharides in honey and effects of honey on growth of Bifidobacterium longum BB 536. Int. Food Res. J. 2010, 17, 557–561. [Google Scholar]
  12. Mohan, A.; Quek, S.Y.; Gutierrez-Maddox, N.; Gao, Y.; Shu, Q. Effect of honey in improving the gut microbial balance. Food Qual. Saf. 2017, 1, 107–115. [Google Scholar] [CrossRef]
  13. Sanz, M.L.; Polemis, N.; Morales, V.; Corzo, N.; Drakoularakou, A.; Gibson, G.R.; Rastall, R.A. In Vitro investigation into the potential prebiotic activity of honey oligosaccharides. J. Agric. Food Chem. 2005, 53, 2914–2921. [Google Scholar] [CrossRef]
  14. Weston, R.J.; Brocklebank, L.K. The oligosaccharide composition of some New Zealand honeys. Food Chem. 1999, 64, 33–37. [Google Scholar] [CrossRef]
  15. Molan, P.C.; Russell, K.M. Non-peroxide antibacterial activity in some New Zealand honeys. J. Apic. Res. 1988, 27, 62–67. [Google Scholar] [CrossRef]
  16. Girma, A.; Seo, W.; SheI, R.C. Antibacterial activity of varying UMF-graded Manuka honeys. PLoS ONE 2019, 14, e0224495. [Google Scholar] [CrossRef] [Green Version]
  17. Mohan, A.; Hadi, J.; Gutierrez-Maddox, N.; Li, Y.; Leung, I.K.H.; Gao, Y.; Shu, Q.; Quek, S. Sensory, Microbiological and Physicochemical Characterisation of Functional Manuka Honey Yogurts Containing Probiotic Lactobacillus reuteri DPC16. Foods 2020, 9, 106. [Google Scholar] [CrossRef] [PubMed] [Green Version]
  18. Drapac Drapac DrKiwi AMF Grading System. Available online: http://www.drapac.co.nz/News/Cover?categoryid=37 (accessed on 3 January 2020).
  19. Cai, J.; Zhang, J.; Tian, Y.; Zhang, L.; Hatzakis, E.; Krausz, K.W.; Smith, P.B.; Gonzalez, F.J.; Patterson, A.D. Orthogonal Comparison of GC-MS and 1H NMR Spectroscopy for Short Chain Fatty Acid Quantitation. Anal. Chem. 2017, 89, 7900–7906. [Google Scholar] [CrossRef] [PubMed]
  20. Hu, F.; Furihata, K.; Ito-Ishida, M.; Kaminogawa, S.; Tanokura, M. Nondestructive observation of bovine milk by NMR spectroscopy: Analysis of existing states of compounds and detection of new compounds. J. Agric. Food Chem. 2004, 52, 4969–4974. [Google Scholar] [CrossRef]
  21. Schievano, E.; Tonoli, M.; Rastrelli, F. NMR Quantification of Carbohydrates in Complex Mixtures. A Challenge on Honey. Anal. Chem. 2017, 89, 13405–13414. [Google Scholar] [CrossRef] [PubMed]
  22. Hu, F.; Furihata, K.; Kato, Y.; Tanokura, M. Nondestructive quantification of organic compounds in whole milk without pretreatment by two-dimensional NMR spectroscopy. J. Agric. Food Chem. 2007, 55, 4307–4311. [Google Scholar] [CrossRef] [PubMed]
  23. Petersen, B.O.; Hindsgaul, O.; Meier, S. Profiling of carbohydrate mixtures at unprecedented resolution using high-precision 1H-13C chemical shift measurements and a reference library. Analyst 2013, 139, 401–406. [Google Scholar] [CrossRef]
  24. Miller, G.L. Use of Dinitrosalicylic Acid Reagent for Determination of Reducing Sugar. Anal. Chem. 1959, 31, 426–428. [Google Scholar] [CrossRef]
  25. Wu, P.S.C.; Otting, G. Rapid pulse length determination in high-resolution NMR. J. Magn. Reson. 2005, 176, 115–119. [Google Scholar] [CrossRef] [PubMed]
  26. De Melo, F.H.C.; Menezes, F.N.D.D.; de Sousa, J.M.B.; dos Santos Lima, M.; da Silva Campelo Borges, G.; de Souza, E.L.; Magnani, M. Prebiotic activity of monofloral honeys produced by stingless bees in the semi-arid region of Brazilian Northeastern toward Lactobacillus acidophilus LA-05 and Bifidobacterium lactis BB-12. Food Res. Int. 2020, 128, 108809. [Google Scholar] [CrossRef] [PubMed]
  27. Nutter, J.; Fritz, R.; Iurlina, M.O.; Saiz, A.I. Effect of Prosopis sp. honey on the growth and fermentative ability of Pediococcus pentosaceus and Lactobacillus fermentum. LWT Food Sci. Technol. 2016, 70, 309–314. [Google Scholar] [CrossRef]
  28. Nsogning, S.D.; Fischer, S.; Becker, T. Investigating on the fermentation behavior of six lactic acid bacteria strains in barley malt wort reveals limitation in key amino acids and buffer capacity. Food Microbiol. 2018, 73, 245–253. [Google Scholar] [CrossRef] [PubMed]
  29. Valdés-Varela, L.; Ruas-Madiedo, P.; Gueimonde, M. In Vitro fermentation of different fructo-oligosaccharides by Bifidobacterium strains for the selection of synbiotic combinations. Int. J. Food Microbiol. 2017, 242, 19–23. [Google Scholar] [CrossRef]
  30. Bourriaud, C.; Robins, R.J.; Martin, L.; Kozlowski, F.; Tenailleau, E.; Cherbut, C.; Michel, C. Lactate is mainly fermented to butyrate by human intestinal microfloras but inter-individual variation is evident. J. Appl. Microbiol. 2005, 99, 201–212. [Google Scholar] [CrossRef]
  31. Bujna, E.; Farkas, N.A.; Tran, A.M.; Dam, M.S.; Nguyen, Q.D. Lactic acid fermentation of apricot juice by mono- and mixed cultures of probiotic Lactobacillus and Bifidobacterium strains. Food Sci. Biotechnol. 2018, 27, 547–554. [Google Scholar] [CrossRef] [PubMed]
  32. Srinivas, D.; Mital, B.K.; Garg, S.K. Utilization of sugars by Lactobacillus acidophilus strains. Int. J. Food Microbiol. 1990, 10, 51–57. [Google Scholar] [CrossRef]
  33. Hughes, S.A.; Shewry, P.R.; Gibson, G.R.; McCleary, B.V.; Rastall, R.A. In Vitro fermentation of oat and barley derived β-glucans by human faecal microbiota. FEMS Microbiol. Ecol. 2008, 64, 482–493. [Google Scholar] [CrossRef] [PubMed] [Green Version]
Figure 1. Biomass (mg/mL) of L. reuteri DPC16 in fermented MRS broth with Manuka honey (AMFTM 5+, 10+, 15+ and 20+), invert syrup and unsweetened control during the fermentation period (12, 24 and 36 h). Error bars represent the standard error of mean (SEM).
Fermentation 07 00128 g001
Figure 2. Reducing sugars concentration (g/L) in fermented MRS broth with Manuka honey (AMFTM 5+, 10+, 15+ and 20+), invert syrup and unsweetened control during the fermentation period (a) up to 24 h and (b) 24–36 h. Error bars represent the standard error of mean (SEM).
Fermentation 07 00128 g002
Figure 3. Online pH fermenter curves for L. reuteri DPC16 in fermented MRS broth with (a) unsweetened control, (be) AMFTM 5+, 10+, 15+ and 20+ Manuka honey, respectively, and (f) invert syrup as the substrate. Average biomass (mg/mL) is shown in the secondary axis (). The spikes in pH values were as seen in the anaerobic fermentation set-ups in our laboratory.
Fermentation 07 00128 g003aFermentation 07 00128 g003b
Figure 4. Concentration (mM) of organic acid metabolites in MRS broth with Manuka honey (AMFTM 5+, 10+, 15+ and 20+), invert syrup and unsweetened control during the fermentation period (12, 24 and 36 h). Error bars represent 95% confidence intervals (CI). Different lowercase letters denote significant differences (p < 0.05) among the samples in a row (for that particular organic acid). Different uppercase letters denote significant differences (p < 0.05) among the fermentation periods in a column (for that particular sample).
Fermentation 07 00128 g004
Table 1. Concentrations (% w/w) of mono-, di- and oligo-saccharides (mean ± standard error of mean) in Manuka honey and invert syrup.
Invert
Syrup
Manuka
AMF 5+
Manuka
AMF 10+
Manuka
AMF 15+
Manuka
AMF 20+
Fructose35.55 ± 0.67 b31.66 ± 0.74 a32.73 ± 0.68 a32.2 ± 0.51 a34.86 ± 0.48 b
Glucose27.05 ± 1.05 a25.94 ± 0.88 a26.84 ± 0.71 a26.38 ± 0.52 a30.79 ± 0.59 b
Sucrose2.33 ± 0.11 b1.45 ± 0.01 a1.5 ± 0.01 a1.47 ± 0.01 a1.43 ± 0.03 a
Maltosen.d.2.48 ± 0.61 a2.65 ± 0.73 a2.52 ± 0.41 a2.35 ± 0.39 a
Nigerosen.d.2.87 ± 0.54 a2.45 ± 0.64 a2.53 ± 0.28 a2.43 ± 0.15 a
Kojibiosen.d.1.44 ± 0.21 a1.57 ± 0.14 a1.74 ± 0.22 a1.57 ± 0.04 a
Panosen.d.1.29 ± 0.36 a1.41 ± 0.72 a1.39 ± 0.59 a1.66 ± 0.81 a
Total Di- and
Oligosaccharides
2.33 ± 0.119.59 ± 2.759.88 ± 2.859.75 ± 2.7910.73 ± 3.14
Different superscripts in rows indicate significant differences (p < 0.05). n.d.: not detected.
Publisher’s Note: MDPI stays neutral with regard to jurisdictional claims in published maps and institutional affiliations.

