Article

Towards a Biorefinery Processing Waste from Plantain Agro-Industry: Process Design and Techno-Economic Assessment of Single-Cell Protein, Natural Fibers, and Biomethane Production through Process Simulation

by
James A. Gómez
1,2,
Luis G. Matallana
3 and
Óscar J. Sánchez
3,*
1
Research Group on Food and Agro—Industry, Faculty of Engineering, Universidad de Caldas, Calle 65 No. 26-10, Manizales 170004, Colombia
2
CEB—Centre of Biological Engineering, University of Minho, Campus de Gualtar, 4710-057 Braga, Portugal
3
CTD—Bioprocess and Agro-Industry Plant, Department of Engineering, Universidad de Caldas, Calle 65 No. 26-10, Manizales 170004, Colombia
*
Author to whom correspondence should be addressed.
Submission received: 4 October 2022 / Revised: 21 October 2022 / Accepted: 21 October 2022 / Published: 27 October 2022

Abstract

:
The plantain agro-industry generates different residues in the harvest and post-harvest stages. Therefore, the design of processes for valorization is required. The aim of this work was to design and techno-economically evaluate the processes for the production of single-cell protein, natural fibers, and biomethane from plantain residues by process simulation in the framework of the design of a future biorefinery for valorization of these residues. The processes were simulated using SuperPro Designer. The scale size was calculated at 1,267,071 tons for the processing of plantain lignocellulosic waste (pseudostems) and 3179 tons for the processing of starchy waste (rejected unripe plantain fruits). The results obtained suggest that the best alternative for the valorization of plantain residues corresponded to the production of natural fibers, with a net present value of $29,299,000. This work shows that waste from the plantain agro-industry exhibits high potential as a feedstock for the production of value-added products. In addition, the process flowsheets simulated in this work can be integrated into the basic design of a biorefinery processing plantain waste.

Graphical Abstract

1. Introduction

The global production of residues is increasing; therefore, it is necessary to design new processes or improve existing ones for valorization [1]. The global production of agricultural waste estimated from data reported by FAO [2] was 386,135 million tons in 2019. In Colombia, the generation of agricultural waste from the most representative crops (rice, beans, and corn, among others) was calculated at about 540 million tons [2]. The wastes of plantain cropping were calculated at about 25 million tons [2,3].
During the cropping, harvesting, and post-harvesting of plantain, only 20% to 30% of the plant is used [4]. The remaining biomass, such as pseudostems, rachis, and rejected unripe plantain fruits (RUPFs, fruits that do not meet the quality standards in the harvest and post-harvest stages), is left on the parcels or is disposed of as municipal solid waste [5,6]. In Colombia, a middle-income member country of the OECD, the Dominico-Hartón plantain (Musa AAB Simmonds) is one of the most cultivated varieties for human consumption [7].
The main components of plantain waste are cellulose, hemicellulose, and starch [8]. These compounds can be recovered through physical, thermochemical, chemical, and biological processes in the context of a biorefinery to obtain fermentable sugars and other products [5]. Biorefineries are sustainable production systems that recover a considerable amount of carbon from the biomass in a broad and innovative portfolio of marketable products, such as food, feed, biofuel, and energy, among others [9]. In this regard, the production of single-cell protein (SCP), natural fibers (NFs), and biomethane (BM) represents options for valorization of the waste from the plantain agro-industry in a profitable way.
SCP refers to dried microbial cells from bacteria, yeast, fungi, or algae, which serves as feed or food supplements grown in large-scale fermentation systems for use as protein sources in human food or animal feed [10]. On the other hand, NFs can be classified into animal, plant, and mineral fibers. Fibers obtained from animal hairs or secreted by animals are known as animal fibers (protein-based); wool and silk fibers are the main examples of animal fibers. Plant fibers are obtained from different plants and their main component is cellulose; flax, hemp, jute, ramie, and kenaf are examples of plant fibers. Mineral fibers are inorganic fibers that are produced naturally, such as asbestos, fibrous brucite, and wollastonite [11,12]. Biogas is a product of anaerobic digestion, where microorganisms break down organic materials in the absence of oxygen. Biogas mainly consists of methane, carbon dioxide, and low amounts of water vapor, hydrogen sulfide, and other trace gases [13]. When CO2, H2O, H2S, and other gases are removed from biogas, it is considered biomethane. All these processes require feedstocks with a high content of fermentable sugars (or polysaccharides that can be hydrolyzed into sugars) or polymers organized into fibers. Plantain residue can provide this type of compound, considering its high contents of lignocellulosic materials.
Different studies have been conducted that aimed to valorize plantain residues. Plantain fruits, peels [14,15], banana peels, and ripe bananas have been used to obtain SCP [16,17]. The production and use of NFs from the pseudostems and rachis of plantain plants to reinforce materials have been studied [18,19], and BM production from plantain peels has been reported [20,21,22]. Likewise, whole unripe plantain fruits and pseudostems from Musa paradisiaca L. were proposed as feedstocks for bioethanol production [23]. Different works have reported the use of Musaceae waste and other residues to produce silage [24,25,26] and nutrient blocks [27,28,29,30,31] for animal feed. Nevertheless, to our knowledge, the design and techno-economic analysis of independent processes for producing SCP, NFs, and BM from Dominico-Hartón plantain waste using process simulation techniques have never been studied.
The use of computer-aided process design tools can allow the exploration of multiple alternatives for the conversion of plantain waste into SCP, NFs, and BM. Likewise, the determination of the best viable option for each one of these processes via simulation has the potential to support future research efforts to improve and develop this type of valorization technology.
Simulation-based techno-economic assessment supports decision-makers in their selection of the most appropriate valorization technology that could be implemented on small or large scales in regions with a high availability of plantain waste. Techno-economic assessment is an activity for setting large-scale processes, mainly on an industrial scale. Techno-economic assessment combines process modeling and engineering design with economic evaluation, and helps to assess the economic viability of both process flowsheet configurations and biobased products [32]. In addition, these valorization processes can be analyzed as alternative processing pathways within a biorefinery using plantain waste as the feedstock. This may contribute to a reduction in the environmental impact caused by agricultural activities and support the transition from a linear to a circular economy to achieve a more sustainable society [33]. Therefore, the aim of this work was to design and techno-economically assess several processes for the production of SCP, NFs, and BM from the waste of the plantain agro-industry through process simulation in order to determine their viability for a large scale.

2. Methodological Approach

2.1. Process Development

2.1.1. Scale Definition

The definition of the scale for the simulation of the processes proposed was calculated from the information obtained from primary and secondary sources (plantain plantation and databases) and by applying different forecasting methods as discussed in previous works [8,34].

2.1.2. Data Collection

Data collection for the design of valorization processes was carried out according to the procedure described in previous works [8,34]. The data collection focused on identifying operating conditions and technological configurations for the production of SCP, NFs, and BM using different feedstock streams (lignocellulosic and starchy materials from plantain waste).

2.1.3. Process Design and Simulation

The design of the processes was carried out in two stages: conceptual design and basic design, as discussed in previous works [8,34]. The conceptual design was built from the data collected in the databases and using the ISO 10628-1, Diagrams for the chemical and petrochemical industry [35]. MS Visio (Microsoft Corporation, Redmond, WA, USA) was used to represent unit operations and unit processes through the engineering symbols. Then, each process was described. The basic design of the processes proposed (represented by the process flowsheets) was performed using the SuperPro Designer v10 simulator (Intelligen, Inc., Scotch Plains, NJ, USA) and following the simulation procedure described in previous works [8,34]. The chemical reactions reported by Wyman et al. [36] for the hydrolysis of starch and cellulose (C6H10O5)n into glucose (C6H12O6), and hemicellulose (C5H8O4)n into xylose (C5H10O5) were used to deduce the reaction system of the designed processes. These reactions were entered into the reactor modules of the simulator (the modules representing a unit operation or unit process are called unit procedures in the SuperPro Designer interface) as follows:
( C 6 H 10 O 5 ) n + n H 2 O   n C 6 H 12 O 6
( C 5 H 8 O 4 ) n + n H 2 O   n C 5 H 10 O 5
The equations described by Doran [37] for aerobic and anaerobic cell growth were entered into the fermenter modules and used to represent microbial cultivation processes:
C w H x O y N z + a   O 2 + b   H g O h N i c   C H O β N δ + d   C O 2 + e   H 2 O
C w H x O y N z + a   H g O h N i b   C H O β N δ + c   C O 2 + d   H 2 O + e   C j H k O i N m
where CwHxOyNz is the chemical formula for the carbon source or substrate; HgOhNi is the chemical formula for the nitrogen source (e.g., for ammonia NH3, g = 3, h = 0, and i = 1); CHαOβNδ is the chemical formula for dry cells; and CjHkOiNm considers the formation of an extracellular product.
The C. utilis formula (CH1.84O0.56N0.2) was used in the reaction (3) for the SCP production [38], and was entered into the fermenter modules of the simulator. The stoichiometry described by Angelidaki et al. [39,40] was employed to define the reactions of BM production, which were entered into the digester modules of the simulator. The molecular formulas of bacterial biomass (C5H7NO2), glycerol trioleate (C57H104O6), long-chain fatty acids (LCFAs, C18H34O2) as a standard lipid, and proteins (CH2.03O0.60N0.3S0.001) were used in the reactions for cell growth [41].
The Monod model was employed to represent the cell growth kinetics for fermenters and digesters, as described by Diwekar [42]; for product formation, the following expression was considered:
d P d t = μ m a x Y P / S S X K S + S
where P is the product concentration (g/L), μmax is the maximal specific growth rate (h−1), YP/S is the product yield coefficient from the substrate (g/g), S is the substrate concentration (g/L), Ks is the half-saturation constant (g/L), and X is the cell concentration (g/L). The kinetic constants µmax = 0.38 h−1 and Ks = 2.59 g/L were used in the growth equations for C. utilis growth [38], which were entered into the fermenter modules of the simulator. The kinetic constants used in the equations describing biomass growth and biomethane production during anaerobic digestion are shown in Table 1. All reactions were algebraically balanced by applying an optimization routine using the fmincon MATLAB function; then, the simulation procedure described in previous works was followed [8,34].

2.2. Techno-Economic Analysis

The techno-economic analysis of the process flowsheets was carried out using the SuperPro Designer simulator. The currency type used in the simulations was the United States dollar ($). The direct fixed capital (DFC), equipment purchase cost (considering the equipment specifications and sizing), and purchase cost of plantain waste and utilities costs were calculated and consulted as described in previous works [8,34]. The techno-economic parameters (Table 2), list of equipment (Table 3), costs of other inputs, and selling price of products (outputs) (Table 4) considered during the assessment are shown as follows.
The labor force corresponding to each process flowsheet was calculated according to the definition in Colombia of a medium-sized company (51 workers) [43]. The labor base cost was estimated using the methodology described in previous works [8,34]. The labor quantity and its costs are shown in Table 5.
Table 2. Parameters used in the techno-economic assessment of the simulated process flowsheets.
ParameterValueReference
Year of analysis2020
Year of construction start2021
Construction period (months)12
Start-up period (months)2
Project life (years)15
Inflation (%)3.80[44]
Rate of opportunity interest (for 2020) (%)5.36[45]
Depreciation: straight line (years)10
Salvage value fixed assets (% × DFC)5
Income tax (%, for 2020)32[46]
Production volume of the plant
First year (%)80
Following years (%)100
DFC: direct fixed capital.

3. Results and Discussion

3.1. Process Development

3.1.1. Scale Definition and Data Collection

The definition of the scale for simulation of the SCP, NF, and BM processes was calculated from the information obtained from a plantain plantation in the experimental farm Montelindo at the Universidad de Caldas (Colombia) and using several forecasting methods as discussed in previous works [8,34]. The quantity of residues per year were estimated at 1,267,071 tons of pseudostems and 3179 tons of rejected unripe plantain fruits. These two types of residues were selected as independent feedstocks considering the utilization of C. utilis during the simulations that describe the SCP production. This yeast can assimilate 5- and 6-carbon sugars. For this reason, it is important to analyze each SCP process as a stand-alone process that utilizes either lignocellulosic materials (e.g., pseudostems) or starchy materials (e.g., the pulp of RUPFs) as feedstocks.
Table 3. Cost and specifications of the equipment used in the techno-economic assessment of the simulated process flowsheets.
Equipment NameEquipment TypeEquipment Attribute a,cEquipment Base Cost a,b,f,gBase Cost Year aUpdated Equipment Cost (Year 2020)Scaling Exponent d,eScaled Cost of Equipment
Belt washerWashing (bulk flow)8000 kg/h$11,4452014$12,0690.60$7962
Industrial blenderGrinding1200 kg/h$30002014$31640.60$6515
Centrifugal pumpFluid flow16,000 kg/h$23972014$25280.58$2528
Flow distributorFlow splitting8000 kg/h$14502014$15290.48$2133
Valve solids and liquidsMixing8000 kg/h$37002014$39020.60$2574
Solid packedFilling1200 und/h$75,0002018$75,5470.60$75,547
FermenterVessel procedure50,000 L$35,0002018$35,2550.56$35,255
FermenterSeed fermentation10,000 L$18,0002014$18,9810.56$18,981
DigesterAnaerobic digestion50,000 L$42,5002018$42,8100.56$42,810
Balance tankStorage1000 L$19202014$20250.57$2025
Storage tankStorage10,000 L$19,8002018$19,9440.52$19,944
Plate and frame exchangerCooling/heating8000 kg/h$77002014$81200.60$12,307
Centrifugal equipmentCentrifugation16,000 kg/h$82,5002018$83,1020.67$83,102
Filter equipment (80 mesh)Component splitting8000 L$41002012$42610.59$6413
DecorticatorShredding150 kg/h$55002018$55400.60$5540
Gear pumpFluid flow2500 L/h$49002012$50920.34$5092
Mixing valve—liquids Mixing16,000 kg/h$19002012$19740.82$1974
SterilizeHeat sterilization5000 L/h$56,0002014$59,0520.60$118,666
Ion exchange equipmentIon exchange8000 L/h$16,0002012$16,6270.62$16,627
DryerSpray drying86,000 L$82,5002018$83,1020.53$83,102
DryerRotary drying8000 L/h$95002014$10,0180.60$10,018
Air compressGas compression4000 kW $65002018$77670.69$7767
Solid conveyor Screw conveyingD × L: 30 cm × 5 m$42002014$44290.58$3293
Solid conveyor Belt conveyingD × L: 30 cm × 5 m$29002018$29210.58$1954
CondenserCondensation16,000 L/h$12,3002012$12,7820.79$12,782
Absorption columnAbsorption8000 L/h$15,5002012$16,1070.78$27,658
Degassing columnDegasification8000 L/h$14,8002012$15,3800.78$26,409
Mechanical skinningShredding150 kg/h$52002018$52380.60$5238
MicrofiltrationMicrofiltration80 m2 $34,0002018$34,2480.60$34,248
Rotary drum filterRotary drum filter80 m2 $30,0002020$30,0000.39$30,000
With information adapted from: a [47], b [48], c [49], d [50], e [51], f [52], g direct quotation. Inflation indices used in the escalation: 2014—576.1; 2018—603.1; 2019—607.5 [53]. D: diameter, L: length.
Table 4. Feedstock cost and selling price of products for 2020 used for the techno-economic assessment of the simulated process flowsheets.
Feedstock, Supplies and UtilitiesUnitPurchasing PriceReferences
Air a$/MT5.362
Electricity$/kWh0.190[54]
Gas$/m30.650[55]
Process water$/m30.440[56]
Cooling water a$/m35.235
Low pressure steam$/MT7.560[57]
Sodium hydroxide 50%$/kg0.515[58]
Sulfuric acid 98% $/kg0.240[58]
Nitric acid 68%$/kg0.174[58]
Ammonium sulfate$/kg0.210[58]
Ascorbic acid$/kg2.700[48]
Calcium chloride$/kg0.200[58]
HDPE $/kg1.000[48]
Cellulase$/kg15.90[48]
Hemicellulase$/kg13.50[48]
Amylogluosidase$/kg20.00[48]
Thermostable α-amylase$/kg12.00[48]
RUPF a$/kg0.100
Pseudostems and rachis a$/kg0.052
ProductsUnitSelling priceReferences
SCP$/kg5.10[8]
NF a$/kg3.00
BM$/m31.20
Sludge$/kg0.10
a Average cost calculated from quotes provided by local and international companies. BM: biomethane; HDPE: high-density polyethylene; NFs: natural fibers; RUPFs: rejected unripe plantain fruits; SCP: single-cell protein.
Table 5. Quantity and cost of labor used for the techno-economic assessment of the simulated processes.
Labor TypeTotal Annual Salary ($per Person)Persons
Plant manager20,9171
Secretary63121
Plant engineer18,7023
Plant supervisor14,7653
Laboratory technician88593
Maintenance technician88593
Operators778837
Total86,20251
On the other hand, during data collection from databases, 1715 papers and other published works were identified. From this amount, 343 were used and analyzed and the remaining ones discarded. These documents are related to different technological configurations for the SCP, NF, and BM production using different feedstocks, such as sugarcane, plantain, corn, wheat, and barley, among others.

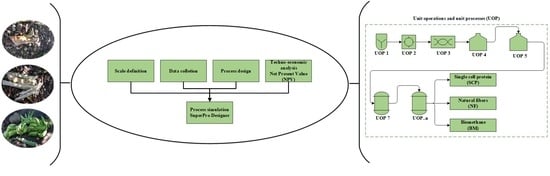
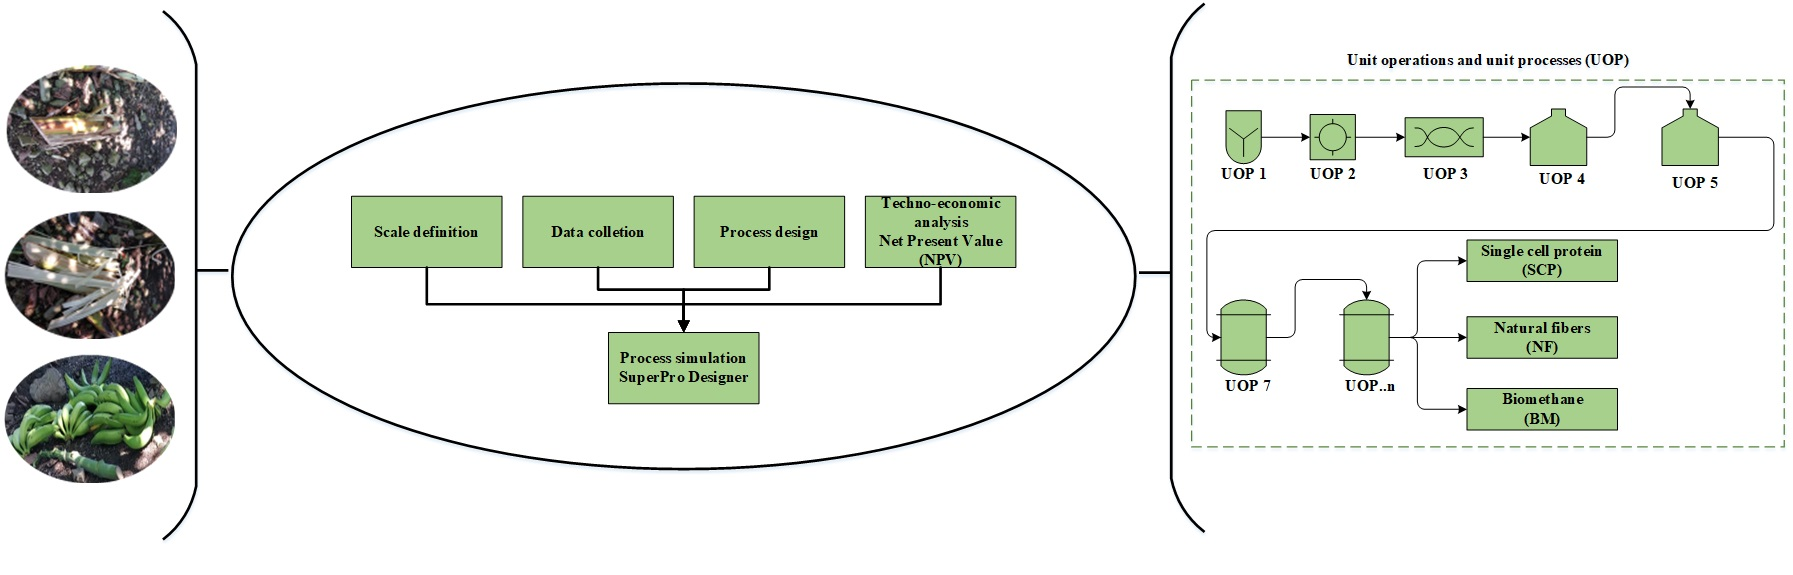
3.1.2. Process Design and Simulation

The conceptual design of the studied processes was carried out from the analysis of the 343 documents obtained from the databases. These diagrams represent the basic structure of the different unit operations and unit processes intended for the conversion of the residues (pseudostems and RUPFs) into products. The conceptual design diagrams for single-cell protein production from plantain pseudostems and RUPFs (Figure 1), NF production from pseudostems (Figure 2), and BM production from pseudostems (Figure 3) are briefly described below.
The process proposed for SCP production from pseudostems (see Figure 1a) is described as follows. For washing (E-01), the plantain residues are immersed in water (3.5 m3 per ton) [59] at 25 °C in tanks with agitation for 12 min to remove other waste (soil and fines). For grinding (E-02), the residues are reduced in size down to particles between 1 and 2 mm. During the first pretreatment (E-03), the residues are mixed with sulfuric acid (2.2% v/v) [60]. The reaction is kept at 25 °C for 12 h with continuous stirring. In the second pretreatment (E-04), the mixture is treated by steam explosion at 177 °C for 5 min [60]. Then, the mixture is pressed (E-05) to extract the aqueous solution (90%) enriched with monosaccharides (mainly glucose and xylose).
For saccharification (E-06), water is added to the mixture and the pH is adjusted to 5.5 [61]. Cellulases and hemicellulases are added (6% and 2% w/v, respectively). The reacting mixture is continuously stirred at 45 °C for 24 h [61]. For filtration (E-07), the solids are removed through an 80-mesh filter. During the ion exchange (E-09 and E-10), the sugar mixture (E-08) is detoxified using H+ and OH-/Cl- resins [62,63,64]. For sterilization (E-11), a solution containing 5 g/L ammonium sulfate is added to the mixture [65], which is heated at 121 °C for 15 min [15].
For fermentation (E-12), the sterilized culture medium is stored in reactors, and 10% C. utilis inoculum is added [15]. C. utilis was considered for fermentation due to its ability to assimilate different carbon sources, such as hexoses (e.g., glucose) and pentoses (e.g., xylose) [66,67]. In addition, this yeast is one of the most used for the production of SCP [10] and it is generally recognized as safe (GRAS) [68] for use in human food and animal feed. Then, the fermentation is kept under aerobic conditions at 30 °C and pH 4.5 for 24 h [69]. For the reduction of nucleic acids in yeast (E-13), the culture broth is mixed with concentrated sulfuric acid (12 mL/L); this procedure is needed in order to prevent the RNA from generating uric acid in the SCP consumer. Next, the acid-treated broth is heated at 80 °C for 30 min [70]. Afterwards, the broth is mixed with a solution of saturated sodium hydroxide up to pH 8.7 and the reaction is maintained for 10 min. For centrifugation (E-14), water is added to the resulting liquid stream continuously (at a rate of 1:1) and yeasts are separated by a disk-stack centrifuge [70]. Finally, the yeasts are dried to 150 °C in a spray dryer (E-15) [71], with a final moisture between 3% and 5% [72]. SCP is packed (E-16) in high-density polyethylene (HDPE) bags to obtain 25-kg packaged product units.
The process proposed in Figure 1b for SCP production from RUPFs is described as follows. For washing (E-1.1), the procedure briefly described above for unit E-01 is applied. For peeling (E-1.2), the peel is separated mechanically from pulp at a 150 kg/h flowrate. During grinding (E-1.3), the pulp is blended at 30,000 rpm for 10 min. In this step, 5% (w/v) ascorbic acid solution is added to the mixture to prevent enzyme damage [73]; then, total solids (TSs) are diluted up to 30% [74]. Next, 6 ppm calcium ions (as CaCl2) per kilogram of mixture are added [75]. The mixture pH is adjusted to 5.5, and 0.15% (w/v) thermostable Bacillus licheniformis α-amylase liquid preparation is added [75]. For liquefaction (E-1.5), steam at 105 °C is mixed directly and continuously (jet cooking) (E-1.4) with the mixture [74]. The mixture temperature is adjusted up to 95 °C and kept under continuous stirring at 100 rpm for 3 h [75]. For saccharification (E-1.7), the pH and temperature of the mixture are adjusted to 4.5 and 60 °C (E-1.6), respectively, and 0.15 % (v/v) amyloglucosidase is added [76]. The hydrolysis is kept under continuous stirring in the reactors for 6 h. At the end of this step, the dextrose equivalent (DE) of the mixture must be greater than 80% [76]. Next, the procedures occurring in units E-11 to E-16 are applied (see Figure 1a).
The process proposed to produce natural fibers (Figure 2) starts in the E-01 unit, where the leaf sheaths and floral stalk making up the pseudostems are mechanically separated. Then, the leaf sheaths are subjected to decortication (crus and bruise) using equipment with two cylinders (E-02) to extract the fibers [18]. Next, the fibers are washed (E-03) (water to fiber ratio of 2:1) to remove pigments and other compounds (part of fats, proteins, minerals, cellulose, hemicellulose, lignin, etc.). Then, the fibers are treated with 6% (w/v) sodium hydroxide (ratio of 2:1) (E-04). The reaction is kept in a tank with continuous stirring at 60 °C for 2 h [77,78]. During washing (E-05), the fibers are submerged in water (ratio of 2:1) at room temperature [18]. Finally, the fibers are dried (E-06) (maximum moisture of 8%) in a convection oven with air recirculation at 80 °C for 4 h [77].
The process proposed for BM production from the pseudostems (see Figure 3) starts with the grinding operation (E-01), where the pseudostems are reduced in size down to particles between 1 and 2 mm. Then, the particles are pretreated (E-02) by steam explosion at 200 °C for 76 min [79]. The resulting mixture is dissolved with water down to 10–15% TS [80]. During the anaerobic digestion (E-03), a solution containing 5 g/L ammonium sulfate is added to the mixture as a nitrogen source for the microorganisms. The process is performed under slow continuous stirring at 40 °C for 30 days [81]. For biogas cleaning, the water from gas is condensed and separated through a decanter (unit E-04) [81]. For desulphurization (E-06), the gas is compressed at 20 bar (E-05), then the gas is sent to an absorption column (scrubber), where it is contacted with water mist to extract the carbon dioxide and hydrogen sulfide [81].
After building and describing the conceptual design (Figure 1, Figure 2 and Figure 3), the first basic design of each one of the proposed processes was defined. The basic design of a process comprises a detailed analysis of the different unit operations and unit processes to define the process flowsheet, and information gathered from different sources used to simulate alternative operation modes [82,83]. In this way, the basic design includes the preparation of the process flowsheets, equipment list, corresponding mass and energy balances, and process scheduling (particularly important for batch processes). For this task, the SuperPro Designer simulator was employed in this work. In general, the basic design comprises all the documentation required to define the platform, production facility, and structure configurations and dimensions in satisfactory detail to allow the start of the detailed design (detailed engineering phase) [84].
The definition of the process flowsheets for the production of SCP, NFs, and BM started with the selection of the time regime of the whole process (batch vs. continuous). For this, the selected regime was batchwise due to the multiple sub-operations in the equipment, as discussed in previous works [8,34], and the technical impossibility of performing some processes in a continuous mode.
The following step to accomplish the basic design started from the conceptual design diagrams already built for the proposed processes. The analysis of these diagrams made it possible to identify which material streams are needed to connect the different unit procedures (e.g., through pumps, screws, etc.). The definition of these needs may affect the mass or volumetric flowrates of the different process streams, increasing the number of equipment units and affecting the techno-economic indicators. Therefore, for the process of SCP production from pseudostems, the equipment units for transferring solids (E-05, E-08, and E-13) and liquids (E-18, E-25, E-28, E-30, and E-35) and for balance storage (E-17 and E-34) were defined and included in the process flowsheet (see Figure 4). For SCP production from RUPFs, the equipment units for transferring liquids (E-09, E-12, E-15, E-21, E-24, E-26, and E-31) and for balance storage (E-08, and E-30) were included as well (Figure 5). For NF production, some units for transferring solids (E-03, E-10, and E-13) were added (Figure 6). Finally, for BM production, equipment units to transfer solids (E-02, E-04, and E-15) and liquids (E-06 and E-24), and for balance storage (E-05) were defined and added (Figure 7). The inclusion of these unit procedures allowed an assessment of their impact on the techno-economic index.
The basic design continued with the analysis of the input-output structure, according to Douglas’ terminology [85]. The need to purify the feed streams before the transformation step (E-01 in Figure 1) made it possible to identify water recovery possibilities as an improvement of the design as discussed in previous works [8,34]. In this sense, for the processes of SCP production (Figure 4 and Figure 5), a washing step (E–01) with a water recovery system (E-02) that separates the solids (soil and fines) and adjusts the flowrate with fresh water (E-03) was included. This variant made it possible to recover up to 90% of the water used in the washing step. For NF and BM production, there is no need to purify streams due to the nature of the processes, which do not require strict cleaning.
The preparation and definition of the process flowsheet also contemplated the analysis of the reaction system. The main transformations involved in the processes for producing SCP (aerobic cultivation) and BM (anaerobic digestion) are shown in Table 6. The reaction system corresponds to the recycle structure according to Douglas’ terminology. In this sense, a recycle structure in the process flowsheet for SCP production from pseudostems (Figure 4) was included in the unit procedures E-24 to E-26. For SCP production from RUPFs, the recycle structure was added in the unit procedures E-20 to E-22 (Figure 5). The recycle structure in Figure 4 is described as follows: 10% of the sterilized mixture (E-23) is sent to the seed reactors (E-24), i.e., 10% of the C. utilis inoculum [15]. Fermentation is kept under aerobic conditions at 30 °C and pH 4.5 for 18 h [69]. At the end of this step, 30% of the volume of broth in the seed reactors is mixed in the main reactors (E-27) with 90% sterilized medium (E-23). Seventy percent of the broth volume (E-26) is recirculated to the seed reactors [69]. The recycle structure in Figure 5 was carried out in a similar way as in Figure 4. On the other hand, the process for NF production has no recycle structures (Figure 6). For the process of BM production (Figure 7), the recycle structure was added in the unit procedures E-10 to E-16. This system is described as follows: 30% of the sludge (E-16) is sent to the digesters for stabilization (E-17) and 70% is recirculated to the anaerobic digestion bioreactors (E-12 and E-13) [86], where it is mixed with fresh waste mixture (E-10 and E-11). The recycle structure in the fermentation or anaerobic digestion steps is paramount in the design of this type of biotechnological process since recirculation provides stability and improved performance by increasing the biomass concentration and reducing the conditioning time of the cultures in these steps [87].
According to Douglas’ methodology, the separation system is the next step during process design. In this regard, the separation of C. utilis from the broth was carried out through a disk-stack centrifuge and rotary vacuum filter (E–32 and E–33 in Figure 4, and E–28 and E–29 in Figure 5). Moreover, in this step, other separation schemes were analyzed as well. For instance, the chemical pretreatment (E-07 in Figure 4), a press system for solids (E-08) with acid solution recovery (E-09 and E-10), and flowrate adjustment (E-11) were included. This system allows the recovery of up to 90% of the aqueous solution. For the washing step (E-03 and E-10 in Figure 6), a recovery system of aqueous solution with solids separation (E-04 and E-11) and flowrate adjustment (E-05 and E-12) was also included. It is worth highlighting from this process the recovery of the aqueous solution (water and sodium hydroxide mixture) in the unit procedure E-07 and the inclusion of a hot air recovery step (E-15) that allows the recovery of up to 90% of air. This configuration provokes a temperature increase inside the fibers, decreasing the energy requirement during the subsequent drying. For the BM process, a water recovery system was implemented [88,89]. This system consists of a pump (E-24) that sends water under pressure from the desulphurization step (E-23) to the degasification step (E-27), where the water is mixed with air (E-26) to extract hydrogen sulfide and carbon dioxide. Then, the water is recovered (90%) (E-25), and the temperature (E-22) and flowrate (E-21) of this stream are adjusted.
Table 6. Reactions involved during the simulation of the process flowsheets for SCP and biomethane production.
ProcessStepsReactionsComments
SCPSteam explosion (E-12) and saccharification (E-15) in Figure 4Liquefaction (E-11) and saccharification (E-14) in Figure 5From starch/cellulose to glucoseExtent of the hydrolysis reaction of starch to glucose in the steam explosion step was assumed as 100%. Cellulose and hemicellulose hydrolysis was assumed as 19.4% and 90%, respectively [60]. Yield of reducing sugars (mainly glucose and xylose) in saccharification was assumed as 82% [90]. Reaction extent from starch to dextrin was 84.54 %, from dextrin to maltose was 63.27 %, and from dextrin to glucose was 36.72 % [8]. Reaction extent in saccharification was assumed as 80% [76].
C 96 H 162 O 81 + H 2 O   2 C 48 H 82 O 41 (5)
C 48 H 82 O 41 + 7 H 2 O   8 C 6 H 12 O 6 (6)
From hemicellulose to xylose
C 96 H 162 O 81 + H 2 O   2 C 48 H 82 O 41 (7)
C 48 H 82 O 41 + 7 H 2 O   9.6 C 6 H 12 O 6 (8)
Fermentation (E-24 and E-27) in Figure 4 and (E-20 and E-23) in Figure 5 C 6 H 12 O 6 + 2.0168   O 2 + 0.7734   N H 3 3.8672   H 1 , 84 O 0 , 56 N 0 , 2 + 2.1328   C O 2 + 3.6023   H 2 O (9)YXS values were 0.55 g cells/g glucose [38] and 0.45 g cells/g xylose [91].
C 5 H 10 O 5 + 2.2842   O 2 + 0.5273   N H 3 2.6367   C H 1 , 84 O 0 , 56 N 0 , 2 + 2.3633   C O 2 + 3.3652   H 2 O (10)
BMSteam explosion (E-03)From starch and cellulose to glucoseCellulose and hemicellulose hydrolysis was 19.4 % and 90 %, respectively [60].
C 6 H 10 O 5 + H 2 O   C 6 H 12 O 6 (11)
From hemicellulose to xylose
C 5 H 8 O 4 + H 2 O C 5 H 10 O 5 (12)
Anaerobic digestion (E-12, E-13 and E-17)Carbohydrate hydrolysis
C 6 H 12 O 6 + 0.1115   N H 3 0.1115   C 5 H 7 N O 2 + 0.7440   C 2 H 4 O 2 + 0.5000   C 3 H 6 O 2 + 0.4409   C 4 H 8 O 2 + 0.6909   C O 2 + 1.0254   H 2 O (13)
C 5 H 10 O 5 + 0.1115   N H 3 0.1115   C 5 H 7 N O 2 + 0.2440   C 2 H 4 O 2 + 0.5000   C 3 H 6 O 2 + 0.4409   C 4 H 8 O 2 + 0.6909   C O 2 + 1.0254   H 2 O (14)
C 3 H 6 O 2 + 0.0458   N H 3 + 1.764   H 2 O 0.0458   C 5 H 7 N O 2 + 0.9345   C 2 H 4 O 2 + 2.804   H 2 + 0.902   C O 2 (15)
2.804   H 2 + 0.01618   N H 3 + 0.7413   C O 2 0.01618   C 5 H 7 N O 2 + 0.6604   C H 4 + 1.45   H 2 O (16)
C 4 H 8 O 2 + 0.0544   N H 3 + 0.0544 CO 2 + 1.7818   H 2 O 0.0544   C 5 H 7 N O 2 + 1.8909   C 2 H 4 O 2 + 1.8909   H 2 (17)
1.8909   H 2 + 0.0109   N H 3 + 0.4999   C O 2 0.0109   C 5 H 7 N O 2 + 0.4452   C H 4 + 0.9780   H 2 O (18)
C 2 H 4 O 2 + 0.022   N H 3 0.022   C 5 H 7 N O 2 + 0.945   C H 4 + 0.945   C O 2 + 0.066   H 2 O (19)
Lipid hydrolysis:
C 57 H 104 O 6 + 3   H 2 O C 3 H 8 O 3 + 3   C 18 H 34 O 2 (20)
C 3 H 8 O 3 + 0.04071   N H 3 + 0.0291   C O 2 0.04071   C 5 H 7 N O 2 + 0.9418   C 3 H 6 O 2 + 1.09305   H 2 O (21)
C 18 H 34 O 2 + 15.2398   H 2 O + 0.2500   C O 2 + 0.1701   N H 3 0.1701   C 5 H 7 N O 2 + 8.6998   C 2 H 4 O 2 + 14.500   H 2 (22)
14.500   H 2 + 3.8334   C O 2 + 0.0836   N H 3 0.0836   C 5 H 7 N O 2 + 3.4139   C H 4 + 7.4997   H 2 O (23)
Reactions (15), (16), and (19) are subsequently applied.
Protein hydrolysis:
C H 2.03 O 0.6 N 0.3 S 0.001 + 0.3006   H 2 O 0.017013   C 5 H 7 N O 2 + 0.29742   C 2 H 4 O 2 + 0.02904   C 3 H 6 O 2 + 0.022826   C 4 H 8 O 2 + 0.013202   C 5 H 10 O 2 + 0.07200   C O 2 + 0.28298   N H 3 + 0.001   H 2 S (24)
C 5 H 10 O 2 + 0.0461   N H 3 + 0.5216   C O 2 + 0.8288   H 2 O 0.0461   C 5 H 7 N O 2 + 0.8239   C 2 H 4 O 2 + 1.0660   C 3 H 6 O 2 + 0.4454   C H 4 (25)
Reactions (15), (16), and (19) are subsequently applied.
Adapted from Angelidaki et al. [39,40] and Yu et al. [41].
Process simulation of the flowsheets performed as part of the basic design of the production of SCP, NFs, and BM allowed the calculation of the global mass balances and the process scheduling of each analyzed flowsheet at a large scale. The results obtained from the simulations are shown in Table 7.
The simulation results indicate that the process for NF production had the highest number of batches per year (346). This process had a recipe cycle time equal to the scheduled working time on each equipment (24 h). The results suggest that the productivity of the process was linked to the semi-continuous work of the equipment. This outcome can be verified from Figure 8, Figure 9, Figure 10, and Figure 11, where the equipment occupancy charts are presented. These charts show that some equipment units were scheduled to operate in parallel without waiting for the previous equipment to finish its operation. For example, in batch 1 (Figure 8), it is identified that all the equipment units are scheduled to start at the same time. This schedule enables the material flow entering the equipment to be processed in a semi-continuous mode to increase the amount of waste processed per unit of time.
On the other hand, the process for BM production had the lowest number of batches per year (11). This result is explained by the cycle time of this process, which reaches 30 days (720 h), especially the step of anaerobic digestion (E-12, E-13, and E-17 in Figure 11). These equipment units represent the bottleneck of the process (recipe cycle time). The bottlenecks of the processes for the production of SCP (E-27 in Figure 8 and E-23 in Figure 9) and NFs (E-14 in Figure 10) were significantly lower.
The results presented in Table 6 also show that the processes demanding the highest amounts of bulk materials correspond to the production of SCP from pseudostems and natural fibers. This result is related to the batch size and the number of batches processed per year. The potential environmental impacts that the SCP and NF processes can have, are linked to the high energy and water consumption. The SCP production from RUPFs had a high consumption of air (24.83%) and water (46.19%). The air and water consumption in the NF process was 14.87% and 10.26%, respectively. The low water consumption in the NF process is explained by the inclusion of the water recovery system during the fiber washing.

3.2. Techno-Economic Analysis

A summary of the results of the techno-economic assessment as part of the basic design for the SCP, NF, and BM production processes is shown in Table 8. In addition, the unit operating and depreciation costs are presented in Table 9. The obtained results indicate that the process with the highest NPV corresponded to NF production (Figure 6). This process had 8.4% more income than its operating costs. Moreover, its direct fixed capital was lower than the other processes, not exceeding $1,000,000. In this sense, the production of NF from plantain waste required a lower investment in equipment. For this process, AOCs were distributed as follows: 65.55% feedstocks, 0.40% labor, and 34.04% utilities. On the other hand, when comparing NPV of the process for NF production with NPV of other processes for the valorization of plantain waste, it is worth highlighting that NPV of NF was 48.8% higher than that of the process for the production of nutritional blocks for dairy cattle feeding reported in a previous work [34]. Likewise, the NF production process had NPV that is 98.43% higher than that of the process for the production of isomalto-oligosaccharide syrup integrated with the production of single-cell protein from RUPFs, which has also been reported in a previous work [8]. In this sense, the NF process can be a profitable alternative for the valorization of plantain residues, especially for residual materials with a high fiber content such as pseudostems.
The analysis of the results presented in Table 8 indicates that the selling prices of SCP ($5.10 per kg) and BM ($1.20 per m3) products were lower that the operating and depreciation costs per unit of products in 57.72% for SCP from RUPFs and 86.91% for SCP from pseudostems. In contrast, the selling price of NFs ($3.00 per kg) was 62.33% higher than the unit operating and depreciation costs. According to these data, new configurations of the process flowsheets to reduce production costs were analyzed. These configurations implied the elimination of the washing steps, extraction of water from the waste through pressing, and reduction in labor. Thus, for the SCP process that employs pseudostems, the equipment units E-01, E-02, and E-03 were eliminated. For the SCP process that uses RUPFs, equipment units E-01, E-02, and E-03 were also eliminated and the labor was reduced to 17 workers. For the SCP and BM processes from pseudostems, 70% moisture was removed from the feedstock (E-05 and E-02). These configurations were proposed since the analysis of the direct fixed capital cost and the annual operating cost showed that the simulation of the original process for SCP production from pseudostems resulted in an exaggerated amount of equipment units (up to 1000 units of the same equipment E-03 in Figure 7) to process the entering amount of residues. On the other hand, labor in the SCP process from RUPFs was lower because the batch size (3179 tons) was smaller than that of the SCP process from pseudostems (1,267,071 tons).
Table 9. Operating and depreciation costs per unit of products for the simulated process flowsheets.
ItemSCP from PseudostemsSCP from RUPFsNF from PseudostemsBM from Pseudostems
Feedstocks ($per pack)8.73610.4421.8140.073
Labor ($per pack)0.0487.9420.0110.001
Consumables ($per pack)0.0060.0000.0000.000
Utilities ($per pack)2.69716.1220.0110.116
Capital depreciation ($per pack)0.5764.4780.0420.011
Total12.06238.9851.8780.200
BM: biomethane; NFs: natural fibers; RUPFs: rejected unripe plantain fruits; SCP: single-cell protein.
After performing the corresponding simulations, the implemented modified configurations increased NVP of the SCP and BM processes but not enough to reach a value greater than 0. For SCP from pseudostems, NPV was $−89,657,441; for SCP from RUPFs, it was $−9,066,821; and for BM production from pseudostems, it was $−188,595,941. The process for NF production was not modified considering that its NPV was profitable. It is evident from these results that this type of process, independently implemented for a large scale (stand-alone processes), is not techno-economically profitable under the analyzed context, except for the case of NF production. An alternative to improve the profitability of such processes that have NPV lower than 0 may be its integration into a biorefinery that valorizes the residues from the plantain agro-industry in an integral way. In this sense, lignocellulosic and starchy waste can be precursors of different products that, due to their variety, can provide different cash flows, directly impacting NPV of the biorefinery. Thus, the internal rate of return (IRR) of such a biorefinery process could approach the typical profit margin of the production processes intended to obtain miscellaneous fabricated products worldwide, which is about 5.03% [92]. In this potential case, the profitability of this type of biorefinery could be attractive for potential investors.

3.3. Integration Possibilities of the Simulated Processes in a Biorefinery

Biorefineries are sustainable industrial structures that recover the most compounds, especially carbon from residual biomass, in a wide portfolio of products, such as food, feed, biofuels, and energy [93]. Biorefineries are composed of different platforms that allow efficient and sustainable connection of feedstocks with products [9]. Thus, biorefineries are presented as facilities of the future that integrate multiple processes synergistically to benefit the environment and society.
The implementation of each of the processes simulated in this work into the design of a second-generation biorefinery may lead to processing of most of the residues from the plantain agro-industry. In addition, the possibilities of processing each one of the analyzed residues in a separate way (pseudostems and rejected unripe plantain fruits) can increase the profitability of the integrated processes. Moreover, the simulated processes (profitable and unprofitable) could be the basis for integrating them into the design of a biorefinery because they provide technological configurations that become alternative processing routes for a biorefinery that utilizes such residues. In addition, the products whose production was simulated in this work are non-traditional products, different from the products that are analyzed in most published papers dealing with biorefinery design, such as biofuels (e.g., bioethanol), furfural, xylitol, or animal feed. In this sense, it is necessary to design biorefineries for the processing of lignocellulosic and starchy materials contained in the residues of the plantain agro-industry (pseudostems and RUPFs, among others).
The integration of each of the processes simulated in this work, and other valorization processes studied in previous works [8,34], into the design of a multi-input second-generation biorefinery can lead to the sustainable valorization of all residues generated in the plantain agro-industry. Plantain residues are formed by different materials that can potentially be used (with an appropriate prior separation) to obtain two valuable streams: lignocellulosic and starchy streams. These streams can be directed into two different processing pathways of the biorefinery design. For instance, the pulp of RUPFs (starchy stream) can be used to obtain SCP, whereas natural fibers can be obtained from plantain pseudostems (lignocellulosic stream). The integration of these processes is subject to the unit operations and unit processes that make up the platforms to be considered during the biorefinery design. Therefore, it is necessary to generate and implement methodological approaches to design biorefineries under these conditions, considering the particularity of the use of starchy and lignocellulosic materials. In this way, waste reduction and economic growth in rural communities could be accomplished simultaneously. Regarding this, such a design procedure for these facilities will be explored in future work.

4. Conclusions

Different processes for the valorization of waste from the plantain agro-industry (production of SCP, NFs, and BM) were designed and techno-economically assessed using process simulation tools. The results indicate that the operating costs (specifically, the consumption of utilities such as energy and water) and the quantity of obtained products are decisive factors in the profitability of these processes. In this sense, the scale and quantity of batches processed per year may affect the profitability of these types of processes on different scales of operation. In particular, processes with an extensive bottleneck such as the one for biomethane production can be disadvantageous in economic terms when included in the design of a future biorefinery processing plantain agro-industry waste.
On the order hand, the initial classification and separation of plantain residues into two streams (lignocellulosic and starchy materials) can help define the capacity and improve the profitability of these valorization processes in order to be integrated into a biorefinery. Such separation may offer the possibility of producing higher-value-added products, such as prebiotic compounds, among others, which could not be obtained if the two types of streams are mixed from the beginning of the corresponding process flowsheets. For this, a design methodology or design framework should be developed for this type of multi-input second-generation biorefinery. This issue will be addressed in future work. In addition, it is also necessary to analyze the supply chain of residues from the plantain agro-industry to determine its optimal availability and periodicity of harvest for a specific location to ensure proper operation of the valorization processes analyzed in this work throughout the year.

Author Contributions

J.A.G.: conceptualization, methodology, formal analysis, investigation, software, and writing—review and editing. L.G.M.: software, formal analysis, and editing. Ó.J.S.: conceptualization, formal analysis, writing—review and editing, validation, and supervision. All authors have read and agreed to the published version of the manuscript.

Funding

This work was supported by the Colombian Ministry for Science, Technology, and Innovation (MinCiencias) through the research project “Design of a Biorefinery for the Use of the Lignocellulosic and Starchy Waste of the Plantain Agribusiness” (Call 757 for Funding of National Doctorates) [grant 1640318]; and the Universidad de Caldas through the research project “Basic Process Development for the Use of Agro-industrial and Urban Waste Under the Concept of Biorefineries” [grant 0240518].

Institutional Review Board Statement

Not applicable.

Informed Consent Statement

Not applicable.

Data Availability Statement

Not applicable.

Acknowledgments

James A. Gómez S. acknowledges the Colombian Ministry of Science, Technology and, Innovation of Colombia (MinCiencias) for the financial support to carry out this work and the Faculty of Engineering at the Universidad de Caldas for its financial and administrative assistance.

Conflicts of Interest

The authors declare no conflict of interest.

References

  1. Coral-Velasco, D.A.; Correa, L.F.; Sánchez, Ó.J.; Gómez, J.A. Process design and techno-economic assessment of cellulolytic enzymes production from coffee husk through process simulation. Biomass Convers. Biorefin. 2022. [Google Scholar] [CrossRef]
  2. FAO. FAOSTAT: Food and Agriculture Data. Available online: http://www.fao.org/faostat/es/#data (accessed on 2 February 2022).
  3. Escalante, H.; Orduz, J.; Zapata, H.; Cardona, M.; Duarte, M. Atlas del Potencial Energético de la Biomasa Residual en Colombia (Atlas of the Energy Potential of the Residual Biomass in Colombia); Unidad de Planeación Minero Energética; IDEAM Colciencias, Universidad Industrial de Santander: Bogotá, Colombia, 2009; p. 182. [Google Scholar]
  4. Blanco, G.; Linares, B.; Hernández, J.; Maselli, A.; Rincón, A.; Ortega, R.; Medina, E.; Hernández, L.; Morillo, J. Caracterización química de lixiviados de pseudotallos y láminas foliares de plátano “Hartón” en el estado Yaracuy (Chemical characterization of leachates pseudostems and leaf blades of ’Harton’ plantain in Yaracuy state). Agron. Trop. 2013, 63, 121–134. [Google Scholar]
  5. Gómez, J.; Sánchez, Ó.; Matallana, L. Procesos de transformación: Perspectiva de aprovechamiento para los residuos de la agroindustria del plátano (Processes of transformation: Perspective of use for the residues of the plantain agro-industry). Rev. P+L 2021, 16, 6–30. [Google Scholar] [CrossRef]
  6. Gómez, J.; Sánchez, Ó.; Matallana, L. Residuos urbanos, agrícolas y pecuarios en el contexto de las biorrefinerías (Urban, agricultural and livestock waste in the context of biorefineries). Rev. Fac. Ing. 2019, 28, 7–32. [Google Scholar] [CrossRef] [Green Version]
  7. Gómez, J.; Pino, E.; Abrunhosa, L.; Matallana, L.; Sánchez, Ó.; Teixeira, J.; Nobre, C. Valorisation of rejected unripe plantain fruits of Musa AAB Simmonds: From nutritional characterisation to the conceptual process design for prebiotic production. Food Funct. 2021, 12, 3009–3021. [Google Scholar] [CrossRef]
  8. Gómez, J.; Berni, P.; Matallana, L.; Sánchez, Ó.; Teixeira, J.; Nobre, C. Towards a biorefinery processing waste from plantain agro–industry: Process development for the production of an isomalto–oligosaccharide syrup from rejected unripe plantain fruits. Food Bioprod. Process. 2022, 133, 100–118. [Google Scholar] [CrossRef]
  9. de Jong, E.; Higson, A.; Walsh, P.; Wellisch, M. Bio-based chemicals. Value added products from biorefineries; IEA Bioenergy: Wageningen, The Netherlands, 2012; 34p. [Google Scholar]
  10. Bajpai, P. Microorganisms used for single-cell protein production. In Single Cell Protein Production from Lignocellulosic Biomass; Bajpai, P., Ed.; Springer: Singapore, 2017; pp. 21–30. [Google Scholar]
  11. Awais, H.; Nawab, Y.; Amjad, A.; Anjang, A.; Md Akil, H.; Zainol Abidin, M. Environmental benign natural fibre reinforced thermoplastic composites: A review. Composites Part C Open Access 2021, 4, 100082. [Google Scholar] [CrossRef]
  12. Bismarck, A.; Mishra, S.; Lampke, T. Plant fibers as reinforcement for green composites. In Natural Fibers, Biopolymers, and Biocomposites; Mohanty, A., Misra, M., Drzal, L., Eds.; CRC Press: Boca Raton, FL, USA, 2005; pp. 51–122. [Google Scholar]
  13. EPA. Basic Information About Anaerobic Digestion (AD). Available online: https://n9.cl/0j3bm (accessed on 20 November 2021).
  14. Adoki, A. Factors affecting yeast growth and protein yield production from orange, plantain and banana wastes processing residues using Candida sp. Afr. J. Biotechnol. 2008, 7, 290–295. [Google Scholar]
  15. Pujol, F.; Bahar, S. Production of single cell protein from green plantain skin. Eur. J. Appl. Microbiol. Biotechnol. 1983, 18, 361–368. [Google Scholar] [CrossRef]
  16. Alsudani, A. Production of polysaccharides and single-cell protein by some local isolates of Trichoderma spp. Pak. J. Biol. Sci. 2021, 24, 971–977. [Google Scholar] [CrossRef]
  17. Aker, K.; Robinson, C. Growth of Candida utilis on single and multicomponent–sugar substrates and on waste banana pulp liquors for single–cell protein production. MIRCEN J. Appl. Microbiol. Biotechnol. 1987, 3, 255–274. [Google Scholar] [CrossRef]
  18. Cadena, E.; Vélez, M.; Santa, J.; Otálvaro, V. Natural fibers from plantain pseudostem (Musa paradisiaca) for use in fiber–reinforced composites. J. Nat. Fibers 2017, 14, 678–690. [Google Scholar] [CrossRef]
  19. Gañán, P.; Zuluaga, R.; Restrepo, A.; Labidi, J.; Mondragon, I. Plantain fibre bundles isolated from Colombian agro–industrial residues. Bioresour. Technol. 2008, 99, 486–491. [Google Scholar] [CrossRef] [PubMed]
  20. Awedem, F.; Happi, T.; Fokou, E.; Boda, M.; Gillet, S.; Deleu, M.; Richel, A.; Gerin, P. Comparative biochemical methane potential of some varieties of residual banana biomass and renewable energy potential. Biomass Convers. Biorefin. 2017, 7, 167–177. [Google Scholar] [CrossRef]
  21. Miezah, K.; Obiri, K.; Kádár, Z.; Heiske, S.; Fei, B.; Mensah, M.; Meyer, A. Municipal solid waste management in a low income economy through biogas and bioethanol production. Waste Biomass Valorization 2017, 8, 115–127. [Google Scholar] [CrossRef]
  22. Ezekoye, V.; Ezekoye, D.; Ofomatah, A.; Agbaogu, A. Comparative study of calorific values and proximate analysis of biogas from different feedstocks. In IOP Conference Series: Earth and Environmental Science, Proceedings of the 4th International Conference/Training Workshop on Energy for Sustainable Development in Africa, ICTWESDA 2020, Nsukka, Nigeria, 11-13 November, 2020; IOP Publishing: Bristol, UK, 2021; 17p. [Google Scholar]
  23. Alonso, L.; Solarte, J.; Bello, L.; Cardona, C. Performance evaluation and economic analysis of the bioethanol and flour production using rejected unripe plantain fruits (Musa paradisiaca L.) as raw material. Food Bioprod. Process. 2020, 121, 29–42. [Google Scholar] [CrossRef]
  24. Elahi, M.; Yusuf, A.; Torshabi, A.; Fazaeli, H.; Dehghani, M.; Salem, A. Ensiling pretreatment of banana waste by–products: Influences on chemical composition and environmental rumen biogas and fermentation. Waste Biomass Valorization 2019, 10, 3363–3371. [Google Scholar] [CrossRef]
  25. Xue, Z.; Mu, L.; Cai, M.; Zhang, Y.; Wanapat, M.; Huang, B. Effect of using banana by–products and other agricultural residues for beef cattle in southern China. Trop. Anim. Health Prod. 2020, 52, 489–496. [Google Scholar] [CrossRef]
  26. Monteiro, H.; Paula, E.; Muck, R.; Broderick, G.; Faciola, A. Effects of lactic acid bacteria in a silage inoculant on ruminal nutrient digestibility, nitrogen metabolism, and lactation performance of high-producing dairy cows. J. Dairy Sci. 2021, 104, 8826–8834. [Google Scholar] [CrossRef]
  27. Godoy, D.; Puémape, F.; Roque, R.; Fernández, M.; Vargas, J.; Gamarra, S.; Hidalgo, V.; Gómez, C. Efecto de la suplementación de bloques multinutricionales con residuos agroindustriales en la producción y calidad de leche de vacas criollas al pastoreo en San Martín, Perú (Effect of the supplementation of multi-nutritional blocks with agro-industrial by-products on the production and quality of milk of criollo cows at grazing in San Martín, Peru). Rev. de Investig. Vet. del Peru 2020, 31, e19029. [Google Scholar]
  28. Suárez, D.; Marín, O.; Ortiz, J.; Puentes, A.; Ballesteros, L.; Suárez, M. Biotechnology as a tool for the agroindustrial exploitation of residues of the chain of Musa spp. Chem. Eng. Trans. 2018, 64, 571–576. [Google Scholar] [CrossRef]
  29. Windsor, P.; Martin, S.; Khounsy, S.; Young, J.; Thomson, P.; Bush, R. Improved milk production from supplementation of swamp buffalo with molasses nutrient blocks containing 10% urea. Dairy 2021, 2, 90–103. [Google Scholar] [CrossRef]
  30. de Evan, T.; Carro, M.; Fernández, J.; Haro, A.; Arbesú, L.; Romero, M.; Molina, E. Effects of feeding multinutrient blocks including avocado pulp and peels to dairy goats on feed intake and milk yield and composition. Animals 2020, 10, 194. [Google Scholar] [CrossRef]
  31. Baidhe, E.; Kigozi, J.; Mukisa, I.; Muyanja, C.; Namubiru, L.; Kitarikawe, B. Unearthing the potential of solid waste generated along the pineapple drying process line in Uganda: A review. Environ. Chall. 2021, 2, 100012. [Google Scholar] [CrossRef]
  32. Aboudi, K.; Fernández, L.; Álvarez, C.; Romero, L. Biogas, biohydrogen, and polyhydroxyalkanoates production from organic waste in the circular economy context. In Sustainable Biofuels; Ray, R., Ed.; Academic Press: Cambridge, MA, USA, 2021; pp. 305–343. [Google Scholar]
  33. Morseletto, P. Targets for a circular economy. Resour. Conserv. Recycl. 2020, 153, 104553. [Google Scholar] [CrossRef]
  34. Gómez, J.; Nobre, C.; Teixeira, J.; Sánchez, Ó. Towards a biorefinery processing waste from plantain agro–industry: Assessment of the production of dairy cattle feed through process simulation. Biosys. Eng. 2022, 217, 131–149. [Google Scholar] [CrossRef]
  35. ISO 10628-1:2014; Diagrams for the chemical and petrochemical industry–Part 1: Specification of diagrams. International Organization for Standardization (ISO): Geneva, Switzerland, 2014; 16p.
  36. Wyman, C.; Decker, S.; Himmel, M.; Brady, J.; Skopec, C.; Viikari, L. Hydrolysis of cellulose and hemicellulose. In Polysaccharides: Structural Diversity and Functional Versatility; Dumitriu, S., Ed.; Marcel Dekker: New York, NY, USA, 2005; pp. 1013–1051. [Google Scholar]
  37. Doran, P. Bioprocess Engineering Principles; Academic Press: Oxford, UK, 2013. [Google Scholar]
  38. Tobajas, M.; García, E.; Wu, X.; Merchuk, J. A simple mathematical model of the process of Candida utilis growth in a bioreactor. World J. Microbiol. Biotechnol. 2003, 19, 391–398. [Google Scholar] [CrossRef]
  39. Angelidaki, I.; Ellegaard, L.; Ahring, B. A mathematical model for dynamic simulation of anaerobic digestion of complex substrates: Focusing on ammonia inhibition. Biotechnol. Bioeng. 1993, 42, 159–166. [Google Scholar] [CrossRef]
  40. Angelidaki, I.; Ellegaard, L.; Ahring, B. A comprehensive model of anaerobic bioconversion of complex substrates to biogas. Biotechnol. Bioeng. 1999, 63, 363–372. [Google Scholar] [CrossRef]
  41. Yu, L.; Wensel, P.; Ma, J.; Chen, S. Mathematical modeling in anaerobic digestion (AD). J. Biorem. Biodegrad. 2013, S4, 1–12. [Google Scholar] [CrossRef]
  42. Diwekar, U. Batch Processing. Modeling and Design; CRC Press: Boca Raton, FL, USA, 2014. [Google Scholar]
  43. Congreso de la República. Ley 905 (Act 905); Congreso de la República de Colombia: Bogotá, 2004; 9p.
  44. DANE. Índice de Precios al Consumidor (IPC) (Consumer Price Index (CPI)). Available online: http://www.dane.gov.co/index.php/estadisticas-por-tema/precios-y-costos/indice-de-precios-al-consumidor-ipc (accessed on 23 January 2020).
  45. Banco de la República. Tasa de cambio y captación (Exchange and collection rate). Available online: https://www.banrep.gov.co/es (accessed on 20 April 2020).
  46. Congreso de la República. Ley 1943 (Act 1943); Congreso de la República de Colombia: Bogotá, 2018; 107p.
  47. Aden, A.; Ruth, M.; Ibsen, K.; Jechura, J.; Neeves, K.; Sheehan, J.; Wallace, B. Lignocellulosic biomass to ethanol process design and economics utilizing co–current dilute acid prehydrolysis and enzymatic hydrolysis for corn stover; NREL/TP-510-32438; National Renewable Energy Laboratory: Golden, CO, USA, 2002; 154p. [Google Scholar]
  48. Alibaba. Products and suppliers. Available online: https://www.alibaba.com/ (accessed on 28 March 2020).
  49. Aspentech. Aspen Icarus Reference Guide. Icarus Evaluation Engine (IEE) V7.3.1; Aspen Technology, Inc.: Burlington, MA, USA, 2011. [Google Scholar]
  50. Peters, M.; Timmerhaus, K. Plant Desing and Economics for Chemical Engineers, 5th ed; McGraw–Hill: New York, NY, USA, 2003. [Google Scholar]
  51. Ulrich, G. A Guide to Chemical Engineering Process Design and Economics; John Wiley & Sons: Toronto, ON, Canada, 1984. [Google Scholar]
  52. VirtualExpo. Direct Industry. Available online: https://www.directindustry.fr/ (accessed on 28 March 2020).
  53. Access Intelligence. Chemical engineering plant cost index. Available online: https://www.chemengonline.com/ (accessed on 6 May 2020).
  54. CHEC. Tarifa de Energia (Energy Fee). Available online: https://www.chec.com.co/ (accessed on 14 August 2020).
  55. Efigas. Tarifa del Gas Natural (Natural Gas Fee). Available online: https://www.efigas.com.co/Nuestros-usuarios/Tarifas (accessed on 15 August 2020).
  56. Aguas de Manizales. Tarifa de Agua (Water Fee). Available online: https://www.aguasdemanizales.com.co/ (accessed on 25 August 2020).
  57. Aristizábal, V.; Solarte, J.; Cardona, C. Economic and social assessment of biorefineries: The case of coffee cut–stems (CCS) in Colombia. Bioresour. Technol. Rep. 2020, 9, 100397. [Google Scholar] [CrossRef]
  58. Chembid. Products and Suppliers. Available online: https://www.chembid.com/en/ (accessed on 20 July 2020).
  59. Lehto, M.; Sipilä, I.; Alakukku, L.; Kymäläinen, H. Water consumption and wastewaters in fresh–cut vegetable production. Agric. Food Sci. 2014, 23, 246–256. [Google Scholar] [CrossRef]
  60. Guerrero, A.; Ballesteros, I.; Ballesteros, M. Optimal conditions of acid-catalysed steam explosion pretreatment of banana lignocellulosic biomass for fermentable sugar production. J. Chem. Technol. Biotechnol. 2017, 92, 2351–2359. [Google Scholar] [CrossRef]
  61. De Souza, E.; Sellin, N.; Marangoni, C.; Souza, O. The influence of different strategies for the saccharification of the banana plant pseudostem and the detoxification of concentrated broth on bioethanol production. Appl. Biochem. Biotechnol. 2017, 183, 943–965. [Google Scholar] [CrossRef]
  62. Villarreal, M.; Prata, A.; Felipe, M.; Almeida E Silva, J. Detoxification procedures of eucalyptus hemicellulose hydrolysate for xylitol production by Candida guilliermondii. Enzyme Microb. Technol. 2006, 40, 17–24. [Google Scholar] [CrossRef]
  63. Nilvebrant, N.; Reimann, A.; Larsson, S.; Jönsson, L. Detoxification of lignocellulose hydrolysates with ion-exchange resins. Appl. Biochem. Biotechnol. 2001, 91, 35–49. [Google Scholar] [CrossRef]
  64. Huang, H.; Ramaswamy, S.; Tschirner, U.; Ramarao, B. A review of separation technologies in current and future biorefineries. Sep. Purif. Technol. 2008, 62, 1–21. [Google Scholar] [CrossRef]
  65. Tobajas, M.; Garcia, E. Determination of biomass yield for growth of Candida utilis on glucose: Black box and metabolic descriptions. World J. Microbiol. Biotechnol. 1999, 15, 431–438. [Google Scholar] [CrossRef]
  66. Demain, A.; Phaff, H.; Kurtzman, C. The Industrial and Agricultural Significance of Yeasts. In The Yeasts. A Taxonomic Study; Kurtzman, C., Fell, J., Eds.; Elsevier Science B.V.: Amsterdam, The Netherlands, 1998; pp. 13–19. [Google Scholar]
  67. Øverland, M.; Skrede, A. Yeast derived from lignocellulosic biomass as a sustainable feed resource for use in aquaculture. J. Sci. Food Agric. 2017, 97, 733–742. [Google Scholar] [CrossRef]
  68. FDA. Microorganisms and Microbial–Derived Ingredients Used in Food (Partial List). Available online: https://www.fda.gov/food/generally-recognized-safe-gras/microorganisms-microbial-derived-ingredients-used-food-partial-list (accessed on 10 May 2020).
  69. Horn, C.; du Preez, J.; Lategan, P. Protein enrichment of banana plant wastes by yeast cultivation. Biol. Wastes 1988, 24, 127–136. [Google Scholar] [CrossRef]
  70. Hopkins, T. Production of Protein with Reduced Nucleic Acid. U.S. Patent No. 4341802, 27 July 1982. [Google Scholar]
  71. Mizuguchi, T.; Arai, T.; Hirayama, K. Method for Preparing Spray–Dried Microbial Cells. European Patent No. 1281752, 20 October 2010. [Google Scholar]
  72. Goldberg, I. Biotechnology Monographs, 1st ed.; Springer: Berlin/Heidelberg, Germany, 1985. [Google Scholar]
  73. Hernández, F.; Morales, Y.; Lambis, H.; Pasqualino, J. Starch extraction potential from plantain peel wastes. J. Environ. Chem. Eng. 2017, 5, 4980–4985. [Google Scholar] [CrossRef]
  74. Olsen, H. Enzymatic production of glucose syrups. In Handbook of Starch Hydrolysis Products and their Derivatives; Kearsley, M., Dziedzic, S., Eds.; Springer Science & Business Media: Luxembourg, 1995; pp. 26–63. [Google Scholar]
  75. Pan, Y.; Lee, W. Production of high–purity isomalto–oligosaccharides syrup by the enzymatic conversion of transglucosidase and fermentation of yeast cells. Biotechnol. Bioeng. 2005, 89, 797–804. [Google Scholar] [CrossRef] [PubMed]
  76. Hernández, J.; Rodríguez, S.; Bello, L. Obtención de jarabe fructosado a partir de almidón de plátano (Musa paradisiaca L). Caracterización parcial (Obtention of fructose syrup from plantain (Musa paradisiaca L.) starch. Partial characterization). Interciencia 2008, 33, 372–376. [Google Scholar]
  77. Rong, M.; Zhang, M.; Liu, Y.; Yang, G.; Zeng, H. The effect of fiber treatment on the mechanical properties of unidirectional sisal–reinforced epoxy composites. Composites Sci. Technol. 2001, 61, 1437–1447. [Google Scholar] [CrossRef]
  78. Zin, M.; Abdan, K.; Norizan, M.; Mazlan, N. The effects of alkali treatment on the mechanical and chemical properties of banana fibre and adhesion to epoxy resin. Pertanika J. Sci. Technol. 2018, 26, 161–176. [Google Scholar]
  79. Santa-Maria, M.; Ruiz-Colorado, A.A.; Cruz, G.; Jeoh, T. Assessing the feasibility of biofuel production from lignocellulosic banana waste in rural agricultural communities in Peru and Colombia. BioEnergy Res. 2013, 6, 1000–1011. [Google Scholar] [CrossRef]
  80. Zahan, Z.; Othman, M. Effect of pre–treatment on sequential anaerobic co–digestion of chicken litter with agricultural and food wastes under semi-solid conditions and comparison with wet anaerobic digestion. Bioresour. Technol. 2019, 281, 286–295. [Google Scholar] [CrossRef]
  81. Bachmann, N. Design and engineering of biogas plants. In The Biogas Handbook. Science, Production and Application; Wellinger, A., Murphy, J., Baxter, D., Eds.; Woodhead Publishing Limited: Cambridge, UK, 2013; pp. 191–227. [Google Scholar]
  82. Moran, A. An Applied Guide to Process and Plant Design; Elsevier: Amsterdam, The Netherlands, 2015. [Google Scholar]
  83. Siirola, J. Industrial applications of chemical process synthesis. In Advances in Chemical Engineering; Anderson, J., Ed.; Academic Press: Cambridge, MA, USA, 1996; Volume 23, pp. 1–62. [Google Scholar]
  84. Demir, I. Fixed offshore platform design. In Handbook of Offshore Engineering; Chakrabarti, S., Ed.; Elsevier: London, UK, 2005; pp. 279–417. [Google Scholar]
  85. Douglas, J. Conceptual Desing of Chemical Processes; McGraw-Hill: New York, NY, USA, 1988. [Google Scholar]
  86. Benedek, A. Anaerobic Fermentation to Produce Biogas. U.S. Patent No. 10144664, 4 December 2018. [Google Scholar]
  87. Hamer, G. Recycle in fermentation processes. Biotechnol. Bioeng. 1982, 24, 511–531. [Google Scholar] [CrossRef]
  88. Hagen, M.; Polman, E.; Jensen, J.; Myken, A.; Joensson, O.; Dahl, A. Adding Gas from Biomass to the Gas Grid; Report SGC 118; Swedish Gas Center: Malmo, Sweden, 2001; p. 142. [Google Scholar]
  89. Allegue, L.B.; Hinge, J. Biogas Upgrading. Evaluation of Methods for H2S Removal; Danish Technological Institute: Taastrup, Denmark, 2014; p. 31. [Google Scholar]
  90. Souza, E.; Liebl, G.; Marangoni, C.; Sellina, N.; Montagnoli, M.; Souza, O. Bioethanol from fresh and dried banana plant pseudostem. Chem. Eng. Trans. 2014, 38, 271–276. [Google Scholar] [CrossRef]
  91. Franzén, C.; Lidén, G.; Niklasson, C. A new method for studying microaerobic fermentations. II. An experimental investigation of xylose fermentation. Biotechnol. Bioeng. 1994, 44, 429–435. [Google Scholar] [CrossRef]
  92. CSIMarket. Miscellaneous Fabricated Products Profitability. Available online: https://csimarket.com/Industry/industry_Profitability_Ratios.php?ind=109 (accessed on 3 October 2022).
  93. IEA Bioenergy. Biorefineries: Adding Value to the Sustainable Utilisation of Biomass. Available online: http://www.ieabioenergy.com/wp-content/uploads/2013/10/Task-42-Booklet.pdf. (accessed on 10 July 2019).
Figure 1. Diagram of the conceptual design for single-cell protein (SCP) production from (a) pseudostems and (b) rejected unripe plantain fruits.
Fermentation 08 00582 g001
Figure 2. Diagram of the conceptual design for producing natural fibers (NFs) from pseudostems.
Fermentation 08 00582 g002
Figure 3. Diagram of the conceptual design for biomethane (BM) production from plantain pseudostems.
Fermentation 08 00582 g003
Figure 4. Process flowsheet of single-cell protein (SCP) production from plantain pseudostems.
Fermentation 08 00582 g004
Figure 5. Process flowsheet of single-cell protein (SCP) production from rejected unripe plantain fruits.
Fermentation 08 00582 g005
Figure 6. Process flowsheet of natural fiber (NF) production from plantain pseudostems.
Fermentation 08 00582 g006
Figure 7. Process flowsheet of biomethane (BM) production from plantain pseudostems.
Fermentation 08 00582 g007
Figure 8. Equipment occupancy chart of the process for single-cell protein production from plantain pseudostems. B: batch; CIP: cleaning-in-place. The labels of the equipment units are shown in Figure 4.
Fermentation 08 00582 g008
Figure 9. Equipment occupancy chart of the process for producing single-cell protein from rejected unripe plantain fruits. B: batch; CIP: cleaning-in-place. The labels of the equipment units are shown in Figure 5.
Fermentation 08 00582 g009
Figure 10. Equipment occupancy chart of the process for producing natural fibers from pseudostems. B: batch; CIP: cleaning-in-place. The labels of the equipment units are shown in Figure 6.
Fermentation 08 00582 g010
Figure 11. Equipment occupancy chart of the process for producing biomethane from pseudostems. B: batch; CIP: cleaning-in-place. The labels of the equipment units are shown in Figure 7.
Fermentation 08 00582 g011
Table 1. Kinetic constants of the main microbial groups used for the simulation of the anaerobic digestion process.
Groupµmax (h−1)Ks (g/L)
Undissolved carbohydrate-hydrolyzing bacteria1.000.00
Undissolved protein-hydrolyzing bacteria1.000.00
Glucose-fermenting acidogens5.100.50
Lipolytic bacteria0.530.01
LCFA-degrading acetogens0.550.02
Amino acid-degrading acidogens6.380.00
Propionate degraders0.490.26
Butyrate degraders0.670.18
Valerate-degrading acetogens0.690.18
Aceticlastic methanogens0.600.12
Adapted from Angelidaki et al. [40]. KS: half-saturation constant; LCFAs: long-chain fatty acids; μmax: maximum specific growth rate.
Table 7. Overall process data and global mass balance for the simulated process flowsheets.
ItemOverall Process Data
SCP from PseudostemsSCP from RUPFNF from PseudostemsBM from Pseudostems
Tons (feedstock/batch)534511.83661115,145
Production per year643,317 unitsa/batch2352 unitsa/batch41,746,712 kg/batch18,227,294 m3/batch
Batch size2725 units8.78 units120,655 kg5699 m3
Batch time (h)726426748
Cycle time (h)353124720
Number of batches (year)23626834611
ItemBulk Materials
SCP from PseudostemsSCP from RUPFNF from PseudostemsBM from Pseudostems
kg/year%kg/year%kg/year%kg/year%
Air886,941,55420.572,801,92624.83254,841,10114.8719,749,4961.13
Ammonium4,347,5460.1072100.06 0.004,582,3670.26
Amyloglucosidase 0.0030460.03 0.0000.00
Ascorbic acid 0.0036,7740.33 0.0000.00
Calcium chloride 0.002840.00 0.0000.00
Cellulase4,030,1390.09 0.00 0.0000.00
HDLPE160,8300.005880.01 0.0000.00
Hemicellulase4,110,7420.10 0.00 0.0000.00
Pseudostems1,261,515,61529.2600.001,266,874,89073.921,151,458,71565.74
RUPFs 0.003,166,59828.06 0.00 0.00
Sodium hydroxide22,795,2610.5334,5110.3116,313,7760.9500.00
Sulfuric acid12,407,5200.2917,0510.15 0.0000.00
Thermostable α-amylase 0.0042580.04 0.0000.00
Water2,115,234,49849.065,211,80446.19175,904,45010.26575,759,35832.87
Total4,311,543,705100.011,284,050100.01,713,934,217100.01,751,549,936100.0
HDLPE: High-density polyethylene; BM: biomethane; NFs: natural fibers; RUPFs: rejected unripe plantain fruits; SCP: single-cell protein; a units: bags or containers weighing 25 kg.
Table 8. Summary of the techno-economic assessment of the simulated process flowsheets.
ItemSCP from PseudostemsSCP from RUPFsNF from PseudostemsBM from Pseudostems
Capital investment ($)56,581,0002,633,00017,352,00099,894,000
Operating cost ($)112,775,0002,029,652115,534,965169,497,695
Direct fixed capital ($)44,647,0002,342,000739,0002,231,465,000
Income ($)50,074,000300,000125,240,000109,711,000
Return on investment (%)−110.82−65.7038.03−59.85
Payback time (years)NANA2.63NA
Internal rate of return (%)NANA50.39NA
Net present value ($)−449,752,000−13,465,00029,299,000−466,705,000
NA: Not applicable (parameter not calculated by the simulator). BM: Bio-methane; NFs: natural fibers; RUPFs: rejected unripe plantain fruits; SCP: single-cell protein.
Publisher’s Note: MDPI stays neutral with regard to jurisdictional claims in published maps and institutional affiliations.

