Article

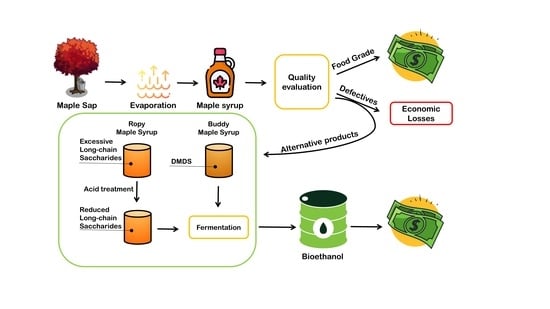
Bioethanol Production as an Alternative End for Maple Syrups with Flavor Defects

by
Julia Maria de Medeiros Dantas
,
André Álvares Monge Neto
,
Thierry Ghislain
* and
Jean-Michel Lavoie
Biomass Technology Laboratory, Department of Chemical Engineering and Biotechnological Engineering, Université de Sherbrooke, 2500 Boul. de l’Université, Sherbrooke, QC J1K 2R1, Canada
*
Author to whom correspondence should be addressed.
Submission received: 19 December 2021 / Revised: 26 January 2022 / Accepted: 26 January 2022 / Published: 29 January 2022

Abstract

:
The purpose of this paper is to demonstrate the validity of an alternative route to valorize declassified maple syrups affected by flavor defects such as ropy maple syrup (RMS) and buddy maple syrup (BMS) as feedstocks for ethanol production. An acid hydrolysis treatment (0.1 M, 0.5 M, 5 M, and 10 M) was performed on the RMS to break the polysaccharide chains which are responsible for the flavor defect. The sugars and inhibitors composition of these hydrolysates were analyzed by ion chromatography and ion exclusion chromatography, respectively. Maple syrup samples were fermented by Saccharomyces cerevisiae for 96 h at 30 °C, and ethanol content was measured to determine the kinetic parameters of the process. RMS and BMS demonstrated a good potential to be used as feedstocks to produce ethanol achieving high efficiencies (RMS: 90.08%; BMS: 93.34%). The acid hydrolysis (25 min, 50 °C, with the addition of 5 M sulfuric acid solution) was effective to maximize ethanol production when using RMS as feedstock. To the best of our knowledge, it is the first time that such an approach is used to valorize declassified maple syrups.

Graphical Abstract

1. Introduction

Quebec (Canada) stands out in the maple syrup industry, being accountable for 92% of Canadian production and 69% of the world production [1]. The province produced more than 66 thousand tons of maple syrup in 2020, which resulted in an income of CAD 429.2 million during the same year. The main part of Canadian production is exported and the rate has increased by 21% as compared to 2019 data [2]. By definition, maple syrup is the concentrated sap from Acer saccharum, and its production follows strict rules while being subjected to high quality standards. The ACER Center, Quebec’s organization for research, development, and technology transfer dedicated to maple syrup, is responsible for the classification of maple syrup, according to its color, sugar content (66 to 68.9 °Brix), and organoleptic characteristics [3]. During this evaluation, some defects can be identified, leading to a declassification of the product and thus with low or even no commercial value for the producers. During the 2020 season, for example, 5% of maple syrup production presented one or several defects [2].
Due to climate change, the amount of defective maple syrup per season may increase year after year, and it is now of upmost interest to valorize declassified maple syrup [4]. The buddy flavor is a common defect in maple syrup collected at the end of the season, in late spring, when the maple leaves start to sprout. The syrup produced with sap harvested at this period is often related to a strong cabbage-like flavor and odor [5,6]. It happens due to many metabolic changes in the tree during dormancy, allied to microbial activity, thus changing the maple sap composition. This leads to a higher content of glucose and fructose, lower sucrose content, and an increase in amino acid concentration (valine, isoleucine, methionine, and sarcosine) [5,7,8]. When the buddy sap undergoes the evaporation process, many chemical changes occur and compounds associated with this unpleasant flavor are generated, such as dimethyl disulfide (DMDS) and dimethyl trisulfide (DMTS) [6]. In 2020, Quebec’s maple syrup producers obtained about one million kg of buddy syrup, which is sold at a reduced price that can reach up to 60% of the value of a standard grade maple syrup [2].
Another defect that can impair maple syrup producers is ropiness. The ropy maple syrup is characterized by a stringiness greater than 10 cm [9]. The slimier texture of this product is generated by microbial colonization of the sap before evaporation [5,10,11]. There are three different conditions that affect the sap to become ropy: temperature above 4 °C, long storage time, and high initial microbial counting. These factors provide the ideal conditions for microbial development and, in consequence, polysaccharide production (dextrans, arabinogalactans and rhamnogalacturonans) [9,12]. Therefore, an increase in the sugar degree of polymerization (DP) causes an increase in its viscosity. Once identified, the ropy maple syrup must be retained by the producer and cannot be commercialized, leading to a considerable financial impair [13]. In 2017, in Quebec, the economic loss caused by the ropy syrup represented CAD 691,237, and more than CAD 5.5 million from 2008 to 2017 [9].
Despite the defects in the maple syrup that cause organoleptic changes in the product, low-grade syrups can still be considered as a good source of sugars, mainly sucrose, and thus could be a good feedstock for ethanol production [14,15,16]. Even the polysaccharides from ropy maple syrup (dextrans, galactans, and arabinogalactans) have the potential to be converted into ethanol after a hydrolysis process [17,18,19]. This happens because these polysaccharides are composed of monomers that are fermentable sugars, such as glucose and fructose; thus, if the big chains can be hydrolyzed, the microorganisms can access the monomers to ferment. Since the majority of the polysaccharides in ropy maple syrups are dextrans, (glucose polysaccharides), the potential to be used as ethanol feedstock increases. Therefore, these maple syrups could be used as feedstocks to produce ethanol in order to be used by the spirits industry. In addition, in the contingency of an important increase in the ropy maple stock exceeding the storage capacity, ropy maple syrup prices could decrease, rendering the use of defective maple syrups as feedstock to produce ethanol for biofuels economically viable. In addition to providing a nobler destination for low-quality maple syrups, this alternative use could meet with Quebec’s objectives to increase up to 15% ethanol content in gasoline by 2030 [20].
In light of this, the main goal of this work is to evaluate the potential of using ropy and buddy maple syrup as feedstock for ethanol production. To the best of our knowledge, this is the first study that proposes such an alternative use for defective maple syrups that would otherwise be destroyed (in the case of ropy maple syrup) or stored (in the case of buddy maple) syrup by the PPAQ (Federation of Quebec Maple Syrup Producers). Both defective maple syrups were characterized to evaluate the physico-chemical differences with standard maple syrup. In addition, acid hydrolysis of ropy maple syrup was optimized in order to reach the highest fermentation yield.

2. Materials and Method

2.1. Maple Syrups

The defective maple syrups (ropy and buddy) used in this study were produced during the 2021 season and were kindly donated by the Érablière École from the city of St. Romain, QC, Canada. The standard organic maple syrup was kindly donated by the Syndicat des Acériculteurs Biologiques du Québec, Longueuil, QC, Canada.

2.2. Physical-Chemical Characterization of Maple Syrups

The maple syrups were physically and chemically characterized. Soluble solids were measured by a refractometer (Atago, Tokyo, Japan). Density was gravimetrically measured, using a 25 mL volumetric flask at 20 °C. Viscosity was measured with a manual glass viscometer #400, U145, Cannon-Fenske (State College, PA, USA). Viscometer was placed in a water bath at 30 °C, and kinematic viscosity was measured by time interval for which the liquid meniscus took to successively reach both etched marks. Dynamic viscosity (η) was calculated using Equation (1). The multiplication of the flow time versus the viscometer constant is equal to kinematic viscosity μ (kg/m·s), which when multiplied by the solution density ρ (kg/m3), becomes η (m2/s).
η = μ × ρ = v i c o m e t e r   c o n s t a n t × t × ρ
pH was measured at 20 °C by a pH meter SYMpHONY, VWR (Mont-Royal, QC, Canada). Total protein content was quantified using the Bradford method [21]. Standard solutions of Bovine Serum Albumin (Sigma-Aldrich, Saint Louis, MO, USA) with known concentrations were used (maximum concentration of 2 g/L and R2 = 0.99). The procedure consisted of adding 100 μL of the sample and 100 μL of 1 M NaOH solution into a test tube. After that, 5 mL of the Bradford reagent was added into the system, and the tubes were vortexed for 15 s. They were then incubated in the absence of light during 5 min at room temperature. Finally, absorbance of 200 μL of the samples was read at 595 nm in an Epoch 2 microplate reader from Biotek (Winooski, VT, USA). The analysis was performed in triplicate.

2.3. Acid Hydrolysis of Ropy Maple Syrup

In order to try to decrease the degree of polymerization (DP) of the ropy maple syrup, additions of the same amount of different concentrations of sulfuric acid (5 M, 1 M, 5 M and 10 M) were tested during different times (every 5 min, up to 30 min) to hydrolyze the polymers (such as dextrans and arabinogalactans) which are responsible for the ropy characteristic. The ropy maple syrup was diluted to 22 °Bx to allow reasonable viscosity to ensure a homogeneous distribution of the acid when added. Next, the diluted syrup was incubated with the acid solution in a 200:1 (vsyrup/vacid) proportion at 50 °C in a water bath for 30 min. During the hydrolysis process, samples were taken every 5 min and cooled down in a water bath during 5 min, followed by a neutralization using 1 M NaOH solution. The samples were then frozen until their analysis.

2.4. Fermentation Conditions

To evaluate the potential use of defective maple syrup as feedstock for bioethanol production, the samples were fermented by the industrial Saccharomyces cerevisiae strain Ethanol red™, largely used by the bioethanol industry, using the previously described conditions [22]. The media tested for fermentation were ropy maple syrup (RMS), RMS hydrolyzed with 5 M of H2SO4 (RMS5), RMS hydrolyzed with 10 M of H2SO4 (RMS10), regular maple syrup (MS), buddy maple syrup (BMS) and a YPD media as synthetic control. The YPD was composed of 5 g/L of yeast extract, 10 g/L of peptone and 200 g/L of glucose. All the fermentation media were at 20 °Bx, pH 5.5 and were supplemented with 5 g/L of yeast extract (except the YPD media in this case).
Prior to the inoculation, dry yeast (Saccharomyces cerevisiae, ethanol red™) was rehydrated with tap water during 15 min at 30 °C and 140 rpm in a shaking incubator (Ecotron, Infors-HT Inc., Bottmingen, Switzerland). Then, 0.75 mL of the yeast solution was added to 30 mL of fermentation media in 50 mL serum vials, reaching the initial content of 1 gyeast/Lmedia in the fermentation media. The vials were capped with rubber stoppers and sealed with aluminum rings. Finally, they were flushed with N2 for 2 min to ensure anaerobic conditions. The fermentation was carried out at 30 °C and 140 rpm during 96 h in the same shaking aforementioned incubator. Every condition was performed in triplicate.

2.5. Reducing Sugars Quantification

Quantification of reducing sugars was used as an indicative of hydrolysis of the polymers present in the ropy maple syrup. The method used for quantification of reducing sugars involved the 3.5-dinitrosalicylic acid (DNS) [23] using glucose as a standard (calibration curve up to 10 g/L of glucose, R2 = 0.99). As it quantifies the reducing ends, it also quantifies the reducing ends of polymers, not only monomers. Therefore, an increase in such quantification could be used as an indicator that polymers had degraded into smaller chains. Thus, it was used as a preliminary indicator of hydrolysis effectiveness. The procedure consisted of adding 250 μL of the sample and 750 μL of the DNS solution into a test tube. Then, it was capped and incubated at 100 °C for 10 min. Later, the tubes were cooled in an ice bath for 10 min, and 1.5 mL of distilled water was added in each tube. After that, they were vortexed for 15 s and read at 540 nm in an Epoch 2 microplate reader from Biotek (Winooski, VT, USA). All the analyses were performed in triplicate, and the results were expressed as glucose equivalent.

2.6. Sugar Profile

Sugar profile of the samples was determined using a Dionex ICS-5000+ chromatography system equipped with an electrochemical detector cell. The separation was performed on a Dionex CarboPac SA10-4 μM column (250 × 4 mm). The column was operated at 45 °C, while the downstream electrochemical detector operated at 30 °C. An analytical gradient pump was used to maintain the flow rate at 1.25 mL/min. Separation was performed using a gradient elution mode and a KOH eluent generator with the following KOH concentrations: 1 mM for 12 min, 10 mM for 5 min and 1 mM for 1 min. Then, 0.4 μL of the sample was injected using a thermostated AS-AP auto-sampler. Finally, a 200 mM KOH post-injection system using a Dionex GP 50 gradient pump was added to ensure signal stability. An external calibration curve was used ranging from 10 to 1000 ppm using standards Fructose (99%), glucose (99%), mannose (99%) and sucrose (99%), which were all purchased from Sigma-Aldrich (Saint Louis, MO, USA).

2.7. Organic Acids and Ethanol Quantification

Quantification of organic acids and ethanol was necessary for the initial characterization of the maple syrups and for the fermentation performance evaluation. Organic acids and ethanol were quantified using an Agilent 1100 series HPLC (Agilent Technologies Inc., Santa Clara, CA USA). The separation was performed on a Phenomenex ROA-Organic Acid H+ (8%) column (150 × 7.8 mm) which operated at 65 °C. An isocratic elution mode was preferred and was maintained by a quaternary pump (preceded by a degaser) at 0.08 mL/min using a 0.025 M H2SO4 solution. Finally, 10 µL of the sample was injected using an autosampler. Detection was ensured by a Refractive Index Detector operated at 40 °C. An external calibration curve was used ranging from 10 to 1000 ppm, and the following standards were used: formic acid 100% (Fisher Scientific, Saint-Laurent, QC, Canada), acetic acid 99.9% (Sigma-Aldrich, Oakville, ON, Canada), glycerol 99% (Sigma-Aldrich, Oakville, ON, Canada), glycolic acid 99% (Sigma-Aldrich, Oakville, ON, Canada) and ethanol 99% (Sigma-Aldrich, Oakville, ON, Canada).

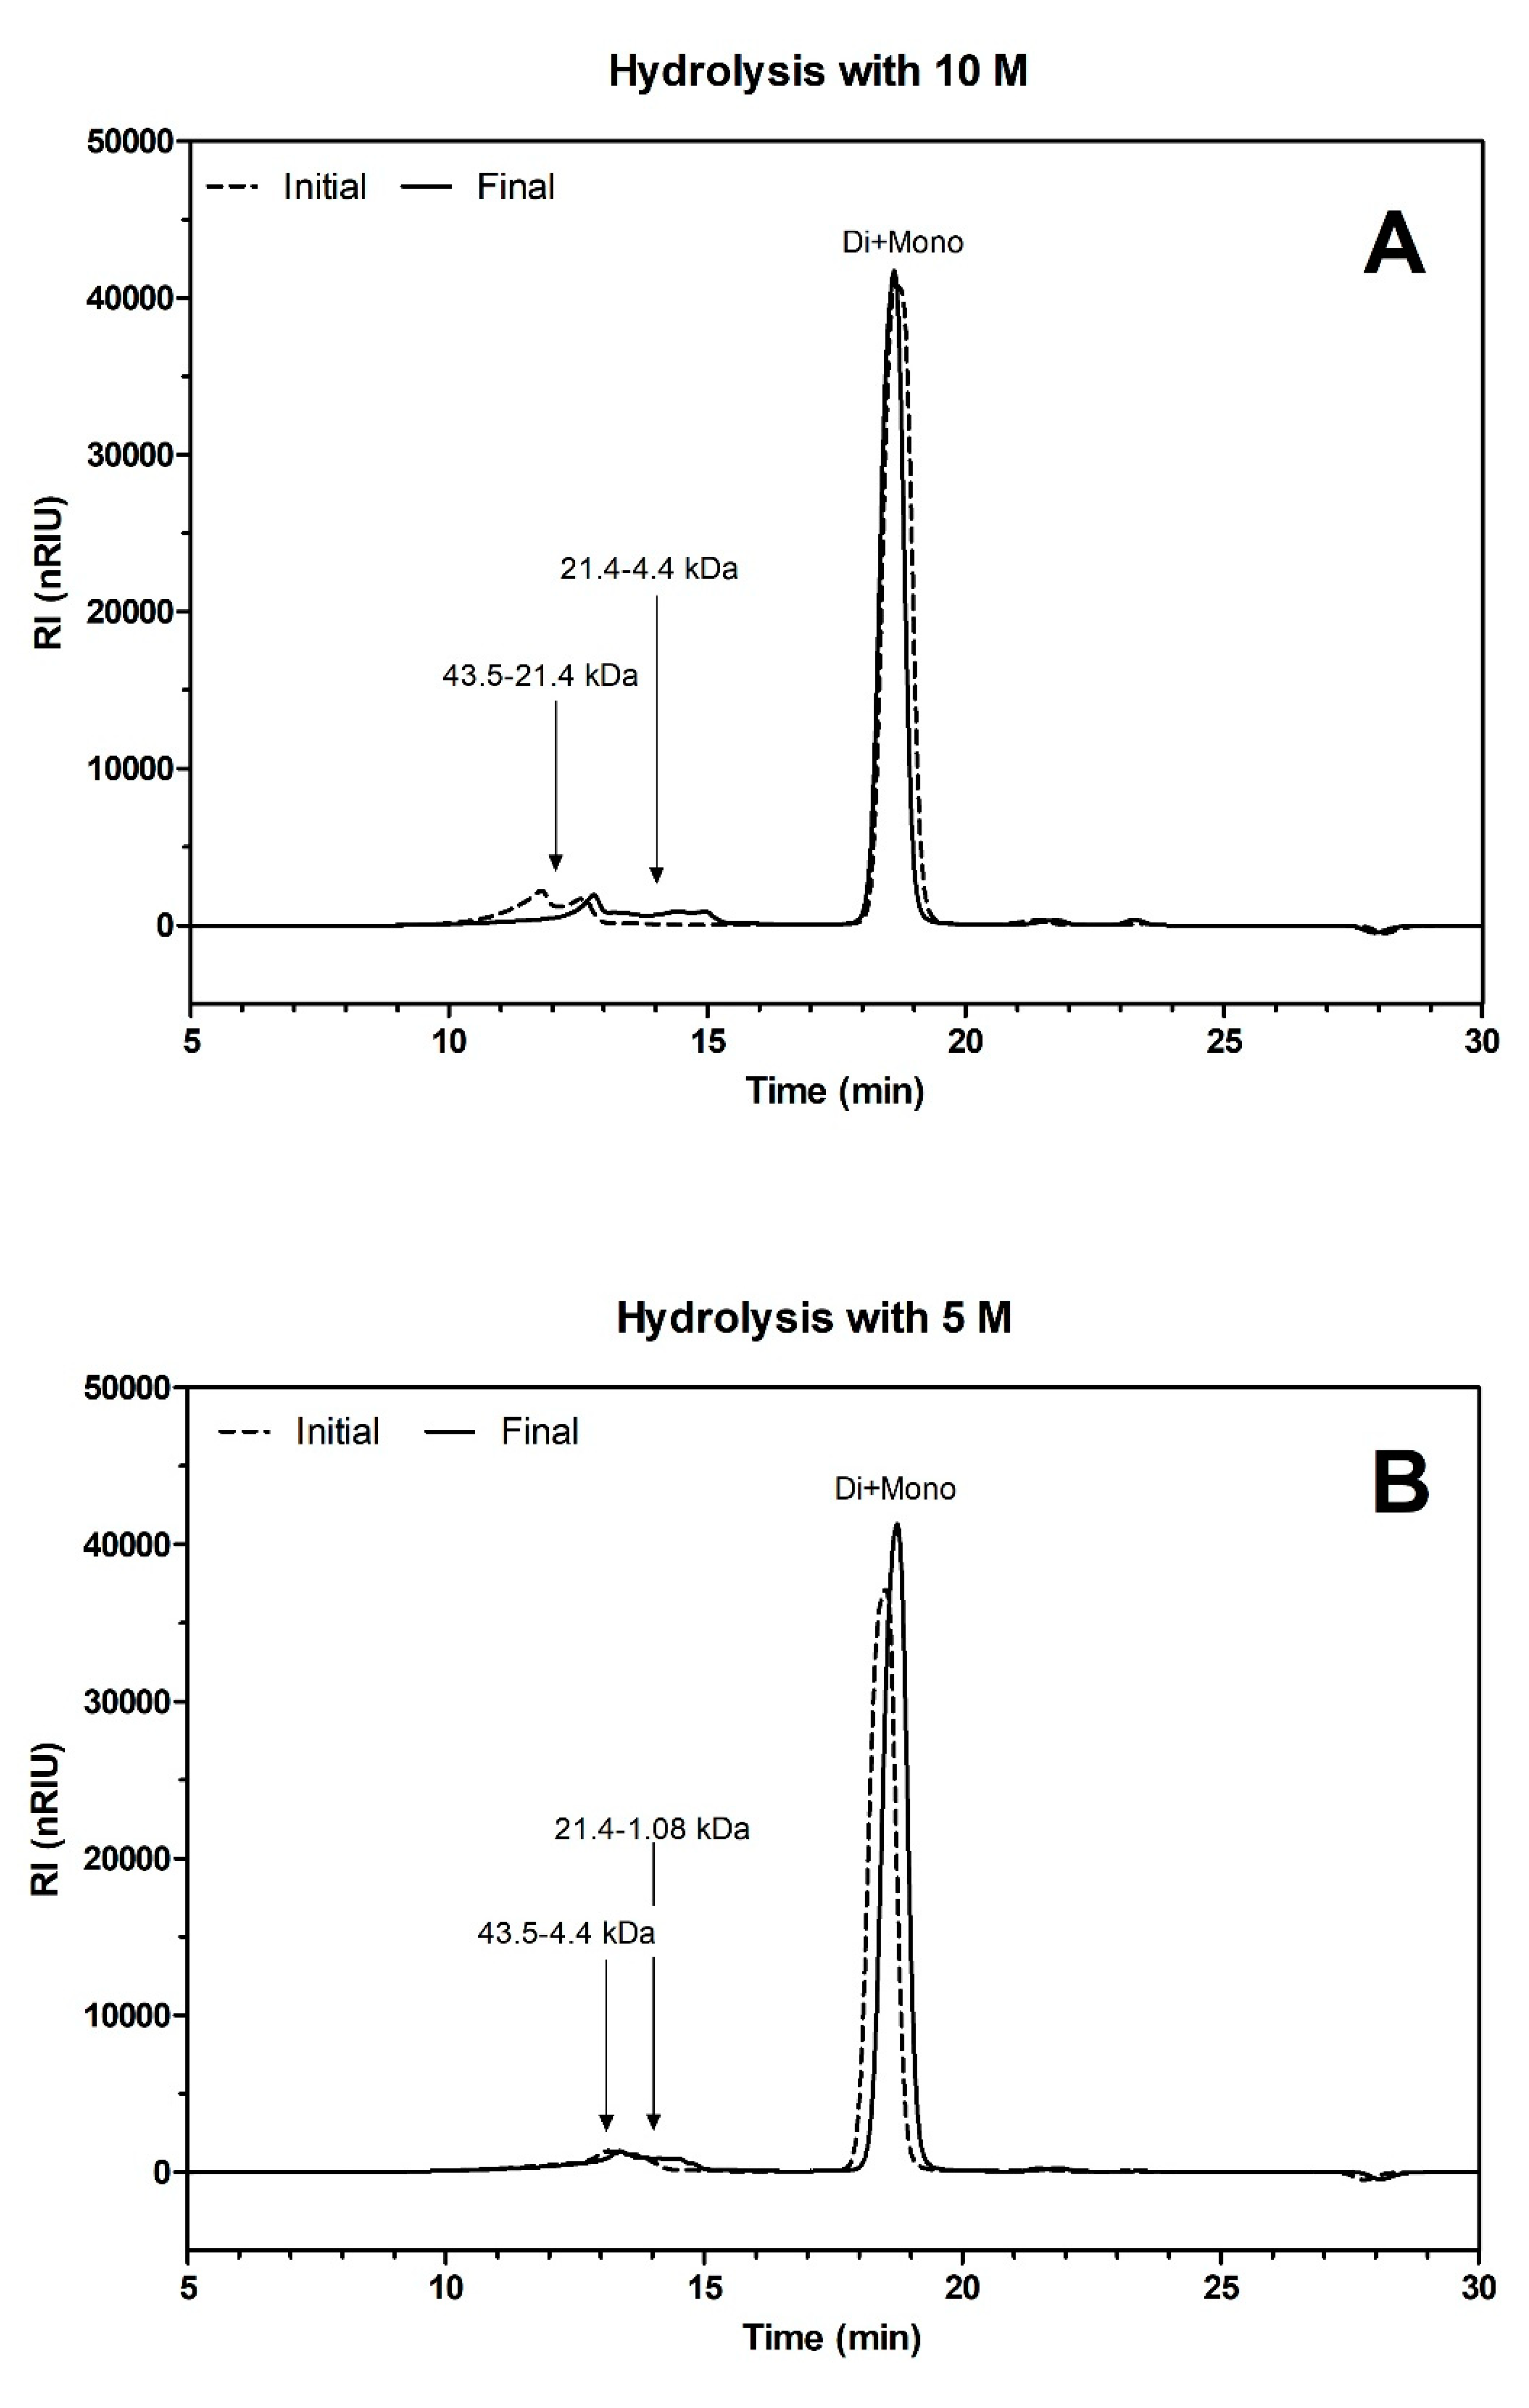
2.8. Size-Exclusion Chromatography

Size Exclusion experiments were performed on an Agilent 1100 series HPLC. (Agilent Technologies Inc., USA). Separation was performed on two Agilent PL aquagel-OH-20 Analytical columns (300 × 4.6, 5 µm) placed in-line and operated at 40 °C. Isocratic elution mode was used, and flow rate was maintained at 0.350 mL/min using a quaternary pump preceded by a degaser. Then, 20 µL of the sample was injected using an autosampler, and the detection was performed using a Refractive Index Detector maintained à 40 °C. A external calibration curve was used to correlate elution volumes to molecular sizes using a Dextran calibration standard kit (Phenomenex, Torrance, CA, USA).

2.9. Fermentation Parameters and Statistical Analysis

During the fermentation process, the pressure built inside the vials due to CO2 formation was eventually released. The corresponding mass of released CO2 was determined by weighting the vials before and after the gas release. Therefore, it is possible to estimate a theoretical value for ethanol production during the fermentation kinetics, by assuming that 1 g of glucose or fructose produces 0.49 g of carbon dioxide and 0.51 g of ethanol, according to the stoichiometry proportion presented by Equation (2) [24].
C 6 H 12 O 6 2 C 2 H 6 O + 2 CO 2
The other parameters evaluated at the end of the fermentation besides the final ethanol content (methodology described in Section 2.7), was the yield coefficient (YP/S) (g/g), the productivity rate (g/L/h), the substrate utilization rate (g/L/h) and the efficiency (%).
Y P / S = P r e a l S 0 S
Productivity = P r e a l t ( h )
Substrate   Utilization = S 0 S t
Efficiency = 100 × P r e a l P m a x i m u m
where Preal is the final ethanol content (g/L), S0 is the initial sugar concentration (g/L), S is the final sugar content (g/L), t is the total fermentation time (h) and Pmaximum is the ethanol content (g/L) if all the fermentable sugars were converted, considering that 1 g of sugar would ideally produce 0.51 g of ethanol (Equation (2)). The fermentable sugar content was quantified by the method described in Section 2.6, while the ethanol was quantified by the method described in Section 2.7.

3. Results

3.1. Initial Characterization
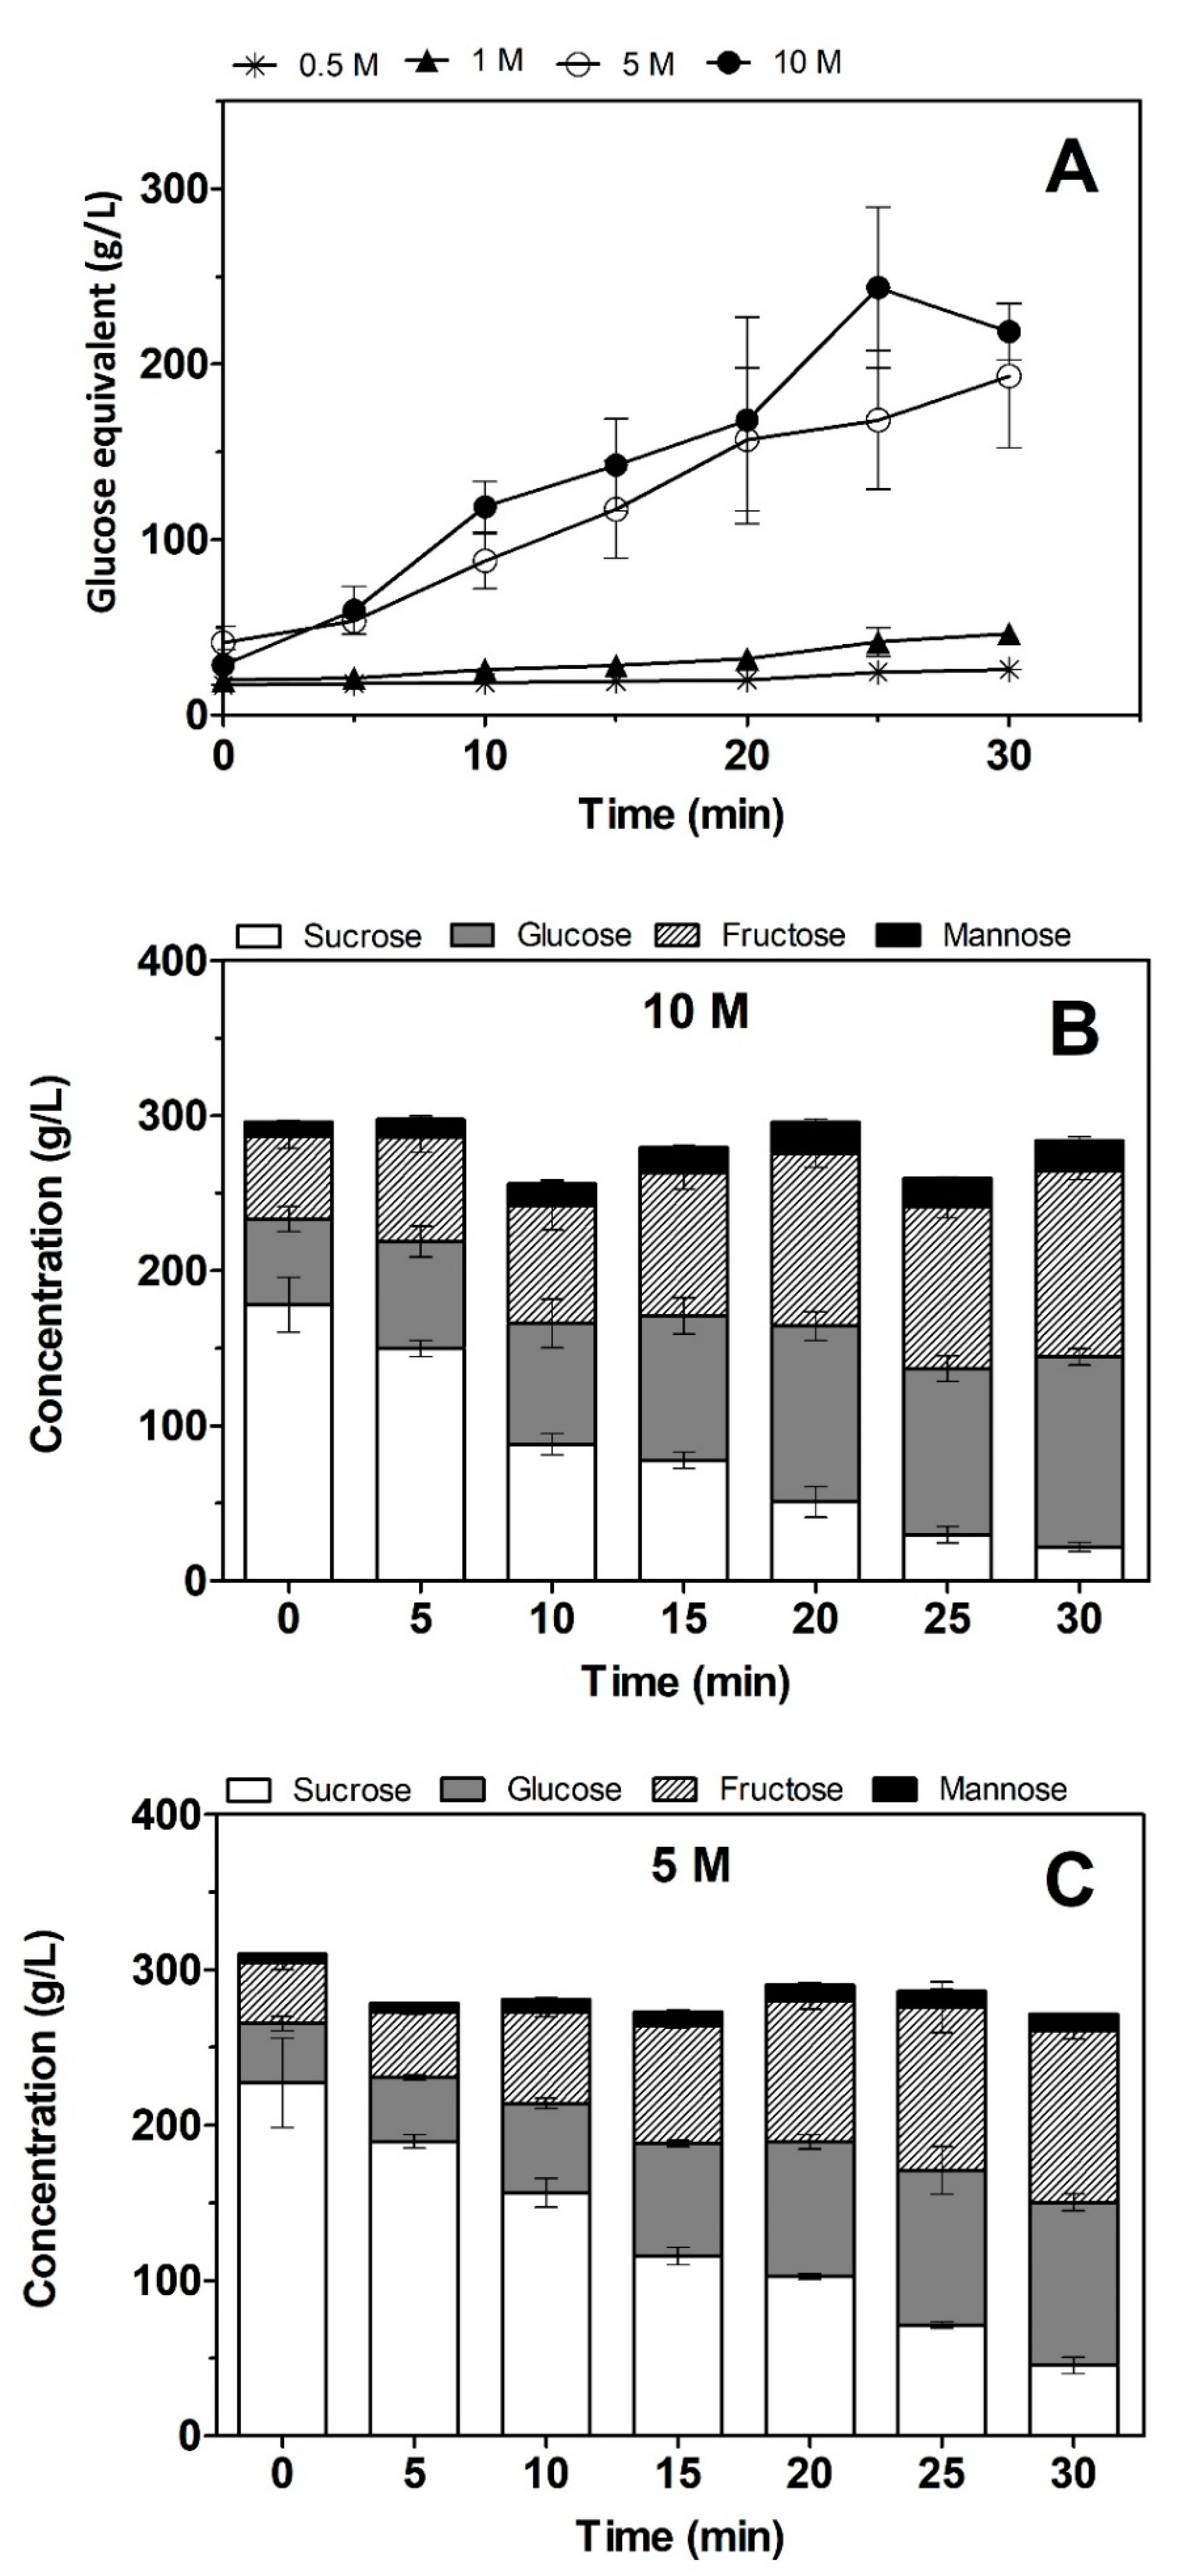
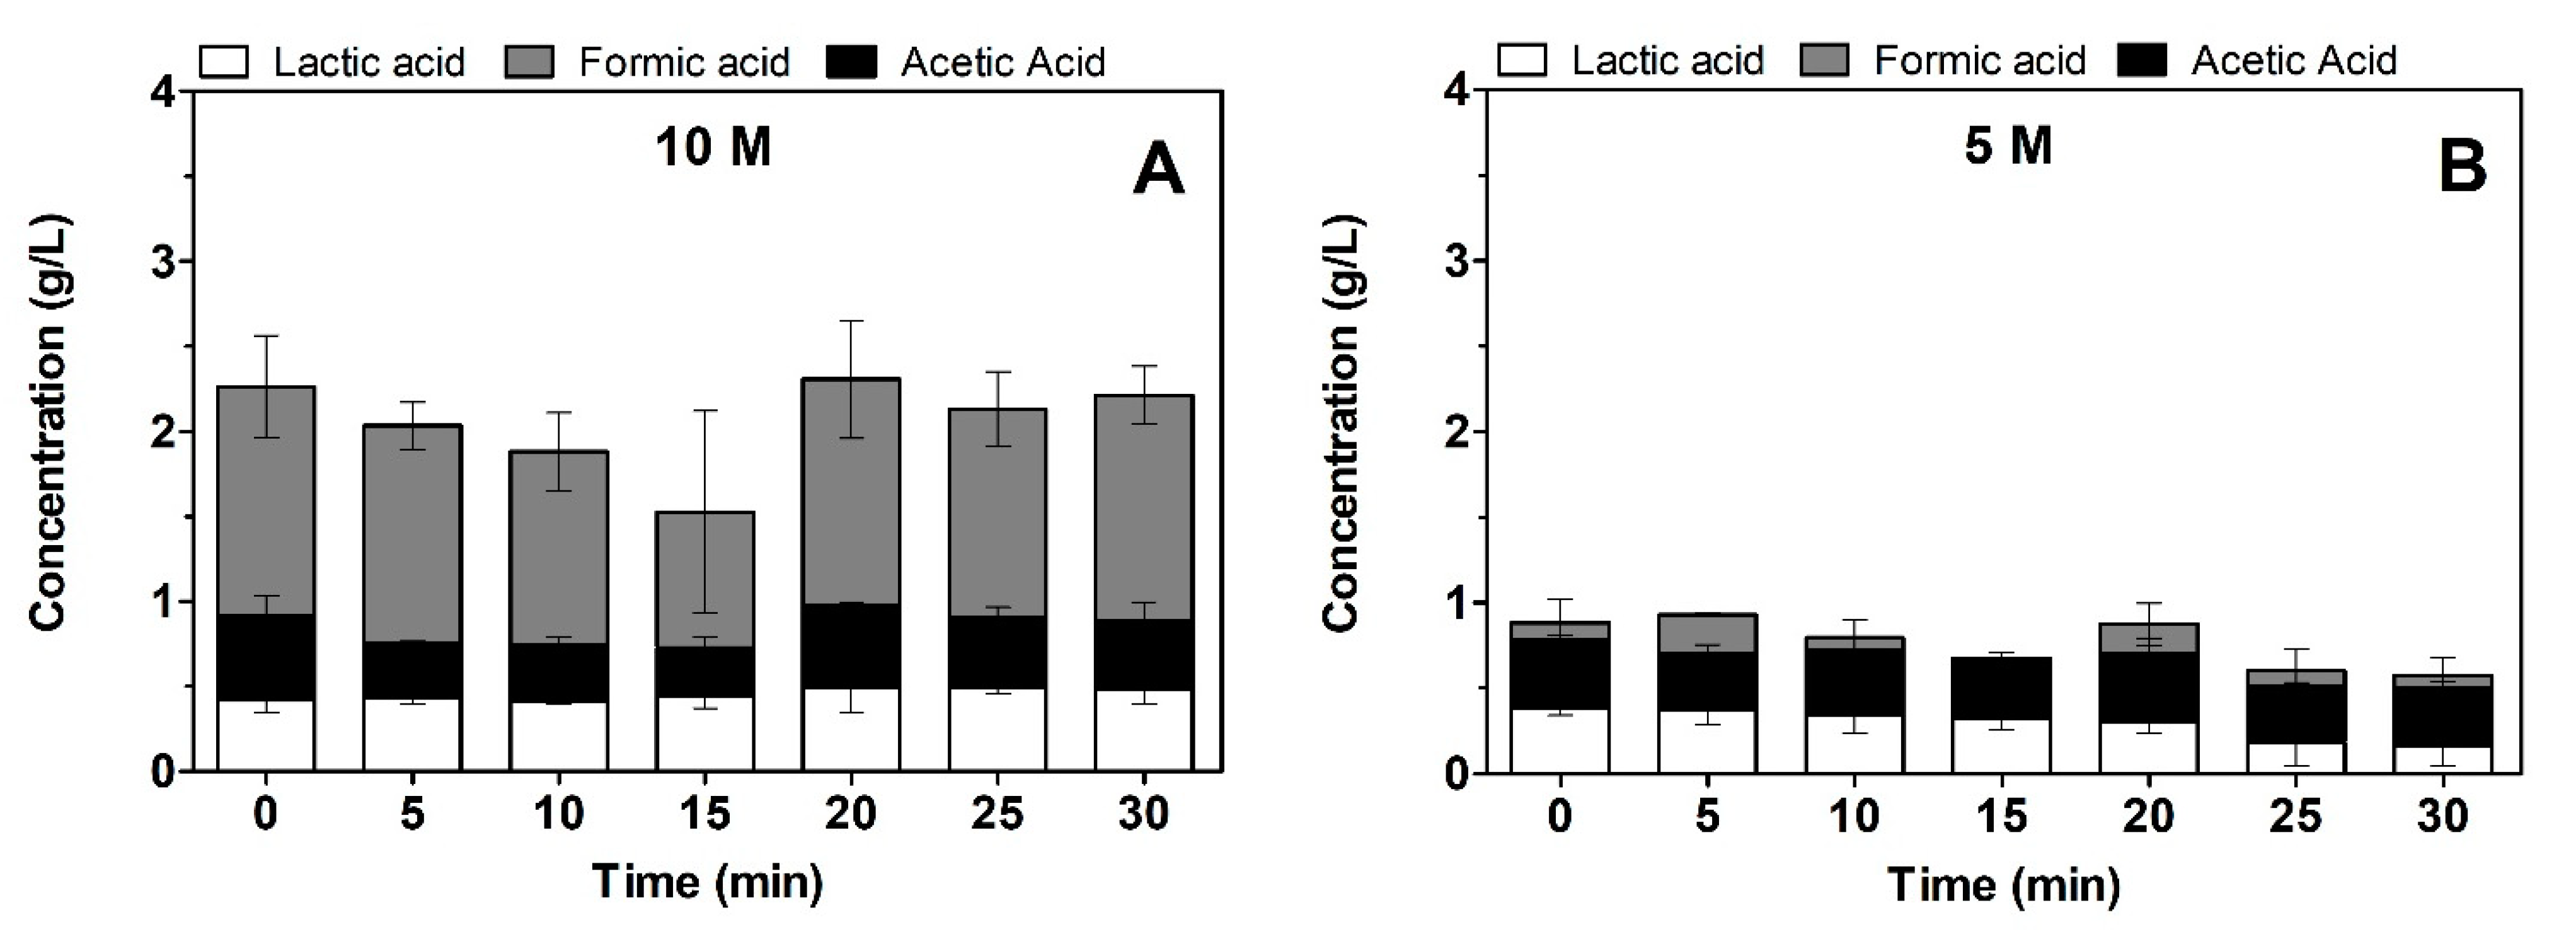
As a natural product, it is normal that small variations in the physical and chemical composition occur for different maple syrups [25]. Therefore, the maple syrups used in this study were initially characterized to evaluate their physical and chemical composition differences (Table 1). As expected, RMS presented a viscosity three times higher than MS and BMS. MS had a higher sucrose content (99% of the total sugar content) than RMS and BMS, both with 97%. Besides those two points, their physical–chemical characteristics were similar, with a pH close to neutral and low protein content. They were in accordance with what has been found in the literature regarding maple syrup composition [26].

3.2. Hydrolysis

Maple syrup is a complex matrix that naturally presents a low concentration of polysaccharides (dextrans and arabinogalactans for example) in its composition [27,28]. However, as mentioned before, if there is an excessive concentration of polysaccharides, it will ultimately lead to a change in the syrup viscosity, which is then considered as a defective syrup referred to ropy maple syrup [12]. The increase in the polysaccharides content is attributed to microbial growth, mainly by Bacillus aceris [10]. The use of acid to hydrolyze polysaccharides is a feasible option since acid hydrolysis has been successfully used on other polysaccharides as chitosan [29] and cellulose [30]. However, as smaller sugars are sensitive to a high severity factor (temperature and acid concentration) of acid hydrolysis, this study carried out the hydrolysis at a mild temperature (50 °C), while different levels of acid concentration and reaction time were evaluated to reach the best fermentation pretreatment.
Initially, a quantification of sugar reducing ends was performed on the samples that underwent the acid hydrolysis with different sulfuric acid concentrations (0.5, 1, 5 and 10 M) at 50 °C, as shown in Figure 1A. The increase in reducing ends indicates the breaking of chemical bonds, by producing smaller molecules composed of monomers that present reducing ends, which is the case for glucose and fructose (main monomers present in maple syrup) [31]. As can be seen in Figure 1, the use of lower sulfuric acid concentrations (0.5 and 1 M) did not promote an increase in the reducing ends in the maple syrup during the evaluated hydrolysis time. For this reason, the following chemical characterizations of the RMS polysaccharides hydrolysis will only be investigated for the highest concentrations of sulfuric acid (5 and 10 M).
The use of 5 and 10 M sulfuric acid already presents an increase in the reducing ends after a 5 min of reaction time. The production of reducing ends have a similar tendency for both concentrations and were not proportional to the acid concentration, a behavior that was also observed by Oberoi et al. [32]. They increased the acid concentration from 0.25% to 0.50% (w/v), but it resulted in a monomer increase from 35.13 to 37.55 g/L after the same reaction time of orange peel hydrolysis. The maximum of glucose equivalent (reducing ends) achieved by the 10 M of sulfuric acid (25 min) was 243.58 g/L, while at the same hydrolysis time, the solution with 5 M of sulfuric acid presented 168.02 g/L.
Since the solutions using 5 and 10 M H2SO4 were the ones with a significant increase in the reducing ends, the sugar profile of each point of the hydrolysis experiment was analyzed (Figure 2). The acid activity did not only target the polysaccharides, but also the sucrose present in the maple syrup. The decrease in the sucrose was faster in the 10 M H2SO4 solution, where a decrease of 51% was observed in the first 10 min, as compared to 31% in the 5 M H2SO4 solution for the same time range. In addition, the slight fluctuation of the sugar content along the hydrolysis time can be explained by the simultaneous reactions that occurred during acid hydrolysis. An example of this could be the degradation of monomers into other components, such as acetic acid, formic acid and hydroxymethylfurfural [33], while molecules with a higher degree of polymerization were hydrolyzed into sucrose, glucose and fructose.
Nonetheless, from the observations made on sucrose hydrolysis, the high conversion rates could lead to wondering if only sucrose was affected by the acid or if it worked as well to reduce the length of the molecules with higher molecular masses, which in this case was the objective. To verify that, the samples of the syrup before and after 25 min of hydrolysis were submitted to size exclusion chromatography, to characterize the molecular size distribution. Thus, the samples that were obtained using 5 and 10 M H2SO4 were analyzed, since the ones hydrolyzed with lower acid concentrations initially did not present any increase in the reducing ends.
Those molecular size distributions are represented in Figure 2. It is possible to observe that for both sulfuric acid concentrations, there was an impact on the polymers contained in the RMS. Although Figure 1B,C shows almost the complete hydrolysis of sucrose into fructose and glucose, the chromatogram also shows that there was a notable decrease in the molecular sizes of the bigger molecules. For the sample hydrolyzed using 10 M H2SO4, the parcel with higher molecular size decreased from 43.50–21.40 to 21.40–4.40 kDa. The decrease in the molecular size of the sample hydrolyzed with 5 M H2SO4 was lower, from 43.50–4.40 to 21.40–1.08 kDa, but still present. Lagacé et al. (2018) analyzed three different ropy maple syrups and concluded that the polysaccharide molecular sizes have a great range, i.e., from <1 kDa to more than 800 kDa [12], in accordance with what is shown in Figure 2.
Finally, to evaluate if the acid hydrolysis would be a good pretreatment for the RMS, it was important to know if it would produce any fermentation inhibitors. When sugars are submitted to high temperatures and acidic conditions, they can lead to the formation of 5-hydroximethylfurfural, levulinic acid, acetic acid and formic acid for example [34]. Those substances are inhibitors for microorganisms, therefore, they can lead to a reduction of both fermentation yield and productivity [35]. The maple syrup samples used in this work already had a small amount of lactic and acetic acid, and for both sulfuric acid concentrations, concentration of these organic acids was not altered during the hydrolysis time (Figure 3). Therefore, in this case, the acid treatment did not result in acetic acid formation. However, there was a higher amount of formic acid in the samples hydrolyzed with 10 M H2SO4. This might be explained by the decomposition of glucose into such an acid due to the higher severity induced by this concentration of sulfuric acid [36]. As the inhibitor concentrations were low, the acid hydrolysis presented a good potential to be used as fermentation pre-treatment for the RMS fermentation.

3.3. Ethanol Production

The acid hydrolysis demonstrated a good potential to be used to decrease the polysaccharide molecular sizes contained in the RMS and to avoid fermentation inhibitor production. Thus, it was necessary to evaluate the fermentation performance of the syrups treated with this technique. In addition, the fermentability of BMS was also evaluated in order to analyze the potential of defective maple syrups to be used as fermentation feedstock for ethanol production. MS was also fermented to compare the performance of the defective ones, as well as a synthetic media (YPD) as control.
Gas production during the fermentation was quantified to calculate the theoretical ethanol production during the process time (Figure 4). The use of maple syrup as fermentation feedstock was successful, presenting a better performance than the YPD media, for example. Similar to other complex feedstock, such as sugarcane molasses [37] and sugar beet molasses [38], the presence of micronutrients and minerals in the maple syrups were beneficial for the ethanol production when compared with the synthetic media YPD.
On the preliminary analysis of the fermentation, RMS and BMS presented similar gas production as regular maple syrup, which could be an indication of their good potential as a fermentation feedstock. Conversely, the maple syrups hydrolyzed with 5 and 10 M H2SO4 produced less gas during the fermentation, which might be the signal of a less effective fermentation when compared to the later three feedstocks.
The exact final ethanol concentrations of each condition were quantified, and the results were slightly different from the ones presented in Figure 4. The projection of ethanol production through the mass loss overestimated the quantification for all groups, as it was previously reported by the literature [24]. Regardless, maple syrup proved to be a great option for ethanol fermentation feedstock, with a high efficiency, productivity, and final ethanol concentration (Table 2). The different maple syrups produced ethanol in a similar concentration as other well-established feedstock (Table 3).
Therefore, fermentation emerges as a great option to valorize declassified and out of food grade maple syrups, which is the case of the RMS and BMS as mentioned before. The fermentation performance of BMS without any pretreatment was as good as regular maple syrup, as can be seen in Table 2. The DMDS concentration in it did not hinder the fermentation, as usually occurs with other sulfur compounds such as sulfites [41].
The RMS did not have as good a performance as the regular maple syrup. It presented a decrease in more than 10 g/L of ethanol at the final point when compared with the latter. This might be related to the fermentable sugars that are “trapped” in the polysaccharide chains, for which the yeast might take a longer time to hydrolyze assuming of course that it is able to hydrolyze them. However, the acid hydrolysis was able to bring back the initial fermentation potential of the RMS. The RMS5 could bring back the original fermentability to the RMS, since after the pretreatment, it presented the same performance as regular maple syrup. In the case of the RMS10, the opposite happened. It produced the same quantity of ethanol as the RMS without pretreatment. This might be related to the higher inhibitor concentration in the media (Figure 3) and the higher salt content present in the sample with 10 M H2SO4 versus in the sample with 5 M H2SO4. The amount of base required to neutralize the pH in the latter was much higher, therefore implying in a much higher osmotic pressure.

4. Conclusions

The defective maple syrups, RMS and BMS, showed to be a high potential feedstock to produce ethanol, being comparable to other well-established feedstock. The BMS did not require any pretreatment to be fermented. The acid hydrolysis using 5 M H2SO4 restored the fermentation potential of the RMS to levels of the standard MS. Therefore, this study determined an acid pretreatment for the RMS in mild conditions (50 °C, 25 min) to explore the maximum fermentation capacity of RMS. Finally, the use of these defective syrups to produce biofuels was never reported in the literature until the conception date of this paper.

Author Contributions

Conceptualization, J.M.d.M.D., T.G. and J.-M.L.; methodology, J.M.d.M.D.; formal analysis, J.M.d.M.D. and T.G.; resources, T.G. and J.-M.L.; writing—original draft preparation, J.M.d.M.D. and A.Á.M.N.; writing—review and editing, A.Á.M.N., T.G. and J.-M.L.; supervision, T.G. and J.-M.L.; project administration, T.G. and J.-M.L.; funding acquisition, J.-M.L. All authors have read and agreed to the published version of the manuscript.

Funding

This research was funded by the Ministère des Affaires Municipales et de l’Habitation (MAMH) du Québec.

Institutional Review Board Statement

Not applicable.

Informed Consent Statement

Not applicable.

Data Availability Statement

Data is contained within the article.

Acknowledgments

The authors are grateful to the Biomass, Bioproducts and Bioprocess Analysis Laboratory (a part of the Biomass Technology Laboratory) for its valuable support regarding various sample analyses.

Conflicts of Interest

The authors declare no conflict of interest.

References

  1. Canada Statistical Overview of the Canadian Maple Industry. Available online: https://agriculture.canada.ca/en/canadas-agriculture-sectors/horticulture/horticulture-sector-reports/statistical-overview-canadian-maple-industry-2020 (accessed on 10 December 2021).
  2. Producteurs et Productrices Acéricoles du Québec 2020 Activity Report. Available online: https://ppaq.ca/en/our-publications/annual-reports/ (accessed on 10 December 2021).
  3. Acer Division Inspection Inc. Vérification de la qualité du sirop d’érable en vrac. Available online: https://gestion.centreacer.qc.ca/fr/UserFiles/Documents/ppaq_depliantacer_infographics_2021-final.pdf (accessed on 10 December 2021).
  4. Caughron, A.; Legault, S.; Haut, C.; Houle, D.; Reynolds, T.W. A Changing Climate in the Maple Syrup Industry: Variation in Canadian and U.S.A. Producers’ Climate Risk Perceptions and Willingness to Adapt Across Scales of Production. Small-Scale For. 2020, 20, 73–95. [Google Scholar] [CrossRef]
  5. Jennifer, J.P.; Maria, C.F. A Comprehensive Review of Maple Sap Microbiota and Its Effect on Maple Syrup Quality. Food Rev. Int. 2020, 1–20. [Google Scholar] [CrossRef]
  6. Camara, M.; Cournoyer, M.; Sadiki, M.; Martin, N. Characterization and Removal of Buddy Off-Flavor in Maple Syrup. J. Food Sci. 2019, 84, 1538–1546. [Google Scholar] [CrossRef] [PubMed]
  7. N’guyen, G.Q.; Martin, N.; Jain, M.; Lagacé, L.; Landry, C.R.; Filteau, M. A systems biology approach to explore the impact of maple tree dormancy release on sap variation and maple syrup quality. Sci. Rep. 2018, 8, 14658. [Google Scholar] [CrossRef] [PubMed] [Green Version]
  8. Jose Garcia, E.; McDowell, T.; Ketola, C.; Jennings, M.; David Miller, J.; Renaud, J.B. Metabolomics reveals chemical changes in Acer saccharum sap over a maple syrup production season. PLoS ONE 2020, 15, e0235787. [Google Scholar] [CrossRef]
  9. Pelletier, M.; Lagacé, L. Forêts de Chez Nous. 2018, pp. 1–5. Available online: https://ppaq.ca/en/our-publications/forets-de-chez-nous-magazine/ (accessed on 25 January 2022).
  10. Britten, M.; Morin, A. Functional characterization of the exopolysaccharide from enterobacter agglomerans grown on low-grade maple sap. LWT Food Sci. Technol. 1995, 28, 264–271. [Google Scholar] [CrossRef]
  11. Fabian, F.W.; Buskirk, H.H. Aërobacter aërogenes as a Cause of Ropiness in Maple Sirup. Ind. Eng. Chem. 1935, 27, 349–350. [Google Scholar] [CrossRef]
  12. Lagacé, L.; Camara, M.; Leclerc, S.; Charron, C.; Sadiki, M. Chemical and microbial characterization of ropy maple sap and syrup. Maple Syrup Dig. 2018, 9–19. [Google Scholar]
  13. Règlement des Producteurs Acéricoles sur les Normes de Qualité et le Classement; Government of Quebec (CA): Québec, QC, Canada, 2021; pp. 1–10.
  14. Ball, D.W. The Chemical Composition of Maple Syrup. J. Chem. Educ. 2007, 84, 1647–1650. [Google Scholar] [CrossRef]
  15. Stuckel, J.G.; Low, N.H. The chemical composition of 80 pure maple syrup samples produced in North America. Food Res. Int. 1996, 29, 373–379. [Google Scholar] [CrossRef]
  16. Heiligmann, R.B.; Koelling, M.R.; Perkins, T.D. (Eds.) North American Maple Syrup Producers Manual, 2nd ed.; The Ohio State University: Columbus, OH, USA, 2006. [Google Scholar]
  17. He, M.; Qin, H.; Yin, X.; Ruan, Z.; Tan, F.; Wu, B.; Shui, Z.; Dai, L.; Hu, Q. Direct ethanol production from dextran industrial waste water by Zymomonas mobilis. Korean J. Chem. Eng. 2014, 31, 2003–2007. [Google Scholar] [CrossRef]
  18. Kim, J.H.; Ryu, J.; Huh, I.Y.; Hong, S.-K.; Kang, H.A.; Chang, Y.K. Ethanol production from galactose by a newly isolated Saccharomyces cerevisiae KL17. Bioprocess Biosyst. Eng. 2014, 37, 1871–1878. [Google Scholar] [CrossRef] [PubMed]
  19. Horisawa, S.; Ando, H.; Ariga, O.; Sakuma, Y. Direct ethanol production from cellulosic materials by consolidated biological processing using the wood rot fungus Schizophyllum commune. Bioresour. Technol. 2015, 197, 37–41. [Google Scholar] [CrossRef] [PubMed]
  20. Gouvernement du Québec 2030 Plan for a Green Economy. Available online: https://www.quebec.ca/en/government/policies-orientations/plan-green-economy (accessed on 10 December 2021).
  21. Bradford, M.M. A rapid and sensitive method for the quantitation of microgram quantities of protein utilizing the principle of protein-dye binding. Anal. Biochem. 1976, 72, 248–254. [Google Scholar] [CrossRef]
  22. Demeke, M.M.; Dietz, H.; Li, Y.; Foulquié-Moreno, M.R.; Mutturi, S.; Deprez, S.; Den Abt, T.; Bonini, B.M.; Liden, G.; Dumortier, F.; et al. Development of a D-xylose fermenting and inhibitor tolerant industrial Saccharomyces cerevisiae strain with high performance in lignocellulose hydrolysates using metabolic and evolutionary engineering. Biotechnol. Biofuels 2013, 6, 89. [Google Scholar] [CrossRef] [Green Version]
  23. Miller, G.L. Use of Dinitrosalicylic Acid Reagent for Determination of Reducing Sugar. Anal. Chem. 1959, 31, 426–428. [Google Scholar] [CrossRef]
  24. Beigbeder, J.-B.; de Medeiros Dantas, J.M.; Lavoie, J.-M. Optimization of Yeast, Sugar and Nutrient Concentrations for High Ethanol Production Rate Using Industrial Sugar Beet Molasses and Response Surface Methodology. Fermentation 2021, 7, 86. [Google Scholar] [CrossRef]
  25. Gad, H.A.; Ramadan, M.F.; Farag, M.A. Authentication and quality control determination of maple syrup: A comprehensive review. J. Food Compos. Anal. 2021, 100, 103901. [Google Scholar] [CrossRef]
  26. Mohammed, F.; Sibley, P.; Guillaume, D.; Abdulwali, N. Chemical composition and mineralogical residence of maple syrup: A comprehensive review. Food Chem. 2022, 374, 131817. [Google Scholar] [CrossRef]
  27. Sun, J.; Ma, H.; Seeram, N.P.; Rowley, D.C. Detection of Inulin, a Prebiotic Polysaccharide, in Maple Syrup. J. Agric. Food Chem. 2016, 64, 7142–7147. [Google Scholar] [CrossRef] [Green Version]
  28. Brochu, M.; Lafrance, C.P.; Landry, E.; Maheux, M. Isolation and characterization of major polysaccharides from maple sugar. Bioact. Carbohydrates Diet. Fibre 2019, 17, 100174. [Google Scholar] [CrossRef]
  29. Yan, X.; Evenocheck, H.M. Chitosan analysis using acid hydrolysis and HPLC/UV. Carbohydr. Polym. 2012, 87, 1774–1778. [Google Scholar] [CrossRef]
  30. Smits, J.; van Haastert, M.; Janse, A.M.C.; Maas, J.; de Graaf, K.; Kroon, H.; Verlinden, R.A.J.; Happel, A. Scale-up of optimal mild-acid pretreatment conditions in the production and application of lignocellulosic sugars from wood. Bioresour. Technol. Rep. 2020, 9, 100361. [Google Scholar] [CrossRef]
  31. Taga, A.; Kodama, S. Analysis of reducing carbohydrates and fructosyl saccharides in maple syrup and maple sugar by CE. Chromatographia 2012, 75, 1009–1016. [Google Scholar] [CrossRef]
  32. Oberoi, H.S.; Vadlani, P.V.; Madl, R.L.; Saida, L.; Abeykoon, J.P. Ethanol production from orange peels: Twostage hydrolysis and fermentation studies using optimized parameters through experimental design. J. Agric. Food Chem. 2010, 58, 3422–3429. [Google Scholar] [CrossRef]
  33. Liu, S.; Lu, H.; Hu, R.; Shupe, A.; Lin, L.; Liang, B. A sustainable woody biomass biorefinery. Biotechnol. Adv. 2012, 30, 785–810. [Google Scholar] [CrossRef]
  34. Jeong, H.S.; Jang, S.K.; Kim, H.Y.; Yeo, H.; Choi, J.W.; Choi, I.G. Effect of freeze storage on hemicellulose degradation and enzymatic hydrolysis by dilute-acid pretreatment of Mongolian oak. Fuel 2016, 165, 145–151. [Google Scholar] [CrossRef]
  35. Huang, H.J.; Ramaswamy, S.; Tschirner, U.W.; Ramarao, B.V. A review of separation technologies in current and future biorefineries. Sep. Purif. Technol. 2008, 62, 1–21. [Google Scholar] [CrossRef]
  36. Kupiainen, L.; Ahola, J.; Tanskanen, J. Kinetics of glucose decomposition in formic acid. Chem. Eng. Res. Des. 2011, 89, 2706–2713. [Google Scholar] [CrossRef]
  37. Barbosa, H.S.; de Abreu Silveira, E.; Miranda, M.; Ernandes, J.R. Efficient very-high-gravity fermentation of sugarcane molasses by industrial yeast strains. J. Inst. Brew. 2016, 122, 329–333. [Google Scholar] [CrossRef] [Green Version]
  38. Vučurović, V.M.; Puškaš, V.S.; Miljić, U.D. Bioethanol production from sugar beet molasses and thick juice by free and immobilised Saccharomyces cerevisiae. J. Inst. Brew. 2018, 125, 134–142. [Google Scholar] [CrossRef]
  39. Darvishi, F.; Moghaddami, N.A. Optimization of an industrial medium from molasses for bioethanol production using the Taguchi statistical experimental-design method. Fermentation 2019, 5, 14. [Google Scholar] [CrossRef] [Green Version]
  40. Klasson, K.T.; Boone, S.A. Bioethanol fermentation of clarified sweet sorghum (Sorghum bicolor (L.) Moench) syrups sealed and stored under vegetable oil. Ind. Crop. Prod. 2021, 163, 113330. [Google Scholar] [CrossRef]
  41. Lamas, A.; Miranda, J.; Vázquez, B.; Cepeda, A.; Franco, C. An Evaluation of Alternatives to Nitrites and Sulfites to Inhibit the Growth of Salmonella enterica and Listeria monocytogenes in Meat Products. Foods 2016, 5, 74. [Google Scholar] [CrossRef] [PubMed]
Figure 1. Acid hydrolysis (50 °C) of polysaccharides from RMS: (A) Effect of sulfuric acid concentration on reducing sugars content. (B) Sugar profile of ropy maple syrup during hydrolysis with 10 M sulfuric acid. (C) Sugar profile of ropy maple syrup during hydrolysis with 5 M sulfuric acid.
Fermentation 08 00058 g001
Figure 2. Size distribution of molecules in the ropy maple syrup before and after hydrolysis with 10 M (A) and 5 M (B) sulfuric acid at 50 °C.
Fermentation 08 00058 g002
Figure 3. Organic acids profile in ropy maple syrup solution during different hydrolysis times with 10 M (A) and 5 M (B) sulfuric acid solution at 50 °C.
Fermentation 08 00058 g003
Figure 4. Fermentation kinetics of regular maple syrup (MS), ropy maple syrup (RMS), ropy maple syrup hydrolyzed with 10 M sulfuric acid (RMS10), ropy maple syrup hydrolyzed with 5 M sulfuric acid (RMS5), buddy maple syrup (BMS) and synthetic media (YPD) at 30 °C and 140 rpm. All the groups were under the same conditions.
Fermentation 08 00058 g004
Table 1. Physical–chemical characterization of maple syrup (MS), ropy maple syrup (RMS) and buddy maple syrup (BMS).
ParameterMSRMSBMS
Soluble solids (°Bx)67.80 ± 0.5066.23 ± 0.4166.70 ± 0.32
Density (g/mL)1.31 ± 0.011.32 ± 0.011.32 ± 0.01
Viscosity (cP)130.55 ± 3.96427.79 ± 7.57172.49 ± 7.91
Lactic Acid (g/L)1.20 ± 0.023.75 ± 0.052.77 ± 0.04
Acetic Acid (g/L)2.94 ± 0.011.53 ± 0.013.70 ± 0.02
Sucrose (g/L)577.49 ± 0.15538.99 ± 1.84542.75 ± 5.39
Glucose (g/L)2.60 ± 0.548.43 ± 0.8511.12 ± 0.95
Fructose (g/L)1.92 ± 0.016.99 ± 0.05 5.12 ± 0.10
pH7.11 ± 0.017.72 ± 0.027.10 ± 0.01
Protein (g/L)0.35 ± 0.070.29 ± 0.02 0.35 ± 0.03
Table 2. Kinetics parameters of ethanol fermentation using different maple syrups as substrate.
MediaEthanol Conc. (g/L)Ethanol % (v/v)YP/S, Yield Coeff. (g/g)Productivity (g/L/h)Substrate Utilization Rate (g/L/h)Efficiency (%)
MS88.69 ± 12.7311.24 ± 1.610.52 ± 0.010.92 ± 0.131.76 ± 0.2295.34 ± 6.46
RMS74.92 ± 5.789.49 ± 0.730.51 ± 0.000.78 ± 0.061.53 ± 0.1290.08 ± 9.41
RMS1072.53 ± 12.299.19 ± 1.560.51 ± 0.000.76 ± 0.131.47 ± 0.2487.86 ± 14.69
RMS589.16 ± 1.0711.30 ± 0.140.53 ± 0.040.93 ± 0.011.74 ± 0.1395.66 ± 4.88
BMS86.44 ± 9.2410.96 ± 1.170.50 ± 0.070.90 ± 0.101.80 ± 0.0693.34 ± 9.41
YPD60.56 ± 9.627.67 ± 1.220.41 ± 0.050.63 ± 0.101.52 ± 0.0978.38 ± 10.45
Table 3. Ethanol production of other well-stablished feedstocks.
FeedstockEthanol % (v/v)Reference
Sugar beet molasses11.0[39]
Sugarcane molasses14.0[37]
Sweet sorghum11.0[40]
Publisher’s Note: MDPI stays neutral with regard to jurisdictional claims in published maps and institutional affiliations.

