Article

Production of Exopolysaccharides by Cultivation of Halotolerant Bacillus atrophaeus BU4 in Glucose- and Xylose-Based Synthetic Media and in Hydrolysates of Quinoa Stalks

1
Department of Chemistry, Umeå University, SE-901 87 Umeå, Sweden
2
Instituto de Investigación y Desarrollo de Procesos Químicos, Chemical Engineering, Faculty of Engineering, Universidad Mayor de San Andrés, La Paz P.O. Box 12958, Bolivia
3
Viceministerio de Producción Industrial a Mediana y Gran Escala, Ministerio de Desarrollo Productivo y Economía Plural, La Paz P.O. Box 12958, Bolivia
4
Department of Agrifood and Bioscience, RISE Research Institutes of Sweden AB, P.O. Box 857, SE-501 15 Borås, Sweden
5
Thermochemical Energy Conversion Laboratory, Department of Applied Physics and Electronics, Umeå University, SE-901 87 Umeå, Sweden
6
Department of Biotechnology, Inland Norway University of Applied Sciences, N-2317 Hamar, Norway
*
Author to whom correspondence should be addressed.
Submission received: 23 December 2021 / Revised: 3 February 2022 / Accepted: 10 February 2022 / Published: 14 February 2022
(This article belongs to the Special Issue Food Wastes: Feedstock for Value-Added Products: 3rd Edition)

Abstract

:
A halotolerant, exopolysaccharide-producing bacterium isolated from the Salar de Uyuni salt flat in Bolivia was identified as Bacillus atrophaeus using next-generation sequencing. Comparisons indicate that the genome most likely (p-value: 0.0024) belongs to a subspecies previously not represented in the database. The growth of the bacterial strain and its ability to produce exopolysaccharides (EPS) in synthetic media with glucose or xylose as carbon sources, and in hydrolysates of quinoa stalks, was investigated. The strain grew well in all synthetic media, but the growth in glucose was better than that in xylose. Sugar consumption was better when initial concentrations were low. The growth was good in enzymatically produced cellulosic hydrolysates but was inhibited in hemicellulosic hydrolysates produced using hydrothermal pretreatment. The EPS yields were up to 0.064 g/g on initial glucose and 0.047 g/g on initial xylose, and was higher in media with relatively low sugar concentrations. The EPS was isolated and purified by a sequential procedure including centrifugation, cold ethanol precipitation, trichloroacetic acid treatment, dialysis, and freeze-drying. Glucose and mannose were the main sugars identified in hydrolyzed EPS. The EPS was characterized by size-exclusion chromatography, Fourier-transform infrared (FTIR) spectroscopy, heteronuclear single-quantum coherence nuclear magnetic resonance (HSQC NMR) spectroscopy, scanning electron microscopy, X-ray diffraction, and thermogravimetric analysis. No major differences were elucidated between EPS resulting from cultivations in glucose- or-xylose-based synthetic media, while some divergences with regard to molecular-weight averages and FTIR and HSQC NMR spectra were detected for EPS from hydrolysate-based media.

1. Introduction

Investigating the potential of extremophiles, e.g., microorganisms isolated from particular ecosystems characterized by extreme conditions regarding temperature, salinity, acidity, UV radiation, aeration, pressure, or contamination, is of high importance for producing bulk chemicals, materials, biofuels, and other products by next-generation industrial biotechnology approaches [1,2]. One such group of extremophiles include halophilic and halotolerant microorganisms, i.e., microorganisms capable of surviving in salt-rich habitats, where the salinity can be even higher than that of sea water. Depending on the optimal salt concentration required for growth, they can be classified into extreme halophiles, moderate halophiles, and slight halophiles [3]. For slight halophiles, which include halotolerant bacteria, salt presence is not a requirement to growth, but they can tolerate salinity levels between 1 and 5% (w/v) NaCl [1]. Microbes living in high-salinity habitats have developed adaptive mechanisms to support growth under the adverse conditions induced by high salt concentrations. These include accumulation of inorganic ions or organic solutes to balance the osmotic pressure of the environment, synthesis of salt-stable enzymes, and production of biopolymers, such as exopolysaccharides (EPS).
EPS are extracellular polymers that are secreted by microorganisms in high-salt ecosystems. EPS surround microbes either through close attachment to the cell wall or through being loosely bound onto the cell surface as slime. They influence the physicochemical environment in the proximity of the cells, enhancing their survival [4]. The unique properties of EPS and their ecofriendly features, such as biodegradability, renewability, and non-toxicity, contribute to making them interesting substitutes for synthetic polymers. The high viscosity of EPS makes them useful as rheological modifiers in food and cosmetic products [5]. EPS are also of high interest for pharmaceutical and biomedical applications, as conjugates for intelligent drug delivery, anticancer drug-targeting, tissue engineering [6], or as enhancers of immunomodulatory, antiviral, anti-inflammatory, or antioxidant activities [7]. They can also be used in bioremediation of contaminated soils [8] and in wastewater treatment [9]. Furthermore, since EPS are secreted outside the cells, it is rather straightforward and cost-effective to harvest them from the cell-free supernatant without using environmentally unfriendly cell-lysing chemicals [5].
The Bolivian Altiplano, a high plateau with altitudes between 3000 and 4500 m above sea level (m a.s.l.), where salt concentrations can be over 100 g/L due to the scarcity of precipitation, is an important source of halophilic microbes with biotechnological potential [10]. Biopolymer-producing bacteria of interest, such as Halomonas boliviensis [11] and Halomonas andesensis [12], have been isolated from that area. In a recent study, we reported an EPS-producing halotolerant bacterial strain isolated from Salar de Uyuni, which is a salt desert at 3600 m a.s.l. in the Altiplano [13]. The study provided some initial input, but further efforts were required to clarify the biotechnological potential of the bacterial isolate and to explore application possibilities of the produced EPS.
Using locally produced crop residues as raw material for producing bio-based commodities, such as EPS, is important for sustainable development. Quinoa (Chenopodium quinoa Willd.) is a widely cultivated crop in the Andean region, including the Bolivian Altiplano [14]. The stalks accumulated during quinoa harvest are a major residue that is currently sub-utilized in spite of its huge exploitation potential [15]. By pretreatment and enzymatic saccharification, the hemicelluloses and cellulose contained in quinoa stalks yield sugars that can be converted into different valuable products [16,17].
In the current study, next-generation sequencing was used for identification of the halotolerant EPS-producing bacterial strain previously isolated from Salar de Uyuni [13], and further insights into its ability to produce EPS from different carbon sources were provided. Furthermore, a thorough characterization of the produced EPS using analytical techniques, such as size exclusion chromatography, FTIR spectroscopy, HSQC NMR spectroscopy, scanning electron microscopy, and thermogravimetric analysis, was performed. The results allowed elucidation of the characteristics of EPS preparations produced in glucose-based mineral media, xylose-based mineral media, and cellulosic hydrolysates.

2. Materials and Methods

2.1. Microorganism

A halotolerant bacterial strain termed BU4, isolated from the hypersaline environment of Salar de Uyuni, in the Bolivian Altiplano, was used in this study. It is a Gram-positive bacterium with elongated rod-shaped cells that interact with one another to generate a biofilm. The bacterium had spore-forming ability and facultative anaerobic metabolism [13]. The strain was maintained at 4 °C in a solid medium containing (% (w/v)) NaCl (4.45), MgSO4·7 H2O (0.025), CaCl2·2 H2O (0.009), KCl (0.05), NaBr (0.006), soybean peptone (0.5), yeast extract (0.3), agar (2.0), and glucose (2.0). The pH was adjusted to 7.0 using a 1 M aqueous solution of NaOH. All chemicals were supplied by Sigma-Aldrich (Steinheim, Germany).

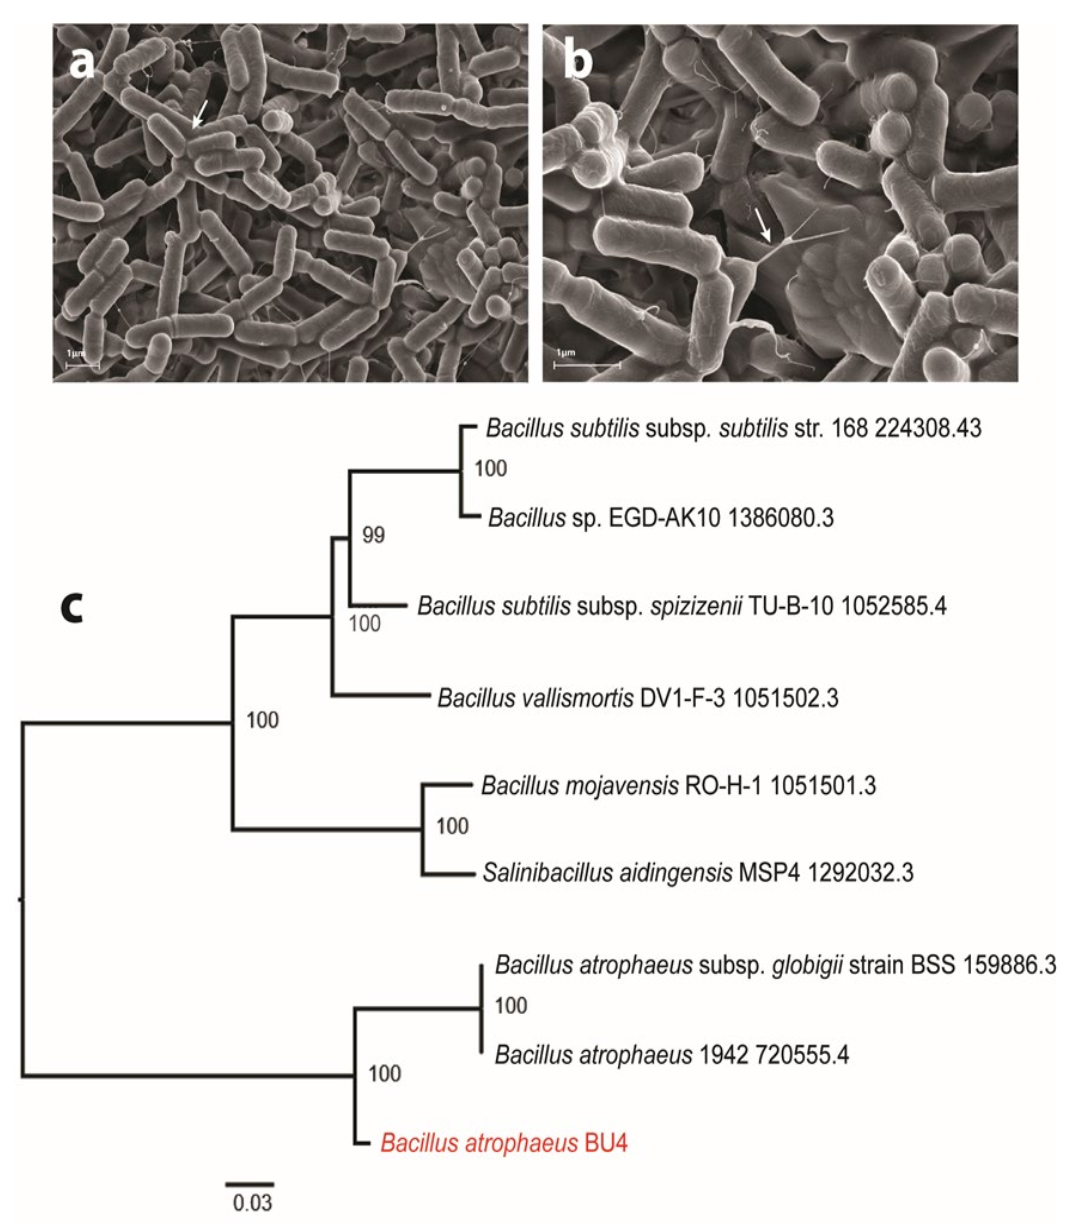
2.2. Characterization of the Bacterial Isolate

2.2.1. SEM Analysis

Scanning electron microscopy (SEM) imaging was used for providing insights about cell morphology and biopolymer formation. The BU4 isolate was cultivated on agar at 35 °C overnight, and the following day small pieces of bacteria-containing agar were cut out and fixated overnight at 4 °C in a mixture containing 2.5% (v/v) glutaraldehyde, 0.09 M sodium cacodylate trihydrate, 0.09 M NaCl, and 0.09 M MgSO4·7 H2O [18]. The agar pieces were washed twice with 10 mL of a solution containing 0.09 M sodium cacodylate trihydrate, 0.09 M NaCl, and 0.09 M MgSO4·7 H2O.
SEM imaging was performed at the Umeå Centre for Electron Microscopy and National Microscopy Infrastructure (UCEM-NMI) of the Chemical Biological Centre (KBC) (Umeå, Sweden). In brief, the samples were dehydrated with ethanol, dried, and coated with 5 nm platinum. The images were visualized by a field-emission scanning electron microscope (Carl Zeiss Merlin FE-SEM, Germany) using a chamber secondary electron detector (ETD, Everhart–Thornley detector) operated with a beam voltage of 5 kV and a current of 100 pA, with images recorded digitally with SmartSEM V.5.05 software.

2.2.2. Genome Sequencing

For preparation of genomic DNA, the BU4 isolate was cultivated in a 50 mL medium containing 50 g/L NaCl, 9 g/L MgCl2·6 H2O, 13 g/L MgSO4·7 H2O, 0.2 g/L CaCl2·2 H2O, 1.3 g/L KCl, 0.05 g/L NaHCO3, 0.15 g/L NaBr, 0.005 g/L FeCl3·6 H2O, 10 g/L glucose, 3 g/L malt extract, 3 g/L yeast extract, and 5 g/L Bacto peptone. The pH was adjusted to 7.2. The cultivation was performed at 35 °C and 160 rpm in an Ecotron shaker incubator (Infors, Bottmingen, Switzerland). The following day, bacteria were collected by centrifugation at 5000× g for 10 min and washed twice with 15 mL of a 0.7% (w/v) solution of NaCl.
Genomic DNA from the washed pellet was isolated using a Genomic-tip 500/G kit (Qiagen, Hilden, Germany). Bacterial polysaccharides that could potentially interfere with the sequencing were removed by selective precipitation by cetyltrimethylammonium bromide (CTAB). Sodium chloride was added to the genomic DNA to a final concentration of 0.7 M, and then 0.1 volume of 10% CTAB (w/v) dissolved in 0.7 M NaCl was added. The sample was thoroughly mixed and incubated at 65 °C for 10 min. An equal volume of a 24:1 chloroform:isoamyl alcohol (v/v) mixture was added to the sample, which was thoroughly mixed. Contaminating polysaccharides were removed by 5 min centrifugation at 14,000 rpm in an Eppendorf table-top centrifuge. An equal volume of a 25:24:1 phenol:chloroform:isoamyl alcohol (v/v) mixture was added to the DNA-containing supernatant. The mixture was carefully blended and centrifuged for 5 min at 14,000 rpm. Isopropanol (0.6 volume) was added to the supernatant to precipitate the DNA. Residual CTAB was removed by washing with 70% ethanol (v/v). The DNA was carefully air-dried and finally dissolved in 100 µL 10 mM Tris pH 8.
For completing the identification of BU4, the high-quality genomic DNA was subjected to Illumina paired end sequencing (150 bp) using a NovaSeq 6000 (Eurofins Genomics, Konstanz, Germany). Raw sequence reads were adapter-trimmed, quality-trimmed, and filtered (Q20) using BBDuk (https://jgi.doe.gov/data-and-tools/bbtools/, accessed on 20 December 2021). PathoSystems Resource Integration Center (PATRIC) was used to run SPAdes with BayesHammer to obtain high-quality scaffolds, and subsequently also to build a phylogenetic tree using a codon tree-pipeline from single-copy genes [19]. Closely related reference genomes to be included in the tree were identified using Mash/MinHash [20]. In-depth quantitative taxonomic classification and genome comparisons were performed based on genome-aggregate Average Nucleotide Identity and Amino Acid Identity (ANI/AAI) using the Microbial Genomes Atlas (MiGA) with both complete and chromosome-level NCBI genomes [21].

2.3. Raw Material

Residual stalks of royal quinoa (C. quinoa Willd.) were collected from different farms in the departments of Oruro and Potosí, Bolivia. The stalks were air-dried, size-reduced by hammer-milling and sieved to approximately 3-mm particle size. For removal of saponins, the milled stalks were subjected to three consecutive one-hour washings with water at 40 °C at a 20:1 liquid-to-solid ratio (LSR). After that, the washed material was separated by vacuum filtration, and air-dried for five days at room temperature until approximately 90% dry matter (DM) content. A sample of dry solids was saved for compositional analysis, and the rest was used for preparation of the hydrolysates. Water-washed quinoa stalks contained (in % (w/w)) cellulose (39.0), xylan (25.7), mannan (1.8), galactan (2.0), arabinan (1.9), and lignin (22.0).

2.4. Preparation of the Hydrolysates

2.4.1. Hemicellulosic Hydrolysate

The hemicellulosic hydrolysate was prepared by sulfuric-acid-catalyzed hydrothermal pretreatment. The pretreatment was carried out in a 1-L pressurized stainless-steel Parr reactor 4520 (Parr Instrument Co., Moline, IL, USA) equipped with magnetically driven impellers, electrical heating, and PID temperature control. The water-washed quinoa stalks were mixed in the reactor chamber with a dilute-sulfuric acid solution giving a 300-g suspension with a 12.5% (w/w) consistency. The concentration of the acid solution was calculated so that the final load was 0.2 g H2SO4 per 100 g reaction mixture. Based on the results of preliminary studies [17], the pretreatment was run at 200 °C for 5 min. Cooling was performed by passing water through an internal coil connected to an automatically controlled solenoid valve package. At the end of the pretreatment, the resulting slurry was separated by vacuum filtration into a liquid fraction, hereafter referred to as hemicellulosic hydrolysate, and a cellulose-rich solid fraction. Six pretreatment batches were performed in order to get enough materials for the enzymatic saccharification and cultivation.

2.4.2. Cellulosic Hydrolysate

The solid fraction resulting from the pretreatment was subjected to preparative enzymatic saccharification for generating cellulosic hydrolysates to be used in fermentation experiments. Around 65 g (DM) of the pretreated solids were mixed with 20 mM citrate buffer (pH 5.0) giving a slurry with a total weight of 864 g and a 7.5% (w/w) consistency. The cellulase blend Cellic CTec2, procured from Sigma-Aldrich, was added at a load of 200 CMCase units per gram (DM) of biomass. The mixture was incubated for 72 h at 50 °C and 150 rpm in the Ecotron shaker incubator. At the end, the cellulosic hydrolysate was separated from the residual lignin by vacuum filtration. Two enzymatic saccharification batches were run.

2.5. Cultivation of Bacteria for EPS Production

2.5.1. Media

The cultivations were performed in either synthetic media or quinoa stalk hydrolysates. In the synthetic media, xylose and glucose were used as carbon sources, and their initial amount was based on their concentration in the hemicellulosic and cellulosic hydrolysates, respectively. The synthetic media contained (in g/L) NaCl (50), MgSO4·7 H2O (0.25), CaCl2·2 H2O (0.09), KCl (0.5), NaBr (0.06), soybean peptone (5), and yeast extract (0.3). The hydrolysates were supplemented with the same concentrations of nutrients as the synthetic media. The pH was adjusted to 7.5 using a 1 M aqueous solution of NaOH, and the media were sterilized by autoclaving at 121 °C for 15 min. Three different concentration levels (45 g/L, 30 g/L, and 15 g/L) were used for the glucose-based synthetic media and cellulosic hydrolysates, and two concentration levels (16 g/L and 8 g/L) were used for xylose-based synthetic media and hemicellulosic hydrolysates. Furthermore, fermentation tests with the undiluted hydrolysates were also performed.

2.5.2. Cultivation

Pre-cultures, inoculated from agar plates, were grown in 50 mL of a glucose-based (20 g/L) synthetic medium at 35 °C for 24 h in 100 mL Erlenmeyer flasks with agitation (100 rpm) in an Ecotron shaker incubator. A total of 15 mL of the pre-culture were inoculated in 250 mL Erlenmeyer flasks containing 150 mL medium, and the cultivation was conducted at 30 °C and 100 rpm for 72 to 96 h depending on the OD of the culture. The cultivation was monitored by OD measurements at 620 nm using a UV-1800 spectrophotometer (Shimadzu, Kyoto, Japan). Samples for determination of the consumption of sugars and protein were withdrawn periodically. The samples were stored frozen until analysis.

2.5.3. Analysis of the Cultivation Samples

Sugar consumption during cultivation was determined by HPLC with a Thermo Scientific Ultimate 3000 system (Dionex Softron GmbH, Germering, Germany) using the refractive index detector (RID) of the instrument. The separation was performed using a Bio-Rad Aminex HPX-87P column (Bio-Rad Laboratories AB, Solna, Sweden) operating at 80 °C. The eluent was ultrapure water at a flow rate of 0.6 mL/min. Quantitation was carried out using an external calibration curve covering the interval 0.5–30 g/L for glucose, xylose, mannose, galactose, and arabinose.
Protein in the cultivation samples was determined by the Bradford method [22] using bovine serum albumin as standard, and reading the absorbance at 540 nm.

2.6. Isolation and Purification of the EPS

The produced EPS were isolated and purified using a protocol based on methodologies typically used for EPS of bacterial origin [23]. At the end of the cultivation, the bacterial cells were removed from the culture by centrifugation (Eppendorf 5810 R, Hamburg, Germany) at 13,400 × g, 10 min, and 4 °C. EPS was isolated from the supernatant by cold ethanol precipitation, which was carried out by adding three volumes of 96% ethanol, and letting the mixture stand at 4 °C overnight. The precipitated EPS was separated by centrifugation at 13,400× g, 15 min, and 4 °C using an Avanti J-26 XP high-speed centrifuge (Beckman Coulter, Palo Alto, CA, USA). The pellet was suspended in ultrapure water, and it was dialyzed against ultrapure water using a 50 kDa molecular-weight-cutoff membrane for 24 h and magnetic stirring (500 rpm). Water was changed twice during the dialysis period. The retentate was freeze-dried for 36 h at −106 °C with a CoolSafe 110-4 freeze-drier (ScanVac-LaboGene, Allerød, Denmark).
The freeze-dried EPS was mixed with 15 mL of 10% (w/v) trichloroacetic acid (TCA), and the mixture was let to stand during 30 min at 4 °C for inducing protein precipitation. The precipitated protein was separated by centrifugation at 3400× g, 10 min, and 4 °C. The protein-free supernatant was mixed with one volume of ultrapure water so that the TCA concentration was reduced to 5%, and then dialysis and freeze-drying were applied under the conditions described above. Freeze-dried material was weighed, and the EPS yield was calculated.
For a number of samples, the first dialysis and freeze-drying step was omitted, and the TCA-induced protein precipitation was performed directly after the cold ethanol precipitation.

2.7. EPS Characterization

2.7.1. Determination of the Monosaccharide Composition

The analytical acid hydrolysis method reported by Sardari et al. [24] was used for determination of the sugar composition of the EPS. Briefly, 30-mg aliquots of freeze-dried EPS were mixed with 300 μL 72% sulfuric acid and the mixture was held at 30 °C with periodical stirring for 30 min. Then it was diluted with water and held at 100 °C for 3 h. After that, the hydrolysate was centrifuged, and the sugars in the supernatants were quantified by high-performance anion-exchange chromatography (HPAEC) with pulsed amperometric detection using a Dionex ICS-5000 (Dionex, Sunnyvale, CA, USA) system. A 3 × 30 mm guard column and a 3 × 150 mm separation column (CarboPac PA20, Dionex) were used. Elution was performed with a 2 mM aqueous solution of NaOH for 25 min. This was followed by regeneration with a solution consisting of a mixture of 200 mM NaOH and 68 mM sodium acetate for 5 min, addition of a solution of 200 mM NaOH for 5 min, and equilibration with a 2 mM solution of NaOH for 25 min. The flow rate was always 0.4 mL/min. PAD (pulsed amperometric detection) was performed on a Gold Standard PAD waveform with Ag/AgCl as the reference electrode.

2.7.2. High-Performance Size Exclusion Chromatography (HPSEC)

The weight-average molecular weight (Mw) and number-average molecular weight (Mn) of the EPS were determined by high-performance size exclusion chromatography (HPSEC) using a Polymer Laboratories PL-GPC 50 Plus instrument (Agilent, Santa Clara, CA, USA) equipped with two Aquagel-OH 60 columns in series and an Aquagel guard column (Agilent). EPS was detected using a refractive index (RI), low-angle laser scattering (LALS), and right-angle laser light scattering (RALS) detectors. The mobile phase was a 0.2 M acetate buffer (pH 5.1), which was eluted at a flow rate of 0.6 mL/min. The samples for HPSEC were prepared by dissolving 2 mg of each EPS in 3 mL ultrapure water and filtering the solutions through 0.2 μm filters before injection. The temperature was 30 °C.

2.7.3. Fourier-Transform Infrared (FTIR) Spectroscopy

Approximately 20 mg of each sample were mixed with ca. 380 mg of IR spectroscopy-grade potassium bromide (Merck, Darmstadt, Germany). The mixture was finely ground in an agate mortar before measurements. The spectra were recorded under vacuum (4 mbar), using a Bruker IFS 66 v/S spectrometer (Bruker Optik GmbH, Ettlingen, Germany) equipped with a diffuse reflectance 16-sample holder carousel accessory (Harrick Scientific Products, Pleasantville, NY, USA). Pure potassium bromide was used as background, recorded with the same parameters in the same carousel round. The spectra were collected with 128 scans at a resolution of 4 cm−1 in the region 400–5200 cm−1. Spectra were converted to data point tables using OPUS software (version 5.5, Bruker Optik GmbH) and processed by the free, MATLAB-based open source GUI available from the Vibrational Spectroscopy Core Facility (https://www.umu.se/en/research/infrastructure/visp/downloads/, accessed on 20 December 2021). Baseline correction was performed by asymmetrical least squares (AsLS) fitting, where the parameters λ and p were set to 106 and 10−3, respectively. Spectra were total area normalized over the 470–1870 cm−1 spectral range.

2.7.4. Two-Dimensional 1H-13C Heteronuclear Single-Quantum Coherence (HSQC) Nuclear Magnetic Resonance (NMR) Spectroscopy

1H-13C HSQC NMR spectroscopy was used for comparing EPS and elucidating similarities or differences in the composition of sugar units and anomeric configuration of different samples. Spectra were recorded using an 850 MHz Bruker Avance III HD spectrometer equipped with a 5 mm inverse-detected cryoprobe. Aliquots of 20 mg of samples were solubilized in D2O, and spectra were recorded at 298 K. Sweep-widths of 12 and 165 ppm were used for 1H and 13C, respectively. Sixteen scans were recorded for each of the 256 t1 increments. A 90-degree shifted squared sine function was applied in both dimensions prior to Fourier transform. Spectra were processed and visualized using TopSpin 3.6 (Bruker Biospin, Rheinstetten, Germany).

2.7.5. Scanning Electron Microscopy (SEM)

Surface morphology of the freeze-dried EPS was observed using SEM at an accelerating voltage of 5 kV. The samples were dispersed onto carbon adhesive tape, mounted on an aluminum stub, and coated with a thin layer of platinum (2 nm). Imaging was performed using a field-emission scanning electron microscope equipped with an in-chamber (ETD) secondary electron detector (Carl Zeiss Merlin GmbH, Jena, Germany).

2.7.6. X-ray Diffraction (XRD)

Powder X-ray diffraction was performed with a Bruker AXS D8 Advance instrument (Bruker BioSpin GmbH, Karlsruhe, Germany) with a Våntec-1 detector, using CuKα radiation and a Ni-filter on the detector side, operated in 2θ mode. The samples were mounted on a Si single crystal low-background sample holder and set in rotation mode during data collection. Continuous scans were applied within the 2θ angle range of 10–70 degrees. The data collection time for each sample was at least 5 h.

2.7.7. Thermogravimetric Analysis (TGA)

Thermogravimetric analysis of the EPS samples was performed using a TGA Q5000IR analyzer (TA Instruments, New Castle, DE, USA). The TGA was calibrated with the 5-point method based on the Curie-point standard calibration materials. Approximately 10 mg of EPS sample was loaded into a platinum pan and heated to 920 °C at a heating rate of 10 °C/min under nitrogen atmosphere. TGA and DTG (negative time derivate of the mass loss) curves were used for analyzing the decomposition characteristics of the EPS samples.

3. Results and Discussion

3.1. Characterization of the Bacterial Isolate

SEM imaging showed rod-shaped bacterial cells covered in EPS (Figure 1a). The EPS attached neighboring bacteria to each other (Figure 1a) but also formed longer strands (Figure 1b) allowing formation of a three-dimensional biofilm.
Further characterization was performed by applying next-generation DNA sequencing and bioinformatics. The genome assembly using SPAdes generated a genome with 92 contigs longer than 500 bp, a genome size of 4,172,770 bp, an N50 value of 276,569 bp, and an average GC content of 43.2%.
The phylogenetic codon tree analysis revealed that the assembled genome is closely related to Bacillus atrophaeus strain 1942 NC_014639 and B. atrophaeus subsp. globigii strain BSS CP0076401 (Figure 1c). This close genetic relationship was confirmed by taxonomic classification and genome comparisons using principally different bioinformatic methodology based on genome-aggregate Average Nucleotide Identity and Amino Acid Identity (ANI/AAI) (Table 1). These analyses showed that the genome likely belongs to the species Bacillus atrophaeus (p-value: 0.045) and that the closest available genomes are B. atrophaeus NZ CP021500 (97.01% ANI), B. atrophaeus NZ CP024051 (96.96% ANI), and B. atrophaeus 1942 NC 014639 (96.91% ANI). Furthermore, it was found that the genome most likely belongs to a subspecies not represented in the database (p-value: 0.0024). All sequence data associated with BU4 have been submitted under BioSample accession number SAMN24256866.

3.2. Production of Exopolysaccharides

The bacterial strain was cultivated in both synthetic media and quinoa stalk hydrolysates for producing exopolysaccharides. The synthetic media were based on either glucose or xylose, and the hydrolysates were produced from either hemicelluloses or cellulose.

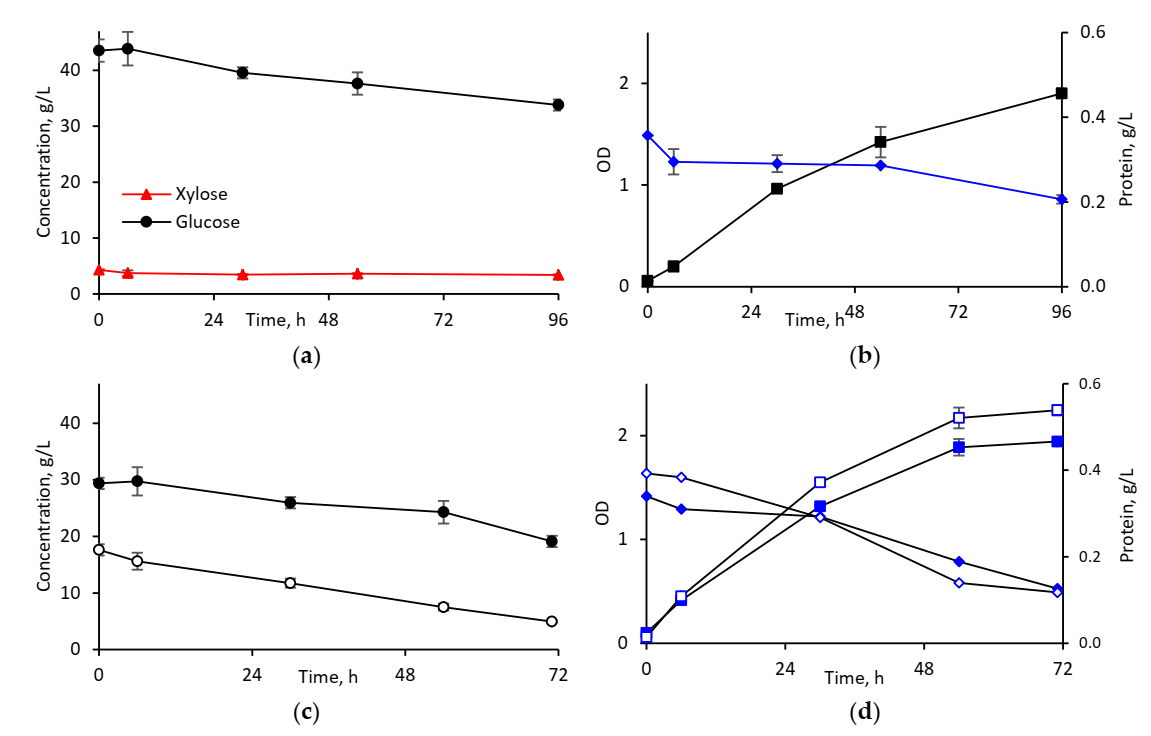
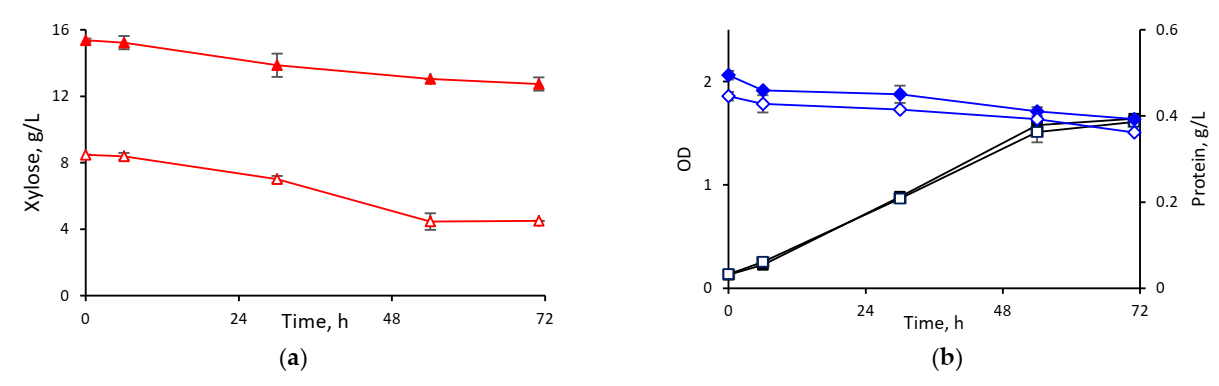
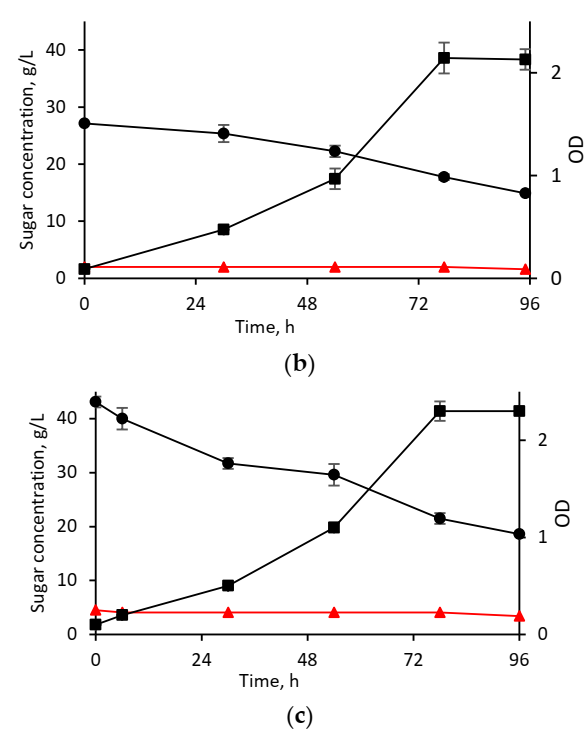
3.2.1. Cultivation in Synthetic Media

The initial concentrations of the carbon sources in the synthetic media were based on the sugar concentrations in the hydrolysates. The cellulosic hydrolysate contained 48 g/L glucose and 4.9 g/L xylose, while the hemicellulosic hydrolysate contained 16.3 g/L xylose along with low concentrations of mannose, glucose, galactose, and arabinose (Table 2). The hemicellulosic hydrolysate also contained furan aldehydes and aliphatic acids, which are known to be inhibitory to fermenting microorganisms [25]. Three glucose-based and two xylose-based media were used (Table 3). For each sugar, one of the used media had an initial sugar concentration in the range of the concentration in the hydrolysate, namely, 45 g/L glucose and 16 g/L xylose. Media with 30 and 15 g/L glucose and with 8 g/L xylose were also assayed.
In the glucose-based synthetic medium with the highest initial concentration (45 g/L, SM-G45), the fraction of consumed sugar was low. Only 22% of the initial sugar was consumed after 96 h (Figure 2a). A rather similar picture was observed for the medium with 30 g/L initial glucose (SM-G30), which resulted in 30% sugar consumption after 72 h (Figure 2b). SM-G45 also contained some xylose, which was consumed only to a minor extent. The cell growth was slightly slower for SM-G45 (Figure 2c) than for SM-30 (Figure 2d), as revealed by the monitoring of the OD reading during cultivation. On the other hand, in the medium with the lowest initial glucose concentration (15 g/L, SM-G15) the fraction of glucose consumed was higher. Around 50% of the initial glucose was consumed after 54 h, and 72% at the end of the cultivation. Cell growth and protein consumption were also higher for SM-G15 than for the media with higher initial concentrations of glucose.
In xylose-based synthetic media, as in those based on glucose, more dynamic cultivations were observed in the experiments with lower initial sugar concentration. Only 17% of the initial xylose was consumed in the cultivation in SM-X16, while around 50% was consumed in that in SM-X8 (Figure 3a). Even the highest xylose consumption achieved was, however, lower than glucose consumption in SM-G15 medium. Cell growth and protein consumption were comparable for both xylose-based media (Figure 3b), and both of them were lower than the values observed for all cultivations in glucose-based synthetic media (Figure 2c,d).
The EPS yield on consumed sugar was higher for media with higher initial glucose concentrations. For instance, it was 0.104 g/g for SM-G45 medium compared to 0.075 g/g in SM-G15 medium (Table 3). However, since not so much sugar was consumed, the actual amount of produced EPS was lower, and the yield on initial sugar was lower (0.018 g/g) than for SM-G15 (0.064 g/g). Even though the EPS yield on consumed sugar (0.126–0.135 g/g) was relatively high for xylose-based synthetic media, the EPS production was low due to weak sugar consumption. A high initial xylose concentration (15 g/L) resulted in a higher EPS yield on consumed sugar, but the yield on initial sugar was better for cultivations with lower initial concentration of xylose (8 g/L).

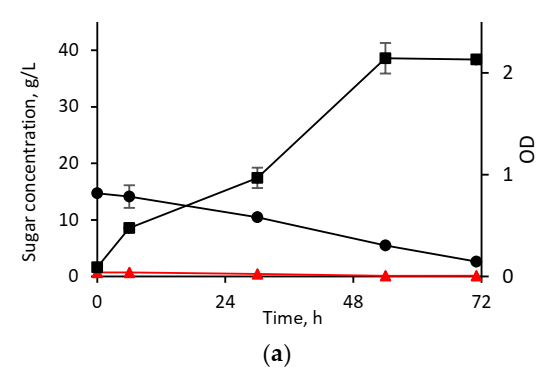
3.2.2. Cultivation in Hydrolysates

For the hydrolysate containing 15 g/L glucose (CH-G15), 82% of initial glucose was consumed after 72 h (Figure 4a), while for those with 30 and 45 g/L glucose (CH-G30 and CH-G45), a longer cultivation time was required and even after 96 h sugar consumption was only around 50% (Figure 4b,c). Thus, with regard to the fraction of sugar consumed, cultivation in cellulosic hydrolysates exhibited a similar trend as observed for glucose-based synthetic media, namely, that the fraction of sugar consumed was low for a medium with a high initial sugar concentration. In contrast, the amount of sugar consumed was highest for a medium with a high initial sugar concentration (Figure 4). Xylose consumption was very low in all cellulosic hydrolysates, and cell growth was similar regardless of the initial amount of sugar.
No growth was observed in any of the hemicellulosic hydrolysates (data not shown). This phenomenon might be attributed to the presence of relatively high concentrations of microbial inhibitors, such as furan aldehydes and aliphatic acids (Table 2). The formation of inhibitors is a known phenomenon associated with pretreatment of lignocellulosic hydrolysates, and formation of carbohydrate-derived inhibitors, such as furans and aliphatic acids, is especially relevant for acid-based methods, as the one used in this study [25]. In further attempts to cultivate B. atrophaeus BU4 in hemicellulosic hydrolysates produced by sulfuric-acid-catalyzed hydrothermal pretreatment, detoxification strategies for removing the inhibitors should be considered.
As in the cultivation in synthetic media, the EPS yield on initial sugar decreased with an increasing initial sugar concentration in the cellulosic hydrolysate. In the most concentrated hydrolysate, the yield was 0.018 g/g, while in the most diluted one, it was 0.052 g/g (Table 3). The EPS yields, both on initial sugar and on consumed sugar, were comparable in the hydrolysates and in the synthetic media. For both synthetic media and hydrolysates, a high initial sugar concentration resulted in inefficient conversion to EPS, and large amounts of sugars remained unused in the media. Therefore, for future experiments it is reasonable to limit the initial sugar content in the media to up to 15 g/L glucose or 8 g/L xylose.

3.3. EPS Characterization

The EPS preparations were characterized by using different techniques. The results for three representative EPS preparations, namely, one resulting from cultivation in glucose-based synthetic medium, one from xylose-based synthetic medium, and one from cellulosic hydrolysate, are presented in this section.

3.3.1. Determination of the Monosaccharide Composition

HPAEC of hydrolysates obtained by analytical acid hydrolysis of purified EPS showed that all three EPS preparations were heteropolysaccharides. Independently of the carbon source used in the cultivation, the EPS preparations displayed rather similar composition (Table 4). Glucose and mannose were the main sugars in hydrolyzed EPS, as they accounted for more than 80% of the identified sugars. The two EPS preparations from cultivations in synthetic media contained more glucose than mannose units (around 1.2–1.4 glucose units per each mannose unit), while the EPS produced in hydrolysate contained almost equimolar fractions of glucose and mannose units. Galactose, with a share between 8.2 and 10.7%, was the third most abundant sugar for all EPS preparations. Only low fractions (≤6.5%) of the pentoses xylose and arabinose were found.
Although the high share of hexoses is in accordance with previous reports on bacterial EPS, the exact composition is rather different for EPS produced by different bacteria. For instance, Paenibacillus spp. grown in a glucose-based defined medium produced an EPS composed of glucose and mannose units at a 1:1.4 mass ratio, which is comparable with this study, but with no other monosaccharides [26]. EPS containing only mannose and glucose units was produced also by B. amyloliquefaciens, but mannose, which represented between 65 and 97% of the total monosaccharides, was predominant [27]. On the other hand, in EPS resulting from cultivation of the halophilic thermotolerant bacteria Halomonas nitroreducens in a saline medium, mannose, with a 44–64% mass share, was the main sugar unit, followed by glucose (19–28%) and galactose (6–14%) [28]. Furthermore, EPS produced by a B. atrophaeus strain isolated from a mangrove system and grown in LB medium consisted mainly of glucose units (84%), with some minor fractions of other sugar units [29].
In this study, arabinose was the main pentose unit in EPS produced in synthetic media, while xylose units were more abundant in the EPS resulting from cultivation in cellulosic hydrolysate. Arabinose units have been reported to be present in small amounts in other bacterial EPS preparations [28,29], while xylose units are less common.

3.3.2. High-Performance Size Exclusion Chromatography (HPSEC)
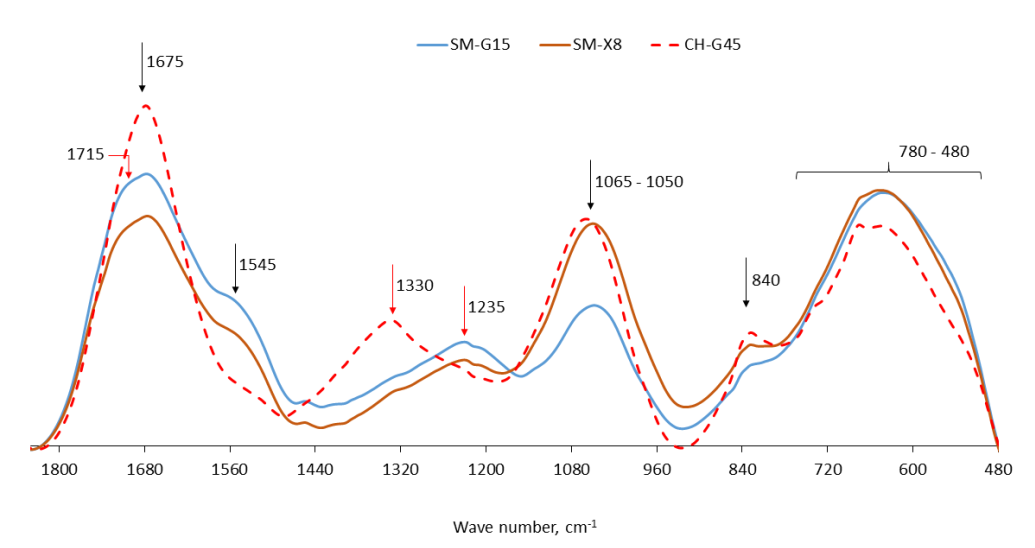
HPSEC revealed two peaks for EPS produced by cultivation in the glucose-based synthetic medium (SM-G15), and three peaks for EPS from the xylose-based medium (SM-X8) (Table 5). This means that B. atrophaeus BU4 simultaneously produced two different polysaccharides when grown on glucose, and three types when grown on xylose.
For both carbon sources, the first peak corresponded to a polymer of molecular weight averages one order of magnitude higher than the second peak. The molecular weight averages of the polymer corresponding to the third peak of the product resulting from the cultivation on xylose were three times lower than the ones corresponding to the second peak. The molecular weight averages of the first peak were slightly higher for the EPS produced from glucose than for the one produced from xylose.
Although the polydispersity index (PDI) of the second peak was slightly higher than that corresponding to the first peak, in general all peaks display a narrow molecular weight distribution considering that the PDI was always close to 1.
The occurrence of more than one peak has previously been reported for other bacterial EPS. H. nitroreducens EPS displayed three peaks with a size distribution of 106, 104, and 103 g/mol, respectively, for the first, second, and third peak [28], which is comparable with that of the current study.
For the EPS produced by cultivation in a cellulosic hydrolysate, SEC revealed only one peak. Its molecular weight distribution corresponded to approximately half of the value of the EPS resulting from the glucose-based synthetic medium.

3.3.3. FTIR Spectra

The FTIR spectra of three samples (two EPS preparations produced by bacterial cultivation in synthetic media and one from cultivation in a cellulosic hydrolysate) are shown in Figure 5. The 1800–480 cm−1 region covering the fingerprint area useful for characterizing different polysaccharides [30] shows that all the spectra had in common clear strong peaks at 1675 cm−1 and 1065–1050 cm−1, a broad band in the 780–480 cm−1 range, a weak peak at 840 cm−1, as well as a shoulder at 1545 cm−1.
The FTIR bands were assigned and interpreted based on existing knowledge on use of vibrational spectroscopy for studying biological materials [31]. The most likely cause of the band at 1675 cm−1 is a -C=O functionality in the samples, but the origin of this functionality is unclear. It is possible it originates from carboxylic acids (free or esterified) but a contribution of proteins (i.e., amide I band) cannot be fully excluded. If an amide I contribution is assumed, the 1545 cm−1 band could in turn be assigned to amide II of the same peptide bond. Even if we assume peptide bond contributions, it is clear, however, that the sample CH-G45 has a much lower proteinic contribution: not only is the 1545 cm−1 band virtually absent, the 1675 cm−1 band ratio and shape is markedly different, too. Thus, the most likely source for the -C=O function in this sample is a carbonyl moiety of either of carboxylic acids (including ester forms) or ketones/aldehydes.
The broad features centered around 1065–1050 cm−1 most likely originated from the ring breathing motions of various carbohydrate units. A polysaccharidic contribution cannot be excluded, although the recognition is hindered by particularities of the IR analysis of carbohydrates. Unlike other biomolecules, the carbohydrates lack prominent IR-active functional groups with heteroatoms and multiple bonds. The predominance of C–C and C–O bonds and their similarities across different compounds result in broad absorption bands as it happens in these spectra. Although mono- or oligosaccharides can give clear IR spectra, complex polysaccharides often require algorithms for pattern recognition [31].
The band around 1235 cm−1 is likely from a –C–O vibration, and based on its position and relative intensity towards the 1675 and 1545 cm−1 bands, its origin is probably peptidic (amide III band) [31]. Thus, samples SM-G15 and SM-X8 likely contain substantial amounts of peptides/proteins, while sample CH-G45 does not. The origin of the 1330 cm−1 band (uniquely observable in sample CH-G45) is unclear. It is likely due to a –C–Hx functionality, but the spectra do not allow more specific assignments.
Likewise, while there are clear differences between sample CH-G45 and the other two in the bands below 900 cm−1, assigning these bands to specific compounds is impossible. This region of the FTIR spectra is dominated by composite vibrations, which can be useful for fingerprinting but makes assignments challenging without clear references. What is clear, however, is that the broad features in this region are a consequence of merging several, overlapping bands, which further complicates assignments.
In short, the analyzed EPS preparations are all complex in composition, with clear differences between those produced in synthetic media and the one produced in cellulosic hydrolysate. In particular, EPS from synthetic media probably still contain relatively high concentrations of peptidic components, despite the protein removal steps applied to them. EPS from synthetic media also displayed a more pronounced signal at 1715 cm−1, which can be assigned to –C=O vibrations of a different origin (including but not limited to ketones). This band appears to be largely absent in the hydrolysate-EPS.
On the other hand, the band at 840 cm−1, as well as another small one at 675 cm−1, were better defined in the spectrum of the hydrolysate-EPS than in that of the synthetic media-samples, even though these differences are harder to translate into structural/compositional clues.
It also worth noting that the 1065–1050 cm−1 region (assigned to carbohydrate ring breathing motions) had largely similar intensities for the EPS produced in the hydrolysate and in the xylose-based synthetic medium, while in the spectrum of the EPS from the glucose-based synthetic medium it was considerably weaker. Thus, the proportion of carbohydrates is similar in the samples SM-X8 and CH-G45, and lower in SM-G15. However, the maximum of the band is shifted for hydrolysate, indicating that either the integration of the carbohydrates into the chemical matrix of the EPS is different, and/or the carbohydrate composition/anomeric structure differs. Interestingly, the sugar composition of the xylose-based and hydrolysate-based EPS contained comparable relative amounts of glucose and galactose units. What might set the hydrolysate-based EPS apart in terms of monosaccharide composition is the close to 1:1 glucose:mannose ratio, which is ca. 6:5 for the xylose-based and 7:5 for the glucose-based one (Table 4), and may (at least partially) explain the shift of maxima observed in the FTIR spectra.

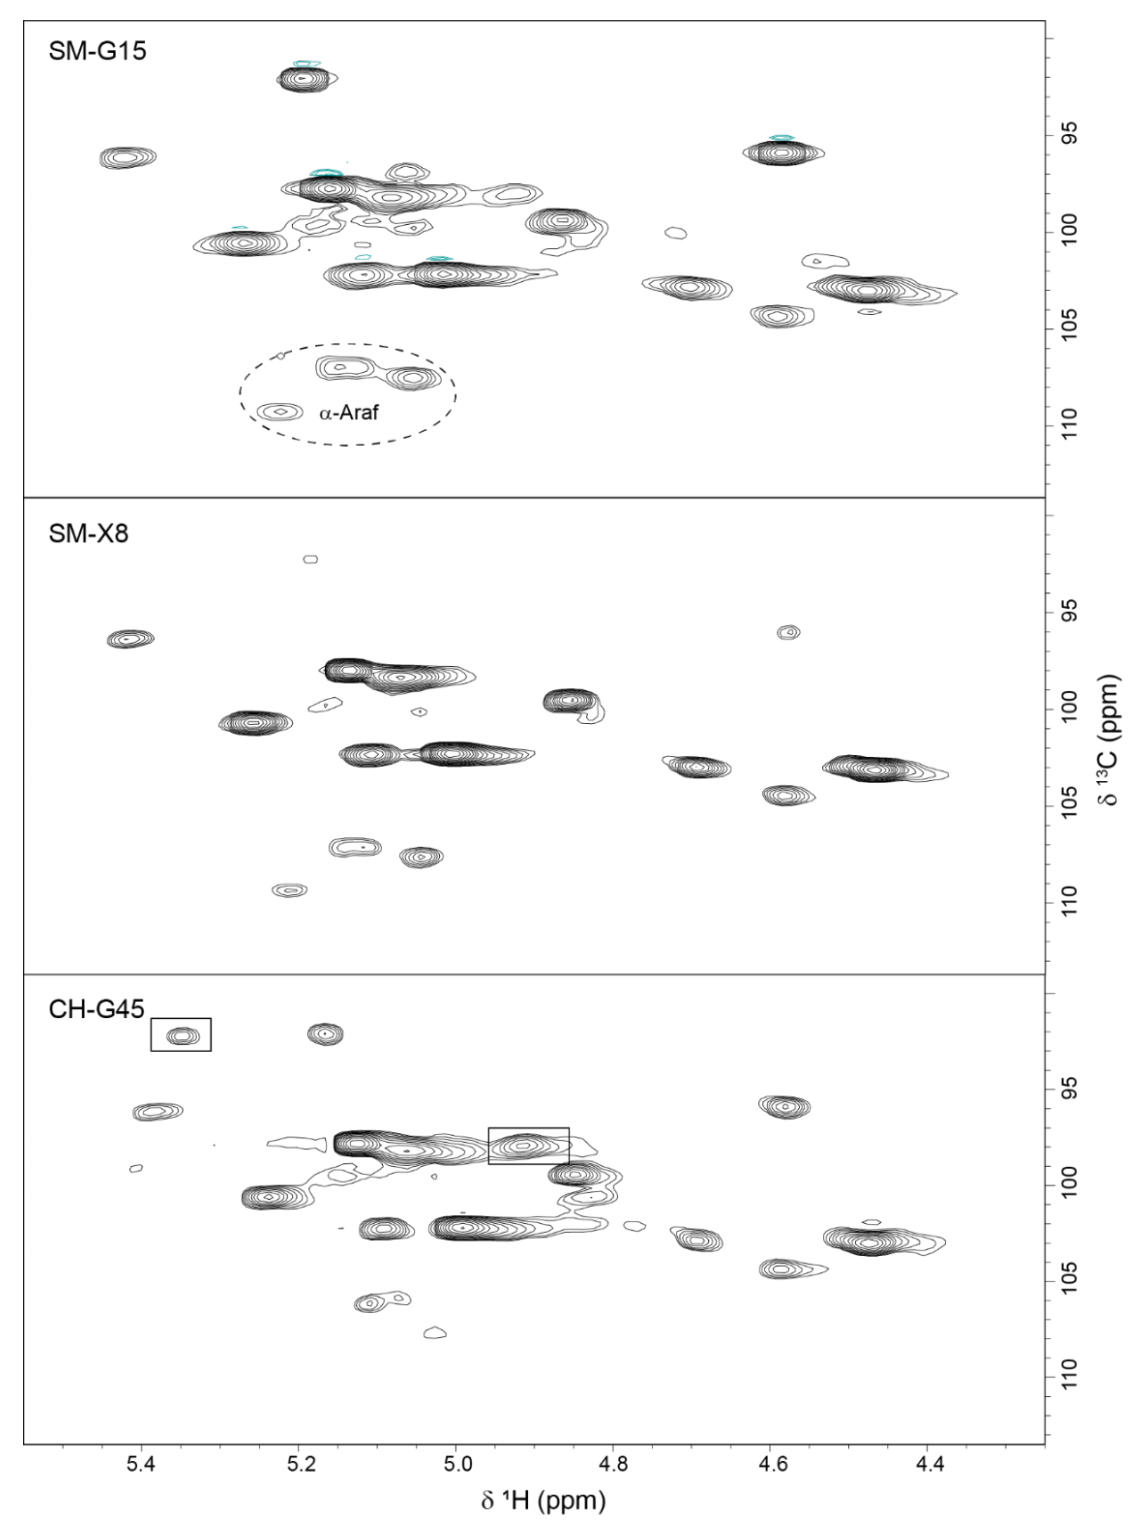
3.3.4. 2D 1H-13C HSQC NMR Spectra
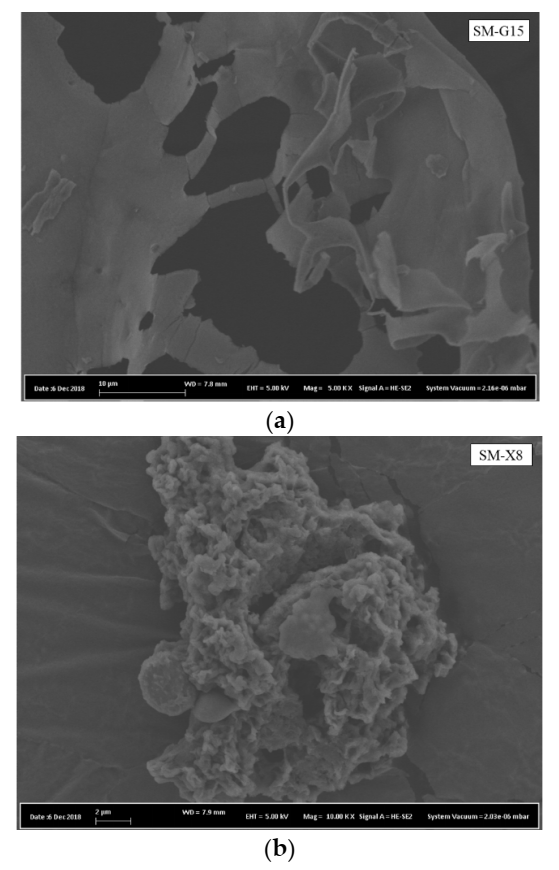
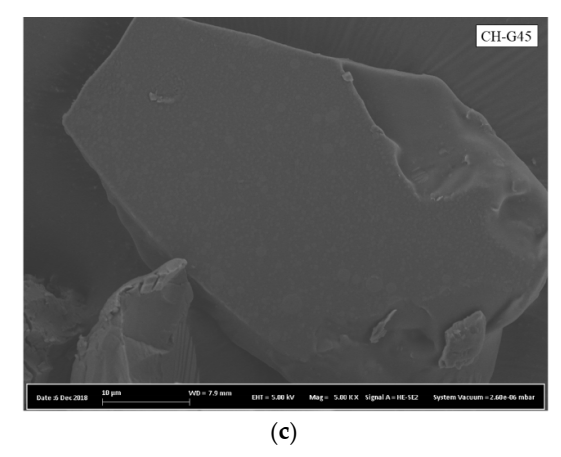
The 2D 1H-13C HSQC NMR spectra recorded for EPS cultivated in a glucose-based synthetic medium (SM-G15), a xylose-based synthetic medium (SM-X8), and a quinoa stalk cellulosic hydrolysate (CH-G45) are shown in Figure 6. The anomeric region revealed a common subset of peaks for all three samples, which indicates a similar carbohydrate composition, and confirms the previously discussed results on the monosaccharides contained in EPS produced under different conditions. Chemical shifts of the anomeric peaks indicate that a majority of the monosaccharide units are linked through α-glycosidic bonds, with 1H chemical shifts in the 4.8–5.3 ppm range compared to 4.2–4.8 normally observed for β-pyranosides [32]. Chemical shifts for the C1 carbons corresponding to the peaks with 1H shifts of 4.8–5.4 ppm are also shifted slightly upfield, which usually is the case for α-glycosidic bonds compared to the β-form [33]. The anomeric peaks at 5.18/109.3, 5.02/107.7, and 5.1/106.9 ppm are very likely originating from α-L-arabinofuranoside (α-L-Araf) units with chemical shifts similar to the α-Araf units found in arabinogalactan type II [34,35]. The fact that three different arabinose peaks and 11 other anomeric peaks are observed (not counting peaks from the reducing end) indicate a polysaccharide with several branching-points. The two anomeric peaks with the lowest 13C shifts, 96.2 and 96 ppm, respectively, corresponds most likely to the α- and β-form of a reducing end pyranose unit [35].
EPS preparations from cultivation on glucose-based synthetic medium (SM-G15) and xylose-based synthetic medium (SM-X8) are very similar with the same set of anomeric peaks with very similar relative peak integrals. The exception is the reducing end peaks, but those are affected by impurities as the HPAEC analysis shows similar molecular weights for the EPS preparations.
The anomeric region for CH-G45 also contain many of the same peaks observed for SM-G15 and SM-X8 but the three peaks tentatively assigned to α-L-Araf are shifted and have significantly lower intensities, as expected from the HPAEC results (Table 5). Two peaks only observed in this sample are located at 4.9/97.9 and at 5.34/92.3, marked with boxes in Figure 6. The former corresponds to a reducing end of an α-anomeric sugar.
Considering that the types of monosaccharides detected in the different EPS samples are the same, these additional peaks must derive from a slightly different branching pattern of EPS from CH-G45 compared to the other samples.

3.3.5. SEM Imaging

SEM imaging revealed morphological differences between EPS from different cultivations. SM-G15, which was produced in a glucose-based synthetic medium, displayed a smooth surface with large, thin, flaky-like structures (Figure 7a). SM-X8, which was produced in a xylose-based synthetic medium, showed a rather uneven surface with aggregates of a small globular structure, enveloped by thin, sheet-like features (Figure 7b). Hydrolysate-derived EPS (denoted as CH-G45) appears to be more voluminous, with large, random-shaped particles with flat surfaces and sharp edges (Figure 7c). Overall, EPS produced in hydrolysate seems to have more robust features than its synthetic media counterparts.

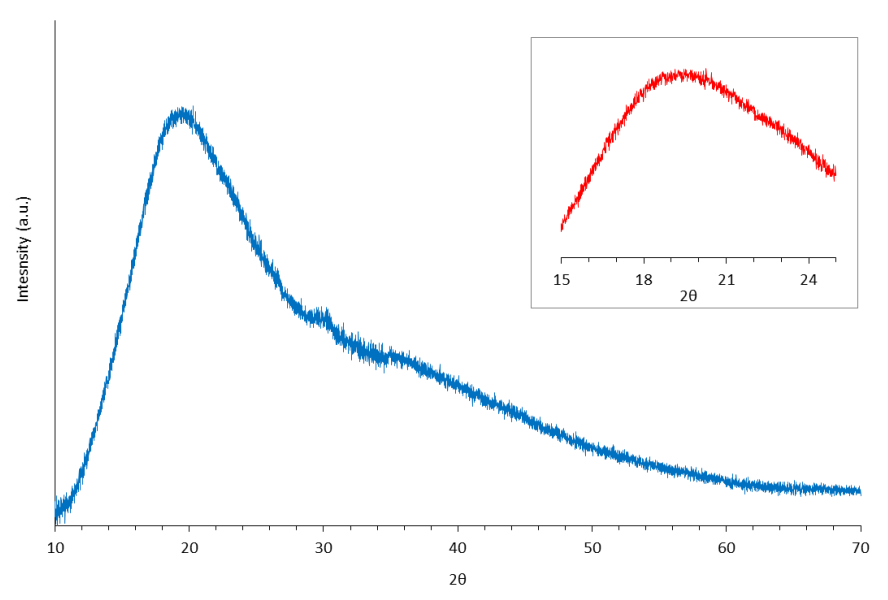
3.3.6. X-ray Diffraction
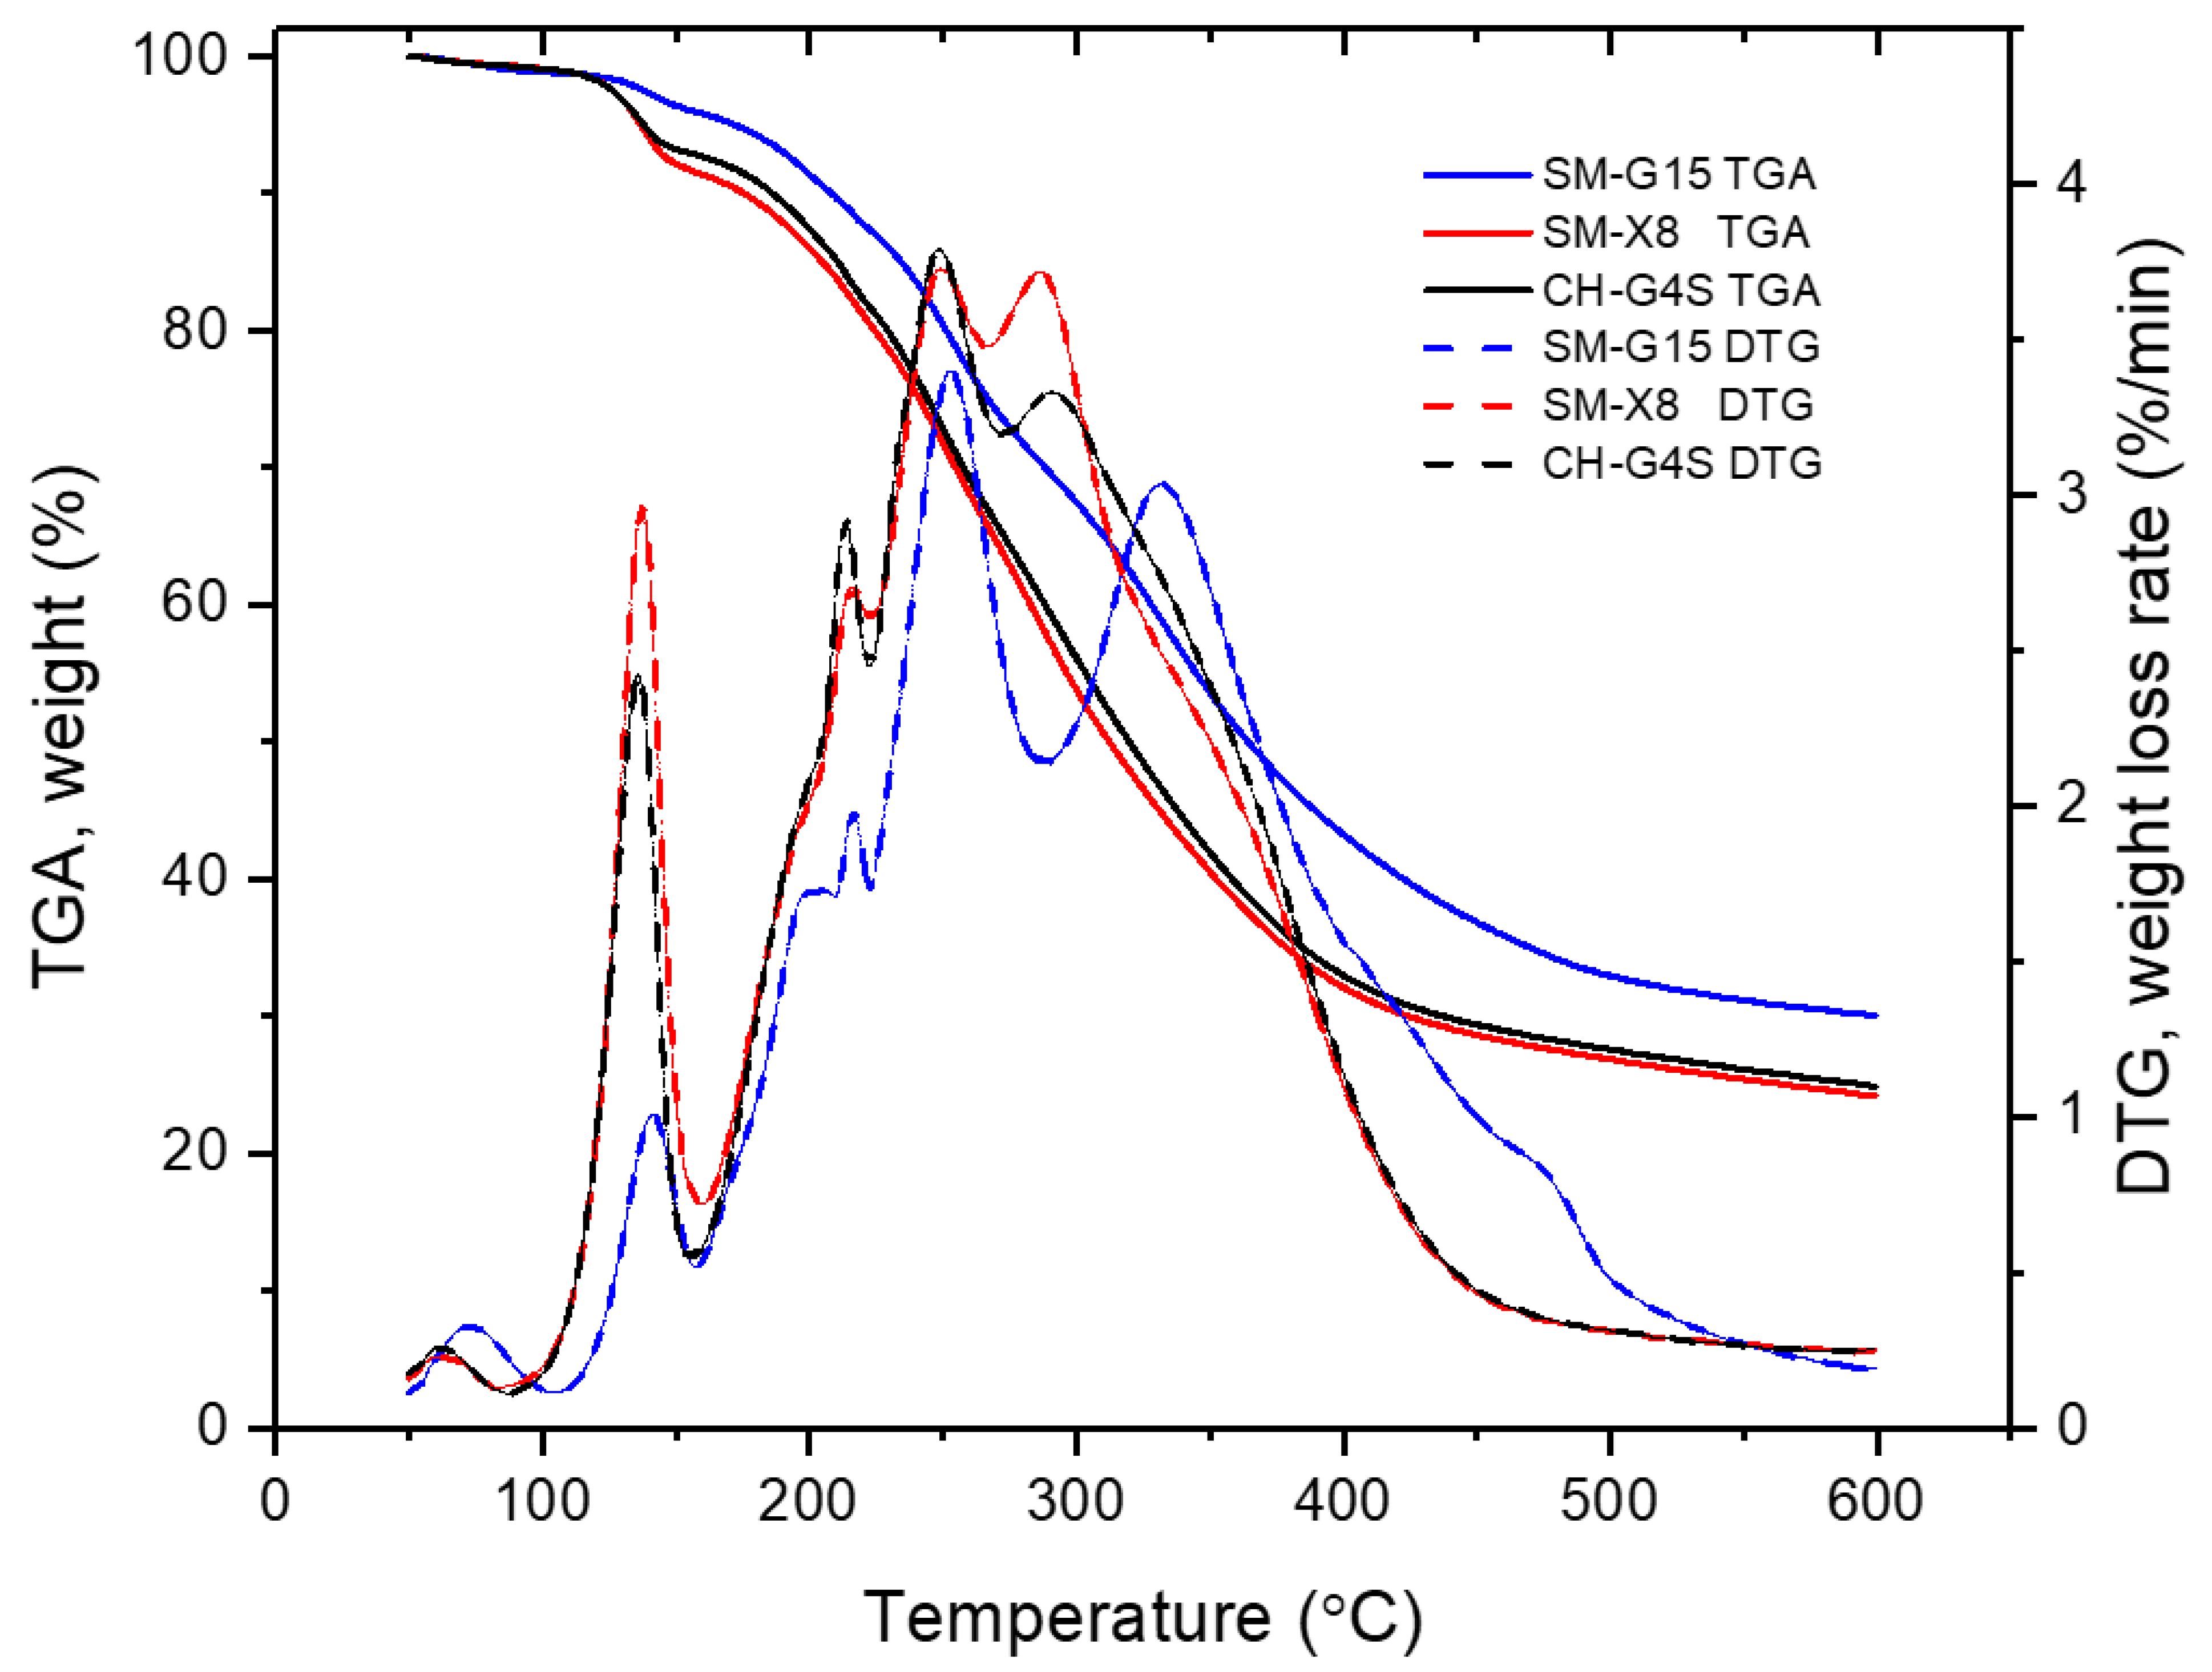
X-ray diffraction is a useful technique for evaluation of the amorphous and crystalline nature of biopolymers [36]. The XRD pattern of the EPS sample SM-G15 is displayed in Figure 8. A single broad peak with the center at 2θ around 19.5° indicates the domination of the non-crystalline phases in the EPS. At around 22.5°, peaks from a crystalline biopolymer phase typically would be observed. A closer view reveals the absence of peaks in that area (insert in Figure 8). From the lack of peaks one can conclude that the XRD analysis revealed the amorphous nature of the produced EPS, which is typical for many microbial EPS preparations, although the crystalline forms of EPS are also common [37]. Crystalline forms of EPS exhibit different degrees of crystallinity [38]. EPS preparations produced by a thermophilic strain of B. licheniformis grown in tryptic soy broth with glucose as a carbon source [39] and by Rhizobium tropici grown on sucrose [40] were amorphous, whereas partial crystallinity was observed for EPS produced by Bacillus tequilensis cultivated on sucrose [41].

3.3.7. TGA

TGA analysis of the EPS preparations revealed a first weight loss between 100 and 160 °C (Figure 9), which was more remarkable (around 8%) for the EPS preparations from the xylose-based synthetic medium (SM-X8) and from hydrolysate (CH-G45) than for EPS from the glucose-based medium (SM-G15) (around 3%). The degradation peak was reached at 135 °C for SM-X8 and CH-G45, and at 142 °C for SM-G15. That weight loss can be explained by water desorption because of the dissociation of the hydrogen bonds. Previously, a similar peak has been related to the presence of carboxyl groups and has been interpreted as an indication of the water-retention capacity by the EPS produced by Rhodococcus erythropolis [42]. The lower degradation peak of SM-G15 compared to the other samples might indicate a lower water-retention capacity.
The second major weight loss, around 43%, was between 160 °C and around 410–460 °C. The largest weight loss rate was observed at 248 °C for SM-X8 and CH-G45, and at 252 °C for sample SM-G15. Since the highest degradation rate of the SM-G15 sample was achieved at a higher temperature than those of the other samples, one can infer that SM-G15 had higher thermal stability. At 290 °C, another degradation peak was observed for SM-X8 and CH-G45 samples, whereas SM-G15 remained rather stable at that point. Instead, the SM-G45 sample displayed a peak at 332 °C. After 410 °C for SM-X8 and CH-G45, and after 460 °C for SM-G15, no major changes were observed, and the sample weight remained rather stable. The weight losses in this second phase (between ~150 and ~450 °C) are related to charring reactions, as has been reported for EPS produced by Pediococcus damnosus 2.6 [43].
Thermal stability is an important property of EPS that are intended for commercial application, e.g., in the food industry. Although the EPS preparations from B. atrophaeus BU4 (this work) had lower thermal stability than structural polysaccharides such as hemicelluloses and cellulose [44], they are still thermally stable compared to previously reported bacterial EPS. For example, EPS produced by B. tequilensis exhibited a degradation temperature of 239 °C, and a 58% weight loss was observed at 300 °C [41]. EPS from B. licheniformis was degraded at 240 °C and lost 50% of the initial weight at 260 °C [37]. In comparison, the highest thermal degradation rate for the samples from BU4 was observed at 248–252 °C, and the weight loss up to 275 °C was 27% for SM-G15 and 36% for the other samples. SM-G15 was more stable than the other two samples, and that was especially remarkable in the temperature range up to 300 °C. The thermal stability of the SM-G15 sample is in agreement with the results previously reported by us for an EPS produced by the same bacterial strain cultivated in a similar glucose-based synthetic medium [13]. The only difference is some dephasing of the degradation peaks. For instance, the peaks observed here at 142, 217, and 252 °C were detected at 152, 209, and 244 °C in that study, and the peak at 332 °C was stronger in the current work. The difference can be attributed to the use of different instruments in both studies. The precision of the values that we are reporting now is backed by the high calibration accuracy of the instrument used in the current study.

4. Conclusions

A halotolerant bacterium isolated from a high-salinity habitat was identified as Bacillus atrophaeus, and its ability to grow and produce EPS on glucose and xylose was demonstrated. Remarkable differences in the growth of the bacterial strain in cellulosic and hemicellulosic hydrolysates of quinoa stalks were demonstrated.
SEC, FTIR, NMR, and SEM revealed similarities between EPS from glucose- and xylose-based synthetic media, while the EPS from cellulosic hydrolysate was slightly different. The sugar unit composition of the EPS produced were comparable regardless of cultivation media differences. EPS from B. atrophaeus BU4 exhibit good thermal stability, an amorphous nature, and water-retention capacity, which are useful features for applications in the food and pharmaceutical industries.

Author Contributions

Conceptualization: C.M., C.C. and L.J.J.; methodology: C.M., C.C. and L.J.J.; formal analysis: D.C., E.N., K.M., A.G., M.H., M.C., M.B. and O.S.; investigation: D.C., J.L. and L.R.-S.; resources: C.M., C.C. and L.J.J.; writing—original draft preparation: D.C., C.M., J.L. and E.N.; writing—review and editing: C.M., C.C. and L.J.J.; visualization: C.M., J.L. and E.N.; supervision: C.M., C.C. and L.J.J.; project administration: C.M., C.C. and L.J.J.; funding acquisition: C.M., C.C. and L.J.J. All authors have read and agreed to the published version of the manuscript.

Funding

This research was funded by the Swedish Research Council (2016-05822) and the Bio4Energy research environment (www.bio4energy.se; accessed on 20 December 2021).

Institutional Review Board Statement

Not applicable.

Informed Consent Statement

Not applicable.

Acknowledgments

Stefan Stagge is thanked for support with HPLC and HPAEC. The core facilities and technical platforms at the Chemical Biological Center (KBC) of Umeå University and of the Swedish University of Agricultural Sciences (SLU) are gratefully acknowledged for the provided support. The Biopolymer Analytical Platform supported with the HPSEC. The Vibrational Spectroscopy Core Facility performed the FTIR analysis. The NMR Core Facility provided the HSQC NMR spectra. Umeå Centre for Electron Microscopy and National Microscopy Infrastructure (UCEM-NMI) provided the SEM images.

Conflicts of Interest

The authors declare no conflict of interest.

References

  1. Poli, A.; Finore, I.; Romano, I.; Gioiello, A.; Lama, L.; Nicolaus, B. Microbial diversity in extreme marine habitats and their biomolecules. Microorganisms 2017, 5, 25. [Google Scholar] [CrossRef] [PubMed] [Green Version]
  2. Chen, G.-Q.; Jiang, X.-R. Next generation industrial biotechnology based on extremophilic bacteria. Curr. Opin. Biotechnol. 2018, 50, 94–100. [Google Scholar] [CrossRef] [PubMed]
  3. Kushner, D.J. Life in high salt and solute concentrations: Halophilic bacteria. In Microbial Life in Extreme Environments; Kushner, D.J., Ed.; Academic Press: London, UK, 1978; pp. 317–368. [Google Scholar]
  4. Poli, A.; Anzelmo, G.; Nicolaus, B. Bacterial exopolysaccharides from extreme marine habitats: Production, characterization and biological activities. Mar. Drugs 2010, 8, 1779–1802. [Google Scholar] [CrossRef] [PubMed]
  5. Banerjee, A.; Sarkar, S.; Govil, T.; González-Faune, P.; Cabrera-Barjas, G.; Bandopadhyay, R.; Salem, D.R.; Sani, R.K. Extremophilic exopolysaccharides: Biotechnologies and wastewater remediation. Front. Microbiol. 2021, 12, 2349. [Google Scholar] [CrossRef] [PubMed]
  6. Daba, G.M.; Elnahas, M.O.; Elkhateeb, W.A. Contributions of exopolysaccharides from lactic acid bacteria as biotechnological tools in food, pharmaceutical, and medical applications. Int. J. Biol. Macromol. 2021, 173, 79–89. [Google Scholar] [CrossRef] [PubMed]
  7. Angelin, J.; Kavitha, M. Exopolysaccharides from probiotic bacteria and their health potential. Int. J. Biol. Macromol. 2020, 162, 853–865. [Google Scholar] [CrossRef] [PubMed]
  8. Potnis, A.A.; Raghavan, P.S.; Rajaram, H. Overview on cyanobacterial exopolysaccharides and biofilms: Role in bioremediation. Rev. Environ. Sci. Bio/Technol. 2021, 20, 781–794. [Google Scholar] [CrossRef]
  9. Govarthanan, M.; Jeon, C.-H.; Jeon, Y.-H.; Kwon, J.-H.; Bae, H.; Kim, W. Non-toxic nano approach for wastewater treatment using Chlorella vulgaris exopolysaccharides immobilized in iron-magnetic nanoparticles. Int. J. Biol. Macromol. 2020, 162, 1241–1249. [Google Scholar] [CrossRef]
  10. Quillaguamán, J.; Delgado, O.; Mattiasson, B.; Hatti-Kaul, R. Chromohalobacter sarecensis sp. nov., a psychrotolerant moderate halophile isolated from the saline Andean region of Bolivia. Int. J. Syst. Evol. Microbiol. 2004, 54, 1921–1926. [Google Scholar] [CrossRef]
  11. Guzmán, H.; Van-Thuoc, D.; Martín, J.; Hatti-Kaul, R.; Quillaguamán, J. A process for the production of ectoine and poly(3-hydroxybutyrate) by Halomonas boliviensis. Appl. Microbiol. Biotechnol. 2009, 84, 1069–1077. [Google Scholar] [CrossRef]
  12. Guzmán, D.; Quillaguamán, J.; Muñoz, M.; Hatti-Kaul, R. Halomonas andesensis sp. nov., a moderate halophile isolated from the saline lake Laguna Colorada in Bolivia. Int. J. Syst. Evol. Microbiol. 2010, 60, 749–753. [Google Scholar] [CrossRef] [PubMed] [Green Version]
  13. Chambi, D.; Romero-Soto, L.; Villca, R.; Orozco-Gutiérrez, F.; Vega-Baudrit, J.; Quillaguamán, J.; Hatti-Kaul, R.; Martín, C.; Carrasco, C. Exopolysaccharides production by cultivating a bacterial isolate from the hypersaline environment of Salar de Uyuni (Bolivia) in pretreatment liquids of steam-exploded quinoa stalks and enzymatic hydrolysates of curupaú sawdust. Fermentation 2021, 7, 33. [Google Scholar] [CrossRef]
  14. Alandia, G.; Rodriguez, J.P.; Jacobsen, S.-E.; Bazile, D.; Condori, B. Global expansion of quinoa and challenges for the Andean region. Glob. Food Secur. 2020, 26, 100429. [Google Scholar] [CrossRef]
  15. Gil-Ramirez, A.; Salas-Veizaga, D.M.; Grey, C.; Karlsson, E.N.; Rodriguez-Meizoso, I.; Linares-Pastén, J.A. Integrated process for sequential extraction of saponins, xylan and cellulose from quinoa stalks (Chenopodium quinoa Willd). Ind. Crops Prod. 2018, 121, 54–65. [Google Scholar] [CrossRef]
  16. Carrasco, C.; Cuno, D.; Carlqvist, K.; Galbe, M.; Lidén, G. SO2-catalysed steam pretreatment of quinoa stalks. J. Chem. Technol. Biotechnol. 2015, 90, 64–71. [Google Scholar] [CrossRef]
  17. Carrasco, C.; Jönsson, L.J.; Martín, C. Hydrothermal pretreatment of water-extracted and aqueous ethanol-extracted quinoa stalks for enzymatic saccharification of cellulose. Energies 2021, 14, 4102. [Google Scholar] [CrossRef]
  18. Fendrihan, S.; Dornmayr-Pfaffenhuemer, M.; Gerbl, F.W.; Holzinger, A.; Grösbacher, M.; Briza, P.; Erler, A.; Gruber, C.; Plätzer, K.; Stan-Lotter, H. Spherical particles of halophilic archaea correlate with exposure to low water activity—Implications for microbial survival in fluid inclusions of ancient halite. Geobiology 2012, 10, 424–433. [Google Scholar] [CrossRef] [Green Version]
  19. Davis, J.J.; Wattam, A.R.; Aziz, R.K.; Brettin, T.; Butler, R.; Butler, R.M.; Chlenski, P.; Conrad, N.; Dickerman, A.; Dietrich, E.M.; et al. The PATRIC bioinformatics resource center: Expanding data and analysis capabilities. Nucleic Acids Res. 2019, 48, D606–D612. [Google Scholar] [CrossRef] [Green Version]
  20. Ondov, B.D.; Treangen, T.J.; Melsted, P.; Mallonee, A.B.; Bergman, N.H.; Koren, S.; Phillippy, A.M. Mash: Fast genome and metagenome distance estimation using MinHash. Genome Biol. 2016, 17, 132. [Google Scholar] [CrossRef] [Green Version]
  21. Rodriguez-R, L.M.; Gunturu, S.; Harvey, W.T.; Rosselló-Mora, R.; Tiedje, J.M.; Cole, J.R.; Konstantinidis, K.T. The microbial genomes atlas (MiGA) Webserver: Taxonomic and gene diversity analysis of archaea and bacteria at the whole genome level. Nucleic Acids Res. 2018, 46, W282–W288. [Google Scholar] [CrossRef]
  22. Bradford, M.M. A rapid and sensitive method for the quantitation of microgram quantities of protein utilizing the principle of protein-dye binding. Anal. Biochem. 1976, 72, 248–254. [Google Scholar] [CrossRef]
  23. Kanamarlapudi, S.L.R.K.; Muddada, S. Characterization of exopolysaccharide produced by Streptococcus thermophilus CC30. Biomed. Res. Int. 2017, 2017, 4201809. [Google Scholar] [CrossRef] [PubMed] [Green Version]
  24. Sardari, R.R.R.; Kulcinskaja, E.; Ron, E.Y.C.; Björnsdóttir, S.; Friðjónsson, Ó.H.; Hreggviðsson, G.Ó.; Karlsson, E.N. Evaluation of the production of exopolysaccharides by two strains of the thermophilic bacterium Rhodothermus marinus. Carbohydr. Polym. 2017, 156, 1–8. [Google Scholar] [CrossRef] [PubMed] [Green Version]
  25. Jönsson, L.J.; Martín, C. Pretreatment of lignocellulose: Formation of inhibitory by-products and strategies for minimizing their effects. Bioresour. Technol. 2016, 199, 103–112. [Google Scholar] [CrossRef] [Green Version]
  26. Seo, W.T.; Kahng, G.G.; Nam, S.H.; Choi, S.D.; Suh, H.H.; Kim, S.W.; Park, Y.H. Isolation and characterization of a novel exopolysaccharide producing Paenibacillus sp. WN9 KCTC 8951P. J. Microbiol. Biotechnol. 1999, 9, 820–825. [Google Scholar]
  27. Han, Y.; Liu, E.; Liu, L.; Zhang, B.; Wang, Y.; Gui, M.; Wu, R.; Li, P. Rheological, emulsifying and thermostability properties of two exopolysaccharides produced by Bacillus amyloliquefaciens LPL061. Carbohydr. Polym. 2015, 115, 230–237. [Google Scholar] [CrossRef]
  28. Chikkanna, A.; Ghosh, D.; Kishore, A. Expression and characterization of a potential exopolysaccharide from a newly isolated halophilic thermotolerant bacteria Halomonas nitroreducens strain WB1. PeerJ 2018, 6, e4684. [Google Scholar] [CrossRef] [Green Version]
  29. Zhu, W.; Wang, Y.; Yan, F.; Song, R.; Li, Z.; Li, Y.; Song, B. Physical and chemical properties, percutaneous absorption-promoting effects of exopolysaccharide produced by Bacillus atrophaeus WYZ strain. Carbohydr. Polym. 2018, 192, 52–60. [Google Scholar] [CrossRef]
  30. Čopíková, J.; Barros, A.S.; Šmídová, I.; Černá, M.; Teixeira, D.H.; Delgadillo, I.; Synytsya, A.; Coimbra, M.A. Influence of hydration of food additive polysaccharides on FT-IR spectra distinction. Carbohydr. Polym. 2006, 63, 355–359. [Google Scholar] [CrossRef]
  31. Naumann, D. FT-Infrared and FT-Raman Spectroscopy in Biomedical Research. In Infrared and Raman Spectroscopy of Biological Materials; Practical Spectroscopy Series; Gremlich, H.-U., Yan, B., Eds.; Marcel Dekker Inc.: New York, NY, USA, 2001; Volume 24, pp. 323–377. [Google Scholar]
  32. Hounsell, E.F. 1H NMR in the structural and conformational analysis of oligosaccharides and glycoconjugates. Prog. Nucl. Magn. Reson. Spectrosc. 1995, 27, 445–474. [Google Scholar] [CrossRef]
  33. Beier, R.C.; Mundy, B.P.; Strobel, G.A. Assignment of anomeric configuration and identification of carbohydrate residues by 13C NMR. 1. galacto- and glucopyranosides and furanosides. Can. J. Chem. 1980, 58, 2800–2804. [Google Scholar] [CrossRef]
  34. Cantu-Jungles, T.M.; Iacomini, M.; Cipriani, T.R.; Cordeiro, L.M.C. Extraction and characterization of pectins from primary cell walls of edible açaí (Euterpe oleraceae) berries, fruits of a monocotyledon palm. Carbohydr. Polym. 2017, 158, 37–43. [Google Scholar] [CrossRef] [PubMed]
  35. Capek, P.; Matulová, M.; Navarini, L.; Suggi-Liverani, F. Structural features of an arabinogalactan-protein isolated from instant coffee powder of coffea arabica beans. Carbohydr. Polym. 2010, 80, 180–185. [Google Scholar] [CrossRef]
  36. Park, S.; Baker, J.O.; Himmel, M.E.; Parilla, P.A.; Johnson, D.K. Cellulose crystallinity index: Measurement techniques and their impact on interpreting cellulase performance. Biotechnol. Biofuels 2010, 3, 10. [Google Scholar] [CrossRef] [Green Version]
  37. Sardjono, S.A.; Suryanto, H.; Aminnudin; Muhajir, M. Crystallinity and morphology of the bacterial nanocellulose membrane extracted from pineapple peel waste using high-pressure homogenizer. AIP Conf. Proc. 2019, 2120, 080015. [Google Scholar] [CrossRef]
  38. Wingender, J.; Neu, T.R.; Flemming, H.-C. Microbial Extracellular Polymeric Substances—Characterization, Structure and Function; Springer: Berlin/Heidelberg, Germany, 1999. [Google Scholar]
  39. Spanò, A.; Gugliandolo, C.; Lentini, V.; Maugeri, T.; Anzelmo, G.; Poli, A.; Nicolaus, B. A novel EPS-producing strain of Bacillus licheniformis isolated from a shallow vent off Panarea Island (Italy). Curr. Microbiol. 2013, 67, 21–29. [Google Scholar] [CrossRef]
  40. Castellane, T.C.L.; Campanharo, J.C.; Colnago, L.A.; Coutinho, I.D.; Lopes, É.M.; Lemos, M.V.F.; de Macedo Lemos, E.G. Characterization of new exopolysaccharide production by Rhizobium tropici during growth on hydrocarbon substrate. Int. J. Biol. Macromol. 2017, 96, 361–369. [Google Scholar] [CrossRef]
  41. Rani, R.P.; Anandharaj, M.; Sabhapathy, P.; Ravindran, A.D. Physiochemical and biological characterization of novel exopolysaccharide produced by Bacillus tequilensis FR9 isolated from chicken. Int. J. Biol. Macromol. 2017, 96, 1–10. [Google Scholar] [CrossRef]
  42. Hu, X.; Li, D.; Qiao, Y.; Wang, X.; Zhang, Q.; Zhao, W.; Huang, L. Purification, characterization and anticancer activities of exopolysaccharide produced by Rhodococcus erythropolis HX-2. Int. J. Biol. Macromol. 2020, 145, 646–654. [Google Scholar] [CrossRef]
  43. Zamora, F.; González, M.C.; Dueñas, M.T.; Irastorza, A.; Velasco, S.; Ibarburu, I. Thermodegradation and thermal transitions of an exopolysaccharide produced by Pediococcus damnosus 2.6. J. Macromol. Sci. Part B 2002, 41, 473–486. [Google Scholar] [CrossRef]
  44. Werner, K.; Pommer, L.; Broström, M. Thermal decomposition of hemicelluloses. J. Anal. Appl. Pyrolysis 2014, 110, 130–137. [Google Scholar] [CrossRef]
Figure 1. Characterization of the bacterial isolate: SEM images showing the BU4 isolate (a) at 15,000× and (b) 30,000× magnification. Arrows indicate (a) EPS covering and connecting bacteria, and (b) EPS strands connecting clusters of bacteria. Phylogenetic tree (c) based on single-copy genes identified by next-generation sequencing. Support values calculated by RAxML using 100 rounds of “Rapid bootstrapping” are provided.
Fermentation 08 00079 g001
Figure 2. Dynamics of the cultivation of B. atrophaeus BU4 in glucose-based synthetic media: (a) consumption of glucose (circles) and xylose (triangles) in SM-G45; (b) OD (squares) and protein (rhombs) consumption in SM-G45; (c) glucose consumption in SM-G30 (filled circles) and SM-G15 (empty circles); (d) OD (squares) and protein consumption (rhombs) in SM-G30 (filled symbols) and SM-G15 (empty symbols).
Fermentation 08 00079 g002
Figure 3. Sugar consumption (a) and cell growth and protein consumption (b) during cultivation of B. atrophaeus BU4 in synthetic media containing 16 g/L (filled symbols) or 8 g/L (empty symbols) initial xylose. Xylose, triangles; OD, squares; protein, rhombs.
Fermentation 08 00079 g003
Figure 4. Sugar consumption and cell growth during cultivation of B. atrophaeus BU4 in cellulosic hydrolysates containing 15 (a), 30 (b), or 45 (c) g/L glucose. Glucose, circles; xylose, triangles; OD, squares.
Fermentation 08 00079 g004aFermentation 08 00079 g004b
Figure 5. Total area-normalized FTIR spectra in the 1800–480 cm−1 region of EPS produced by cultivation of B. atrophaeus BU4 in glucose- (SM-G15) and xylose-based (SM-X8) synthetic media and in a quinoa stalk cellulosic hydrolysate (CH-G45). Black arrows indicate peaks that are common for all EPS preparations, and red arrows indicate peaks that are specific for some samples.
Fermentation 08 00079 g005
Figure 6. Anomeric region of 2D 1H-13C HSQC NMR spectra of EPS produced by cultivation of B. atrophaeus BU4 in glucose- (SM-G15) and xylose-based (SM-X8) synthetic media and in a quinoa stalk cellulosic hydrolysate (CH-G45).
Fermentation 08 00079 g006
Figure 7. SEM images of EPS produced by cultivation of B. atrophaeus BU4 in glucose- (SM-G15) (a) and xylose-based (SM-X8) (b) synthetic media, and in a quinoa stalk cellulosic hydrolysate (CH-G45) (c). Magnification 5000× for (a) and (c), and 10,000× for (b).
Fermentation 08 00079 g007aFermentation 08 00079 g007b
Figure 8. X-ray diffraction pattern of EPS produced by cultivation of B. atrophaeus BU4 in a glucose-based synthetic medium (SM-G15). The insert shows a magnification of the area around the peak center.
Fermentation 08 00079 g008
Figure 9. Thermogravimetric (solid lines) and derivative thermogravimetric (dashed lines) curves resulting from the TGA analysis of EPS produced by cultivation of B. atrophaeus BU4 in glucose- (SM-G15) and xylose-based (SM-X8) synthetic media, and in a quinoa stalk cellulosic hydrolysate (CH-G45).
Fermentation 08 00079 g009
Table 1. Average sequence identities to the reference datasets 1.
DatasetAAI (%)ANI (%)Fraction of Genome Shared (%)
B. atrophaeus NZ CP0215009597.0191.85
B. atrophaeus NZ CP0240519596.9690.96
B. atrophaeus 1942 NC 0146399596.9190.89
1 Standard deviations for AAI% and ANI% values were <0.10.
Table 2. Concentrations of sugars, furan aldehydes, and aliphatic acids in hydrolysates (g/L, mean values of triplicates). Standard deviations are shown in parentheses.
Cellulosic HydrolysateHemicellulosic Hydrolysate
Glucose48.0 (1.3)1.5 (0.1)
Xylose4.9 (0.5)16.3 (0.7)
Mannose 0.9 (<0.1)2.4 (0.1)
Galactose 0.4 (<0.1)1.5 (<0.1)
Arabinose0.3 (<0.1)1.1 (<0.1)
FurfuralN.D. 14.7 (0.1)
HMFN.D. 10.5 (<0.1)
Acetic acid1.0 (<0.1)5.6 (0.1)
Formic acidN.D. 11.4 (<0.1)
Levulinic acidN.D. 11.1 (0.1)
1 Not detected.
Table 3. Summary of the used media and achieved EPS yield in the cultivations.
MediumCarbon Source/Initial Concentration, g/LNomenclatureYInit 1, g/gYCons. 2, g/g
Glucose-based synthetic mediumGlucose/45, xylose/5SM-G450.018 30.104 3
Glucose-based synthetic mediumGlucose/30SM-G300.033 30.097 3
Glucose-based synthetic mediumGlucose/15SM-G150.0640.075
Xylose-based synthetic mediumXylose/16SM-X160.0220.135
Xylose-based synthetic mediumXylose/8SM-X80.0470.126
Cellulosic hydrolysateGlucose/45, xylose/5CH-G450.0180.043
Cellulosic hydrolysateGlucose/30CH-G300.031 30.111 3
Hemicellulosic hydrolysateXylose/16HcH-X16--
Hemicellulosic hydrolysateXylose/8HcH-X8--
1 EPS yield based on initial sugar; 2 EPS yield based on consumed sugar; 3 Subjected to TCA directly after cold ethanol precipitation.
Table 4. Relative ratio of monosaccharide units in the EPS produced by cultivation of B. atrophaeus BU4 in xylose- (SM-X8) and glucose-based (SM-G15) synthetic media and in a quinoa stalk cellulosic hydrolysate (CH-G45). Values are mass fractions in percent based on the total mass of the identified sugars.
EPS PreparationGlucoseMannoseGalactoseArabinoseXylose
SM-G1549.6 (1.0)35.5 (0.9)8.2 (0.1)4.6 (<0.1)2.0 (0.1)
SM-X842.9 (4.5)36.2 (2.7)10.7 (1.2)6.5 (0.5)3.6 (0.3)
CH-G4541.4 (<0.1)40.2 (0.4)9.9 (<0.1)3.8 (0.2)4.7 (0.2)
Table 5. Molecular weight of the EPS produced by cultivation of B. atrophaeus BU4 in xylose- (SM-X8) and glucose-based (SM-G15) synthetic media and in a quinoa stalk cellulosic hydrolysate (CH-G15).
Peak 1Peak 2Peak 3
Mw, g/molMn, g/molPDI 1Mw, g/molMn, g/molPDI 1Mw, g/molMn, g/molPDI 1
SM-G159.1 × 1058.9 × 1051.04.7 × 1044.4 × 1041.1
9.2 × 1058.2 × 1051.16.1 × 1044.7 × 1041.3
SM-X88.7 × 1057.9 × 1041.16.1 × 1044.9 × 1041.22.2 × 1042.2 × 1041.0
CH-G154.7×1054.1×1051.2
1 PDI, polydispersity index, calculated as the ratio Mw/Mn.
Publisher’s Note: MDPI stays neutral with regard to jurisdictional claims in published maps and institutional affiliations.

