Article

Transcriptomic Analysis of Staphylococcus equorum KM1031, Isolated from the High-Salt Fermented Seafood Jeotgal, under Salt Stress

1
Department of Food and Nutrition, Dongduk Women’s University, Seoul 02748, Korea
2
Department of Food Science and Biotechnology, Kyonggi University, Suwon 16227, Korea
*
Author to whom correspondence should be addressed.
Submission received: 1 July 2022 / Revised: 8 August 2022 / Accepted: 16 August 2022 / Published: 19 August 2022
(This article belongs to the Special Issue Microbial Metabolism in Fermentation Process)

Abstract

:
Staphylococcus equorum is a potential starter for Korean high-salt fermented foods because of its salt tolerance and enzymatic activities that contribute to enhanced sensory properties of the food products. However, the mechanisms of salt tolerance of S. equorum are not fully understood. Here, RNA sequencing was performed on S. equorum strain KM1031 exposed to 7% NaCl (w/v) for 2 and 4 h to determine global gene expression changes. Salt pressure for 2 and 4 h resulted in significant differential expression of 4.8% (106/2209) and 6.1% (134/2209) of S. equorum KM1031 genes, respectively. Twenty-five core genes were differentially expressed on salt treatment for both 2 and 4 h, seven of which were related to osmoprotectant uptake and synthesis. We analyzed the genome of strain KM1031 and identified osmoprotectant uptake (Opu) systems, potassium importers, sodium exporters, and the glycine betaine synthesis system. The RNA sequencing results indicated that the OpuD system and glycine betaine synthesis might play the main roles in the salt tolerance of strain KM1031. Finally, the results of RNA sequencing were validated by quantitative real-time PCR of likely salt stress-related genes. This transcriptomic analysis provides evidence regarding the osmotic stress responses of S. equorum strain KM1031.

1. Introduction

Coagulase-negative staphylococci (CNS) are detected in various fermented foods, including meats, sausages, cheese, doenjang, and jeotgal [1,2,3,4,5,6,7,8]. Staphylococcus equorum is frequently isolated from high-salt fermented foods and contributes to the sensory enhancement of food through the degradation of macromolecules, such as proteins and lipids [6,9,10]. Therefore, it has been investigated as a potential starter candidate for the fermentation of high-salt foods [9,11,12,13].
Recent studies of bacterial communities in jeotgal, Korean high-salt fermented seafood, using nonculture- and culture-based methods identified CNS as major microbes [6,14,15]. S. equorum was a dominant species during the ripening of saeu-jeotgal and showed tolerance to NaCl concentrations of >15% (w/w), as well as protease and lipase activities [16,17]. Jeotgal is made by adding 20–30% (w/w) salt to seafoods such as shrimp, oysters, and fish intestines. Consequently, S. equorum is exposed to salt stress during the fermentation process, conditions in which it must survive and grow.
Genomes of several S. equorum strains from jeotgal have been reported [16,18]. However, our knowledge is limited about how S. equorum responds to the high salt content in the fermentation conditions, and its molecular mechanisms of salt tolerance are not fully understood. S. equorum strain KM1031 was isolated from jeotgal made from anchovy and grew at >15% (w/v) NaCl [17]. Here, to identify the transcriptional profiles of S. equorum strain KM1031 in conditions of salt stress, global transcriptomic changes of strain KM1031 were analyzed using RNA sequencing (RNA-seq) technology. Variations in gene expression associated with the adaption of S. equorum to salt were revealed.

2. Materials and Methods

2.1. Bacterial Strain and Culture Conditions

S. equorum strain KM1031 was isolated from myeolchi-jeotgal and characterized in our previous work [17]. The strain was cultured in tryptic soy broth (TSB; Difco, Detroit, MI, USA) at 37 °C for 24 h.
To check the salt tolerance, overnight culture of strain KM1031 in TSB was inoculated into fresh TSB and cultured until the optical density at 600 nm (OD600) reached 0.5. Then, the final NaCl concentration in the medium was adjusted to 7% or 14% (w/v) and cell growth was measured using a Synergy HT plate reader (BioTek, Winooski, VT, USA) for 20 h at 37 °C. All measurements were performed in triplicate using independent cultures.

2.2. Extraction, Purification, Sequencing, and Analysis of RNA from S. equorum

An overnight culture of S. equorum grown in TSB was used to inoculate fresh TSB at a final concentration of 1% (v/v), and then incubated at 30 °C. When OD600 reached 0.5, cells were treated with 7% NaCl (w/v, final concentration) for 2 and 4 h, respectively. Controls were prepared in the same conditions as the samples treated with salt for 2 h but without added salt. The cells were harvested and suspended in TSB containing lysostaphin (40 μg/mL) to disrupt the cell wall of S. equorum. Then, total RNAs were extracted and purified using TRIzol (Invitrogen, Waltham, MA, USA) or the RNeasy Midi Kit (QIAGEN, Hilden, Germany) with on-column DNase treatment, in accordance with the manufacturers’ protocols. RNA concentrations were determined using a Take3 micro-volume plate (BioTek).
Five micrograms of total RNA from each sample was used as starting material and subjected to an rRNA-removal process based on the subtractive hybridization/bead capture system of the Ribo-Zero Kit (Epicentre Biotechnologies, San Francisco, CA, USA). Purified RNA samples were used for mRNA-seq library construction using the Illumina TruSeq RNA Sample Preparation Kit v.2 (Illumina, San Diego, CA, USA). RNA-seq was performed by two runs of Illumina HiSeq to generate single-end reads of approximately 100 bp long. All RNA-seq data analyzed in this study, including whole transcriptome profiles (Tables S1 and S2), were deposited in the Sequence Read Archive (Nos. SRR11212789–SRR11212791).
Using the CLRNAseq program (Chunlab, Seoul, Korea), sequencing reads were mapped to the S. equorum strain KM1031 genome and normalized. Normalization methods employed in RNA-seq analysis included reads per kilobase of transcript per million mapped reads (RPKM), relative log expression (RLE), and trimmed mean of M-value (TMM) (Table S3). Because the coefficient of variation value for the TMM methods was lower than those for RPKM and RLE, and it has been reported previously that TMM is the most effective normalization method [19], TMM was used for the normalization of the expression level of genes. p-values were calculated using edgeR and |fold-change| values were calculated as (TMMsalt)/(TMMControl). For further experiments, differentially expressed genes (DEGs) with an absolute log2 |fold-change| > 2 were filtered among selected genes with a p-value of less than 0.05 and visualized using the CLRNAseq program (v. 1.00.06). Clusters of orthologous groups (COG) analysis [20] was used for functional grouping of all genes of strain KM1031. The proportion of DEGs in each functional group was calculated.

2.3. Genomic Analysis of S. equorum

The complete genome of strain KM1031 (GenBank Accession Nos. CP013980–CP013983) has been sequenced previously [16,21]. Genome sequence data of strain KM1031 were obtained from the NCBI database (accessed on 30 June 2022 at http://ncbi.nlm.nih.gov/genomes). Rapid Annotation using Subsystem Technology (RAST) [22] and CLgenomics™ v.1.55 software was used to determine gene contents based on functional subsystem classifications and to estimate the amino acid metabolic pathways.

2.4. Quantitative Real-Time RT-PCR (qRT-PCR)

The expression levels of specific genes were validated using qRT-PCR. qRT-PCR was performed using a C1000 Thermal Cycler (Bio-Rad, Hercules, CA, USA) with IQ™ SYBR®Green Supermix (Bio-Rad). Thermal cycling consisted of 3 min at 95 °C, followed by 40 cycles of 10 s at 95 °C and 30 s at 60 °C. The primers used for the detection of target genes are listed in Table S4. Expression levels of all genes were quantified in duplicate using three independent experiments. These analyses were performed on the same batches of RNA as those used for transcriptomic experiments. The 16S rRNA gene was used as the reference gene for normalization; results were normalized using the comparative cycle threshold method [23].

3. Results and Discussion

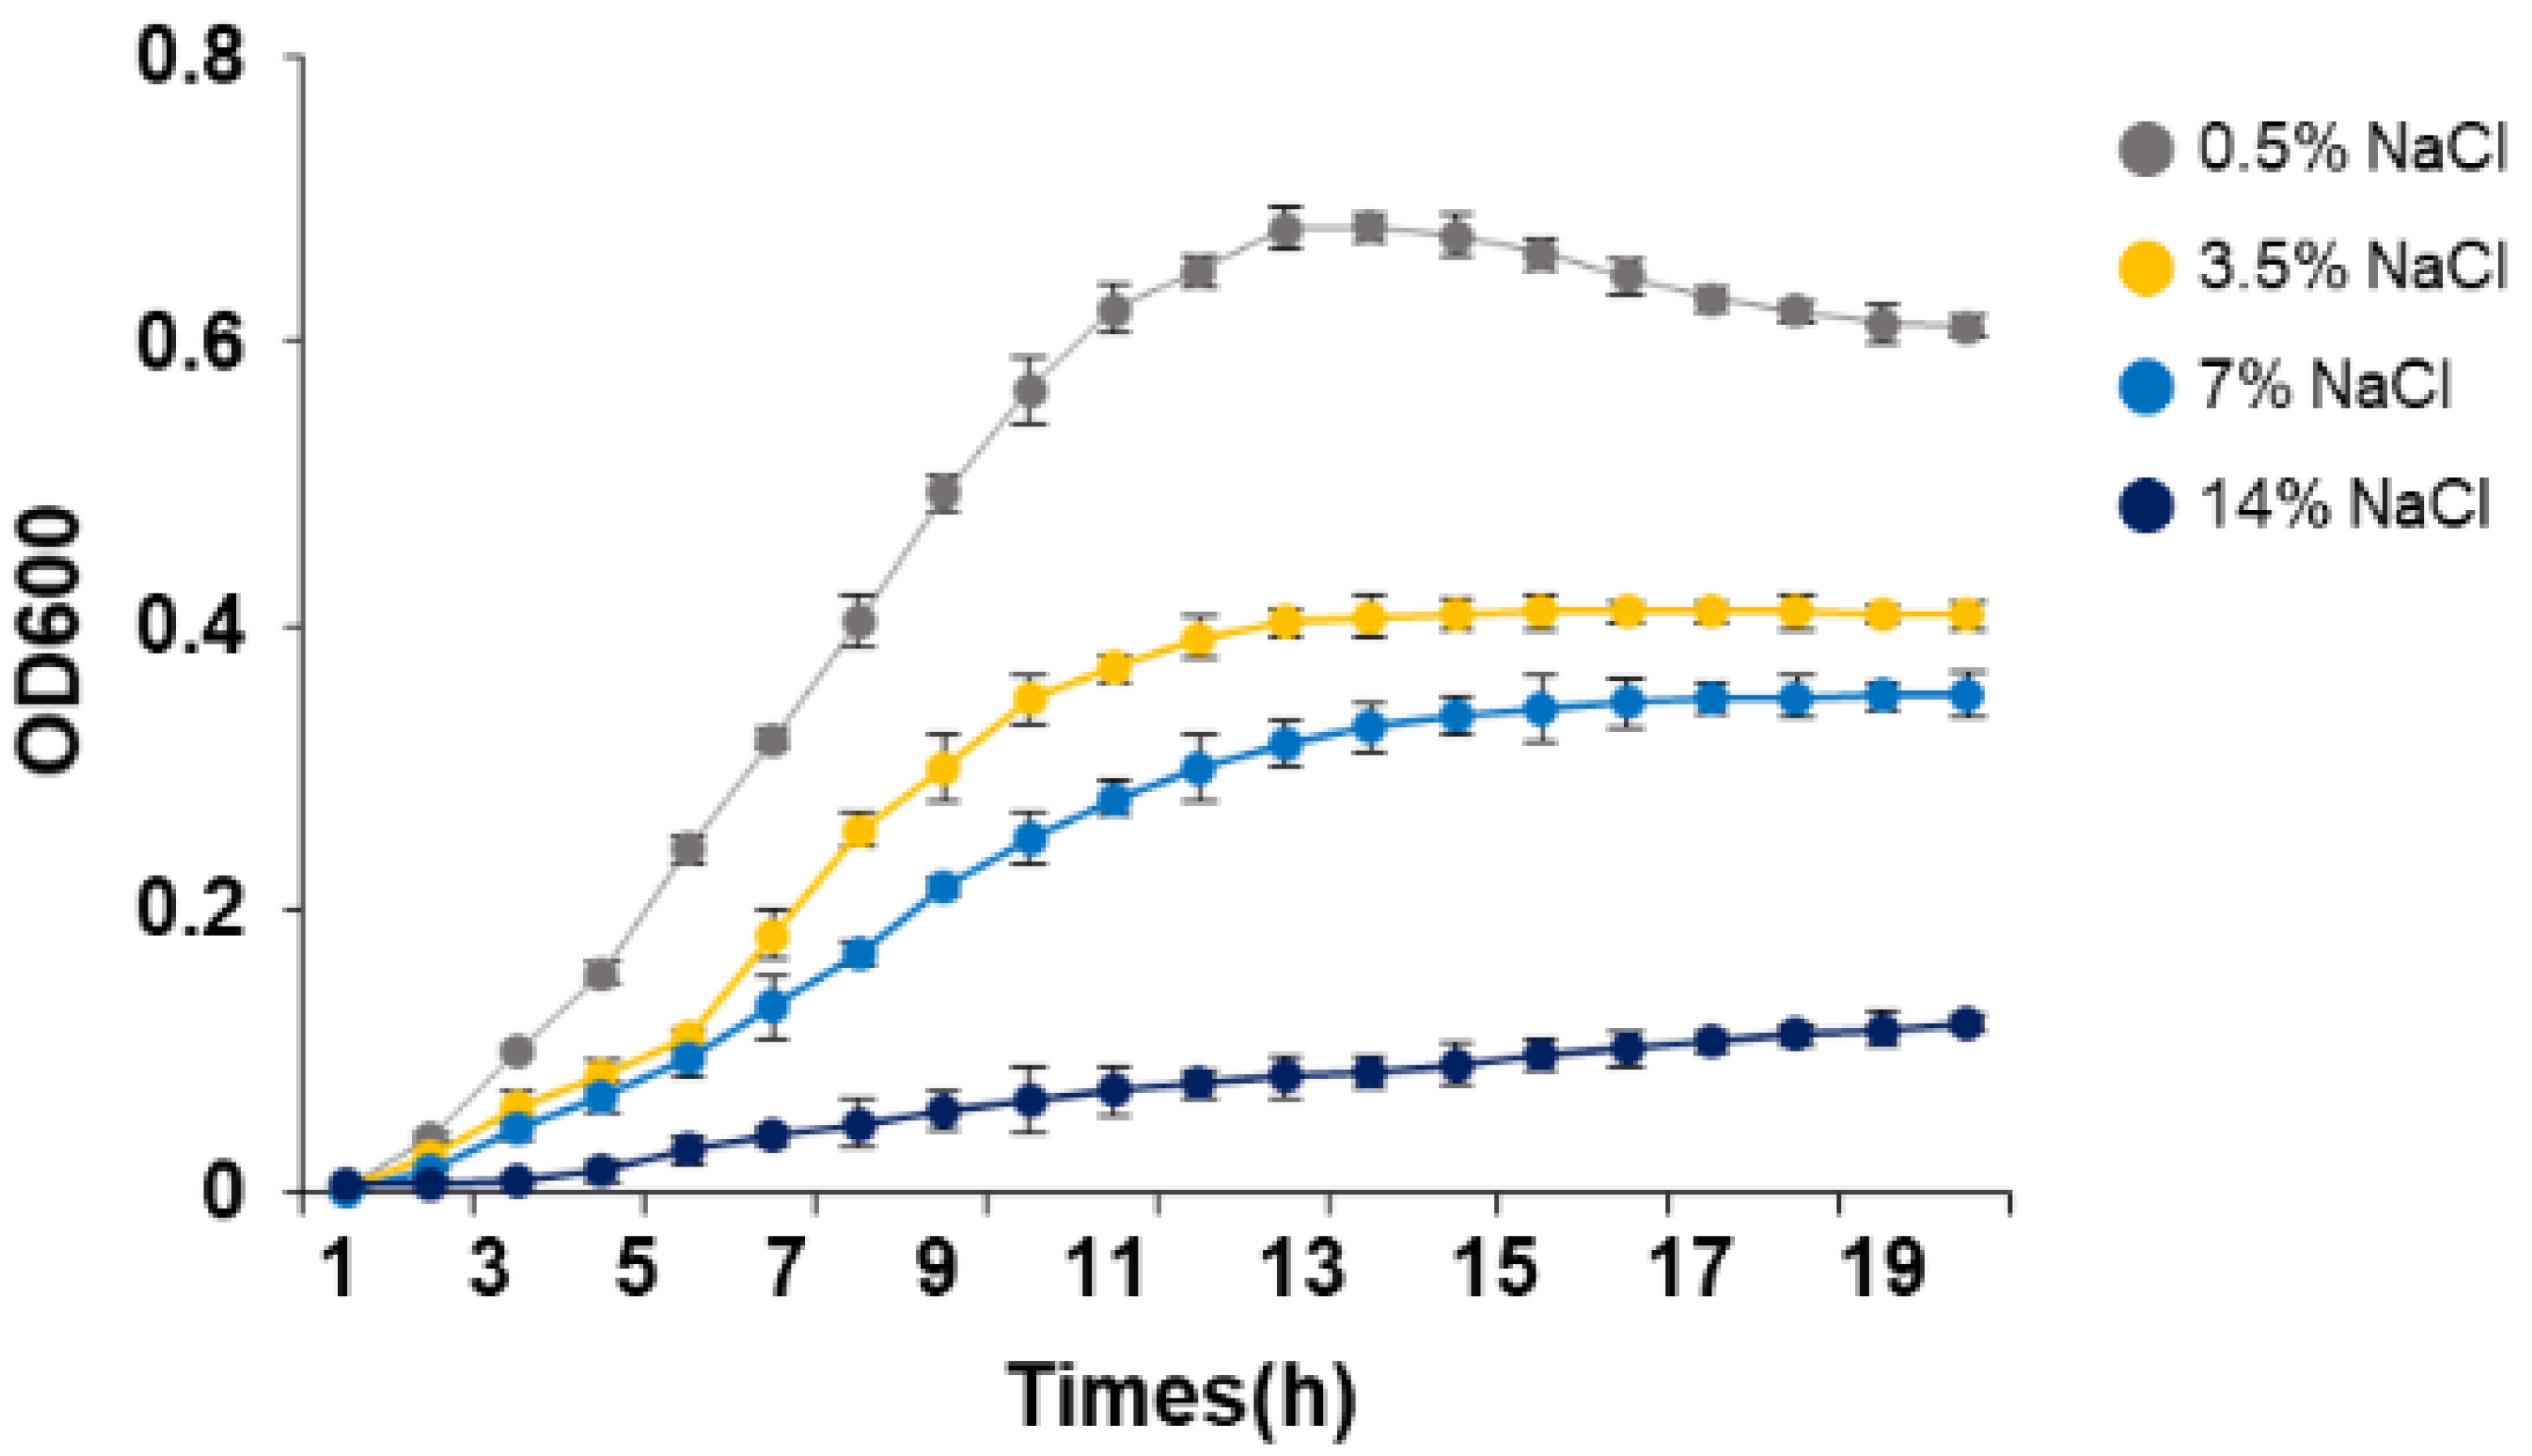
3.1. Growth of S. equorum under Salt Stress

Our previous studies showed that strain KM1031 grew in the presence of >15% NaCl [16]. Here, to determine the NaCl concentration for growth suppression of strain KM1031 for RNA-seq, we checked the cell growth at different NaCl concentrations (Figure 1). Growth of S. equorum strain KM1031 was increasingly inhibited by increasing salt concentration, and very slow growth was observed when salt was added to a final concentration of 14% (w/v). Growth was inhibited approximately twice as much at a salt concentration of 7% as at a salt concentration of 0.5%; thus, we decided that the former was a suitable concentration for conducting research related to salt resistance.

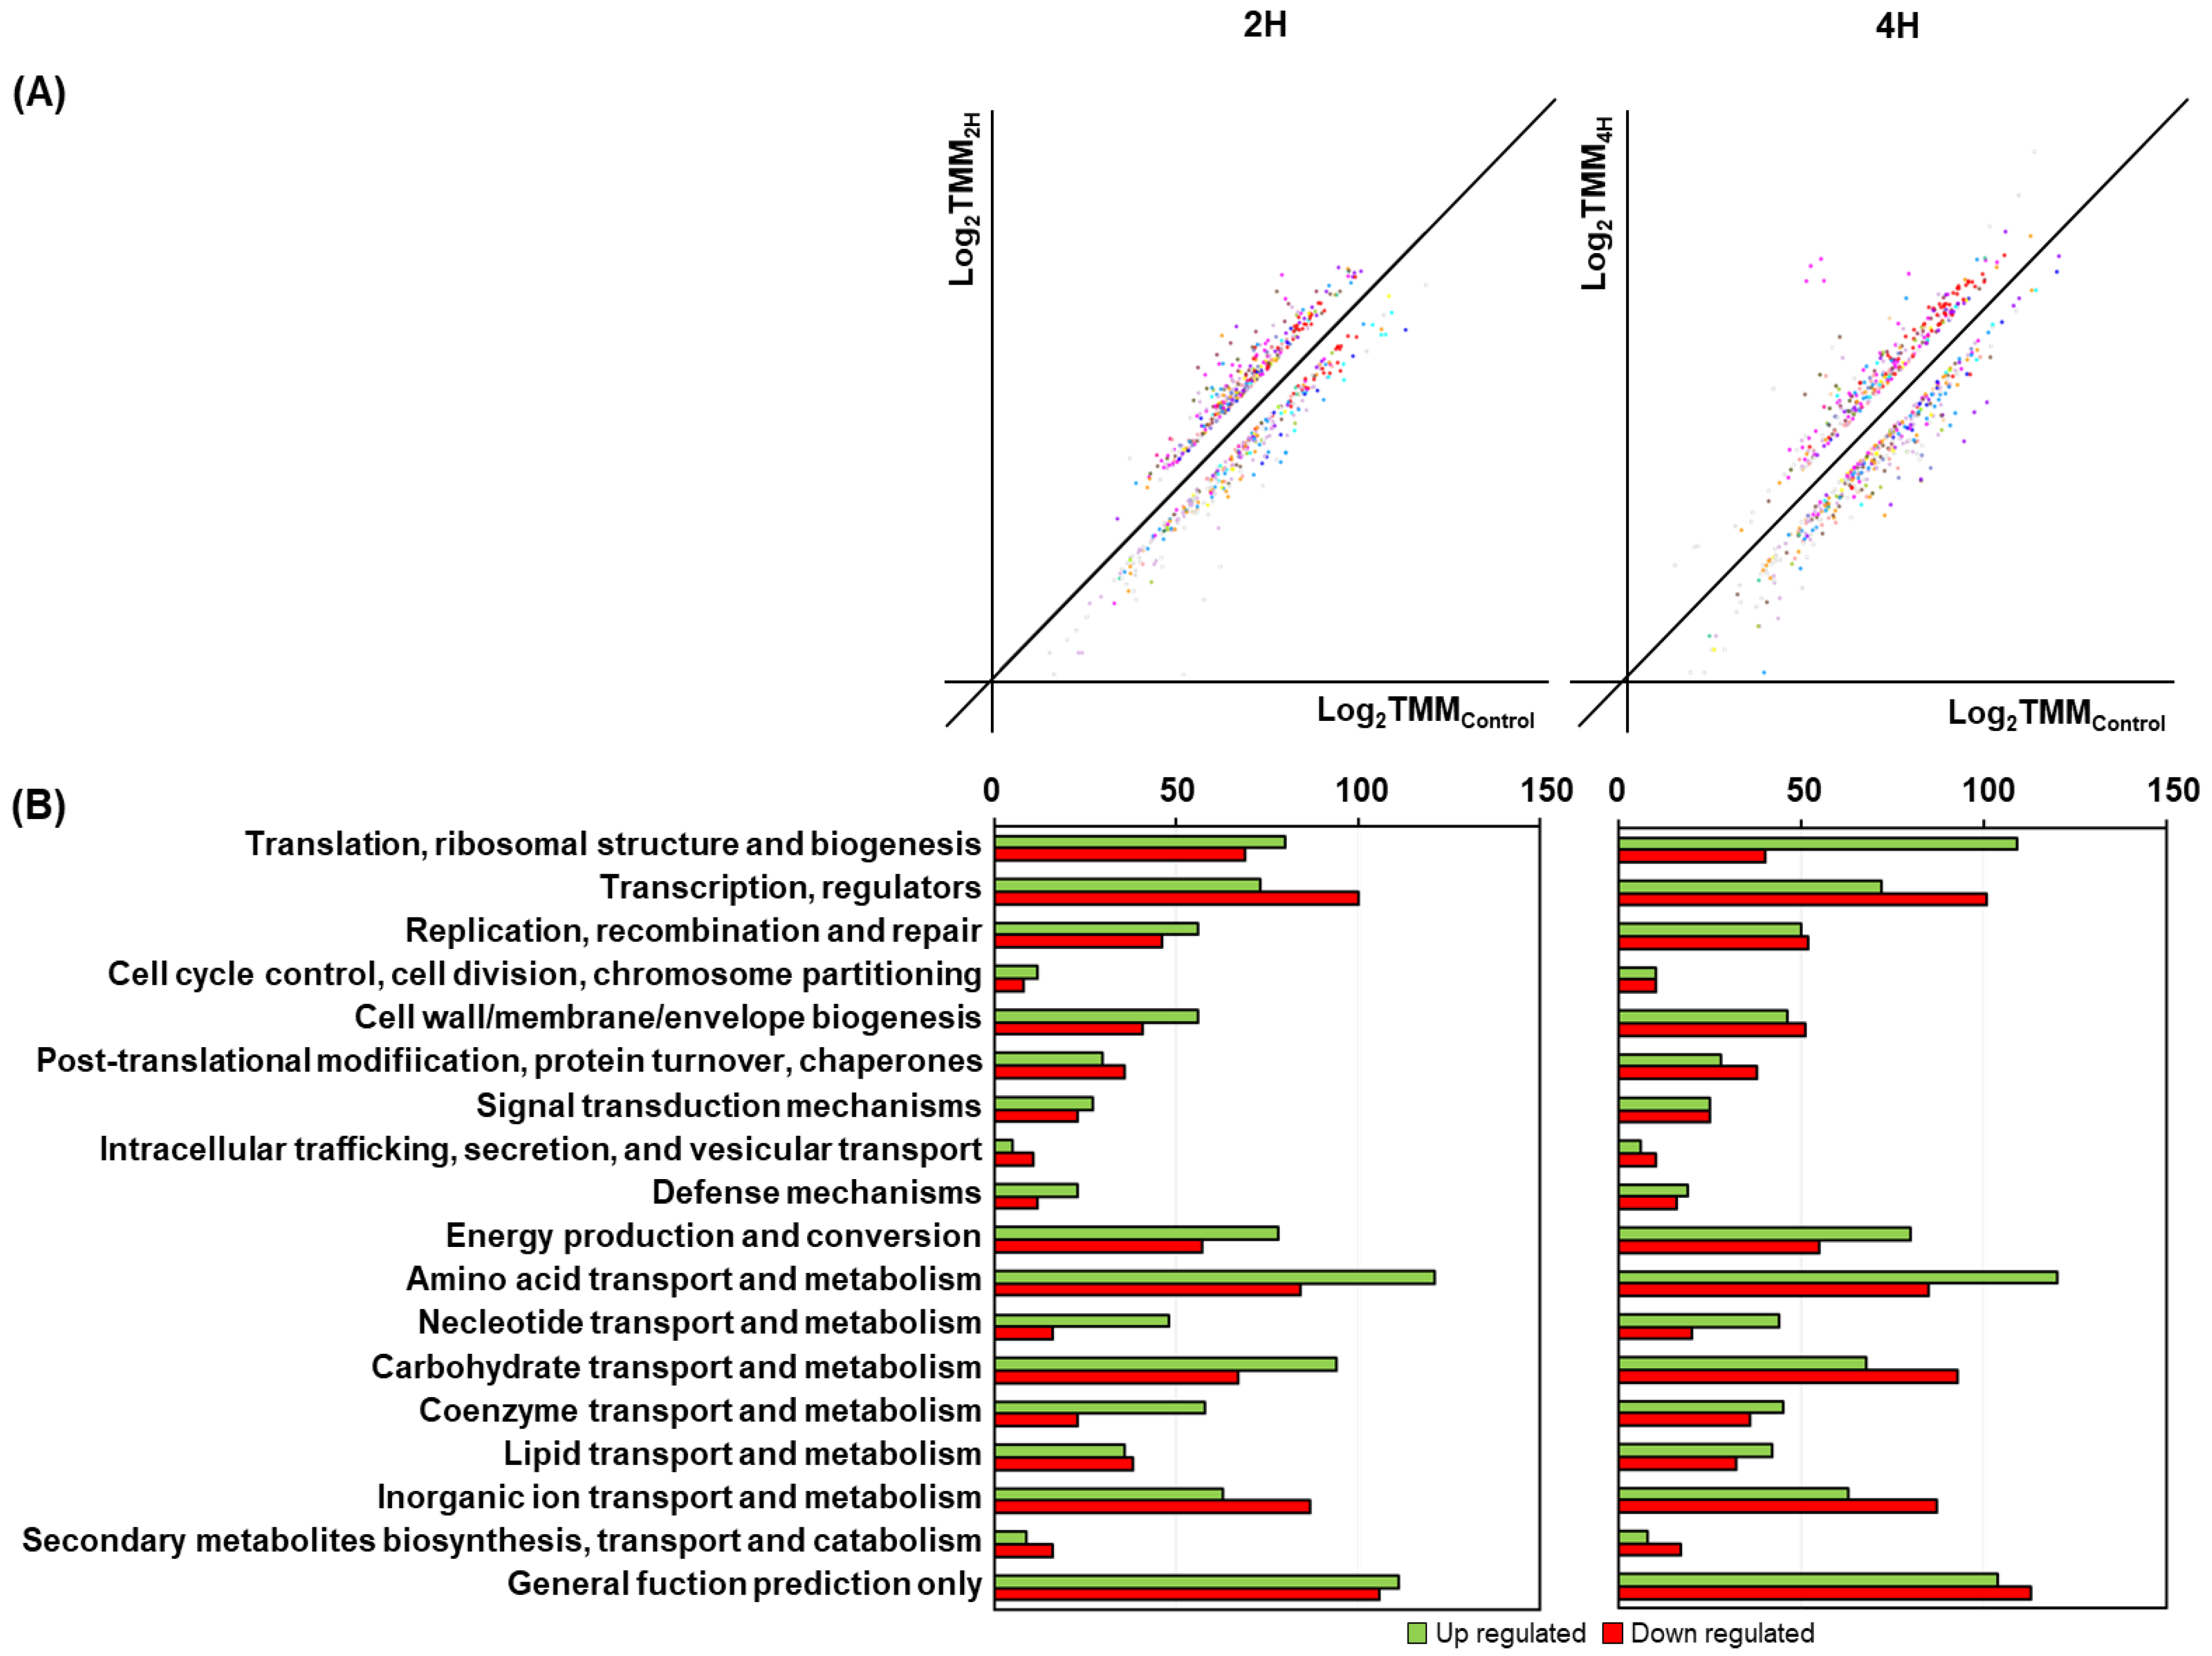
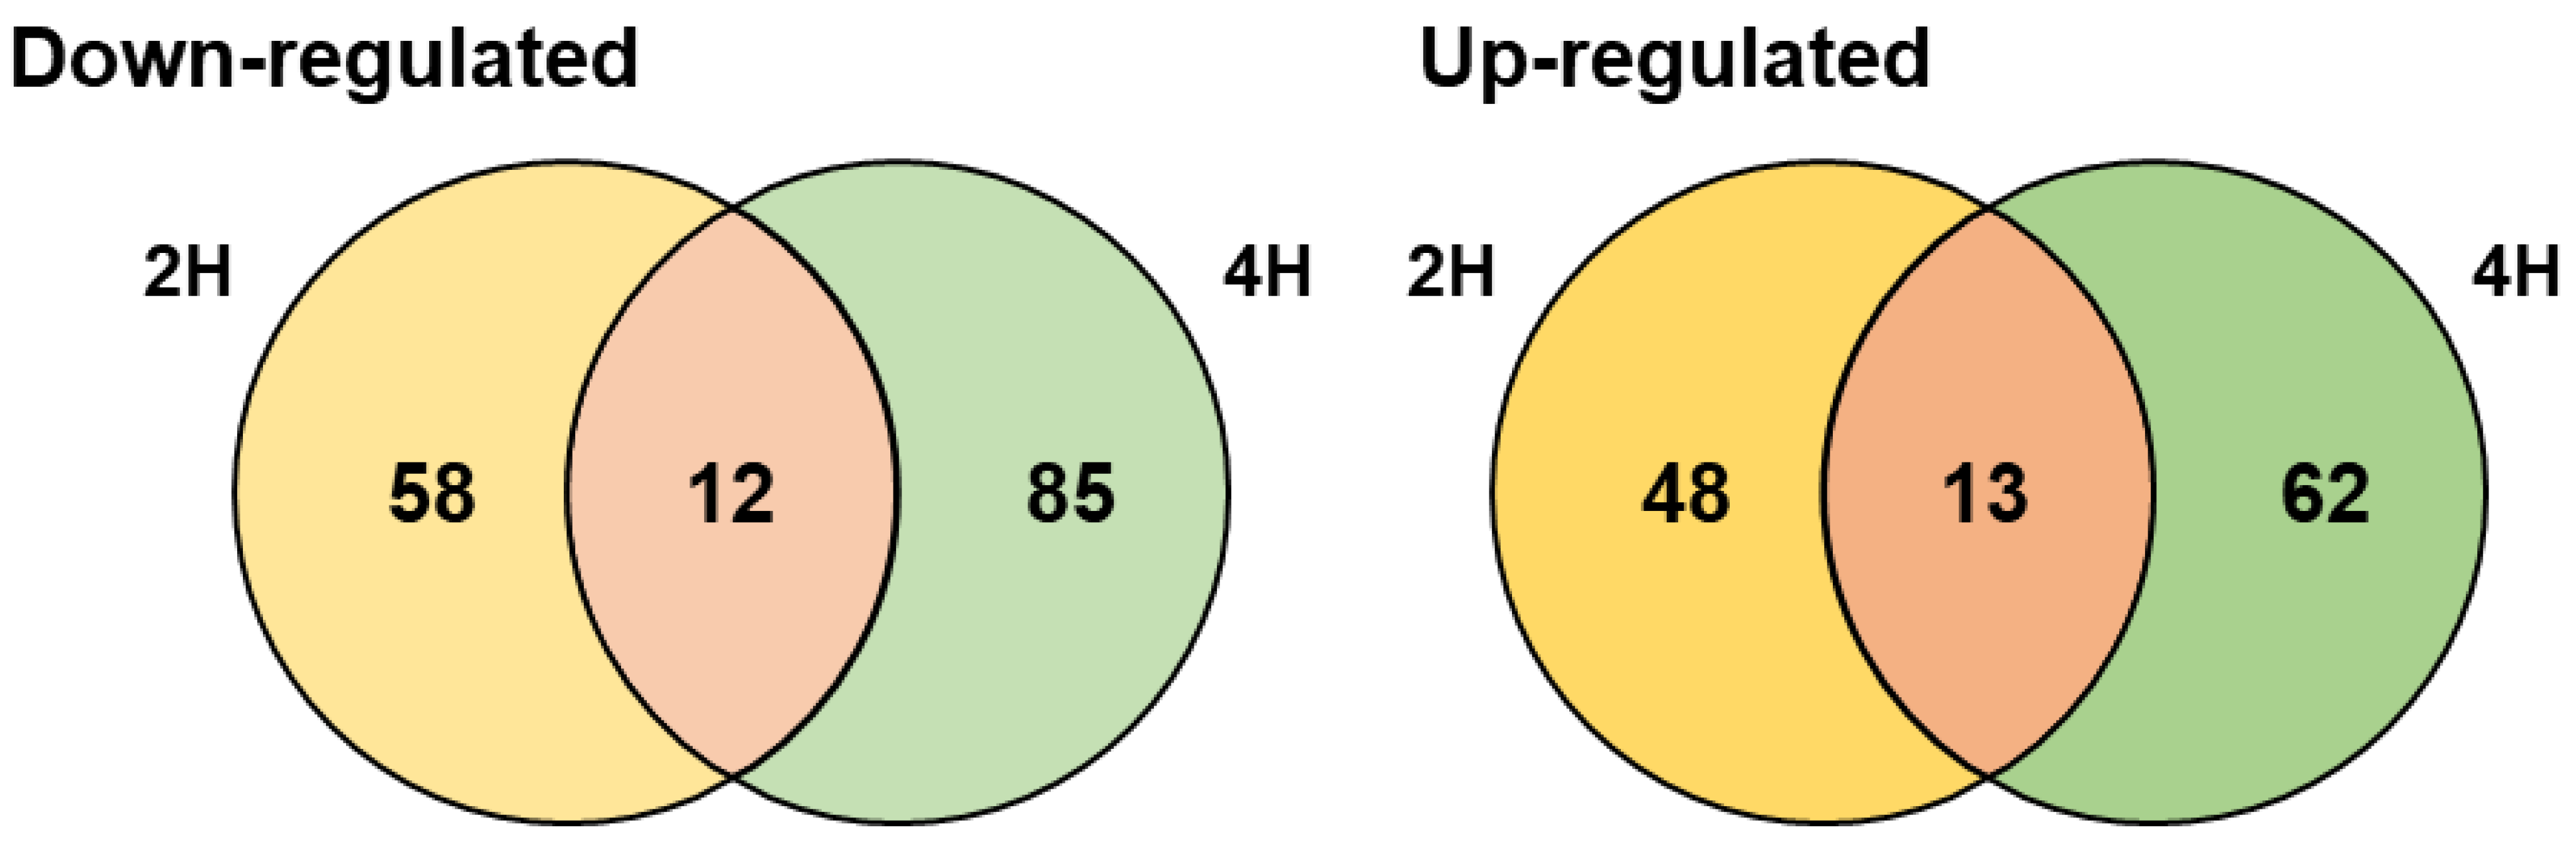
3.2. Comprehensive Transcriptomic Analysis of S. equorum under Salt Stress

To understand the bacterial response and adaptations under salt stress, RNAs of strain KM1031 under 7% NaCl (w/v) stress were isolated for RNA-seq analysis. RNA-seq data were acquired and normalized as described in the Materials and Methods (Tables S1–S3). The presence of salt affected the expression of genes in strain KM1031 (Figure 2A). After mRNA expression levels were compared between controls and samples exposed to salt for 2 or 4 h, genes with a log2 (fold-change) > 2 or <−2 were considered to be DEGs (Table S5 and Figure 2A).
For the 2 and 4 h samples with 7% NaCl, Illumina paired-end sequencing yielded a total of 29,757,759 and 29,666,090 reads, respectively; 96.6% and 97.0% of the reads were annotated in the S. equorum genome KM1031, respectively (Table S1). Salt stress in strain KM1031 upregulated 55 and 60 genes, and downregulated 43 and 69 genes, at 2 and 4 h, respectively, compared with 2 h samples without added salt (Table S5). Significant upregulation was associated with COG categories amino acid transport and metabolism (17/60 at 4 h), and translation, ribosomal structure, and biogenesis (8/60 at 4 h) (Figure 2B). Significant downregulation was associated with “function unknown” (17/69 at 4 h), and carbohydrate transport and metabolism (9/69 at 4 h).
There was a time-dependent difference in DEGs, as shown in Figure 2B. Thus, we used Venn diagram analysis to identify core affected genes: 25 core genes were significantly differentially expressed at both 2 and 4 h on treatment with salt (Figure 3). Twelve of the core genes were significantly upregulated (Table S6); three of them were related to uptake of osmoprotectants (choline/betaine), and three were related to synthesis of glutamate, another osmoprotectant. Thirteen of the core genes were significantly downregulated; they were mainly ABC transporter-related and cell wall synthesis-related genes.

3.3. Genomic Analysis of Response of S. equorum to Salt

To help identify the salt-tolerance mechanisms of S. equorum strain KM1031, we analyzed the effect of salt stress on the expression of genes related to salt tolerance, such as those associated with potassium uptake, Na+/H+ antiport, and osmoprotectant synthesis/transport.

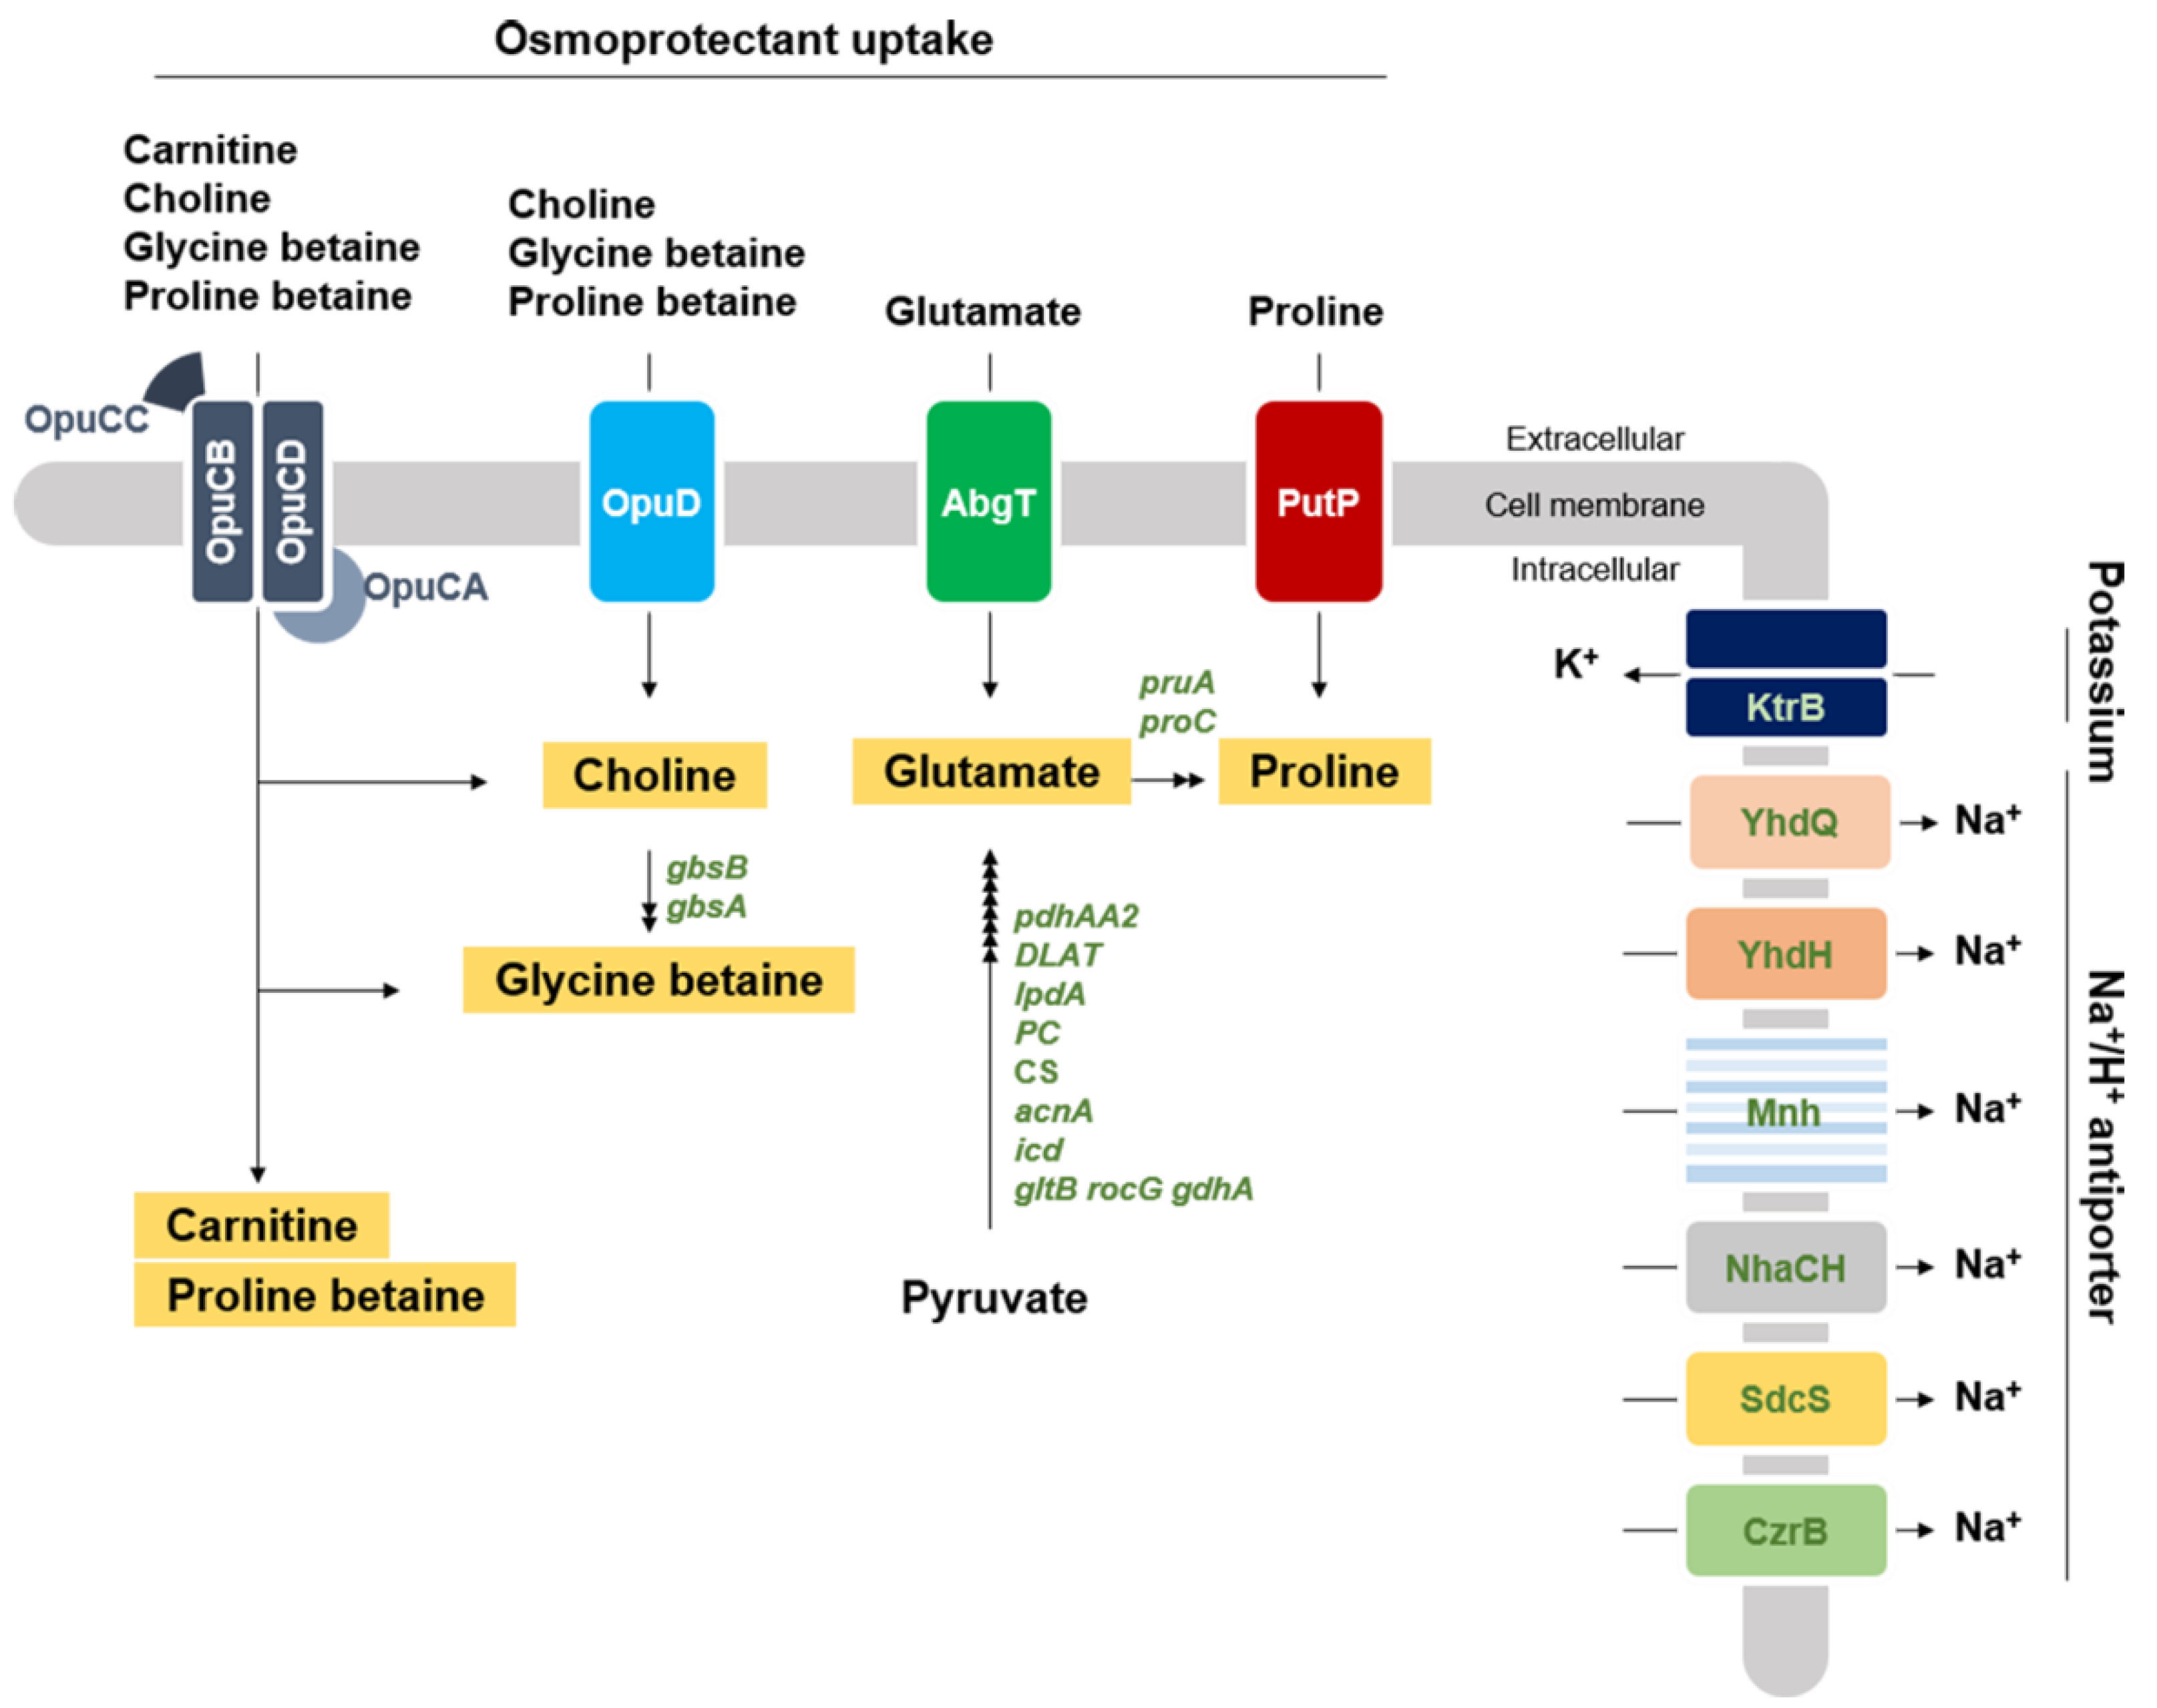
3.3.1. Osmoprotectant Uptake

Generally, bacteria show osmotic resistance by accumulating osmoprotectants. Representative osmoprotectants are glycine betaine, proline betaine, and choline [24]. The genome of strain KM1031 contains two types of osmoprotectant uptake systems, OpuC and OpuD (Figure 4 and Table 1). According to Hoffman and Bremer, OpuC and OpuD can uptake 15 naturally occurring osmoprotectants, including glycine betaine and choline [25]. OpuC belongs to the ABC transporter family, and thus is composed of three subunits: a substrate-binding protein, a substrate transporter, and an ATP-binding protein. The genome of strain KM1031 encodes the three subunits of the OpuC system: substrate-binding protein (OpuCC, AWC34_RS10320), substrate transporters (OpuCB and OpuCD, AWC34_RS10325 and RS10315), and ATP-binding protein (OpuCA, AWC34_RS10330). The OpuD system is a single-component transporter. The S. equorum KM1031 genome contains five opuD genes—AWC34_RS05465, AWC34_RS09135, AWC34_RS10865, AWC34_RS10935, and AWC34_RS11530.
We checked the expression levels of these genes in the transcriptomic analyses (Figure 4 and Table 1). The expression of the genes related to OpuC was approximately doubled by the NaCl stress. Four of the five opuD genes (all except AWC34_RS10935) were upregulated by log2 (fold-change) > 2 in strain KM1031 subject to salt stress. These results suggest that OpuC and OpuD contribute to the salt resistance of strain KM1031, and that the OpuD system makes the greater contribution.
Glutamate and proline are other osmoprotectants and their uptake systems were also upregulated by exposure to salt for 2 and 4 h. In particular, expression of the proline transporter gene putP was significantly upregulated at 4 h.

3.3.2. Membrane Ion Transport

Generally, osmotic upshifts trigger a rapid import of potassium ions, which helps cells defend against water loss and turgor reduction [25]. Furthermore, imported sodium ions must be speedily exported. Therefore, we analyzed the potassium ion uptake and sodium ion exporter systems in strain KM1031. As expected, most of the Na+/H+ antiporter-related genes showed upregulation at 4 h under salt pressure (Table 1). In contrast, potassium uptake genes exhibited downregulation at 2 and 4 h under salt pressure. These results indicate that potassium transporter- and Na+/H+ antiporter-related genes might not contribute significantly to the salt tolerance of strain KM1031, but that Na+/H+ antiporters might contribute more to the salt resistance than potassium transporters.

3.3.3. Osmoprotectant Synthesis

Genes related to osmoprotectant synthesis in strain KM1031 were also considered. Although Hoffman and Bremer suggested 15 naturally occurring osmoprotectants [25], only glutamate, proline, and glycine betaine biosynthesis genes were detected in strain KM1031 (Figure 4). Strain KM1031 contains a dedicated biosynthesis pathway for the production of glutamate from pyruvate (Figure 4). RNA-seq analysis of strain KM1031 under salt stress showed a slight upregulation of genes involved in the synthesis of glutamate from proline. Glycine betaine is one of the most widely used compatible solutes in nature, and strain KM1031 contains genes encoding a glycine betaine aldehyde dehydrogenase (gbsA) and a soluble type III alcohol dehydrogenase (gbsB), both of which are required for the synthesis of glycine betaine from choline [26] (Figure 4). These two genes were significantly upregulated on salt stress for 2 and 4 h (Table 1). Although strain KM1031 does not synthesize choline, it should uptake choline from outside via the Opu system. Summarizing these results, among osmoprotectants, glycine betaine likely has the greatest influence on the salt tolerance of strain KM1031.

3.3.4. Regulation of the Opu System and Glycine Betaine Synthesis

Regulators are essential to control gene expression in bacteria. The glycine betaine synthesis repressor protein GbsR and the osmotic stress response regulator SigB are involved in the expression of osmosis-induced genes in Bacillus subtilis [27]. GbsR, which is a member of the MarR-type family of transcriptional regulators, functions as an intracellular choline sensor and acts as a repressor of expression of the glycine betaine synthesis-related genes gbsAB [27]. The genome of strain KM1031 does not possess choline biosynthesis genes, and thus choline should be imported to produce glycine betaine from choline. We assumed that imported choline could bind to GbsR, and that GbsR bound with choline would not repress the expression of gbsAB. gbsR was upregulated in our experiments at 2 and 4 h, as was gbsAB (Table 1). Unfortunately, the GbsR consensus binding site (5′-TTATTT N7 TTTATT-3′) was not identified upstream of gbsAB or gbsR.
Severe salt stress strongly induces the SigB sigma factor regulon, and expression of the OpuC and OpuD systems is regulated by SigB [25,28]. The sigB gene was upregulated under salt stress in the current study (Table 1), but the SigB consensus binding sequence (5′-GTTTaa N13–15 GGGWAW-3′) was not identified upstream of opuCA, opuCB, opuCC, opuCD, or the five opuD genes.
These results suggest that the regulatory factors, or their biding sites, might be different in S. equorum strain KM1031 from those in B. subtilis; more research is needed on this topic.

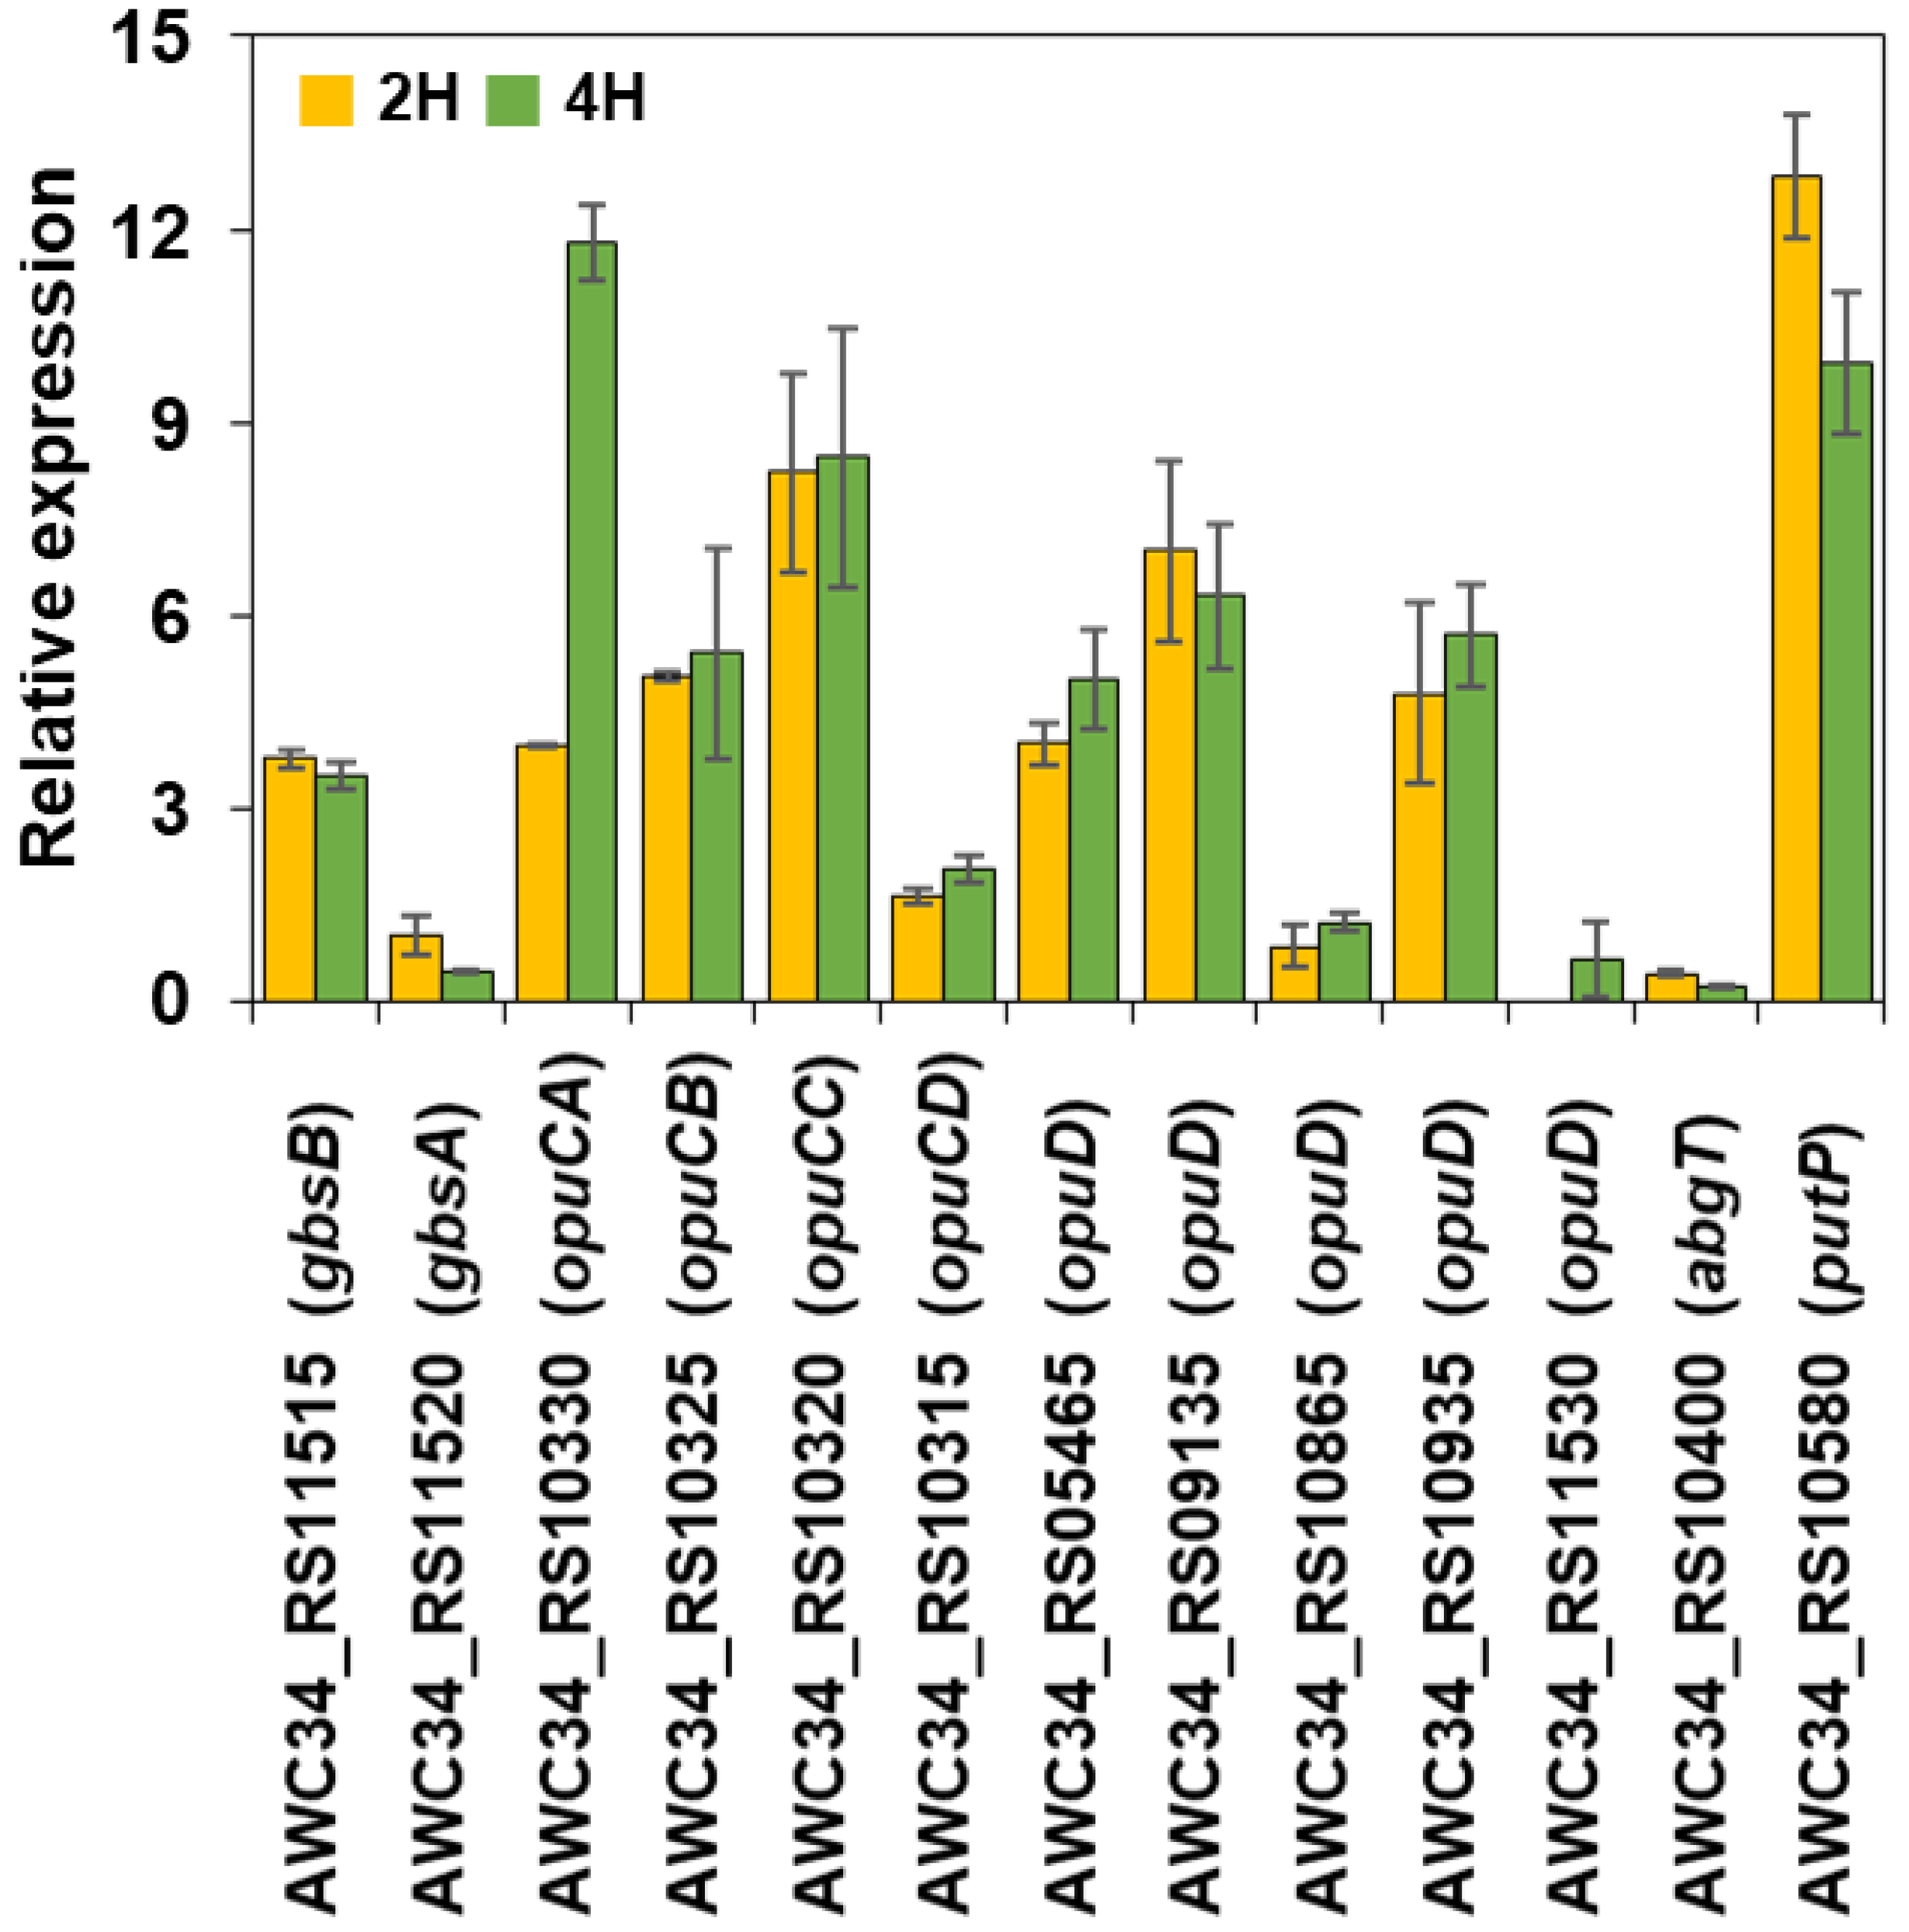
3.4. Validation of RNA-Seq Data by qRT-PCR

qRT-PCR was used to validate the S. equorum strain KM031 transcriptional profiles obtained by RNA-seq analysis. As shown in Figure 5, the expression patterns for genes related to OpuC (opuCA, opuCB, opuCC, and opuCD), the OpuD system, the glutamate transporter (abgT), the proline transporter (putP), and glycine betaine synthesis (gbsA and gbsB) were found to be induced by salt in qRT-PCR analysis. Therefore, these results validate the RNA-seq data and indicate that these genes are involved in the salt resistance of S. equorum strain KM031.

4. Conclusions

We sought to identify the genes that confer resistance to salt stress in S. equorum strain KM031. Using transcriptomic analysis, we confirmed that the OpuC (opuCA, opuCB, opuCC, and opuCD) and OpuD systems for osmoprotectant uptake are associated with resistance to salt. In addition, three osmoprotectants—glutamate, proline, and glycine betaine—can be synthesized in strain KM1031 under salt pressure. However, further studies are required to define the specific mechanisms of resistance.

Supplementary Materials

The following are available online at https://0-www-mdpi-com.brum.beds.ac.uk/article/10.3390/fermentation8080403/s1. Table S1. Number of sequence reads for each sample; Table S2. RNA-seq data for S. equorum strain KM1031 treated with salt; Table S3. Comparison of normalization methods for RNA-seq data; Table S4. Primers for quantitative real-time PCR; Table S5. Differential gene expression related to salt stress; Table S6. DEGs on exposure to 7% NaCl for both 2 and 4 h.

Author Contributions

Conceptualization, S.H., J.-H.L. and D.-W.J.; methodology, S.H.; validation, S.H., J.P. and E.L.; formal analysis, S.H.; investigation, S.H., J.P. and E.L.; writing—original draft preparation, S.H., J.-H.L. and D.-W.J.; writing—review and editing, S.H., J.-H.L. and D.-W.J.; project administration, D.-W.J.; funding acquisition, D.-W.J. All authors have read and agreed to the published version of the manuscript.

Funding

This work was supported by the National Research Foundation of Korea (NRF) [NRF-2019R1A2C1003639].

Institutional Review Board Statement

Not applicable.

Informed Consent Statement

Not applicable.

Data Availability Statement

The data presented in this study are available in the article.

Acknowledgments

We thank Jochen Blom at Justus-Liebig University for the EDGAR analysis, which was financially supported by BMBF grant number FKZ031A533.

Conflicts of Interest

The authors declare no conflict of interest.

References

  1. Marty, E.; Buchs, J.; Eugster-Meier, E.; Lacroix, C.; Meile, L. Identification of staphylococci and dominant lactic acid bacteria in spontaneously fermented Swiss meat products using PCR-RFLP. Food Microbiol. 2012, 29, 157–166. [Google Scholar] [CrossRef]
  2. Bockelmann, W.; Willems, K.P.; Neve, H.; Heller, K.H. Cultures for the ripening of smear cheeses. Int. Dairy J. 2005, 15, 719–732. [Google Scholar] [CrossRef]
  3. Corbiere Morot-Bizot, S.; Leroy, S.; Talon, R. Staphylococcal community of a small unit manufacturing traditional dry fermented sausages. Int. J. Food Microbiol. 2006, 108, 210–217. [Google Scholar] [CrossRef]
  4. Blaiotta, G.; Pennacchia, C.; Villani, F.; Ricciardi, A.; Tofalo, R.; Parente, E. Diversity and dynamics of communities of coagulase-negative staphylococci in traditional fermented sausages. J. Appl. Microbiol. 2004, 97, 271–284. [Google Scholar] [CrossRef]
  5. Mauriello, G.; Casaburi, A.; Blaiotta, G.; Villani, F. Isolation and technological properties of coagulase negative staphylococci from fermented sausages of Southern Italy. Meat Sci. 2004, 67, 149–158. [Google Scholar] [CrossRef]
  6. Guan, L.; Cho, K.-H.; Lee, J.-H. Analysis of the cultivable bacterial community in jeotgal, a Korean salted and fermented seafood, and identification of its dominant bacteria. Food Microbiol. 2011, 28, 101–113. [Google Scholar] [CrossRef]
  7. An, D.; Kim, H.-R.; Jeong, D.-W.; Caldwell, J.M.; Lee, J.-H. Bacterial community monitoring of commercial kimchi produced in Korea and China with evidence of Bacilli spore formation during fermentation. Kor. J. Microbiol. Biotechnol. 2014, 42, 121–130. [Google Scholar] [CrossRef]
  8. Heo, S.; Lee, J.-H.; Jeong, D.-W. Food-derived coagulase-negative Staphylococcus as starter cultures for fermented foods. Food Sci. Biotechnol. 2020, 29, 1023–1035. [Google Scholar] [CrossRef]
  9. Sondergaard, A.K.; Stahnke, L.H. Growth and aroma production by Staphylococcus xylosus, S. carnosus and S. equorum—A comparative study in model systems. Int. J. Food Microbiol. 2002, 75, 99–109. [Google Scholar] [CrossRef]
  10. Stahnke, L.H. Aroma components from dried sausages fermented with Staphylococcus xylosus. Meat Sci. 1994, 38, 39–53. [Google Scholar] [CrossRef]
  11. Deetae, P.; Bonnarme, P.; Spinnler, H.E.; Helinck, S. Production of volatile aroma compounds by bacterial strains isolated from different surface-ripened French cheeses. Appl. Microbiol. Biotechnol. 2007, 76, 1161–1171. [Google Scholar] [CrossRef]
  12. Fulladosa, E.; Garriga, M.; Martin, B.; Guardia, M.D.; Garcia-Regueiro, J.A.; Arnau, J. Volatile profile and microbiological characterization of hollow defect in dry-cured ham. Meat Sci. 2010, 86, 801–807. [Google Scholar] [CrossRef]
  13. Place, R.B.; Hiestand, D.; Gallmann, H.R.; Teuber, M. Staphylococcus equorum subsp. linens, subsp. nov., a starter culture component for surface ripened semi-hard cheeses. Syst. Appl. Microbiol. 2003, 26, 30–37. [Google Scholar] [CrossRef]
  14. Jeong, D.-W.; Jung, G.; Lee, J.-H. Cultivable bacterial community analysis of saeu-jeotgal, a Korean high-salt-fermented seafood, during ripening. Microbiol. Biotechnol. Lett. 2016, 44, 293–302. [Google Scholar] [CrossRef]
  15. Jung, J.; Choi, S.; Jeon, C.-O.; Park, W. Pyrosequencing-based analysis of the bacterial community in Korean traditional seafood, ojingeo jeotgal. J. Microbiol. Biotechnol. 2013, 23, 1428–1433. [Google Scholar] [CrossRef]
  16. Jeong, D.-W.; Heo, S.; Ryu, S.; Blom, J.; Lee, J.-H. Genomic insights into the virulence and salt tolerance of Staphylococcus equorum. Sci. Rep. 2017, 7, 5383. [Google Scholar] [CrossRef]
  17. Jeong, D.-W.; Han, S.; Lee, J.-H. Safety and technological characterization of Staphylococcus equorum isolates from jeotgal, a Korean high-salt-fermented seafood, for starter development. Int. J. Food Microbiol. 2014, 188, 108–115. [Google Scholar] [CrossRef]
  18. Lee, J.-H.; Heo, S.; Jeong, D.-W. Genomic insights into Staphylococcus equorum KS1039 as a potential starter culture for the fermentation of high-salt foods. BMC Genom. 2018, 19, 136. [Google Scholar] [CrossRef]
  19. Robinson, M.D.; Oshlack, A. A scaling normalization method for differential expression analysis of RNA-seq data. Genome Biol. 2010, 11, R25. [Google Scholar] [CrossRef]
  20. Tatusov, R.L.; Koonin, E.V.; Lipman, D.J. A genomic perspective on protein families. Science 1997, 278, 631–637. [Google Scholar] [CrossRef]
  21. Jeong, D.-W.; Na, H.; Ryu, S.; Lee, J.-H. Complete genome sequence of Staphylococcus equorum KS1039 isolated from saeu-jeotgal, Korean high-salt-fermented seafood. J. Biotechnol. 2016, 219, 88–89. [Google Scholar] [CrossRef]
  22. Aziz, R.K.; Bartels, D.; Best, A.A.; DeJongh, M.; Disz, T.; Edwards, R.A.; Kevin, F.; Gerdes, S.; Glass, E.M.; Kubal, M.; et al. The RAST server: Rapid annotations using subsystems technology. BMC Genom. 2008, 9, 75. [Google Scholar] [CrossRef]
  23. Pfaffl, M.W. A new mathematical model for relative quantification in real-time RT-PCR. Nucleic Acids Res. 2001, 29, e45. [Google Scholar] [CrossRef]
  24. Wood, J.M.; Bremer, E.; Csonka, L.N.; Kraemer, R.; Poolman, B.; van der Heide, T.; Smith, L.T. Osmosensing and osmoregulatory compatible solute accumulation by bacteria. Comp. Biochem. Physiol. Part A Mol. Integr. Physiol. 2001, 130, 437–460. [Google Scholar] [CrossRef]
  25. Hoffmann, T.; Bremer, E. Guardians in a stressful world: The Opu family of compatible solute transporters from Bacillus subtilis. Biol. Chem. 2017, 398, 193–214. [Google Scholar] [CrossRef]
  26. Boch, J.; Kempf, B.; Schmid, R.; Bremer, E. Synthesis of the osmoprotectant glycine betaine in Bacillus subtilis: Characterization of the gbsAB genes. J. Bacteriol. 1996, 178, 5121–5129. [Google Scholar] [CrossRef]
  27. Nau-Wagner, G.; Opper, D.; Rolbetzki, A.; Boch, J.; Kempf, B.; Hoffmann, T.; Bremer, E. Genetic control of osmoadaptive glycine betaine synthesis in Bacillus subtilis through the choline-sensing and glycine betaine-responsive GbsR repressor. J. Bacteriol. 2012, 194, 2703–2714. [Google Scholar] [CrossRef]
  28. Young, J.W.; Locke, J.C.; Elowitz, M.B. Rate of environmental change determines stress response specificity. Proc. Natl. Acad. Sci. USA 2013, 110, 4140–4145. [Google Scholar] [CrossRef]
Figure 1. Growth of Staphylococcus equorum strain KM1031 at different NaCl concentrations. Three independent replicates were performed, the average values and standard error means were used to draw the curves.
Fermentation 08 00403 g001
Figure 2. Classification of differentially expressed genes (DEGs) in S. equorum strain KM1031 based on predicted functions. (A) DEG analysis from RNA-seq data after salt stress for 2 and 4 h. The x-axis shows log-scaled trimmed mean of M-value (TMM) values for strain KM1031, and the y-axis shows log-scaled TMM values on treatment with 7% NaCl for 2 h (2H) or 4 h (4H). Total gene expressions were filtered to sort significantly down- or upregulated genes with criteria p-value ≤ 0.05 and fold-change ≥ 2. (B) Genes up or downregulated by ≥2-fold in the presence of salt grouped into functional categories; genes are annotated based on the Clusters of Orthologous Groups database.
Fermentation 08 00403 g002
Figure 3. Venn diagram of DEGs in strain KM1031 under 7% NaCl stress for 2 and 4 h. Overlapping regions represent shared genes between different salt-exposure times [2 h (2H) and 4 h (4H)]. The numbers outside the overlapping regions indicate the numbers of significantly differentially expressed genes that were not common to the two conditions.
Fermentation 08 00403 g003
Figure 4. Predicted osmoprotectant transport and synthesis pathways in strain KM1031. Gene and osmoprotectant names are depicted in green italics and orange boxes, respectively. Transporter proteins are indicated in the cell membrane and their names are marked. The black arrows correspond to the potential enzymatic reactions catalyzed by gene products encoded in the genome of strain KM1031.
Fermentation 08 00403 g004
Figure 5. Validation of RNA sequencing data by quantitative real-time PCR. Genes expected to be related to resistance to salt were selected for validation. Data are expressed as log2 (fold-change) in gene expression between control and salt-treated samples. In qRT-PCR, 16S rRNA gene expression was used for normalization of target gene expression.
Fermentation 08 00403 g005
Table 1. Expression of genes predicted to contribute to salt resistance in Staphylococcus equorum KM1031 following treatment with 7% NaCl.
DescriptionGene LocusGeneE.C. No.Log2 (Fold-Change) *COGProduct
2 h/con4 h/con
Transporter
Osmoprotectant uptake
AWC34_RS10320opuCC 0.041.08EOsmoprotectant ABC transporter substrate-binding protein
AWC34_RS10325opuCB −0.311.32 ABC transporter permease
AWC34_RS10315opuCD −0.471.03EABC transporter permease
AWC34_RS10330opuCA7.6.2.90.191.15EPBetaine/proline/choline family ABC transporter ATP-binding protein
AWC34_RS05465opuD 1.882.31PBCCT family transporter
AWC34_RS09135opuD 2.212.02PBCCT family transporter
AWC34_RS10865opuD 0.853.72PBCCT family transporter
AWC34_RS10935opuD 0.950.95PBCCT family transporter
AWC34_RS11530opuD 3.222.6PBCCT family transporter
AWC34_RS10400abgT 1.090.55Hp-aminobenzoyl-glutamate transporter family transporter
AWC34_RS10580putP 1.484.61ESodium/proline symporter PutP
AWC34_RS04230ktrA −0.36−1.68PTrkA family potassium uptake protein
AWC34_RS03930ktrB −1.46−0.58PKtr system potassium uptake protein D
Na+/H+ antiporter
AWC34_RS03865yibQ −0.130.15 Putative Na+/H+ antiporter YjbQ
AWC34_RS00935yhdH −1.73−1.66PSodium-dependent transporter
AWC34_RS03605mnhA1 0.570.69 Na+/H+ antiporter subunit A
AWC34_RS03600mnhB1 0.350.99PNa+/H+ antiporter subunit B
AWC34_RS03595mnhC1 0.010.93PNa+/H+ antiporter subunit C
AWC34_RS03590mnhD11.6.5.30.460.69CPNa+/H+ antiporter subunit D
AWC34_RS03585mnhE1 0.240.63PNa+/H+ antiporter subunit E
AWC34_RS03580mnhF1 −0.350.66PNa+/H+ antiporter subunit F1
AWC34_RS03575mnhG1 −0.180.47PNa+/H+ antiporter subunit G1
AWC34_RS02340mnhA2 −0.150.38 Putative antiporter subunit mnhA2
AWC34_RS02345mnhB2 −0.150.78 Na+/H+ antiporter subunit B
AWC34_RS02350mnhC2 0.020.46PNa+/H+ antiporter Mnh2 subunit C
AWC34_RS02355mnhD2 −0.30.55CPNa+/H+ antiporter subunit D
AWC34_RS02360mnhE2 −0.70.45PNa+/H+ antiporter subunit E
AWC34_RS02365mnhF2 −0.710.53PNa+/H+ antiporter Mnh2 subunit F
AWC34_RS02370mnhG2 −0.580.17PNa+/H+ antiporter subunit G
AWC34_RS09570nhaC 0.57−0.7CNa+/H+ antiporter NhaC
AWC34_RS09730nhaC −1.130.74CNa+/H+ antiporter NhaC
AWC34_RS10840nhaC −0.121.01CNa+/H+ antiporter NhaC
AWC34_RS02375nhaH 0.17−0.25PNa+/H+ antiporter NhaH
AWC34_RS08235sdcS 0.29−0.39PSodium-dependent dicarboxylate transporter
AWC34_RS08920czrB −0.26−0.68PCDF family zinc efflux transporter CzrB
AWC34_RS03560 −2.47−0.53RNa+/H+ antiporter family protein
AWC34_RS09820 −1.321CSodium:proton antiporter
AWC34_RS10590 0.380.32PSodium:proton antiporter
Synthesis
Glutamate
AWC34_RS04260pdhA1.2.4.11.21−0.14CPyruvate dehydrogenase (acetyl-transferring) E1 component subunit alpha
AWC34_RS04265pdhA21.2.4.10.89−0.07CAlpha-ketoacid dehydrogenase subunit beta
AWC34_RS04270DLAT2.3.1.120.610.37C2-oxo acid dehydrogenase subunit E2
AWC34_RS04275lpdA1.8.1.4−0.490.23CDihydrolipoyl dehydrogenase
AWC34_RS06290lpdA1.8.1.40.49−0.22CDihydrolipoyl dehydrogenase
AWC34_RS04350PC6.4.1.1−0.570.34CPyruvate carboxylase
AWC34_RS07130CS2.3.3.10.332.18CCitrate synthase
AWC34_RS05470acnA4.2.1.30.592.26CAconitate hydratase AcnA
AWC34_RS07125icd1.1.1.42−0.321.92ENADP-dependent isocitrate dehydrogenase
AWC34_RS00985gltB1.4.1.140.921.45 Glutamate synthase large subunit
AWC34_RS00990 1.4.1.14−0.111.83EGlutamate synthase subunit beta
AWC34_RS01735rocG1.4.1.20.961.1EGlu/Leu/Phe/Val dehydrogenase
AWC34_RS03635gdhA1.4.1.31.441.36EGlu/Leu/Phe/Val dehydrogenase
Proline
AWC34_RS10920pruA1.2.1.88−0.140.27CL-glutamate gamma-semialdehyde dehydrogenase
AWC34_RS13165pruA1.2.1.88−2.4−2.92 Betaine-aldehyde dehydrogenase
AWC34_RS06225proC1.5.1.20.432.24EPyrroline-5-carboxylate reductase
AWC34_RS11515gbsB1.1.99.11.930.93PSoluble type III alcohol dehydrogenase
AWC34_RS11520gbsA1.2.1.34.212.34CGlycine betaine aldehyde dehydrogenase
Regulator
AWC34_RS06515rpoD-0.730.77KRNA polymerase sigma factor RpoD
AWC34_RS08530sigB-0.710.73KRNA polymerase sigma factor SigB
AWC34_RS11525gbsR-1.461.31KGbsR/MarR family transcriptional regulator
* Gene expression is represented using the log2 fold change values having adjusted p-value of less than 0.05. Red and blue colors correspond to upregulated or downregulated gene expression level, respectively.
Publisher’s Note: MDPI stays neutral with regard to jurisdictional claims in published maps and institutional affiliations.

