Article

Graphene-Coated Iron Nitride Streptavidin Magnetic Beads: Preparation and Application in SARS-CoV-2 Enrichment

1
Faculty of Environmental and Life, Beijing University of Technology, Beijing 100124, China
2
Beijing International Science and Technology Cooperation Base for Antiviral Drugs, Beijing 100124, China
3
Faculty of Material and Manufacturing, Beijing University of Technology, Beijing 100124, China
4
Respiratory Department, Emergency General Hospital, Beijing 100028, China
*
Authors to whom correspondence should be addressed.
These authors contributed equally to this work.
Submission received: 14 February 2022 / Revised: 1 April 2022 / Accepted: 2 April 2022 / Published: 7 April 2022
(This article belongs to the Special Issue Biofunctionization and  Applications of Magnetic Particles)

Abstract

:
In this study, we prepared a streptavidin magnetic bead based on graphene-coated iron nitride magnetic beads (G@FeN-MB) and tried to use it for the enrichment of severe acute respiratory syndrome coronavirus-2 (SARS-CoV-2). The outer shell of our magnetic bead was wrapped with multiple graphene sheets, and there is no report on the application of graphene to the magnetic-bead-coating material. First, the graphene shell of G@FeN-MB was oxidized by a modified Hummer method so as to generate the carboxyl groups required for the coupling of streptavidin (SA) on the surface of the magnetic beads. X-ray photoelectron spectroscopy (XPS), Raman spectroscopy, Fourier transform infrared spectroscopy (FTIR), and transmission electron microscopy (TEM) were used to characterize the oxidized G@FeN-MB (GO@FeN-MB). Streptavidin was then linked to the surface of the GO@FeN-MB by coupling the amino of the streptavidin with the carboxyl on the magnetic beads by carbodiimide method; thus, the streptavidin magnetic beads (SAMBs) were successfully prepared. To prove the practicality of the SAMBs, biotinylated SARS-CoV-2 S1 antibody was linked with it to respectively capture SARS-CoV-2 Spike-protein-coupled polystyrene beads (S-PS) and pseudovirus with S-protein expressed. Microplate reader and fluorescence microscope results show that the SAMBs can effectively enrich viruses. In conclusion, the preparation of SAMBs with G@FeN-MB is feasible and has potential for application in the field of virus enrichment.

1. Introduction

The coronavirus disease 2019 (COVID-19) caused by severe acute respiratory syndrome coronavirus-2 (SARS-CoV-2) is an acute respiratory infectious disease that seriously endangers human health and social stability [1,2]. At present, the most economical and effective way to control the epidemic is to take quarantine measures [3,4]. However, the effectiveness of these measures is limited by the difficulty of distinguishing between those who are asymptomatically infected and the healthy. In particular, early detection of COVID-19 is essential for epidemic prevention and control [5]. However, not all infected people can be detected. Even for confirmed patients, the highest positivity rate is only 30% to 60%, and a large number of patients have always been “false negatives” [6]. One of the important reasons for the “false negative” in nucleic acid diagnosis is the low sensitivity of the virus separation and enrichment step in the processing of patients’ samples. The number of viruses in the sample to be tested does not reach the RT-PCR detection threshold, and “false negatives” appear [7]. Therefore, a fast and feasible virus isolation and enrichment method to assist in rapid virus detection would be helpful for identifying SARS-CoV-2 infected persons, preventing the spread of the virus, and ensuring the timely treatment of patients [8,9].
Immunomagnetic-bead-enrichment technology is a rapid and specific enrichment method established by using a magnetic microsphere as the solid surface to combine with a specific probe, such as an antibody [10,11]. The antibody-linked, magnetic beads can specifically bind to the corresponding antigen in the solution and then rely on the force of the magnetic field to rapidly concentrate the target sample from a large volume [12,13,14]. Immunomagnetic-bead-enrichment technology can greatly increase the concentration of the target detection substance in the sample pretreatment step, while removing interfering substances in the sample, thereby improving detection accuracy. A series of highly sensitive detection methods that rely on immunomagnetic beads to enrich samples have emerged [15,16]. They effectively reduce the detection limit by 100 times or more [17,18], and they improve the sensitivity of subsequent detection methods. Immunomagnetic-bead-enrichment technology has been widely used in sample pretreatment for various detection methods, including enzyme-linked immunosorbent assays and immunochromatography [19,20,21], but so far there has been no report on the application of magnetic beads for SARS-CoV-2 separation.
Previously, a brand-new magnetic bead, that being a graphene-coated iron nitride magnetic bead (G@FeN-MB) which has an obvious core-shell structure was reported upon [22]. Compared with the common Fe3O4 (92–100 emu/g)-core magnetic beads, the iron nitride bead has a better magnetic responsivity and saturation magnetization (196 emu/g) [22]. The saturation magnetization of this material has been fully discussed in a previously published study by Wang’s team [22]. Graphene, as the shell of the G@FeN-MB that we used in this study, has recently attracted significant attention in the biological field due to its properties, such as its thermal conductivity, mechanical strength, large surface area, and high electron-transport capability [23,24,25]. There have been many studies on the application of graphene in biology, such as in drug delivery [26], blood glucose sensors [27], and gene therapy [28]. However, the separation of GO from solution is a complicated and time-consuming process which brings certain difficulties to the study of it applications [29]. Therefore, this magnetic graphene material can also be used as a new material for studying the interaction of graphene with biomolecules due to its rapid separation by magnets. It appears promising that this new magnetic material will have a wide range of application prospects in the field of biological.
Previously, we have discussed the method of G@FeN-MB modification and used it for T cell sorting [30]. Based on our previous research, we improved the way by which the antibody is attached to the surface of the magnetic beads. The original method of coupling the antibody directly to the surface of the magnetic bead was changed to first coupling streptavidin to the surface of the magnetic bead, and then adding a biotinylated antibody to bind the antibody to the magnetic bead. This method expands the number of antibodies conjugated to the surface of the magnetic beads because one unit of streptavidin can tightly bind to four units of biotin, which has an amplifying effect [31]. Furthermore, streptavidin magnetic beads can quickly realize the multifunctionalization of magnetic beads by replacing the biotinylated molecules.
A modified Hummer method was used to modify the surface of the G@FeN-MB to generate the carboxyl groups required for the subsequent coupling of the streptavidin and to enhance the water solubility of the magnetic beads. Then, it was characterized by TEM, XPS, FTIR, and Raman spectroscopy. The streptavidin was coupled to the surface of the magnetic beads by the carbodiimide method, and the streptavidin magnetic beads (SAMBs) were successfully attached. The maximum coupling amount and coupling effect of the magnetic beads were determined. Anti-S1 protein immunomagnetic beads (IMB) were prepared by mixing the SAMBs with biotinylated S1 protein antibodies (Scheme 1). Finally, the IMB were used to capture the SARS-CoV-2-Spike-protein-coupled polystyrene beads (S-PS) and pseudovirus. The S-PS were polystyrene beads, each coated with about 30 molecules of spike protein, which is exactly like a wild SARS-CoV-2 particle. They contain red, fluorescent dye and have an average particle size of 100 nm, which is also close to the size of the SARS-CoV-2 particle. After the liquid containing the S-PS was mixed with the IMB, the capture effect was determined by the microplate reader and fluorescence microscope. The SARS-CoV-2 pseudovirus expressed the complete spike protein on the surface, consisting of two parts, the S1 subunit and the S2 subunit. The antibody on the surface of IMB was an anti-S1 protein antibody. After the IMB successfully captured the SARS-CoV-2 pseudovirus, the pseudovirus was fluorescently labeled by adding the anti-S2 antibody and anti-S2 antibody fluorescent secondary antibody, so that the capture effect could be determined by the microplate reader and the fluorescence microscope. Our research results show that the IMB can specifically capture SARS-CoV-2 S-PS and pseudoviruses (Scheme 2).

2. Materials and Methods

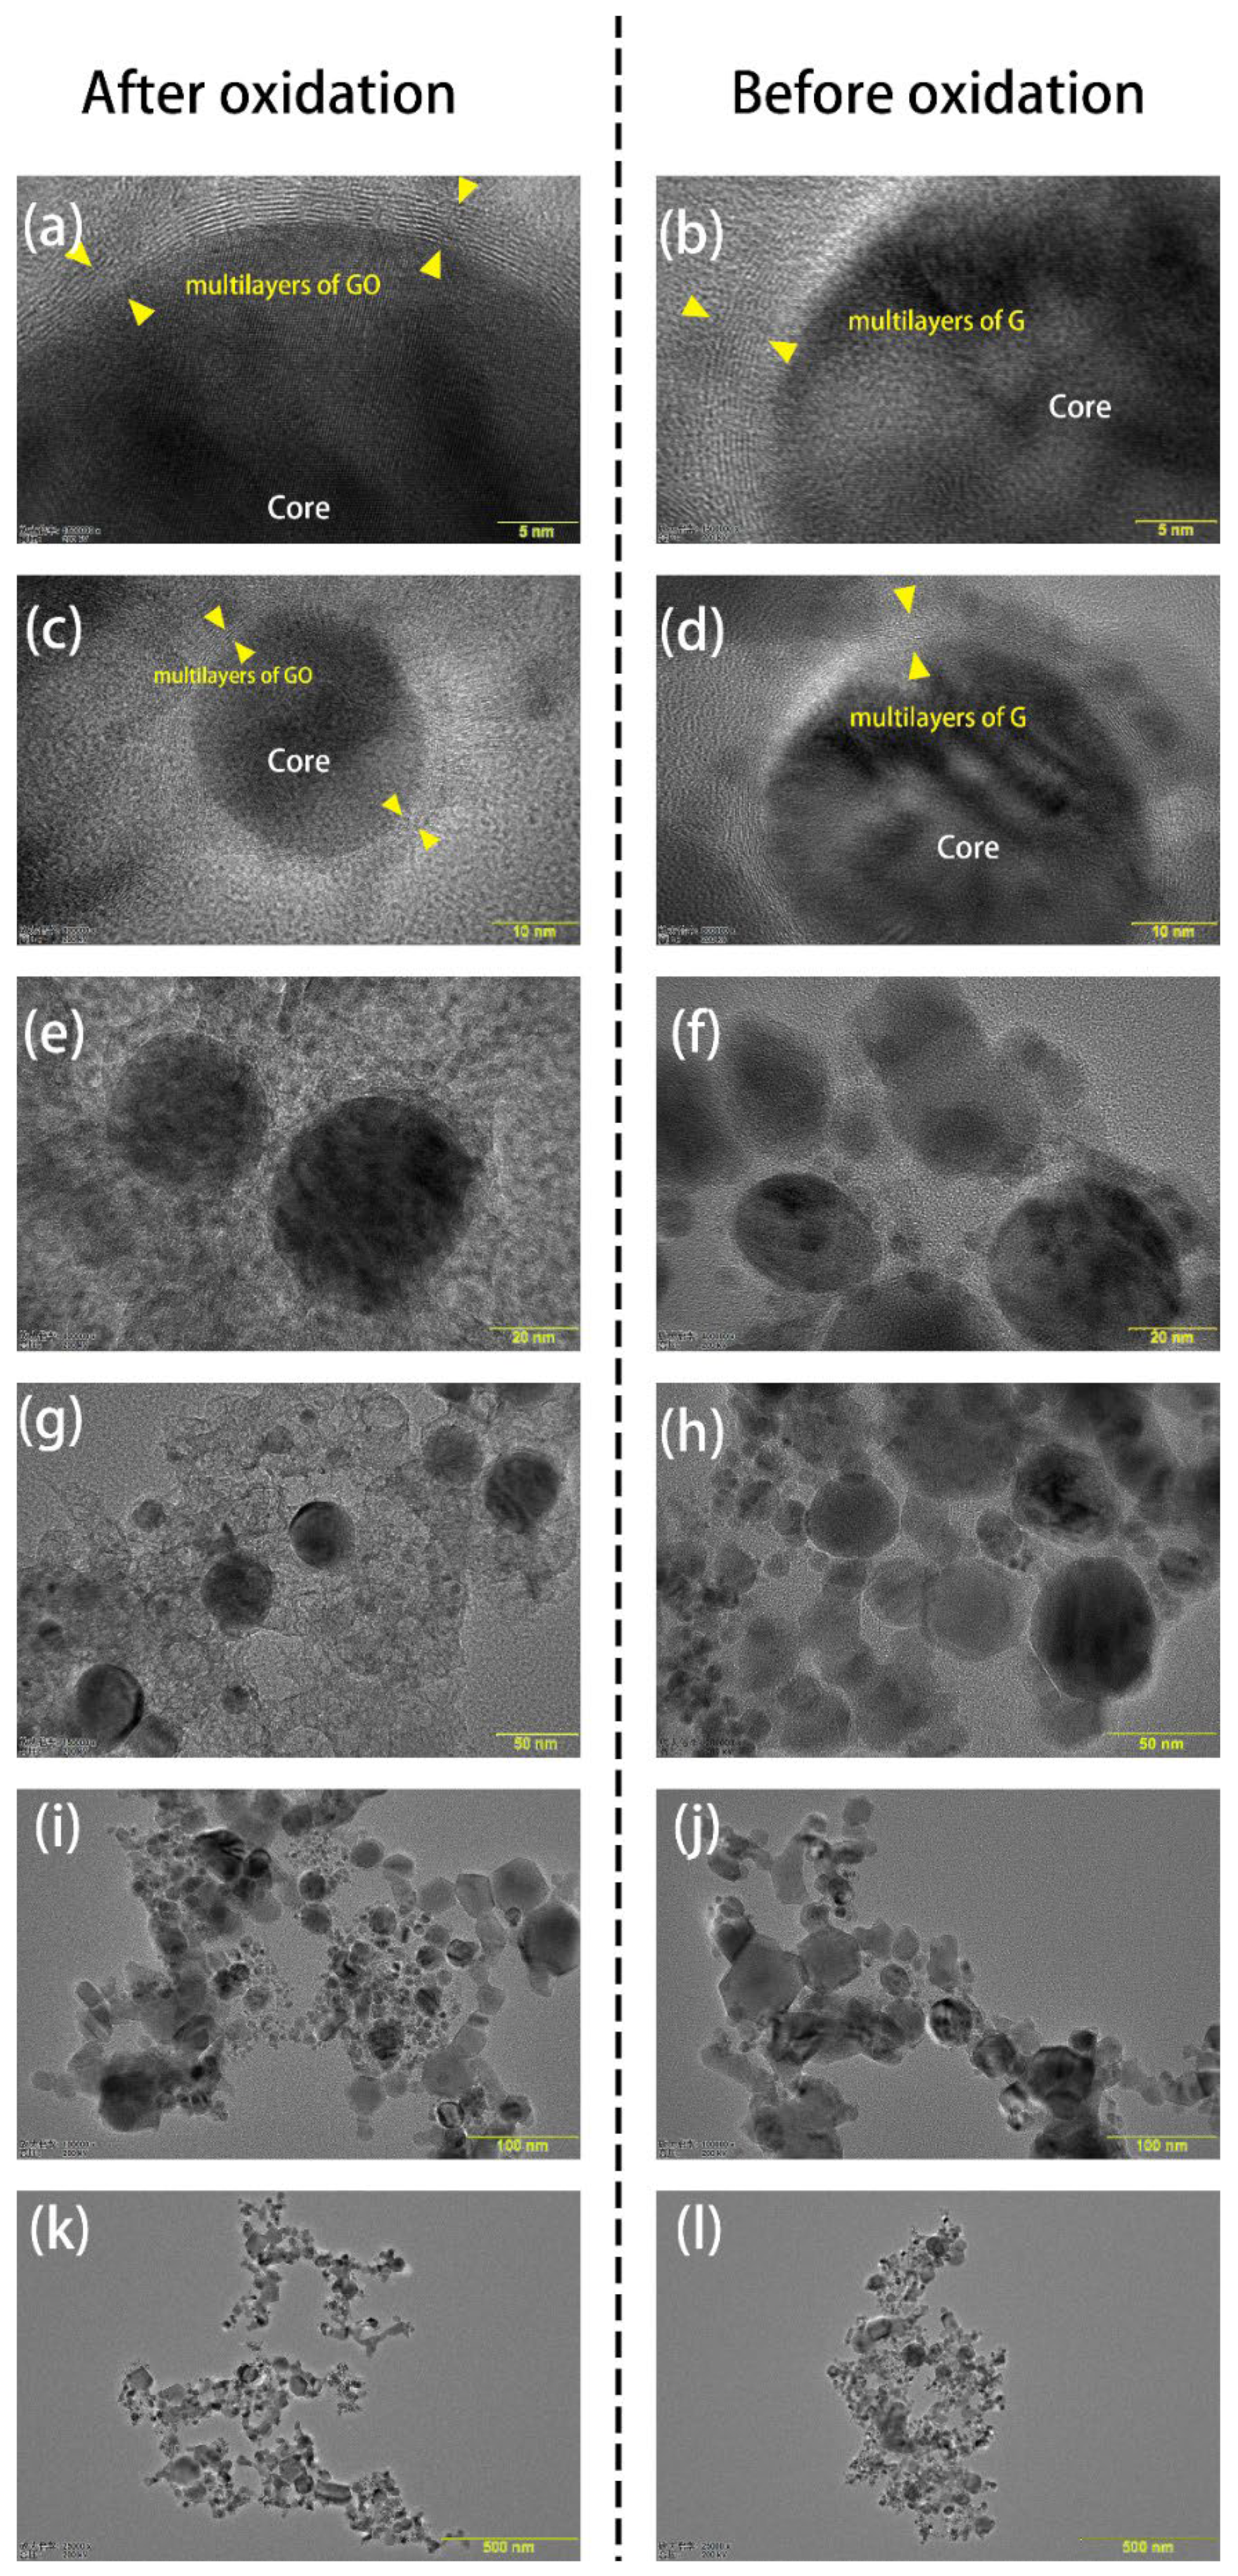
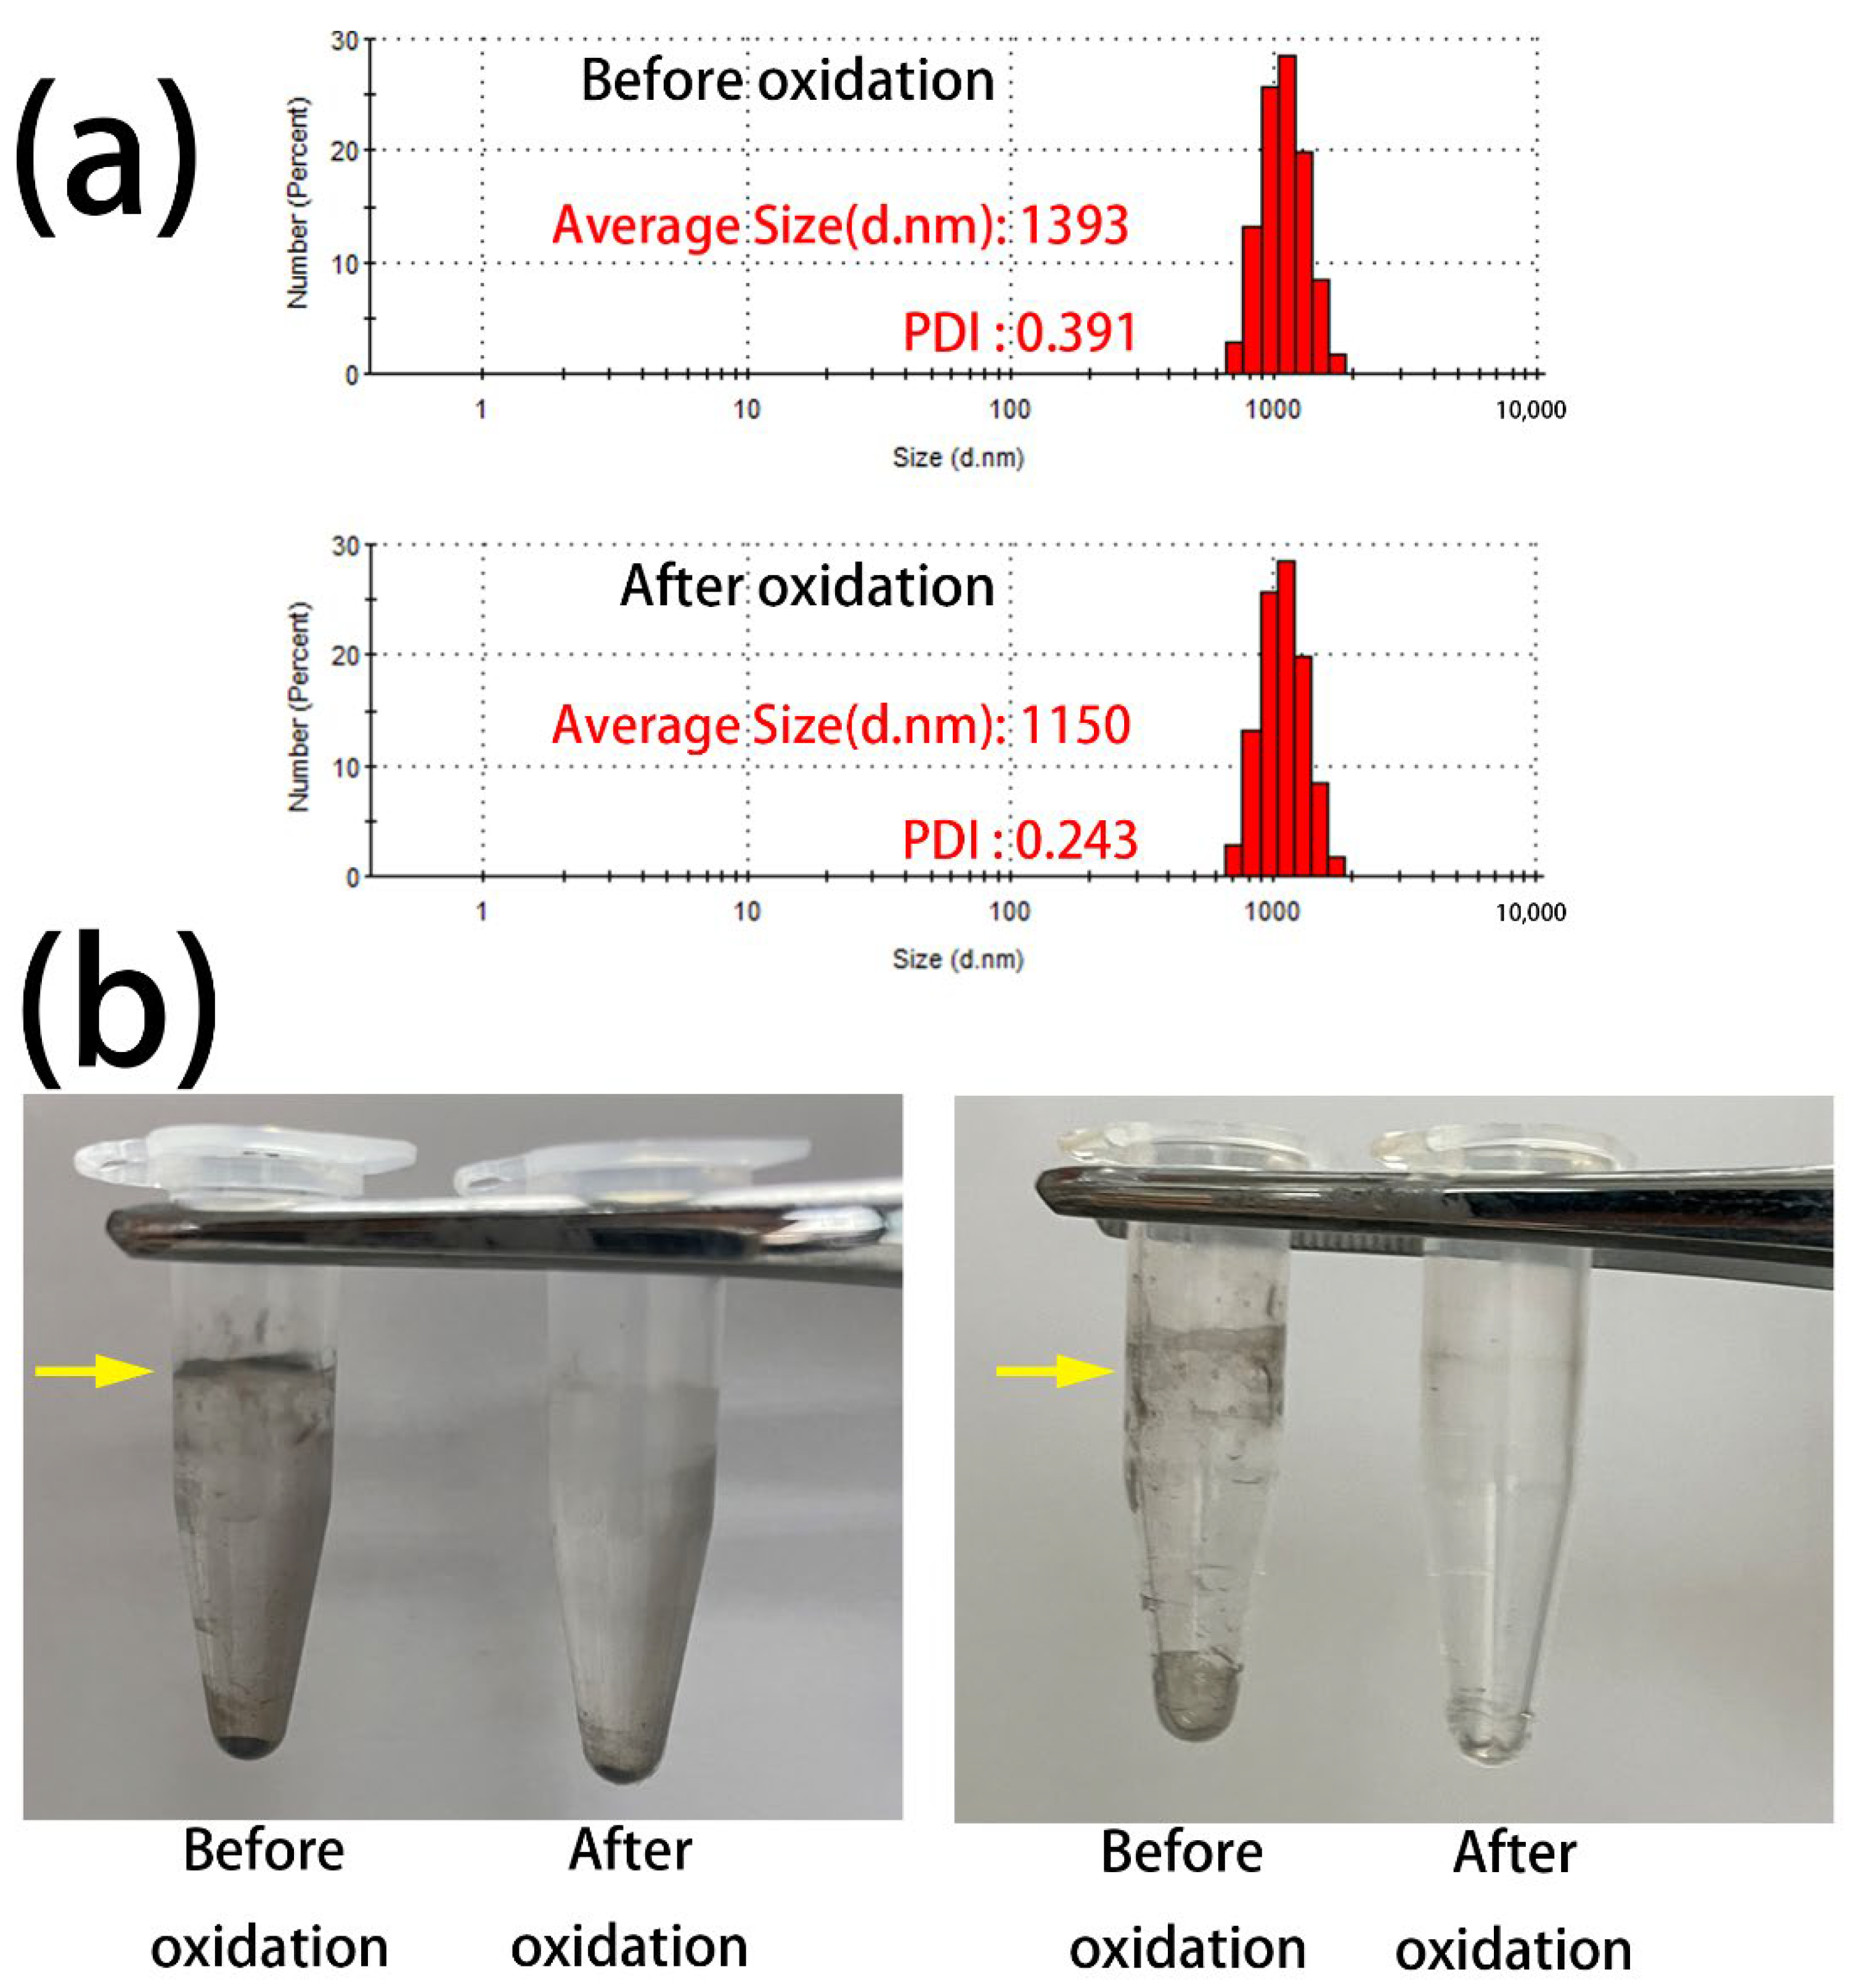
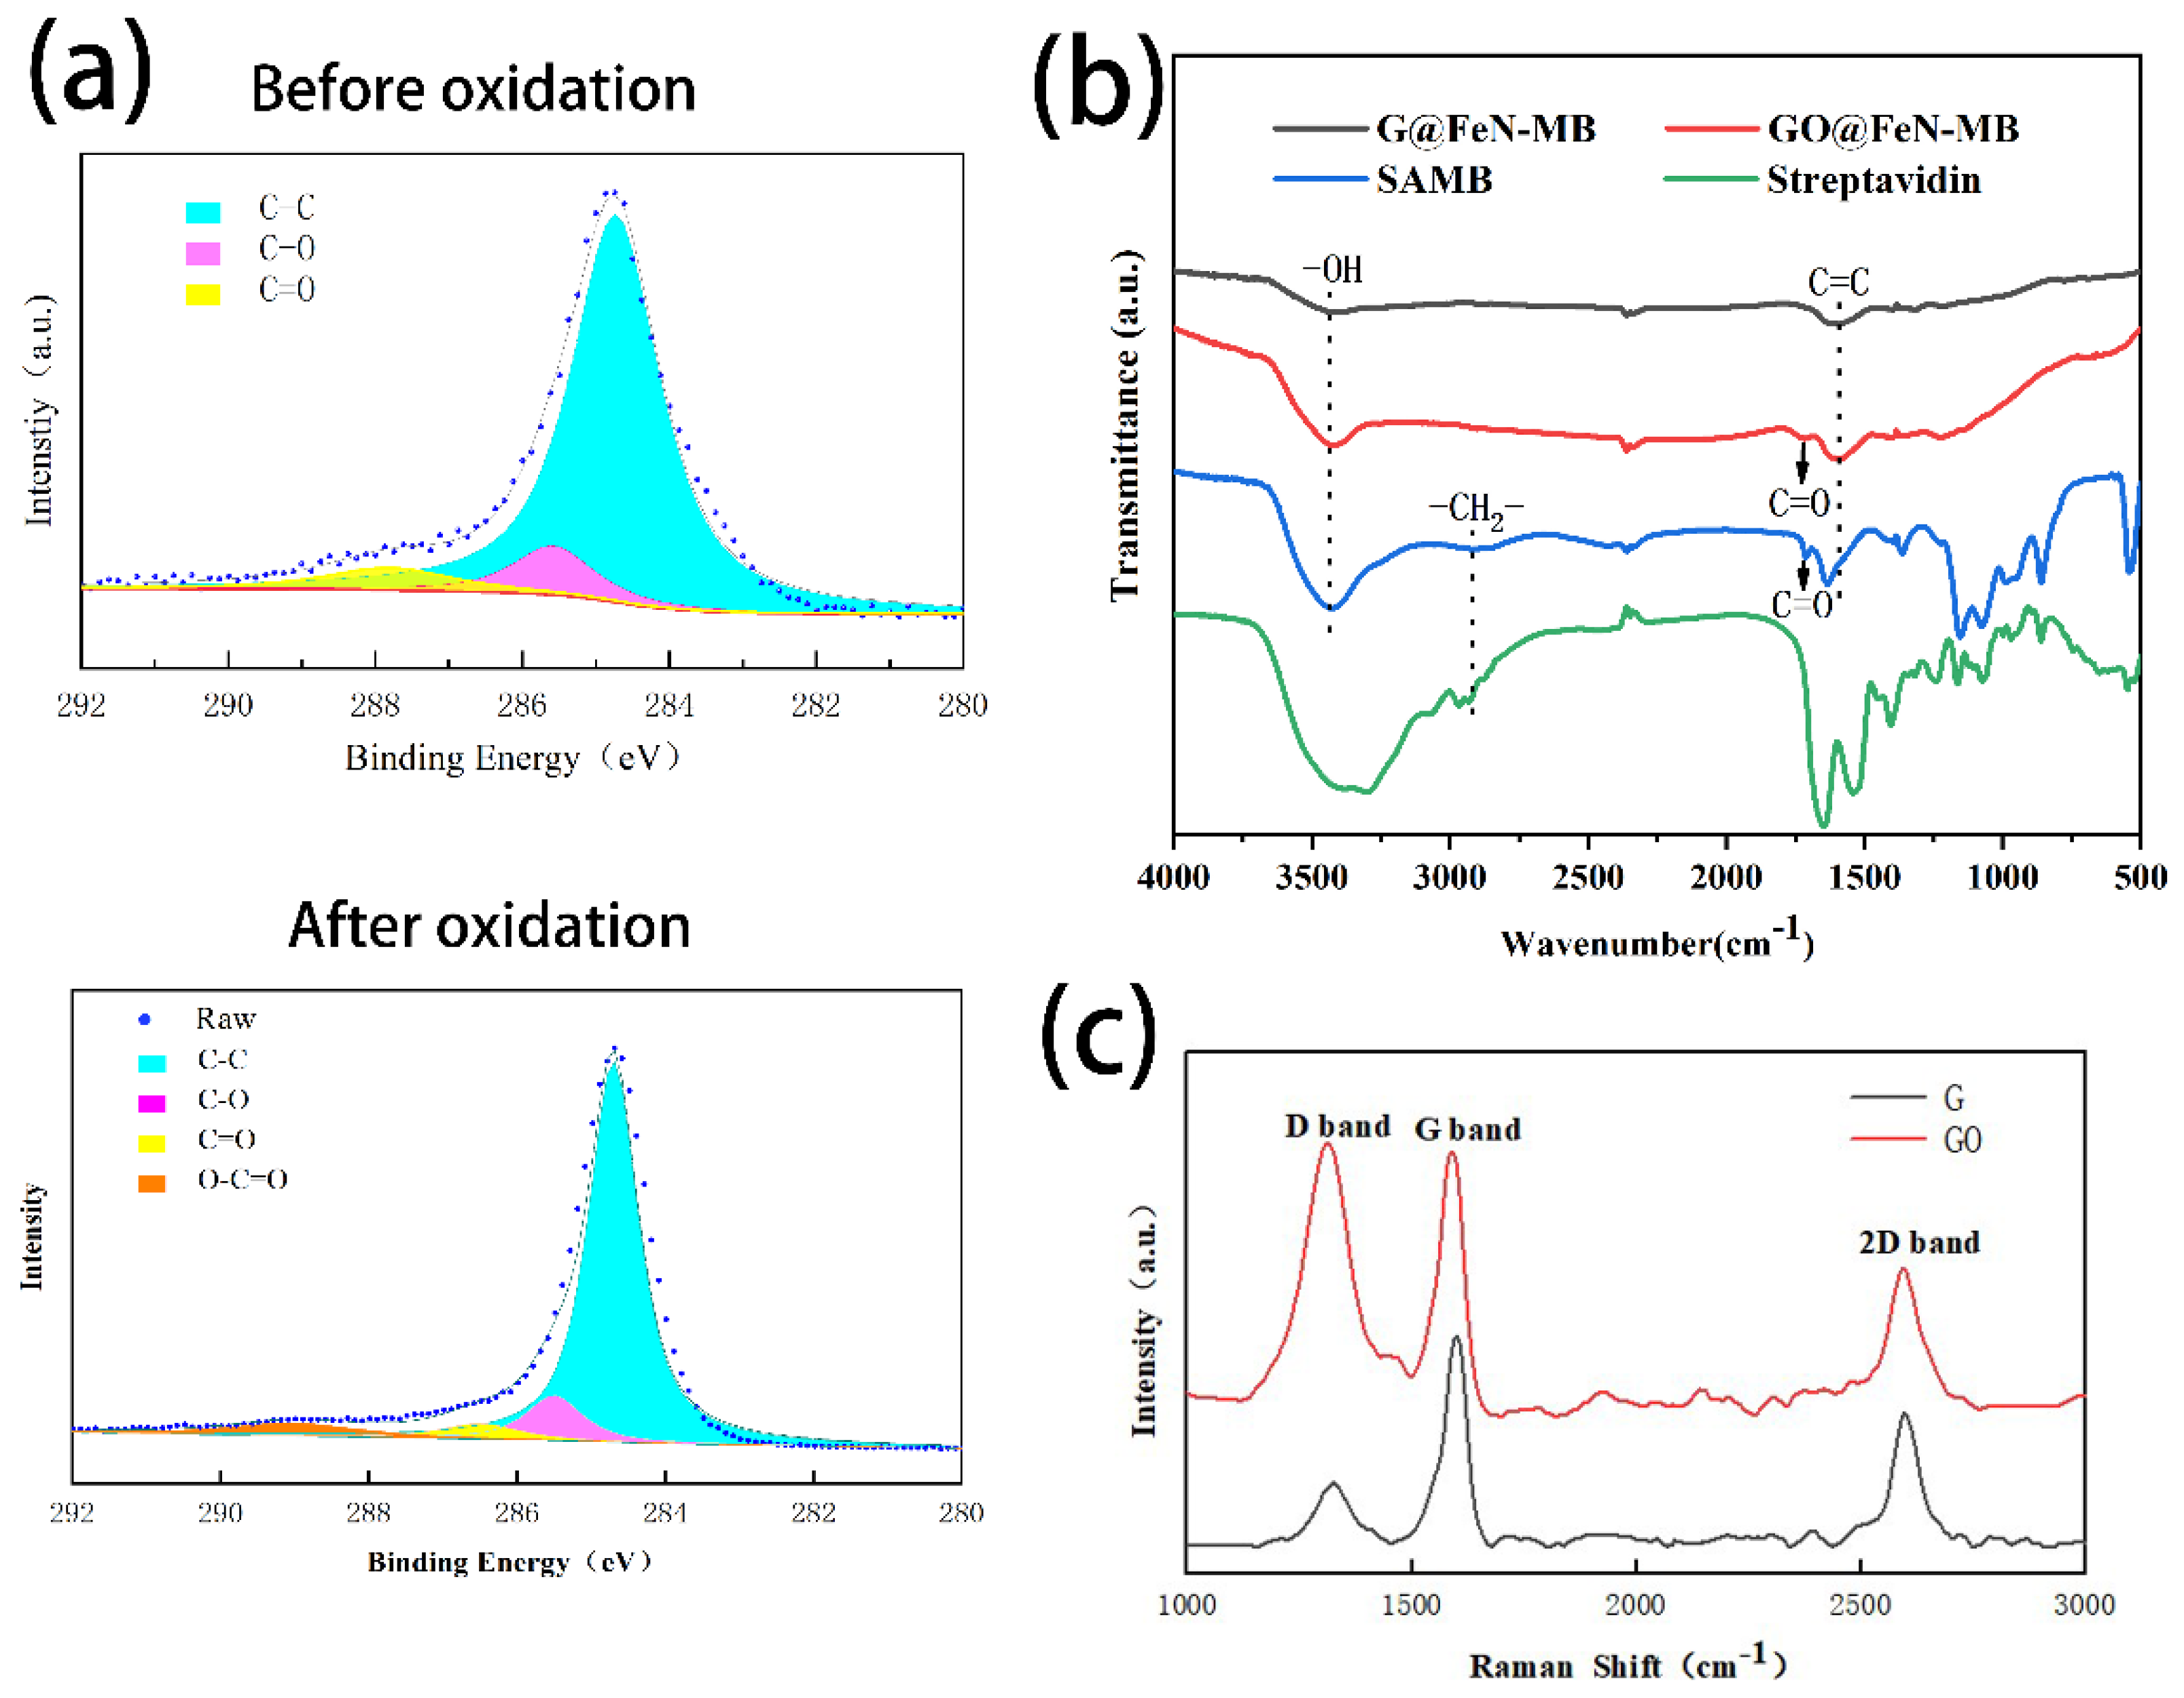
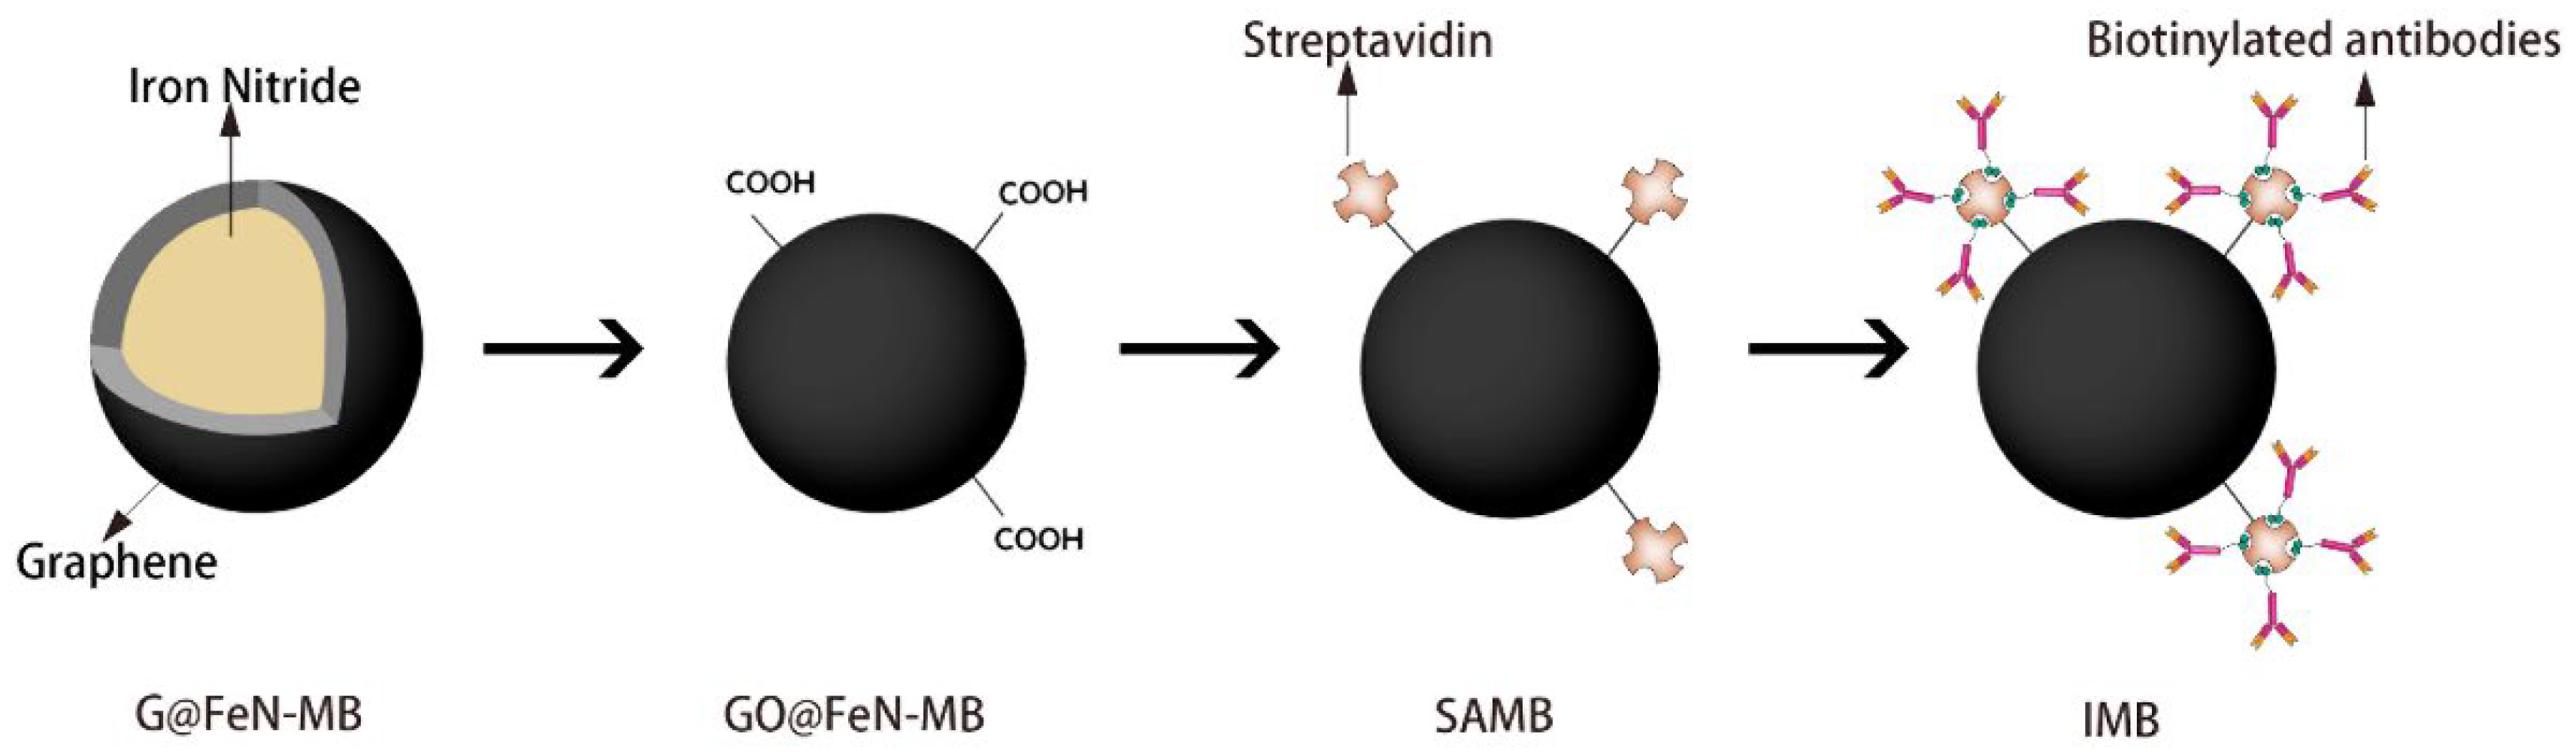
2.1. Surface Oxidation of G@FeN-MB

G@FeN-MB was provided by Wang’s team [22]. An improved Hummer method [32,33] was used to oxidize the graphene on the surface of the magnetic beads to prepare the carboxyl groups required for the coupling of the streptavidin. G@FeN-MB (300 mg) and NaNO3 (250 mg) were added to the beaker, which was placed in ice to maintain a low temperature. H2SO4 (25 mL) was added and mixed, and then KMnO4 (500 mg) was added slowly and evenly, and stirred for 15 min. The mouth of the beaker was covered with aluminum foil to reduce evaporation. The beaker was sonicated for 60 min at 35 °C in an ultrasonic water bath instrument (KQ5200DE, Kunshan Ultrasonic Instruments Co., Ltd., Kunshan, China). Then, 40 mL of distilled water was slowly added, followed by heating at 95 °C for 8 min. After that, an appropriate amount of 30% H2O2 was added until no more bubbles were generated.
We divided the magnetic bead solution into 50 mL centrifuge tubes, placed them next to the magnet, and used a pipette to remove the upper layer of yellowish liquid. We added pure water to the centrifuge tube to resuspend the magnetic beads, placed it next to the magnet again for 30 s, removed the liquid, and repeated the above washing step twice to wash away the residual acid solvent.
G@FeN-MB and GO@FeN-MB was characterized by a Raman spectrometer (Thermo Fisher Scientific, Waltham, MA, USA) equipped with a 633 nm laser. The chemical bond changes of G@FeN-MB and GO@FeN-MB were characterized by X-ray photoelectron spectroscopy (ESCALAB 250Xi, Thermo Scientific, Waltham, MA, USA). The FTIR spectra was obtained by a FTIR instrument (BRUKER VERTEX 70) with a data-processing unit. The morphologies of G@FeN-MB and GO@FeN-MB were characterized by TEM (JEM-2010, JEOL Ltd., Tokyo, Japan). The XPS, FTIR, and Raman spectroscopy data were processed by Origin software.
NaCl, NaNO3, KMnO4, 95% H2SO4, and 30% H2O2 were purchased from Beijing Chemical Works (Beijing, China).

2.2. Preparation of IMB

For the coupling of the streptavidin to the magnetic beads, 3 mg magnetic beads were washed once with deionized water and twice with MES (25 mM, pH~5.4). A total of 900 μL of N-hydroxysuccinimide (NHS) and 1-ethyl-3-[3-dimethylaminopropyl] carbodiimide hydrochloride (EDC) solution (10 mg/mL, dissolved in MES (0.5 M, pH 5.0)) were added, reacted on the mixer for 10 min, and then the supernatant was removed by magnetic separation. After the reaction, the beads were washed three times with MES to remove the remaining NHS, EDC, and reaction by-product urea. After that, 200 μg streptavidin solution (in MES (0.5 M, pH 5.0)) was added and reacted on a mixer for 2 h at room temperature, washed 3 times with PBS to remove unreacted streptavidin, and then 1 mL BSA solution (1 mg/mL) was added and reacted on a mixer for 2 h at room temperature. The prepared SAMBs were washed 3 times, dissolved in 900 μL PBS, and stored at 4 °C for later use. The amount of streptavidin coupled to the magnetic beads was detected by the BCA protein quantification method, and the experimental procedures were carried out in accordance with the instructions. In order to detect the binding tightness of the streptavidin on the SAMBs, the magnetic beads were washed with 1× Elisa eluent, and the content of streptavidin eluted in the supernatant was detected by the BCA protein quantification method.
For the biotinylation of the S1 antibody, 25 μL of S1 antibody (4 mg/mL, in PBS) was added to 75 μL of PBS to prepare a 1 mg/mL S1 antibody solution. A quantity of 1 mg N-hydroxysuccinimidobiotin (sulfo-NHS-biotin) was dissolved in 224 μL pure water to prepare a 10 mM sulfo-NHS-biotin solution, and 3.3 μL of sulfo-NHS-biotin solution was added to the S1 antibody solution and placed on ice to react for 2 h. Then, the solution was added to the ultrafiltration tube (with a pore size of 50 kDa NMWCO, Millipore, Billerica, MA, USA), filled with pure water to 500 μL, and centrifuged at 12,500 rpm for 15 min. We repeated the above water replenishment and centrifugation steps three times to remove excess, unreacted biotin. The level of biotinylation of S1 antibody was detected with a Pierce Biotin Quantitation Kit (Thermo Fisher Scientific Co., Ltd., Waltham, MA, USA).
An amount of 50 μg of biotinylated S1 antibody was added to 150 μL of SAMBs and reacted on ice for 10 min. The prepared IMB were washed three times with PBS to remove unreacted biotinylated S1 antibody, dissolved in 100 μL PBS, and stored at 4 °C for later use.
NHS and EDC were purchased from Shanghai Medpep Co., Ltd. (Shanghai, China). MES buffer and PBS buffer were purchased from Shanghai Macklin Biochemical Co., Ltd. (Shanghai, China). Sulfo-NHS-biotin was purchased from BioVision Inc. (Milpitas, CA, USA). Streptavidin was purchased from Solarbio Co., Ltd. (Beijing, China). BSA was purchased from Beijing Zhongke Keao Biotechnology Co., Ltd. (Beijing, China). S1 antibody was purchased from Beijing BioNG Biotechnology Co., Ltd. (Beijing, China, Cat No:2020T16).

2.3. Preparation of SARS-CoV-2 S-PS

A total of 200 μL (10 mg/mL) fluorescent polystyrene beads (PS) was added to 100 μL NHS/EDC solution (10 mg/mL) and 200 μL PBS. After 10 min of dark reaction, we centrifuged it (15,000 rpm, 4 °C) for 20 min. After carefully aspirating the supernatant, 11 μg of spike protein was added, and the reaction was carried out on ice for 2 h. After the reaction, the supernatant was removed by centrifugation for 20 min, the S-PS was dissolved in 100 μL of PBS, and stored at 4 °C.
After the reaction, the protein concentration in the supernatant solution was determined by the BCA protein quantitative method to obtain the mass of spike protein coupled to the S-PS, and the number of spike proteins on each S-PS was calculated.
PS was purchased from Alab Chemical Technology Co., Ltd. (Shanghai, China, Cat No. A69262).

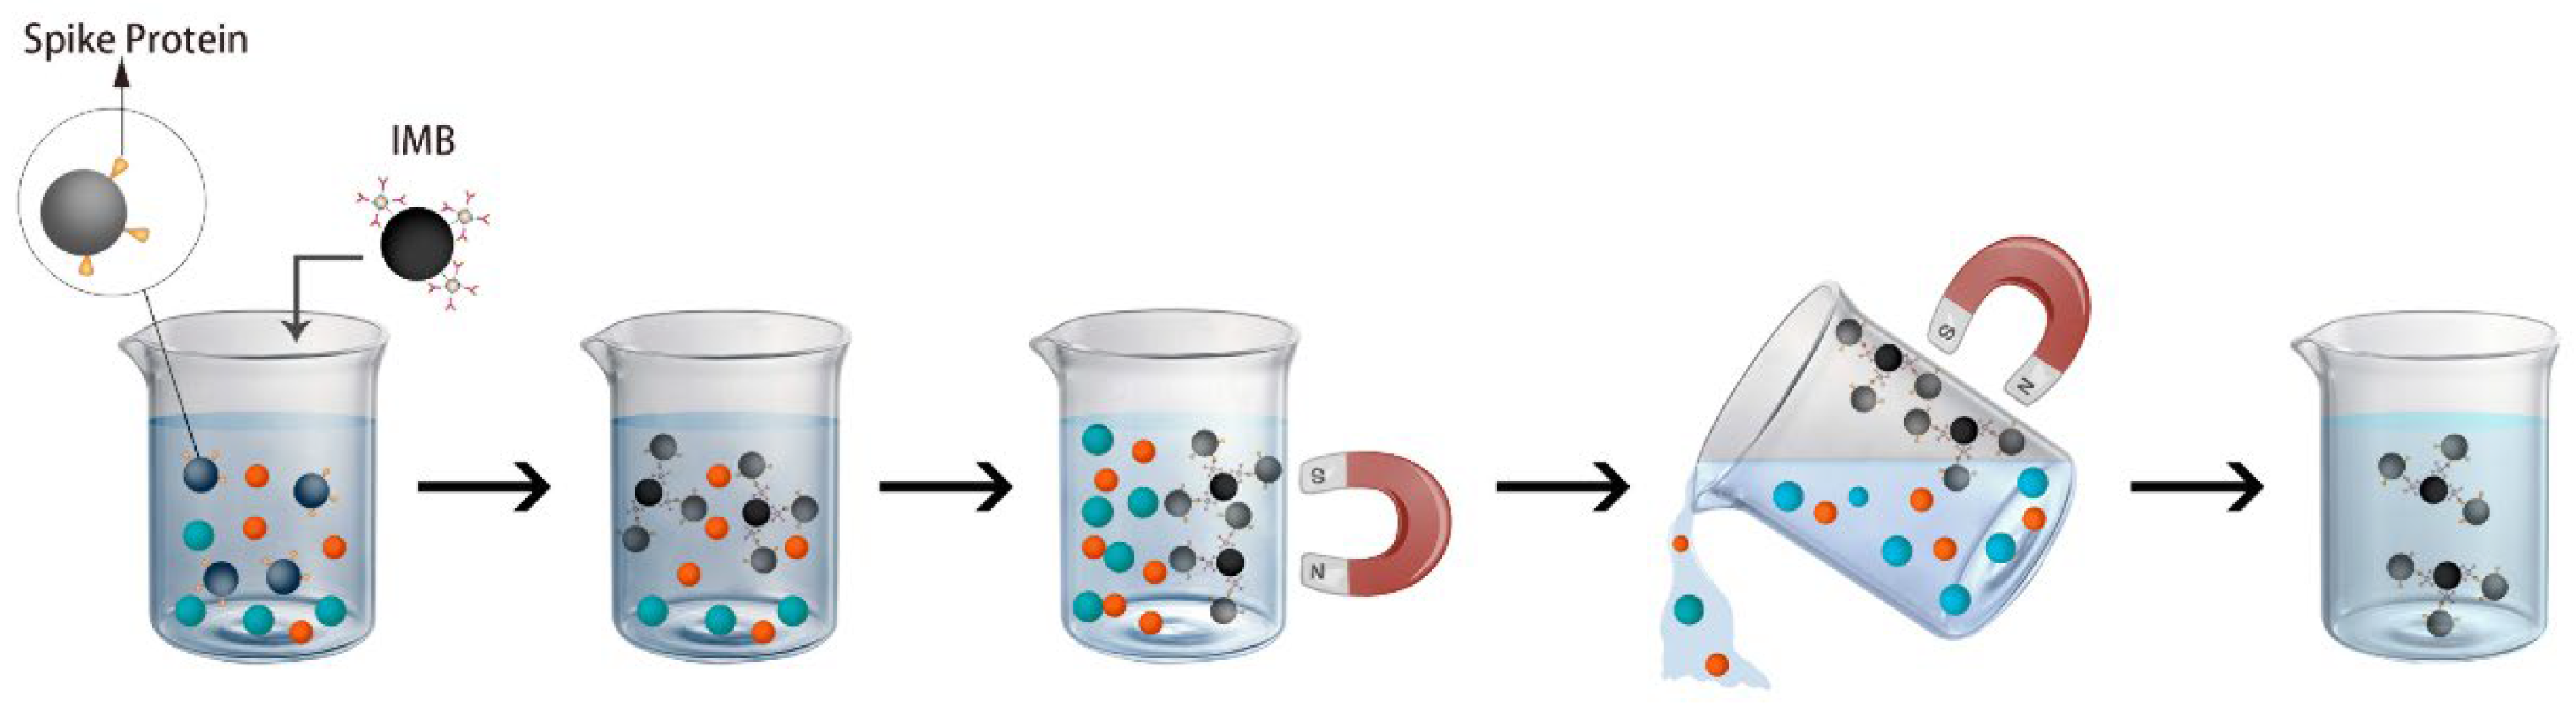
2.4. IMB Capture SARS-CoV-2 S-PS Experiment

A quantity of 100 μL of the S-PS prepared in 2.3 was added to 900 μL of ultrapure water, and 0.5 mg of the IMB prepared in 2.2 was added to it, reacted for 5 min, washed with deionized water three times, and dissolved in 200 μL PBS. Similarly, PS without the spike-protein-coupled solution was used as a control sample for S-PS isolation.
A total of 20 μL of the above solution and 200 μL pure water were added to a 96-well, black assay plate; the fluorescence intensity (excitation wavelength 550 nm, absorption wavelength 600 nm) was measured in a microplate reader and compared with the PS diluted in a concentration gradient.
One drop (approximately 5 μL) of the magnetic bead solution was dropped onto a glass slide, observed, and photographed under a fluorescence microscope.

2.5. IMB Capture SARS-CoV-2 Pseudovirus Experiment

A total of 1 μL (containing 105 pseudovirus) of the pseudovirus was added to 900 μL of ultrapure water, and 0.5 mg of the IMB prepared in 2.2 was added to it, reacted for 10 min, washed with deionized water three times, and PBS was added to 200 μL. Similarly, the SAMB solution was used as a control sample. A total of 1 μg of anti-S2 antibody was added, incubated at room temperature for 30 min, washed three times, and then 3 μg of FITC-labeled, secondary antibody was added, reacted at room temperature for 30 min, washed three times, and we then resuspended the magnetic beads with 300 μL of pure water. A quantity of 20 μL of the above solution and 200 μL of pure water were added to a 96-well, black assay plate, and the fluorescence intensity (excitation wavelength 493 nm, absorption wavelength 518 nm) was measured in a microplate reader. One drop (approximately 5 μL) of the magnetic bead solution was dropped on a glass slide, observed, and photographed under a fluorescence microscope.
SARS-CoV-2 pseudovirus was purchased from Sino Biological Co., Ltd. (Beijing, China, Cat Numer:PSV001). Anti-S2 antibody was purchased from GeneTex, Inc. (Irvine, CA, USA). FITC-labeled secondary antibody was purchased from EarthOx, Inc. (Burlingame, CA, USA).

3. Results and Discussion

3.1. Characterization of GO@FeN-MB

First, G@FeN-MB was oxidized by a modified Hummer method in order to modify the surface layer of graphene-to-graphene oxide. The purpose was to generate the carboxyl functional groups required for the subsequent coupling with streptavidin. As shown in the left half of Figure 1, the transmission electron microscopy of GO@FeN-MB shows that the magnetic beads still have an obvious core-shell structure (Figure 1a,c,e), wrapped by multilayers of graphene oxide (Figure 1a,c), and the iron nitride core particle size ranges from 20–100 nm.
However, the shells of the magnetic beads were agglomerated together due to the characteristics of graphene (Figure 1i,j). Agglomeration can be slightly reduced by sonication. This resulted in the magnetic beads having an average particle size of 1 μm as measured by a Mastersizer 3000 (Figure 2a). The oxidation process does not have a great impact on the morphology of the magnetic beads (Figure 1e–h), and the iron nitride is still well coated by the graphene oxide (Figure 1a–d), which does not affect the subsequent use of the magnetic beads. The oxidation has little effect on the average particle size of G@FeN-MB (Figure 2a) and reduces the polymer dispersity index (PDI) value of magnetic beads, improving the uniformity of the magnetic beads.
Oxidation also reduces the wall-sticking of the magnetic beads, which is very beneficial for the application of magnetic beads. As shown in Figure 2b, 0.5 mg magnetic beads was dissolved in 1 mL of pure water, and the magnetic beads were adsorbed to the bottom of the EP tube by a magnet for 1 min (Figure 2b (left)). It can be observed that G@FeN-MBs has obvious adhesion to the tube, while the adhesion of GO@FeN-MBs is significantly reduced. After mixing and removing the magnetic bead solution, it can be observed in Figure 2b (right) that there were still a large number of G@FeN-MB on the wall of the EP tube, but there is no such phenomenon with the GO@FeN-MB. It is speculated that this is due to the modification of the surface of the graphene with hydrophilic groups such as hydroxyl, carboxyl, and epoxy groups, which enhances the water solubility of the magnetic beads, thereby reducing the adhesion of the magnetic beads. This result is also verified by the PDI data of the magnetic beads before and after oxidation (Figure 2a).
The oxidation of G@FeN-MB was confirmed by determining the functional groups with XPS and FTIR. Figure 3a shows the XPS image of the magnetic beads before and after oxidation. It can be seen that G@FeN-MB has no carboxyl peak, while GO@FeN-MB has a carboxyl group at 289 eV. The peak indicates that the oxidation process successfully generated the carboxyl functional group on the surface of the magnetic beads. Figure 3b shows the FTIR spectra of G@FeN-MB and GO@FeN-MB; the same functional groups were identified for G@FeN-MB and GO@FeN-MB as O-H stretching (3428 and 3422 cm−1) and C=C stretching (1624 and 1617 cm1). The C=O stretching was observed at 1718 cm−1 in GO@FeN-MB but not in G@FeN-MB, and the absorption peak intensity of O-H in GO@FeN-MB was obviously stronger than in G@FeN-MB. The above two phenomena indicate that oxidation successfully modifies the carboxyl groups on the surface of graphene.
Raman spectroscopy is an effective tool for characterizing the structural characteristics and performance of carbon nanomaterials [34,35,36]. The G band reflects the presence of C=C bonds (sp2 domains) on the graphene surface, the D band characterizes sp3 hybridized carbon atoms after functionalization, and the 2D band’s shape, intensity, and position indicate a difference between single- and multi-layer graphene. The intensity ratio of peak D to peak G (ID/IG) is usually used to evaluate the degree of graphitization of carbon nanomaterials [37,38]. Figure 3c shows the Raman spectra of GO@FeN-MB and G@FeN-MB. The higher ID/IG ratio in the case of GO@FeN-MB in comparison with G@FeN-MB can be explained by a higher number of defects due to oxidation. The ID/IG value of the GO@FeN-MB is significantly higher than G@FeN-MB, indicating that the oxidation effect is better, and the oxidation process successfully oxidized the graphene on the surface of the G@FeN-MB to graphene oxide. Combined with the XPS and FTIR results, it can be concluded that the oxidation reaction successfully oxidized the graphene on the surface of the G@FeN-MB to graphene oxide and generated carboxyl groups on the surface for coupling streptavidin.
The characterization results of GO@FeN-MB show that the oxidation successfully modifies the graphene on the surface of the G@FeN-MB into graphene oxide without destroying the morphology of the magnetic beads and generates carboxyl groups for coupling streptavidin on the surface. The oxygen-containing groups introduced in the oxidation process enhance the water solubility of the magnetic beads, which is beneficial to the subsequent application of the magnetic beads in the aqueous phase.

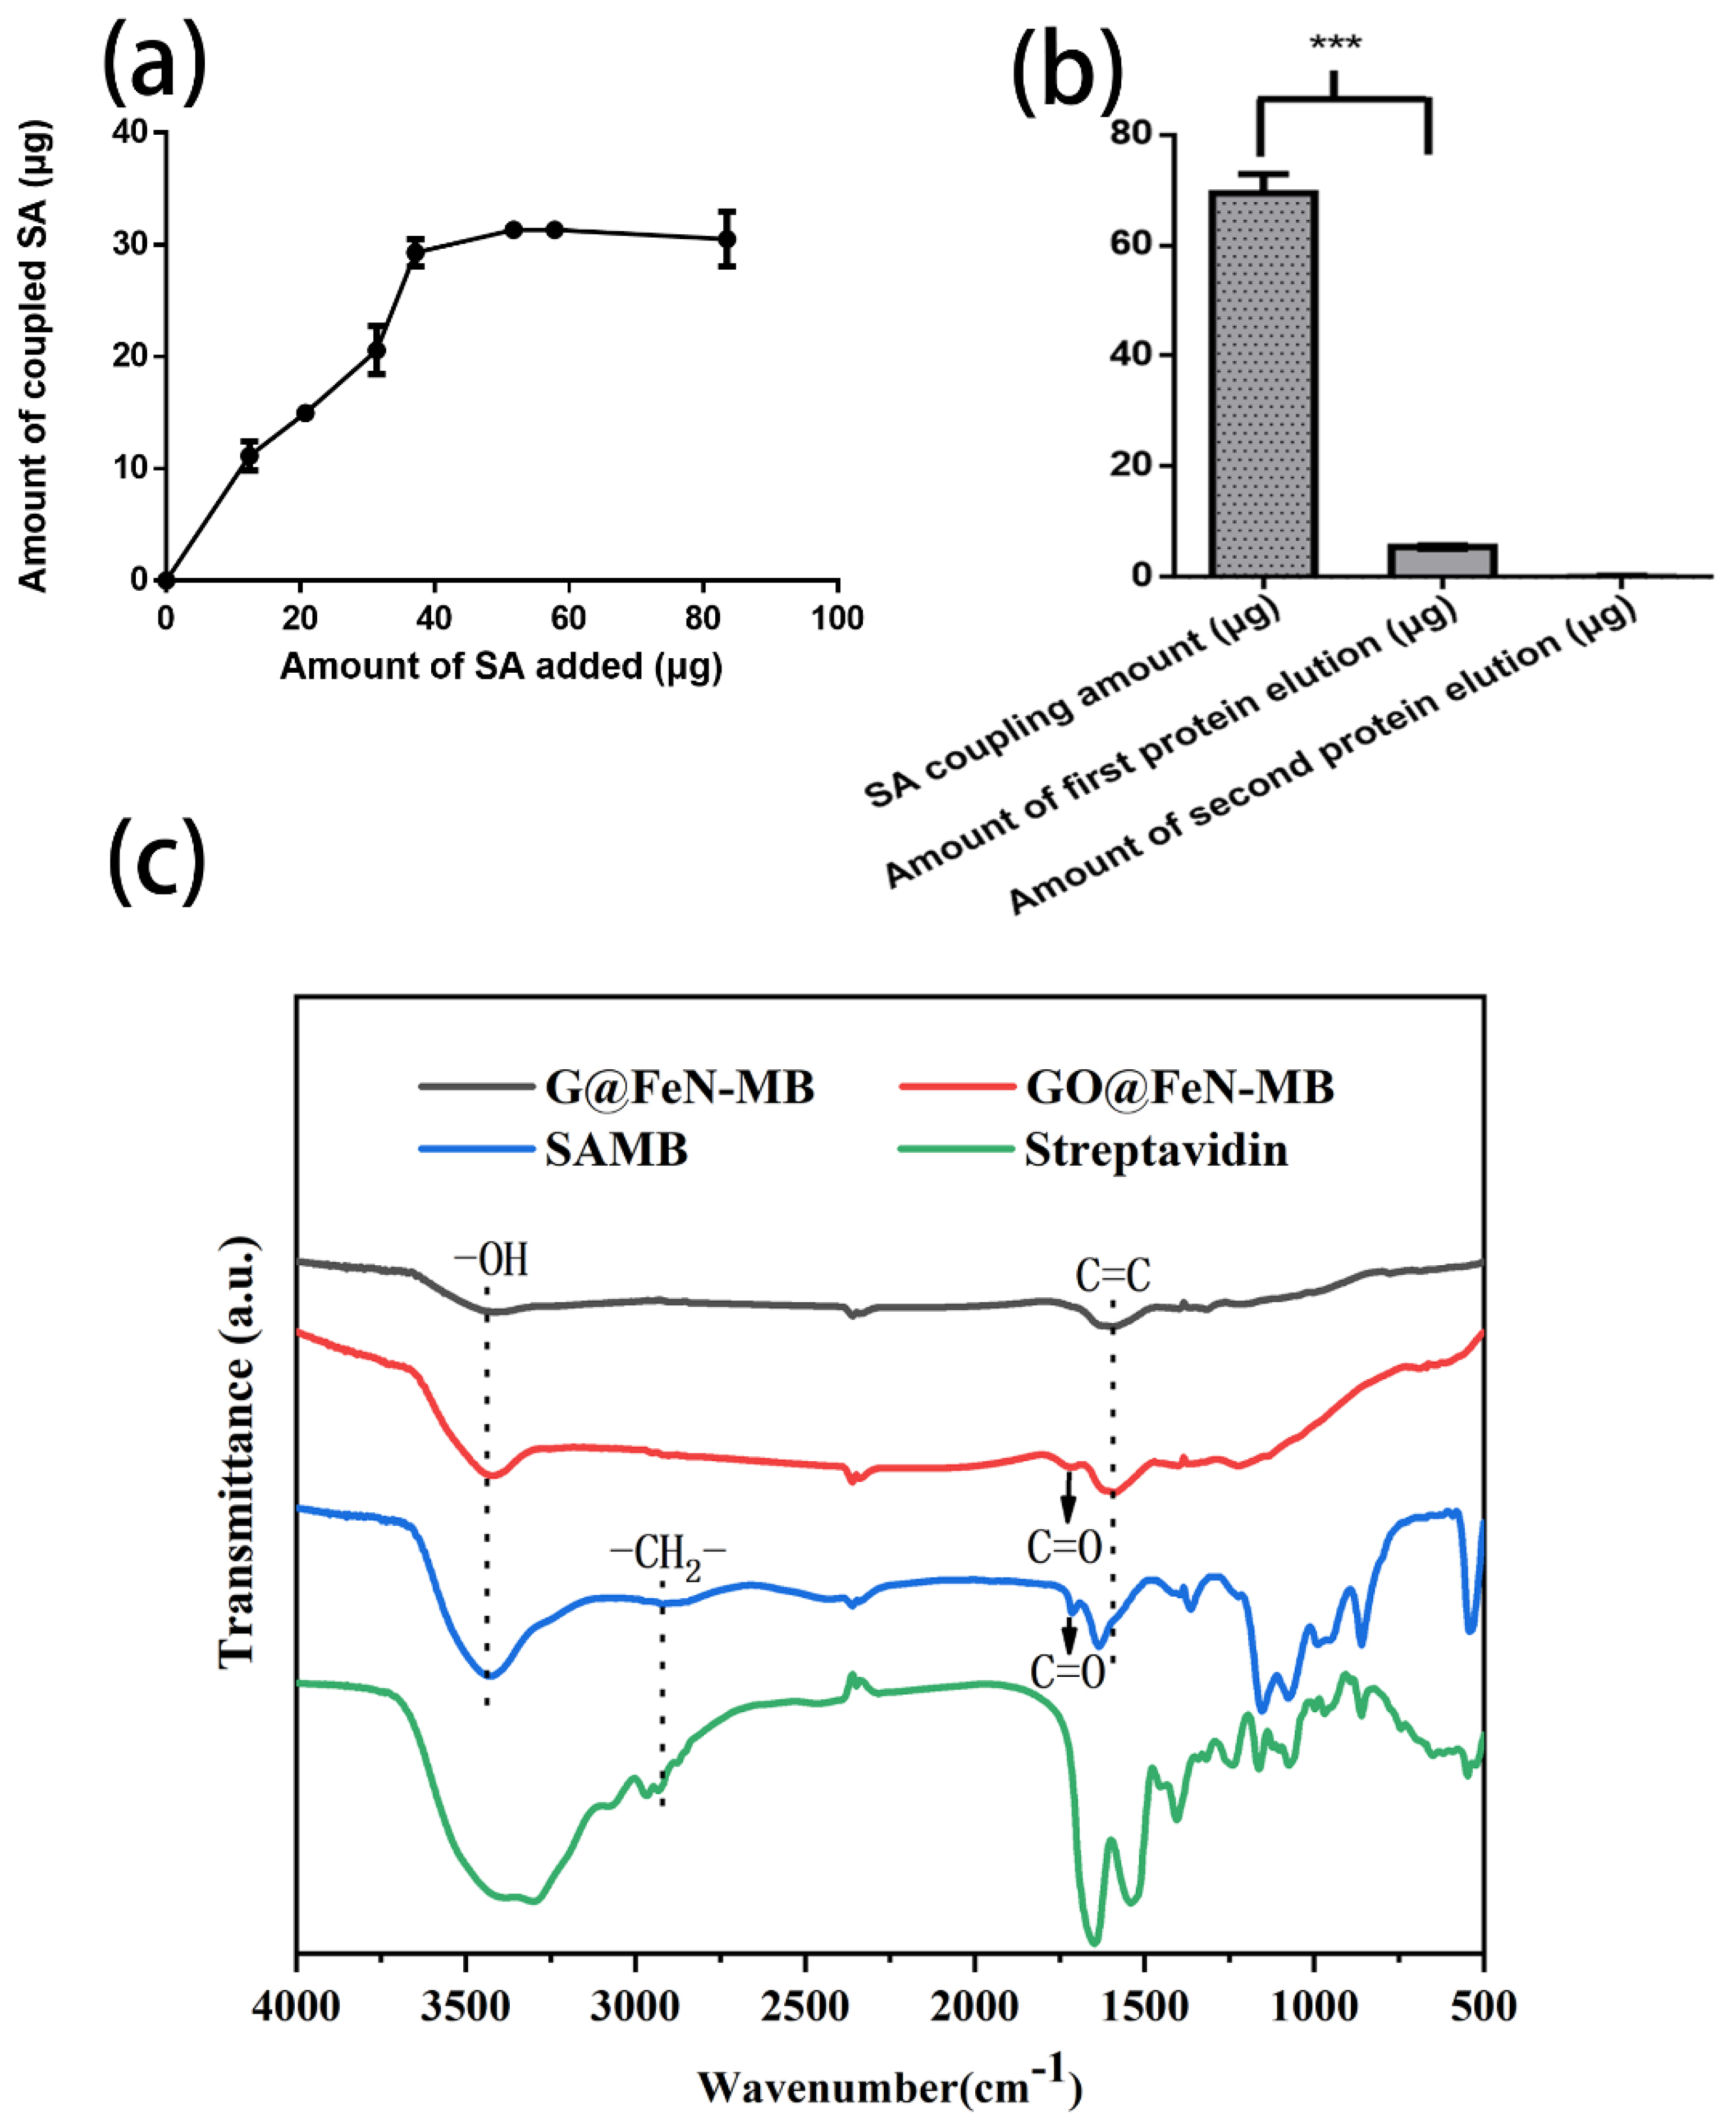
3.2. Preparation of SAMBs

Streptavidin was coupled to GO@FeN-MB by the carbodiimide method. The initially added protein and the remaining protein in the supernatant after the reaction were detected by the BCA protein quantitative method. After calculation, the coupling amount of streptavidin was obtained. It can be observed in Figure 3a that, as the amount of initially added streptavidin (SA) increased, the coupling amount of SA also increased. At about 30 μg, the coupling number of magnetic beads reached saturation. Each 0.5 mg magnetic bead can be coupled with 30 μg of streptavidin.
The coupling of streptavidin to GO@FeN-MB was also verified by the results of FTIR (Figure 4c); the same functional groups were identified for GO@FeN-MB and SAMBs as O-H stretching (3428 and 3422 cm−1), C=C stretching (1617 and 1634 cm−1), and C=O stretching (1718 and 1713 cm−1), but the peak intensities in the SAMBs were significantly higher than those in GO@FeN-MB, which is due to the fact that the chemical bond in the streptavidin coupled to SAMBs enhances the corresponding absorption peak intensity of the SAMBs, which indicates that streptavidin was successfully coupled to the SAMBs. The same conclusion can also be drawn from the following phenomenon. The H-C-H stretching was observed at 2855 cm−1 in the SAMB and SA samples, but not in the GO@FeN-MB. In the SAMB sample, there also appeared multiple absorption peaks below 1500 cm−1 that were not found in the GO@FeN-MB but which can be found in the SA samples.
In order to determine the tightness of the combination of SA and the magnetic beads, the streptavidin magnetic beads were washed with Elisa elution solution, and the content of the eluted protein was detected by the BCA protein quantification method. It can be seen in Figure 4b that the Elisa elution conditions could only elute a small amount (about 7–8%) of streptavidin that had bound to the bead surface.

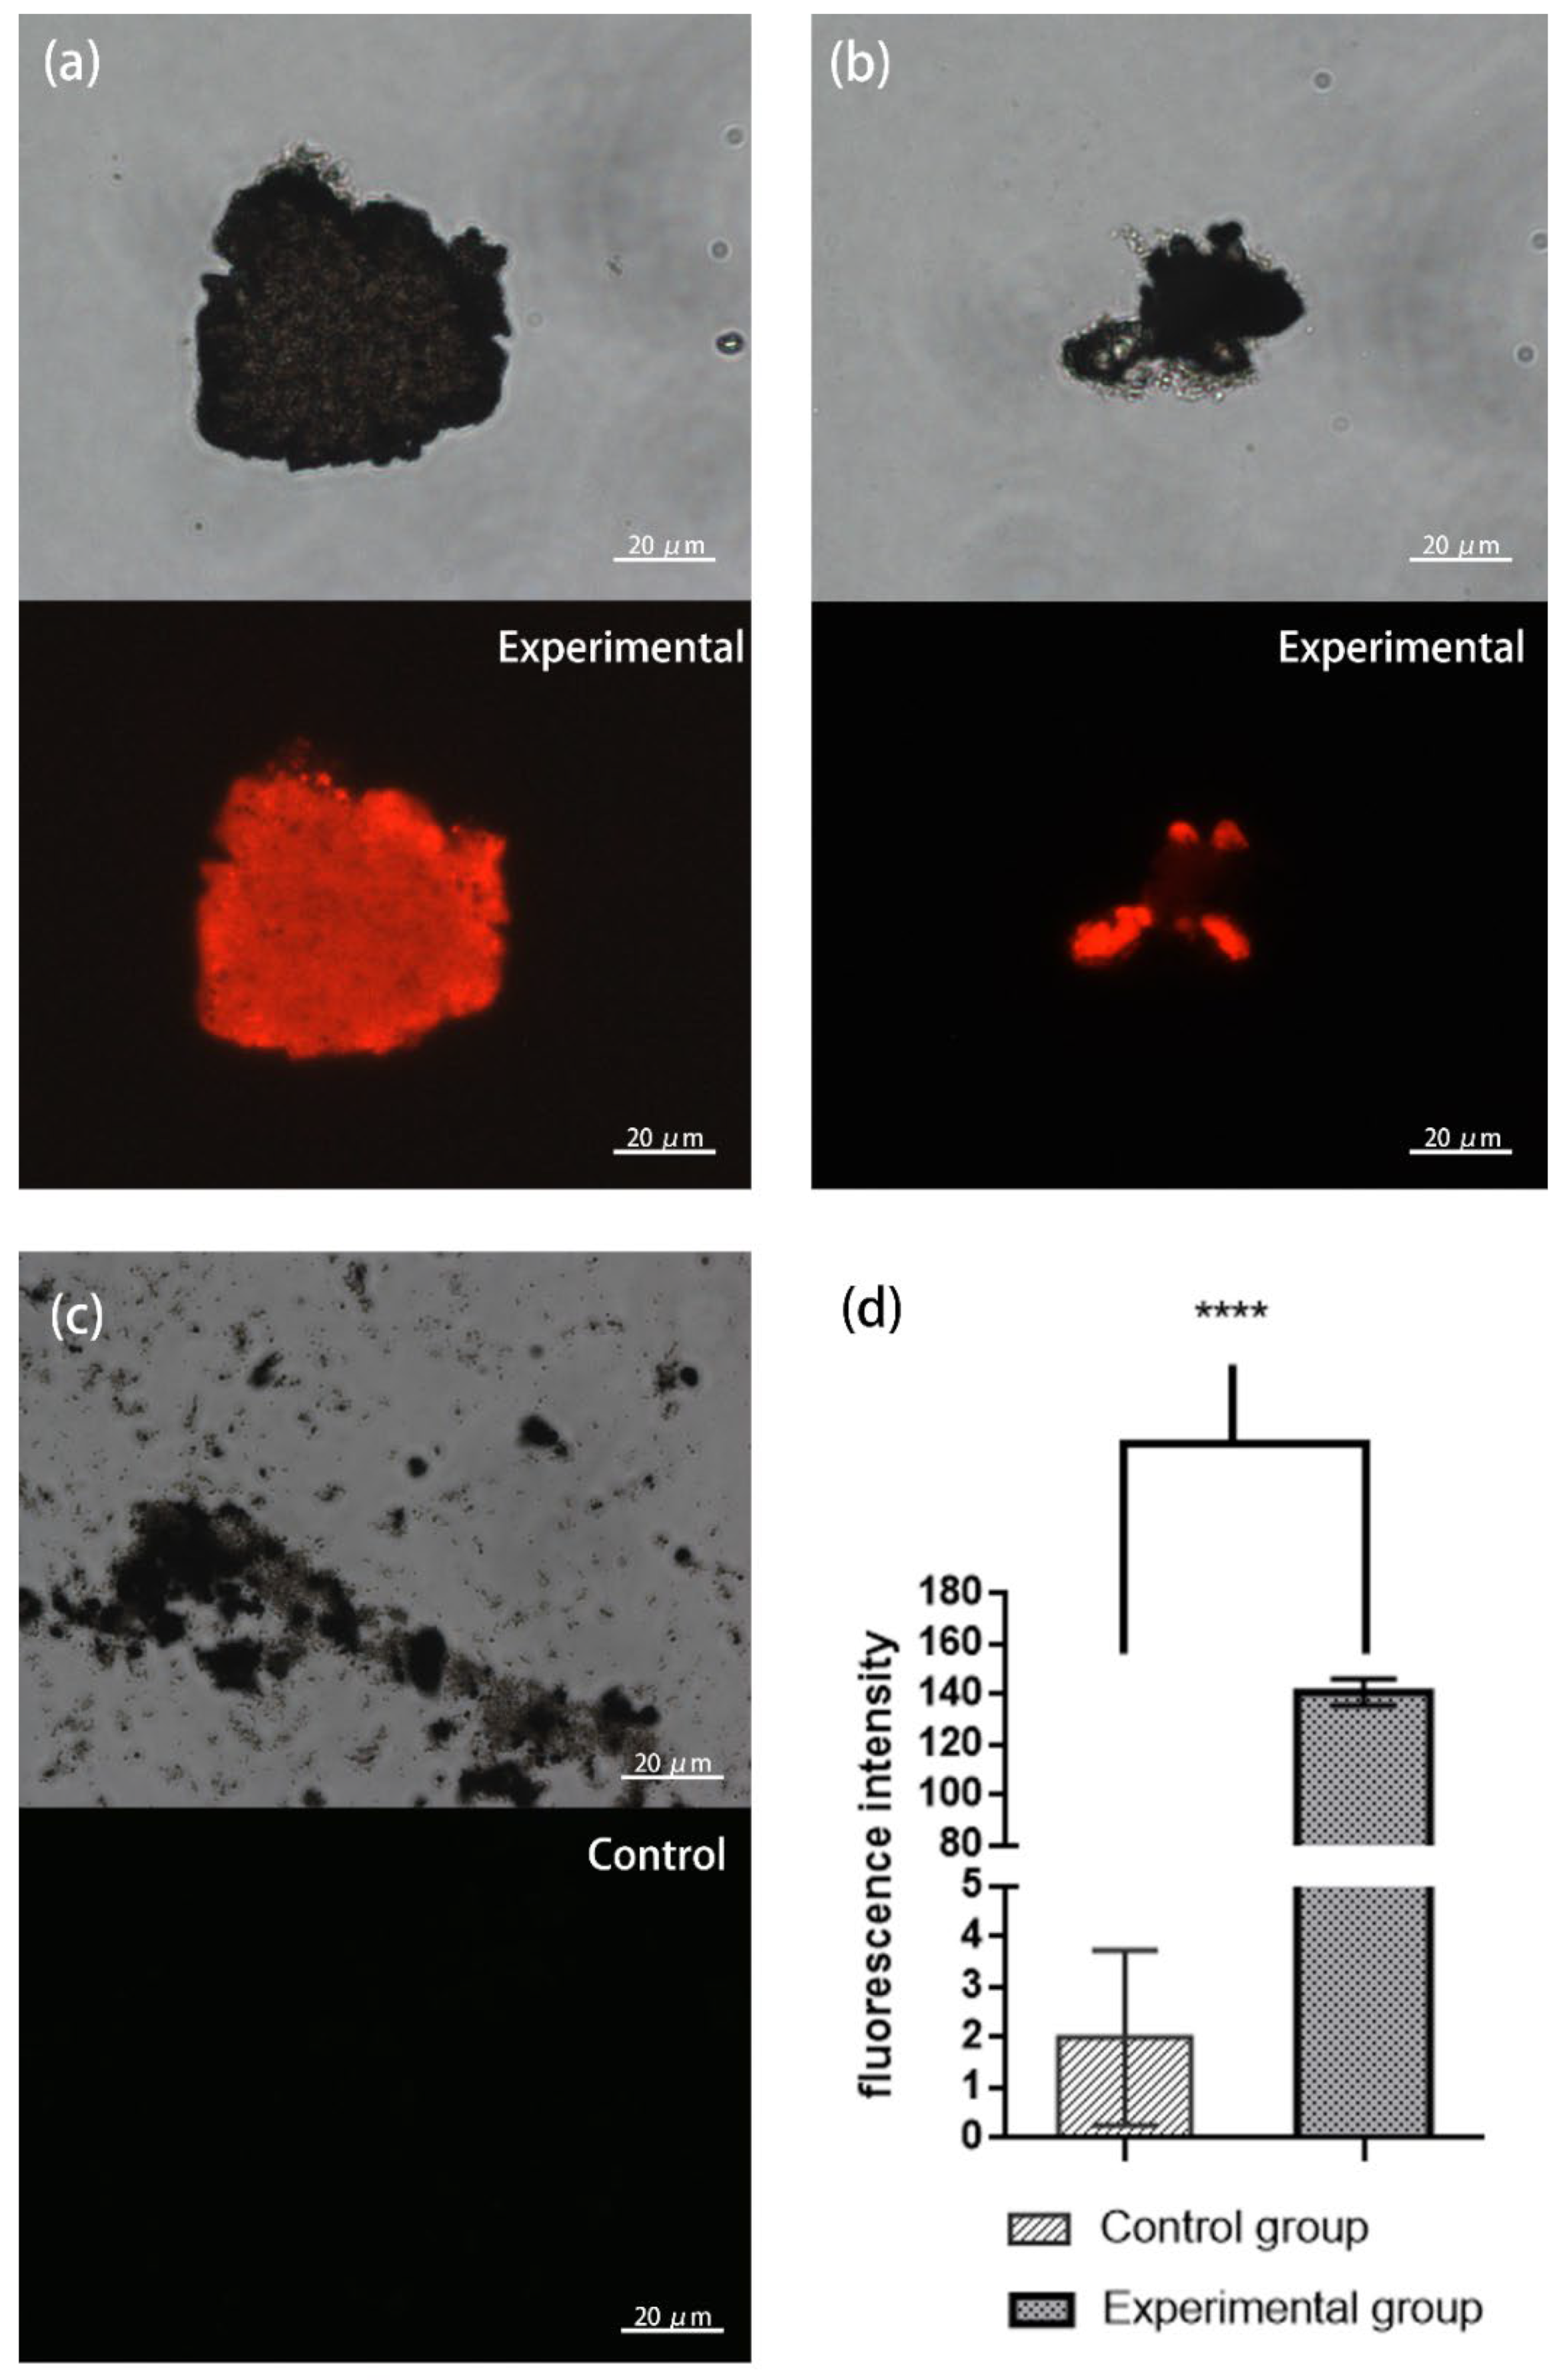
3.3. IMB Capture SARS-CoV-2 S-PS

The SARS-CoV-2 has a particle size of 100 nm, and each virus surface contains 24 ± 9 spike proteins [39]. In order to simulate the SARS-CoV-2, the S-PS selected red, fluorescent polystyrene beads with an average particle size of 100 nm. By calculating the amount of protein added, about 30 spike proteins were coupled to the surface of each microsphere. The calculation process is as follows:
The molecular weight of S protein was 60,000 g/mol; 1 mol of S protein contained 6.02 × 10²³ protein molecules; 1 μg of S protein contained about 1013 protein molecules. The number density of PS was 1.8 × 10¹²/mg. After conversion, if each PS was to be coated with about 30 S protein molecules, 5.4 μg of S protein needed to be coated per 1 mg PS.
For the IMB, after captured, the S-PS was placed under a fluorescence microscope for observation. As shown in Figure 5a,b, an obvious red fluorescence in the aggregation area of the magnetic beads can be observed in the experimental group, while the control group has no fluorescence (Figure 5b). The same result was obtained from the fluorescence value measured by the microplate reader (Figure 5c). The results lead to the conclusion that the SARS-CoV-2 S-PS was successfully captured by the IMB. The calculated result was that each 0.5 mg IMB could capture 37.3 μg of the SARS-CoV-2 S-PS, about 6.7 × 10¹¹.

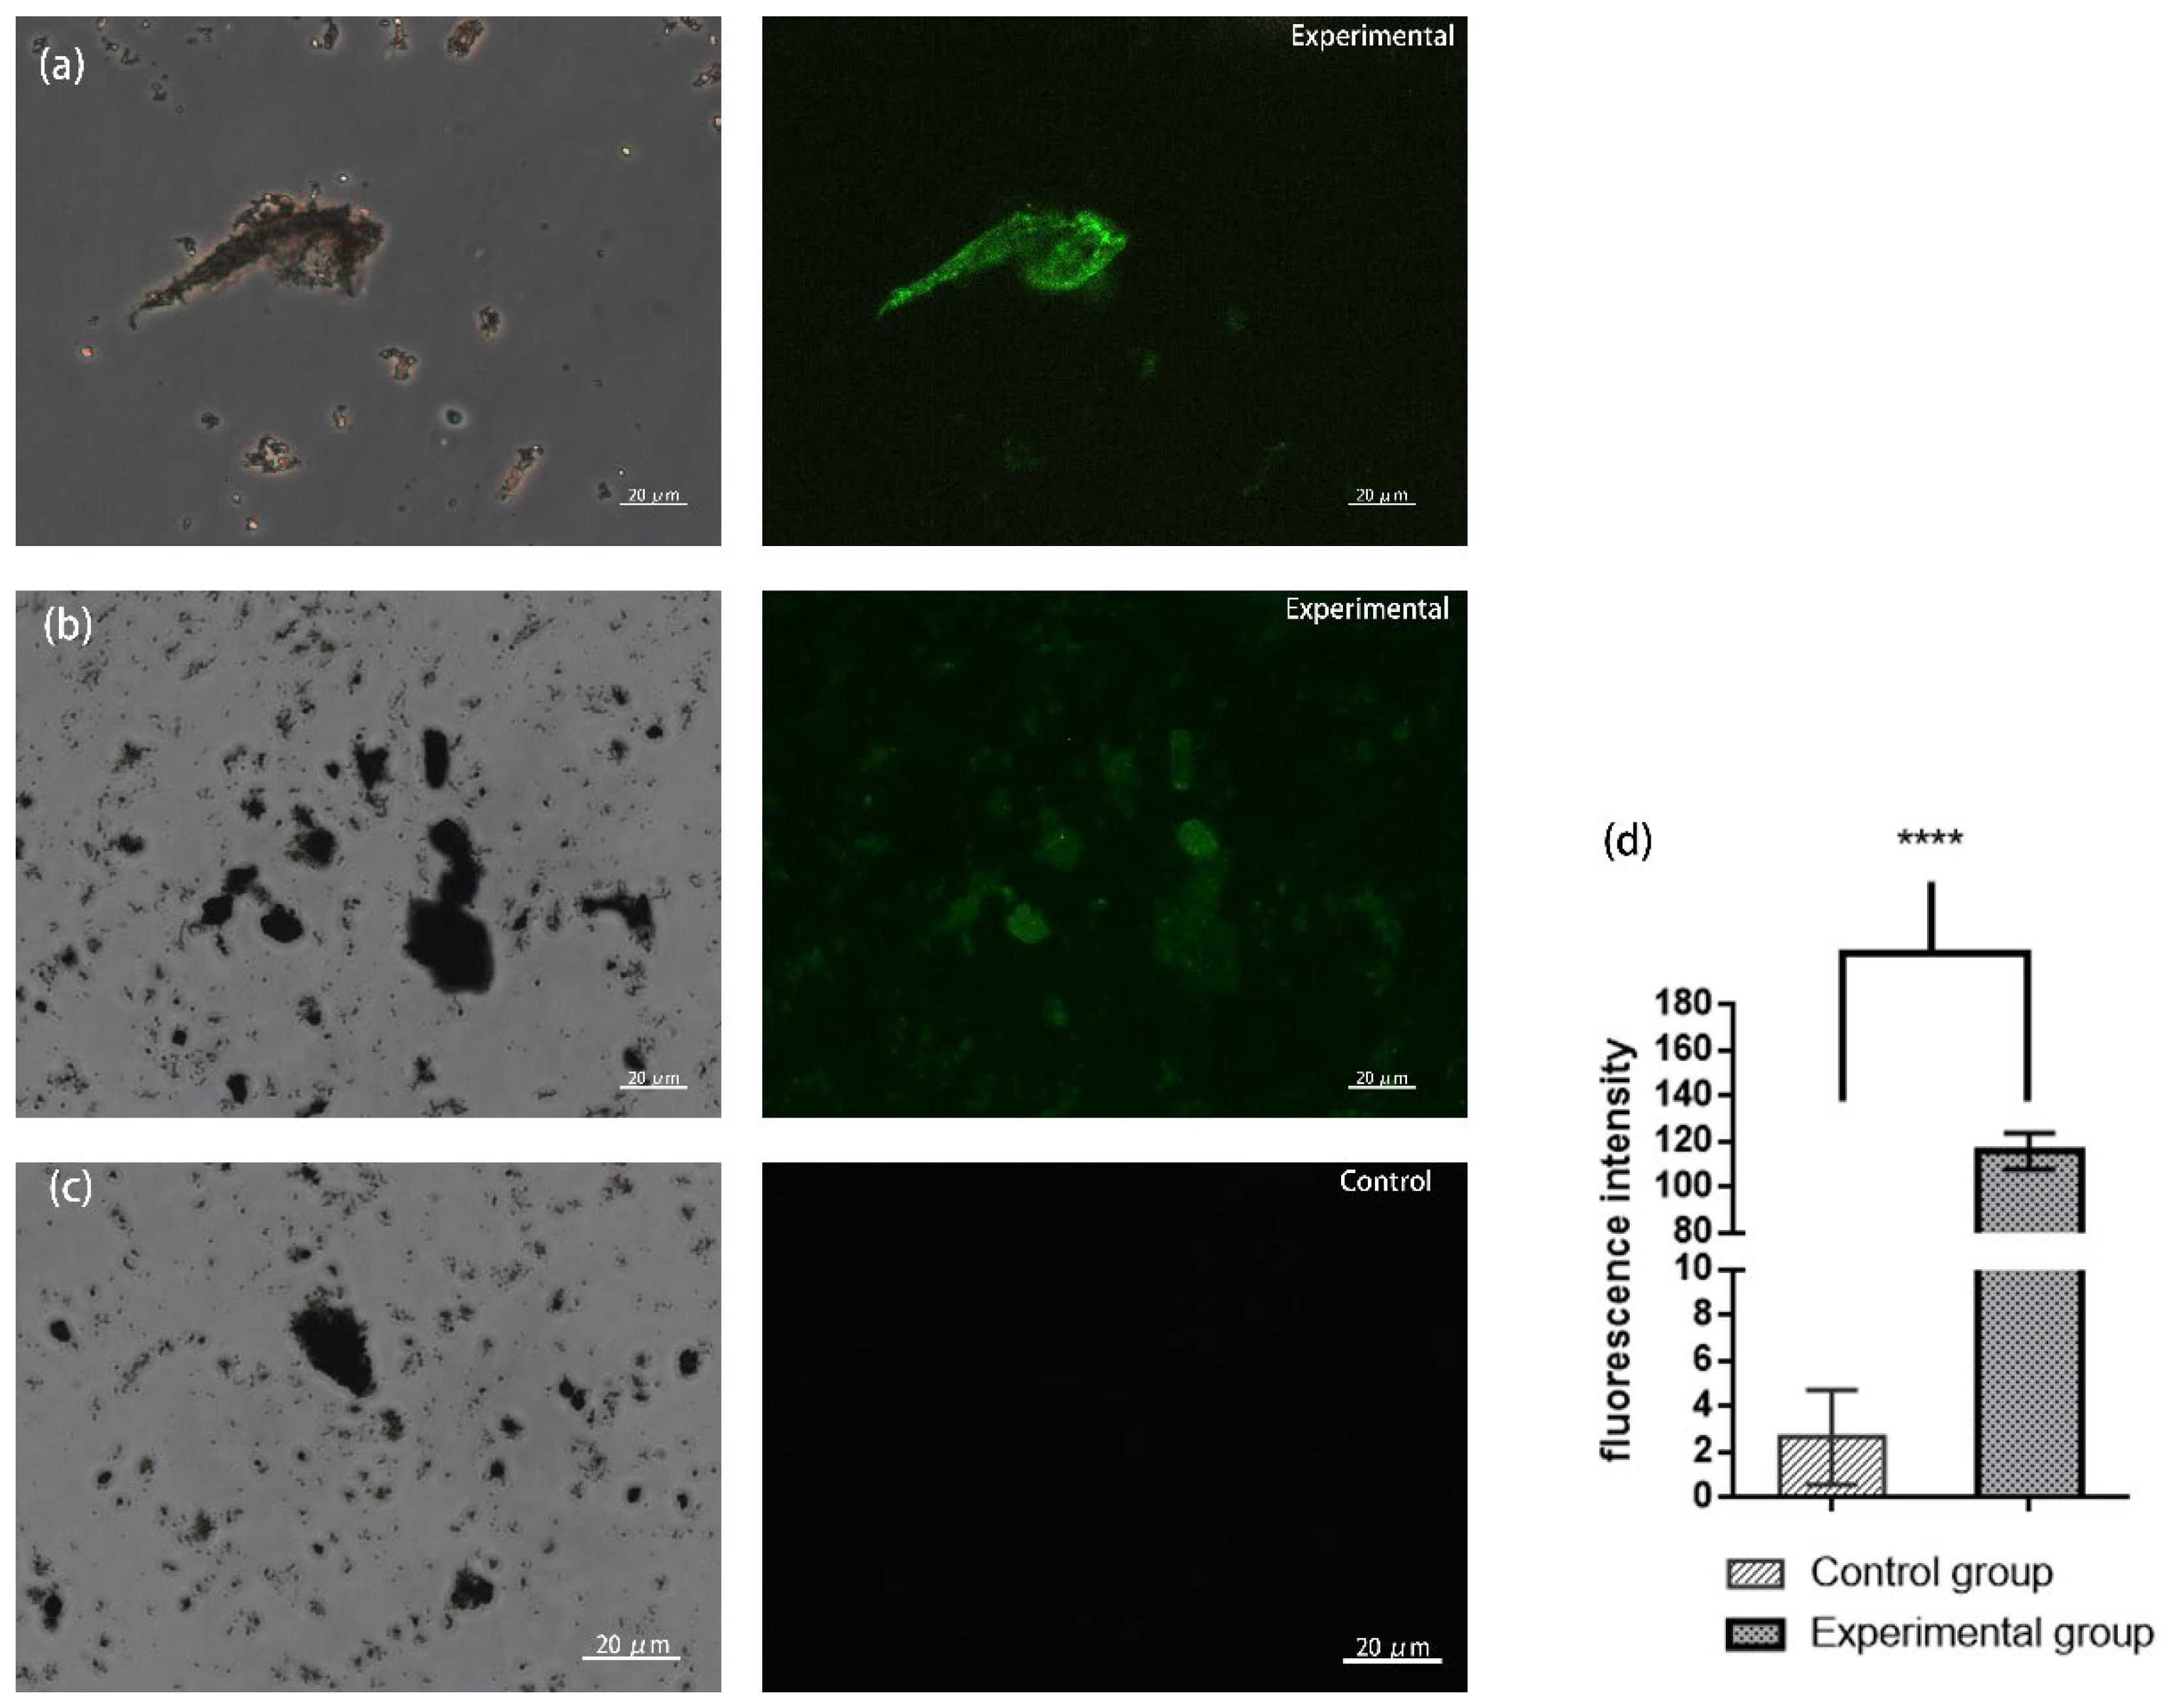
3.4. IMB Captures SARS-CoV-2 Pseudoviruses

The results of the IMB capture of the pseudoviruses were similar to the IMB capture of the S-PS. The fluorescence intensity detected by the microplate reader shows that the experimental group had obvious fluorescence, while the control group had no obvious fluorescence (Figure 6b). In the experimental group, one can also observe obvious fluorescence under the fluorescence microscope (Figure 6a), while the control group had no obvious fluorescence. Both results indicate that IMB successfully captured the SARS-CoV-2 pseudovirus specifically.

4. Conclusions

The GO@FeN-SAMBs for SARS-CoV-2 enrichment were successfully prepared. The surface of G@FeN-MB was successfully oxidized to graphene oxide by an improved Hummer method, which generates the carboxyl group and enhances the water solubility of the magnetic beads. The SAMBs were successfully prepared by coupling streptavidin to GO@FeN-MB, and the reaction conditions were optimized. Each mg of magnetic beads can be coupled with 60 μg of streptavidin, which is higher than other commercially available magnetic beads. The prepared SAMBs can be used for the separation of various biomolecules by adding different biotinylated aptamers to SAMBs. In our study, the IMB for separation of SARS-CoV-2 was prepared by combining biotinylated spike protein antibody with SAMBs. The SARS-CoV-2 S-PS was successfully prepared by coating the spike protein on the surface of fluorescent polystyrene beads and the preparation procedure was optimized. The prepared SARS-CoV-2 S-PS had a particle size of 100 nm, and each contained about 30 spike proteins, which was close to the SARS-CoV-2. The prepared IMB successfully captured the SARS-CoV-2 S-PS and pseudoviruses, which was confirmed by the results of microplate reader and fluorescence microscope. The results prove that our GO@FeN-MB can be used for virus sorting, and SAMBs prepared by G@FeN-MB with graphene as the shell material of magnetic beads can be used for the separation of various biological substances in the future, which has good application prospects.

Author Contributions

Conceptualization, M.W. and Q.W.; methodology, M.W.; software, J.L. (Jianxing Li); validation, X.Z., Z.M. and X.X.; formal analysis, J.L. (Jintao Li); investigation, M.W. and Y.Z.; resources, Q.W. and R.J.; data curation, J.L. (Jintao Li); writing—original draft preparation, J.L. (Jianxing Li); writing—review and editing, J.L. (Jianxing Li) and Z.M.; visualization, J.L. (Jianxing Li); supervision, M.W.; project administration, M.W. and Q.W.; funding acquisition, M.W. All authors have read and agreed to the published version of the manuscript.

Funding

The research was supported by the Beijing Natural Science Foundation (Grant No. M22032).

Institutional Review Board Statement

Not applicable.

Informed Consent Statement

Not applicable.

Conflicts of Interest

The authors declare no conflict of interest.

References

  1. Hui, D.S.; Azhar, E.I.; Madani, T.A.; Ntoumi, F.; Kock, R.; Dar, O.; Ippolito, G.; Mchugh, T.D.; Memish, Z.A.; Drosten, C.; et al. The continuing 2019-nCoV epidemic threat of novel coronaviruses to global health—The latest 2019 novel coronavirus outbreak in Wuhan, China. Int. J. Infect. Dis. 2020, 91, 264–266. [Google Scholar] [CrossRef] [PubMed] [Green Version]
  2. Kumar, S.; Rathi, B. Coronavirus disease COVID-19: A new threat to public health. Curr. Top. Med. Chem. 2020, 20, 599–600. [Google Scholar] [CrossRef] [PubMed]
  3. National Health Commission. COVID-19 diagnosis and treatment plan (trial version 7). Infect. Dis. Inf. 2020, 33, 26. [Google Scholar]
  4. Wang, D.; Hu, B.; Hu, C.; Zhu, F.; Liu, X.; Zhang, J.; Wang, B.; Xiang, H.; Cheng, Z.; Xiong, Y.; et al. Clinical characteristics of 138 hospitalized patients with 2019 novel coronavirus⁃infected pneumonia in Wuhan, China. JAMA 2020, 323, 1061–1069. [Google Scholar] [CrossRef]
  5. Tali, S.H.S.; LeBlanc, J.J.; Sadiq, Z.; Oyewunmi, O.D.; Camargo, C.; Nikpour, B.; Armanfard, N.; Sagan, S.M.; Jahanshahi-Anbuhi, S. Tools and Techniques for Severe Acute Respiratory Syndrome Coronavirus 2 (SARS-CoV-2)/COVID-19 Detection. Clin. Microbiol. Rev. 2021, 34, e00228-20. [Google Scholar] [CrossRef]
  6. Eileen, M. Validation of laboratory-developed molecular assays for infectious diseases. Clin. Microbiol. Rev. 2010, 23, 550–576. [Google Scholar]
  7. Weiyin, G.; Hong, Z.; Yang, L. False negative analysis and countermeasures in nucleic acid detection of novel coronavirus pneumonia. Int. J. Lab. Med. 2020, 41, 641–643. [Google Scholar]
  8. Naoya, K.; Naotaka, K. Analytical techniques for the determination of biologically active quinones in biological and environmental samples. J. Pharm. Biomed. Anal. 2014, 87, 261–270. [Google Scholar]
  9. Saito, Y.; Ueta, I.; Ogawa, M.; Hayashida, M.; Jinno, K. Miniaturized sample preparation needle: A versatile design for the rapid analysis of smoking-related compounds in hair and air samples. J. Pharm. Biomed. Anal. 2007, 44, 1–7. [Google Scholar] [CrossRef]
  10. Huang, Z.; Cui, X.; Xie, Q.Y.; Liu, D.F.; Lai, W.H. Short communication: A novel method using immunomagnetic separation with a fluorescent nanobeads lateral flow assay for the rapid detection of low-concentration Escherichia coliO157:H7 in raw milk. J. Dairy Sci. 2016, 99, 9581–9585. [Google Scholar] [CrossRef]
  11. Tekin, C.; Gijs, M. Ultrasensitive protein detection: A case for microfluidic magnetic bead-based assays. Lab. Chip 2013, 13, 4711–4759. [Google Scholar] [CrossRef] [PubMed]
  12. Hickstein, B.; Peuker, U.A. Characterization of protein capacity of nanocation exchanger particles as filling material for functional magnetic beads for bio-separation purposes. Biotechnol. Prog. 2008, 24, 409–416. [Google Scholar] [CrossRef] [PubMed]
  13. Huang, Z.; Peng, J.; Han, J.; Zhang, G.; Huang, Y.; Duan, M.; Liu, D.; Xiong, Y.; Xia, S.; Lai, W. A novel method based on fluorescent magnetic nanobeads for rapid detection of Escherichia coli O157:H7. Food Chem. 2019, 276, 333–341. [Google Scholar] [CrossRef] [PubMed]
  14. Huang, Z.; Hu, S.; Xiong, Y.; Wei, H.; Xu, H.; Duan, H.; Lai, W. Application and development of superparamagnetic nanoparticles in sample pretreatment and immunochromatographic assay. TrAC Trends Anal. Chem. 2019, 114, 151–170. [Google Scholar] [CrossRef]
  15. Seo, S.M.; Cho, I.H.; Jeon, J.W.; Cho, H.K.; Oh, E.G.; Yu, H.S.; Shin, S.B.; Lee, H.J.; Paek, S.H. An ELISA-on-a-chip biosensor system coupled with immunomagnetic separation for the detection of vibrio parahaemolyticus within a single working day. J. Food Prot. 2010, 73, 1466–1473. [Google Scholar] [CrossRef]
  16. Sturbaum, G.D.; Klonicki, P.T.; Marshall, M.M.; Jost, B.H.; Clay, B.L.; Sterling, C.R. Immunomagnetic separation (IMS)-fluorescent antibody detection and IMS-PCR detection of seeded Cryptosporidium parvum oocysts in natural waters and their limitations. Appl. Environ. Microb. 2002, 68, 2991–2996. [Google Scholar] [CrossRef] [Green Version]
  17. Reidt, U.; Geisberger, B.; Heller, C.; Friedberger, A. Automated immunomagnetic processing and separation of Legionella pneumophila with manual detection by sandwich ELISA and PCR amplification of the ompS gene. J. Lab. Autom. 2011, 16, 157–164. [Google Scholar] [CrossRef] [Green Version]
  18. Yang, W.; Gu, A.Z.; Zeng, S.Y.; Li, D.; He, M.; Shi, H.C. Development of a combined immunomagnetic separation and quantitative reverse transcription-PCR assay for sensitive detection of infectious rotavirus in water samples. J. Microbiol. Methods 2011, 84, 447–453. [Google Scholar] [CrossRef]
  19. Fu, Z.; Rogelj, S.; Kieft, T.L. Rapid detection of Escherichia coli O157:H7 by immunomagnetic separation and real-time PCR. Int. J. Food Microbiol. 2005, 99, 47–57. [Google Scholar] [CrossRef]
  20. He, J.; Huang, M.; Wang, D.; Zhang, Z.; Li, G. Magnetic separation techniques in sample preparation for biological analysis: A review. J. Pharm. Biomed. Anal. 2014, 101, 84–101. [Google Scholar] [CrossRef]
  21. Johnson, D.; Carter, M.D.; Crow, B.S.; Isenberg, S.L.; Graham, L.A.; Erol, H.A.; Watson, C.M.; Pantazides, B.G.; van der Schans, M.J.; Langenberg, J.P.; et al. Quantitation of ortho-cresyl phosphate adducts to butyrylcholinesterase in human serum by immunomagnetic-UHPLC-MS/MS. J. Mass Spectrom. 2015, 50, 683–692. [Google Scholar] [CrossRef] [PubMed] [Green Version]
  22. Wei, B.; Jin, X.; Wang, Q.; Li, Y.; Khan, W.Q. Synthesis of carbon coated iron nitride nanoparticles by using microwave plasma technique. Mater. Res. 2020, 7, 096103. [Google Scholar] [CrossRef]
  23. Ghosal, K.; Sarkar, K. Biomedical Applications of Graphene Nanomaterials and Beyond. ACS Biomater. Sci. Eng. 2018, 4, 2653–2703. [Google Scholar] [CrossRef] [PubMed]
  24. Meyer, J.C.; Geim, A.K.; Katsnelson, M.I.; Novoselov, K.S.; Booth, T.J.; Roth, S. The structure of suspended graphene sheets. Nature 2007, 446, 60–63. [Google Scholar] [CrossRef] [PubMed]
  25. Mu, E.F.; Gopinath, S.C.B. Feasibility of graphene in biomedical applications. Biomed. Pharmacother. 2017, 94, 354–361. [Google Scholar]
  26. Liu, K.; Zhang, J.J.; Cheng, F.F.; Zheng, T.T.; Wang, C.; Zhu, J.J. Green and facile synthesis of highly biocompatible graphene nanosheets and its application for cellular imaging and drug delivery. Mater. Chem. 2011, 21, 12034–12040. [Google Scholar] [CrossRef]
  27. Wang, J. Electrochemical glucose biosensors. Chem. Rev. 2008, 108, 814–825. [Google Scholar] [CrossRef]
  28. Sarkar, K.; Madras, G.; Chatterjee, K. Dendron conjugation to graphene oxide using click chemistry for efficient gene delivery. RSC Adv. 2015, 62, 50196–50211. [Google Scholar] [CrossRef] [Green Version]
  29. Pham, X.H.; Baek, A.; Kim, T.H.; Lee, S.H.; Rho, W.Y.; Chung, W.J.; Kim, D.E.; Jun, B.H. Graphene oxide conjugated magnetic beads for RNA extraction. Chem. Asian J. 2017, 12, 1883–1888. [Google Scholar] [CrossRef]
  30. Liang, T.; Li, J.; Liu, X.; Ma, Z.; Su, X.; Meng, X.; Zhanghuang, Z.; Wang, H.; Li, J.; Wang, Q.; et al. Preparation of CD3 Antibody-Conjugated, Graphene Oxide Coated Iron Nitride Magnetic Beads and Its Preliminary Application in T Cell Separation. Magnetochemistry 2021, 7, 58. [Google Scholar] [CrossRef]
  31. Bamrungsap, S.; Shukoor, M.I.; Chen, T.; Sefah, K.; Tan, W. Detection of lysozyme magnetic relaxation switches based on Aptamer-Functionalized superparamagnetic nanoparticles. Anal. Chem. 2011, 83, 7795–7799. [Google Scholar] [CrossRef] [PubMed] [Green Version]
  32. Singh, M.; Gupta, P.; Baronia, R.; Singh, P.; Karuppiah, S.; Shankar, R.; Dwivedi, P.D.; Singh, S.P. In vitro cytotoxicity of GO-DOx on FaDu squamous carcinoma cell lines. Int. J. Nanomed. 2018, 13, 107–111. [Google Scholar] [CrossRef] [PubMed] [Green Version]
  33. Li, R.; Guiney, L.M.; Chang, C.H.; Mansukhani, N.D.; Ji, Z.; Wang, X.; Liao, Y.P.; Jiang, W.; Sun, B.; Hersam, M.C.; et al. Surface Oxidation of Graphene Oxide Determines Membrane Damage, Lipid Peroxidation, and Cytotoxicity in Macrophages in a Pulmonary Toxicity Model. ACS Nano 2018, 12, 1390–1402. [Google Scholar] [CrossRef] [PubMed]
  34. Kudin, K.N.; Ozbas, B.; Schniepp, H.C.; Prud’Homme, R.K.; Aksay, I.A.; Car, R. Raman spectra of graphite oxide and functionalized graphene sheets. Nano Lett. 2008, 8, 36–41. [Google Scholar] [CrossRef]
  35. Nyakiti, L.O.; Myers-Ward, R.L.; Wheeler, V.D.; Imhoff, E.A.; Bezares, F.J.; Chun, H.; Caldwell, J.D.; Friedman, A.L.; Matis, B.R.; Baldwin, J.W.; et al. Bilayer graphene grown on 4H-SiC (0001) step-free mesas. Nano Lett. 2012, 12, 1749–1756. [Google Scholar] [CrossRef] [PubMed]
  36. Cançado, L.G.; Takai, K.; Enoki, T.; Endo, M.; Kim, Y.A.; Mizusaki, H.; Pimenta, M.A. General equation for the determination of the crystallite size La of nanographite by Raman spectroscopy. Appl. Phys. Lett. 2006, 88, 163106-1–163106-3. [Google Scholar] [CrossRef]
  37. Mohiuddin, T.M.G.; Lombardo, A.; Nair, R.R.; Bonetti, A.; Savini, G.; Jalil, R.; Ferrari, A.C. Uniaxial strain in graphene by Raman spectroscopy: G peak splitting, Grüneisen parameters, and sample orientation. Phys. Rev. B 2009, 79, 205433. [Google Scholar] [CrossRef]
  38. Ferrari, A.C.; Meyer, J.C.; Scardaci, V. Raman spectrum of graphene and graphene layers. Phys. Rev. Lett. 2006, 97, 187401. [Google Scholar] [CrossRef] [Green Version]
  39. Zunlon, K.; Joaquin, O.; Kun, Q. Structures and distributions of SARS-CoV-2 spike proteins on intact virions. Nature 2020, 588, 498–502. [Google Scholar]
Scheme 1. Main workflow of SAMB and IMB Preparation.
Magnetochemistry 08 00041 sch001
Scheme 2. Separation of SARS-CoV-2 pseudovirus/S-PS by IMB.
Magnetochemistry 08 00041 sch002
Figure 1. (a,c,e,g,i,k) Transmission electron microscopy of GO@FeN-MB; (b,d,f,h,j,l) Transmission electron microscopy of G@FeN-MB.
Magnetochemistry 08 00041 g001
Figure 2. Oxidation effect comparison chart: (a) Histogram of diameter size distribution of GO@FeN-MB and G@FeN-MB; (b) Photos of GO@FeN-MB and G@FeN-MB.
Magnetochemistry 08 00041 g002
Figure 3. The oxidation effect of G@FeN-MB: (a) X-ray photoelectron spectroscopy analysis of GO@FeN-MB and G@FeN-MB; (b) FTIR of G@FeN-MB, GO@FeN-MB, SAMBs and streptavidin; (c) Raman spectra of GO@FeN-MB and G@FeN-MB.
Magnetochemistry 08 00041 g003
Figure 4. Conjugation effect of streptavidin: (a) Discounted graph of the relationship between the amount of SA coupling and the amount of SA added; (b) The elution amount of SA (*** p < 0.001); (c) FTIR of G@FeN-MB, GO@FeN-MB, SAMBs, and streptavidin.
Magnetochemistry 08 00041 g004
Figure 5. IMB after capturing the SARS-CoV-2 S-PS: (a,b) fluorescence microscope photos of the experimental group; (c) fluorescence microscope photos of the control group; (d) fluorescence intensity of experimental group and control group measured by microplate reader (**** p < 0.001).
Magnetochemistry 08 00041 g005
Figure 6. IMB after capturing the pseudoviruses: (a,b) fluorescence microscope photos of the experimental group; (c) fluorescence microscope photos of the control group; (d) fluorescence intensity of experimental group and control group measured by microplate reader (**** p < 0.001).
Magnetochemistry 08 00041 g006
Publisher’s Note: MDPI stays neutral with regard to jurisdictional claims in published maps and institutional affiliations.

