
Grid-Scale Battery Energy Storage for Arbitrage Purposes: A Colombian Case


Department of Electric and Electronics Engineering, Universidad Nacional de Colombia, Bogotá 111321, Colombia
*
Author to whom correspondence should be addressed.
†
These authors contributed equally to this work.
Batteries 2021, 7(3), 59; https://0-doi-org.brum.beds.ac.uk/10.3390/batteries7030059
Submission received: 22 June 2021
/
Revised: 24 July 2021
/
Accepted: 5 August 2021
/
Published: 3 September 2021
Abstract
:This study seeks to determine a suitable arbitrage strategy that allows a battery energy storage system (BESS) owner to obtain the maximum economic benefits when participating in the Colombian electricity market. A comparison of different arbitration strategies from the literature, such as seasonal, statistical, and neural networks-based models, is performed. To determine BESS’s optimal operation, a Mixed Integer Linear Programming (MILP) optimization problem is formulated, including a battery degradation model based on an upper piecewise linear approximation method. A financial evaluation of the different arbitrage strategies is carried out, resulting, for all the analyzed cases, in a negative net present value (NPV); thus, the results show that the income obtained from BESS when only performing energy arbitrage in the Colombian market do not compensate the investment costs. Results have also shown that strategies based on statistical and prediction models have a better performance than seasonal strategies, especially in atypical circumstances such as COVID-19.
1. Introduction
According to information reported in 2020 by the U.S. Department of Energy, there are around 836 large-scale energy storage projects worldwide, with a nominal power capacity greater than 1 MW. Most of the projects are based on electrochemical storage systems (46%), followed by pumping stations (42%) [1]. These systems’ installed capacity is expected to reach 1095 GW/2850 GWh in 2040, based on information reported by Bloomberg in [2]. This growth is because Energy Storage Systems (ESS) allows, among other benefits to the power systems, higher penetration of intermittent renewable generation, and the exponential reduction of their installation cost. In fact, between 2010 and 2018, the price of lithium-ion batteries was reduced by 85% [2]—a reduction that could be even greater, reaching prices of USD $62/kWh in 2030 [3].
ESS applications can be classified into: generation services, ancillary services, services to the electricity system, transmission and distribution, end-user services, and integration with renewable generation [4,5]. Based on the information presented in the database of the U.S. Department of Energy [1], the main application of ESS is arbitrage, with 24% of all large-scale projects (>1 MW), followed by the application of services for electric power generation (18%), integration with renewable sources (17%), and frequency regulation (12%).
Energy arbitrage based on ESS consists mainly of the purchase of energy during periods in which the price is low (charging the ESS), to later sell that energy when the price is higher (discharging the ESS), thus obtaining an economic benefit [4,5,6]. As a consequence, ESS can present benefits to the owner of the installation and to the system, as they are used to prevent high prices of electricity by supplying energy at points of high demand, which generally represent the points where the energy cost is higher [6,7].
For energy arbitrage, the discharge time, the system’s nominal capacity, and the price mismatch (between peak and valley prices) are fundamental factors for the sizing of the storage systems. Other elements to take into account in this application are the efficiency of the system and the operating costs, since they will determine the number of possible transactions, which will directly impact the economic balance of the system [5].
One of the most important elements when executing energy arbitrage is knowing the behavior that the market will have in the future to obtain the greatest amount of profits. This is a complex problem due to the number of variables that affect the behavior of the electrical system [8]. Commonly, energy markets work with a day-ahead structure, where the ideal operation is established one day before the system’s actual operation. Thus, the different agents participating in the market must establish the optimal operation in advance [9]. To guarantee an optimal operation for each of the agents, it is necessary to establish methodologies to forecast the market’s behavior and implement operational strategies.
To define an adequate energy arbitrage strategy, it is important to determine the energy price behavior that the system will have for the next day. In [9], a state of the art of the main models for price forecasting is presented, including multi-agent models, which seek to obtain the price forecast by simulating the offers of each of the participating agents; seasonal models, which are based on the periodicity of the market and the impact of important physical and economic events in their behavior; statistical models, which are based on econometric analysis of the market; and, finally, models based on computational intelligence, including neural network architectures and artificial intelligence, which combine elements of learning, evolution, and adaptation.
Papers like [10,11,12] use fundamental models to determine arbitrage strategies, considering the system’s seasonal behavior. In [10], a two-period model is used, where a purchase period and a sale period are defined based on the inelastic relationship between the energy demand of the system and its price. On the other hand, in [11,12], the authors present two arbitrage strategies; the first strategy, called Mirror arbitrage, takes the exact same day price data of the previous year to define the arbitrage strategy of the Battery Energy Storage System (BESS); the second strategy, called Back to back arbitrage, consists of taking price data from the same day but from the previous week.
Statistical models are commonly used to determine the behavior that the system will have on the next day [13,14,15]. In [16], probability distributions of each of the following 24 h are used as a method to determine the arbitrage strategy that maximizes the economic benefits that the BESS can have. Models like ARIMA and SARIMA are used in [15,17], respectively, to make a forecast of the energy price in arbitrage models. Other models based on a statistical categorization of prices (low, medium, and high prices) are also available in the literature, such as the one presented in [18].
Prediction models such as those presented in [8,19] show that hybrid models based on neural networks and reinforcement learning can offer, for some cases, better economic performance results than conventional models, depending on the simulation horizon, the market, and the application.
One of the most important factors when analyzing the behavior of BESS is the degradation in storage capacity. This factor will influence both the technical and economic viability of these types of projects [20]. Different models for cycle degradation are found in the literature. In [21,22,23], exponential models are presented; however, these degradation models can not be directly integrated into Mixed Integer Linear Programming (MILP) optimization problems. Papers such as [10,11,12,13,14,15,16] do not take into account the degradation of the battery, so the results do not reflect the cost associated with the replacement of batteries or the decrease in energy storage capacity. In order to approximate the BESS degradation, papers such as [17,18,20] assumed a fixed degradation rate, which does not adequately represent BESS degradation. This work proposes an integration between the BESS energy arbitrage model and an adequate BESS degradation model based on an upper piecewise linear approximation of the battery degradation behavior presented in [24].
In this paper, four energy arbitrage strategies, including Mirror arbitrage, Back to back arbitrage, and Statistical-based operation strategy, are applied to determine the strategy with the best performance for a BESS that would participate in the Colombian market. Furthermore, an adequate battery degradation model is included in a BESS energy arbitrage model. The main contributions of this paper can be summarized as follows:
- 1.
- An adequate battery degradation model, based on an upper piecewise linear approximation, is included in the arbitrage strategies to improve the robustness of the results.
- 2.
- A comparison of different arbitrage strategies for the Colombian electricity market to determine which is the most suitable.
- 3.
- An economic evaluation to determine the viability of installing BESS to perform energy arbitrage in the Colombian electricity market.
The paper is organized as follows: the mathematical formulation of the optimization problem, including BESS degradation, is presented in Section 2. The different case studies, based on different arbitrage strategies, are described in Section 3. Numerical results for the different arbitrage strategies and the financial viability are discussed in Section 4. Finally, concluding remarks are presented in Section 5.
2. Mathematical Model
The BESS energy arbitrage model is based on [8,14,15,20], where the objective is to maximize the profits that an energy storage system can obtain when buying and selling energy throughout the simulation horizon. The objective function and the constraints of the problem are described bellow.
2.1. Objective Function
As mentioned above, energy arbitrage consists of buying and selling energy at different time periods to get a profit. Consequently, the objective function of this problem seeks to maximize cash flow throughout the planning horizon, as presented in the following equation:
where t refers to the time periods, T refers to the entire simulation horizon, is the absolute time between time periods (e.g., one hour), is the energy price at time period t, and and correspond to the discharge/charge power to/from the system at time period t, respectively.
2.2. Constraints
Based on the technical characteristics of the ESS, and in order to obtain a model that resembles the real operation of the system, the following restrictions are established.
2.2.1. Charge Energy Limit
This restriction refers to the maximum energy that the BESS can buy from the system, which is defined as the difference between the system’s energy storage capacity () and the energy level () at time period 1, all of this divided by the BESS charge efficiency (), as presented in the following equation:
It is important to clarify that the BESS capacity () in the present model is not constant over time. This is because the degradation of the BESS capacity, due to its use, is modeled in the formulation. The degradation model used in the present formulation is presented later.
2.2.2. Discharge Energy Limit
This restriction enforces the limit of energy that can be sold to the system based on the energy storage capacity, the minimum state of charge , the energy level, and the efficiency:
Here, the , in p.u. values, represents the minimum remaining energy limit in the BESS defined by each manufacturer in order to preserve the integrity of the BESS.
2.2.3. Energy Capacity Limit
This constraint seeks to maintain the energy levels of the BESS within their maximum storage limits in order to preserve the integrity of batteries. For this, the , in p.u. values, is included and represents the maximum amount of energy that BESS can store. This constraint is defined as follows:
2.2.4. Power Capacity Limit
To guarantee a safe operation of BESS, it is necessary to limit the capacity of the power conversion system () based on the charge () and discharge () signals, as in the following equations:
2.2.5. Charge and Discharge Signal
The objective of this restriction is a way to avoid cases where BESS is charging and discharging at the same time period. This restriction can be formulated as follows:
2.2.6. Energy Balance
This restriction guarantees the energy balance in the BESS and is presented in the following equation:
2.3. BESS Degradation
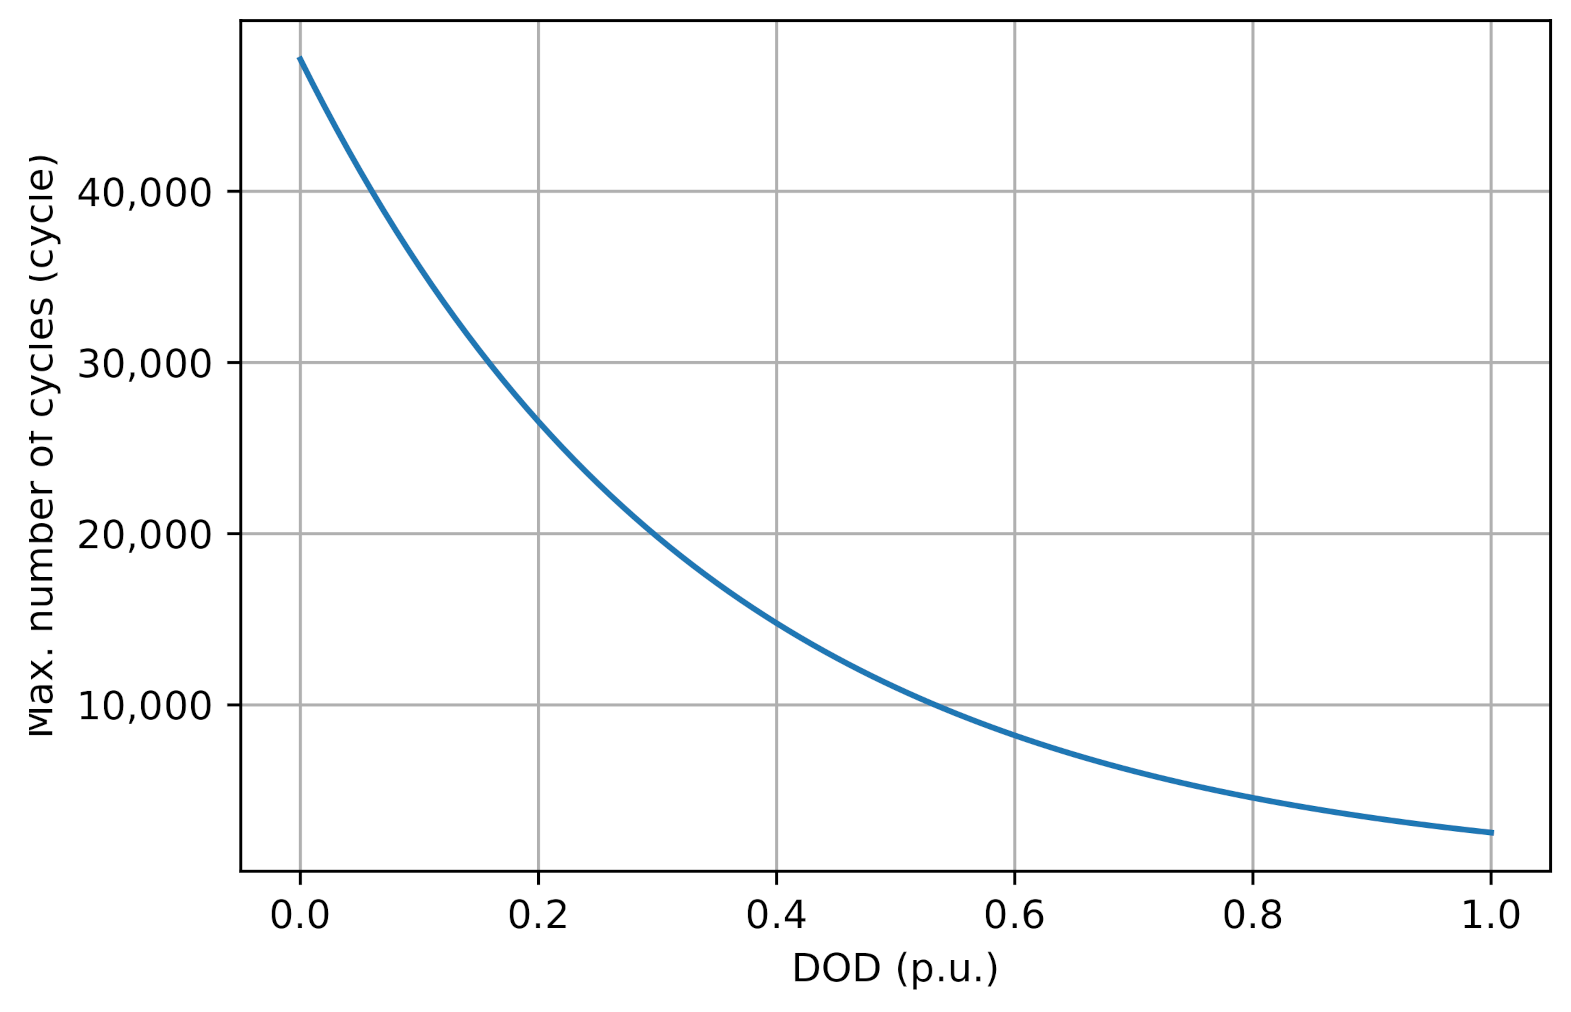
An important factor when studying BESS is the degradation of their capacity as they are used, or, in other words, the decrease in the capacity of BESS each time a charge and discharge cycle is performed. Deterioration of BESS is mainly caused by the wear of the electrolyte due to the stress generated by charge/discharge cycles. In addition, parameters such as temperature and depth of discharge can accelerate the degradation process [24]. For this reason, different models of battery degradation, based on DOD and maximum number of cycles, are available in the literature. For instance, in [21,22,23], exponential models of the form (where k can take values between 0.8 and 2.1, depending on the type of battery) are presented; this formulation seeks to approach the degradation process by degradation curves, such as the one in Figure 1.
However, the aforementioned degradation models are not linear, so they can not be directly integrated into Mixed Integer Linear Programming (MILP) optimization problems, like the energy arbitrage of BESS. To address that, the degradation curve is linearized using different methods such as the big M method [21,25] and the piecewise linear approximation method [26].
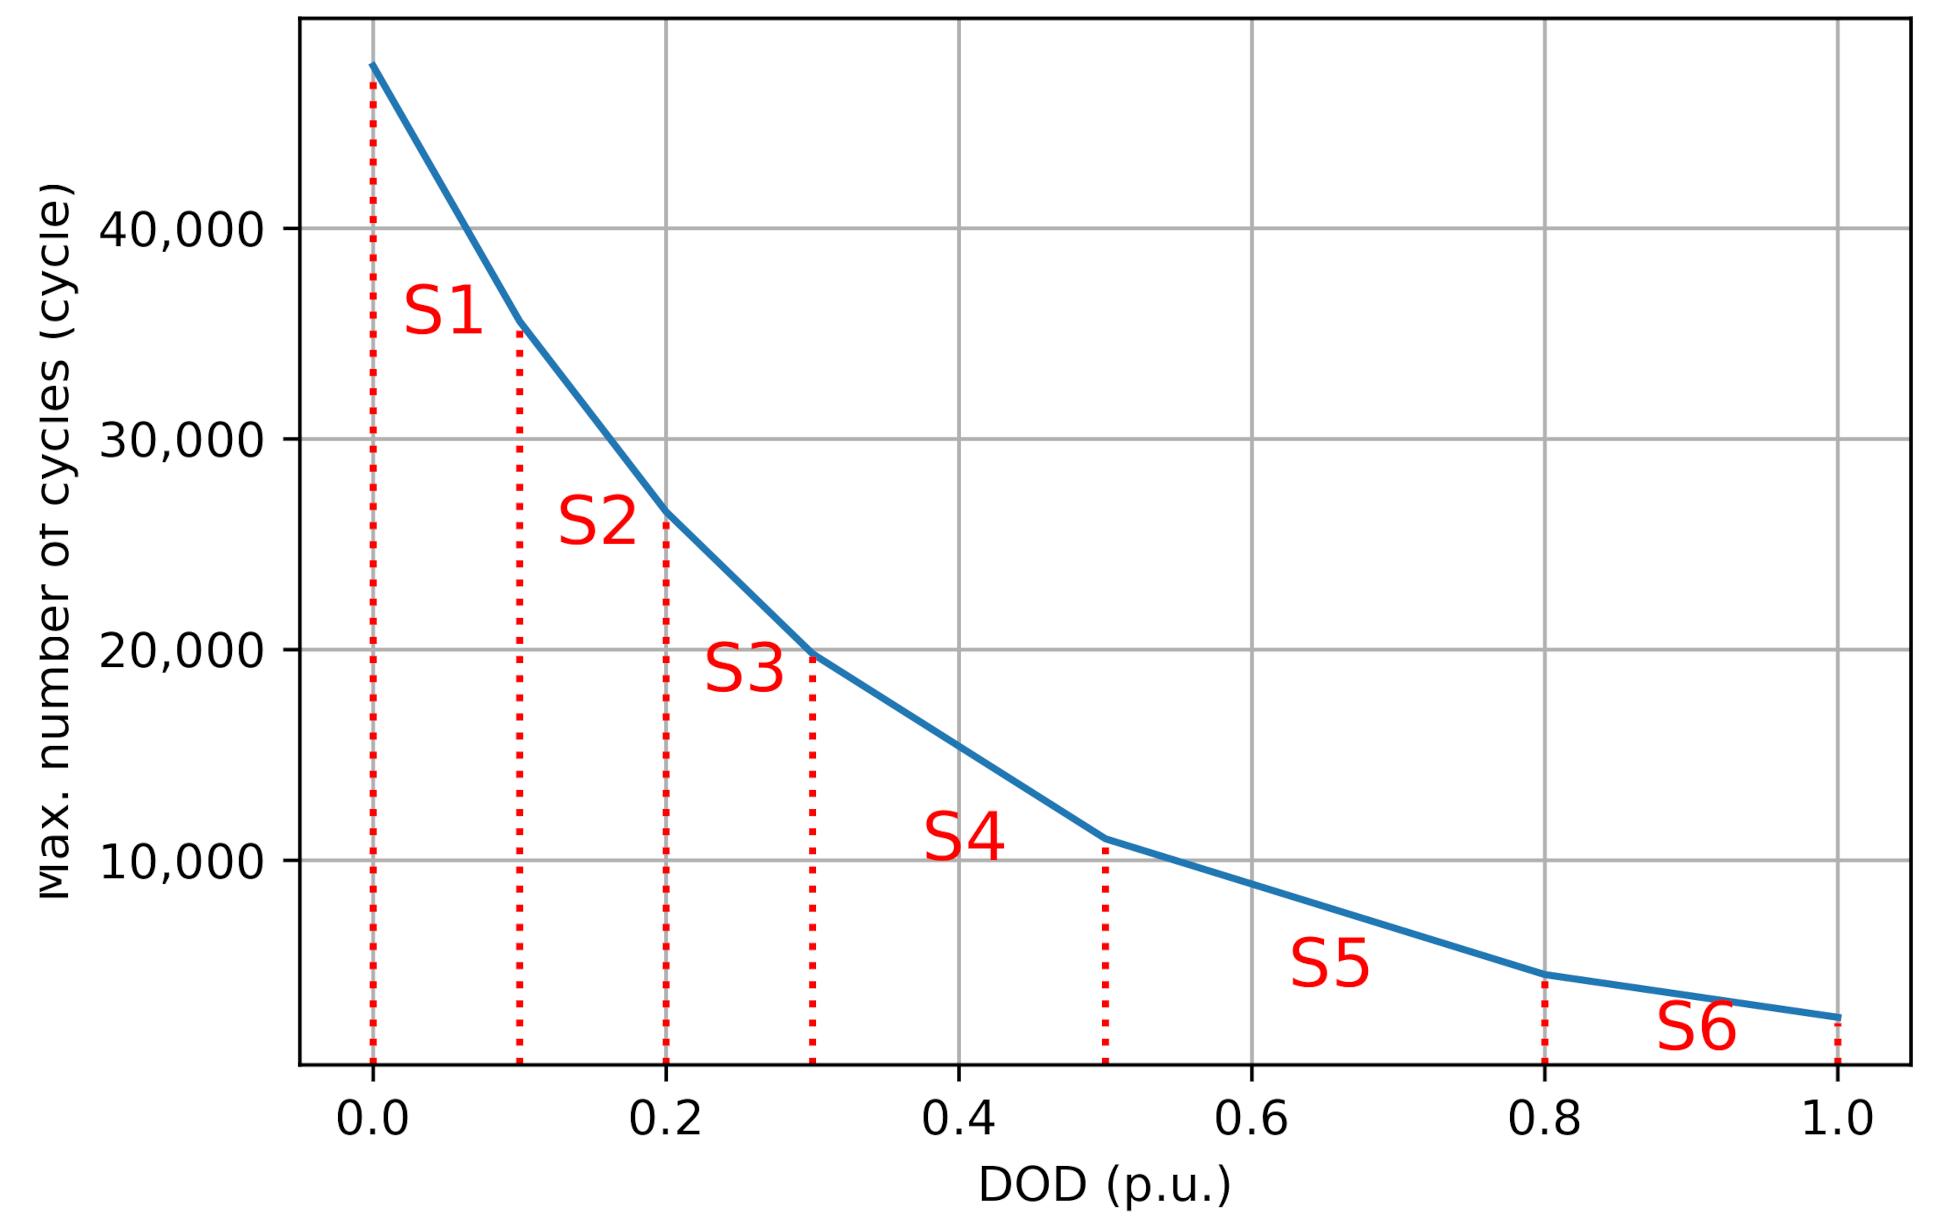
In this work, degradation is modeled using an upper piecewise linear approximation method. The degradation curve (Cicles vs DOD) is divided into six linear sections, as shown in Figure 2.
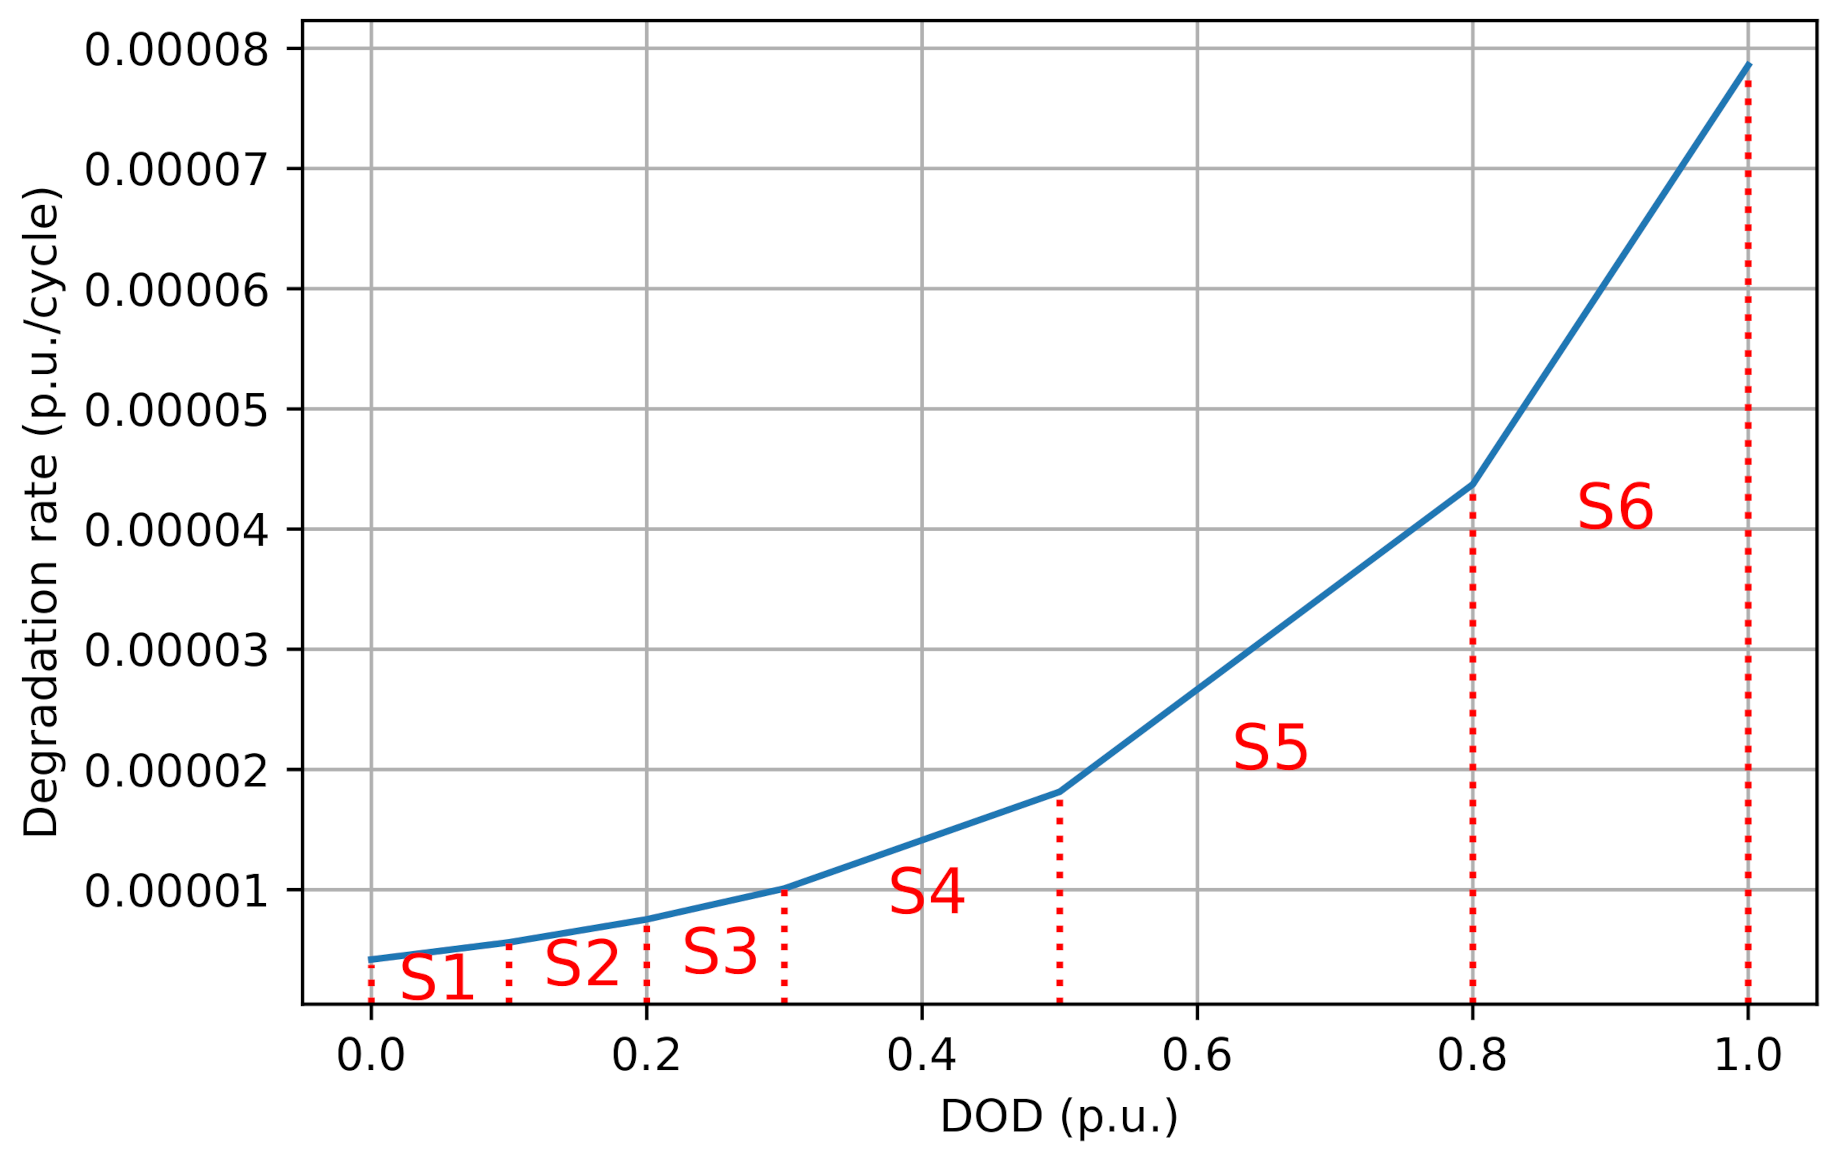
The values presented in Figure 2 are computed assuming that the BESS end of cycle life occurs when their nominal capacity is decreased by 20% [24]. Thus, the degradation rate can be determined as follows:
where is the degradation rate in (p.u./cycle) and is the maximum number of cycles at a specific DOD. Based on Equation (9), the degradation rate curve is obtained, as shown in Figure 3.
The segments of the curve shown in Figure 3 can be described as follows:
where represents the DOD in segment d at time period t, is the degradation rate value for an specific DOD in the segment d, is the slope of the segment d, and is the y-intercept point of the segment d. The following equation limits DOD to an specific segment:
where parameters and are the minimum and maximum values of DOD of each segment d, respectively. In order to include the BESS degradation within the optimization problem, it is necessary to add the following restrictions:
where is a binary variable indicating the segment to which the BESS discharge corresponds, and is the degradation rate at time period t. Equation (12) establishes the relationship between the power discharge and DOD. Equations (13)–(15) assign the total DOD, obtained with Equation (12), to a specific segment of the curve. Equation (16) determines the degradation rate at time period t. Finally, in Equation (17), the new capacity after degradation is calculated.
3. Case Studies
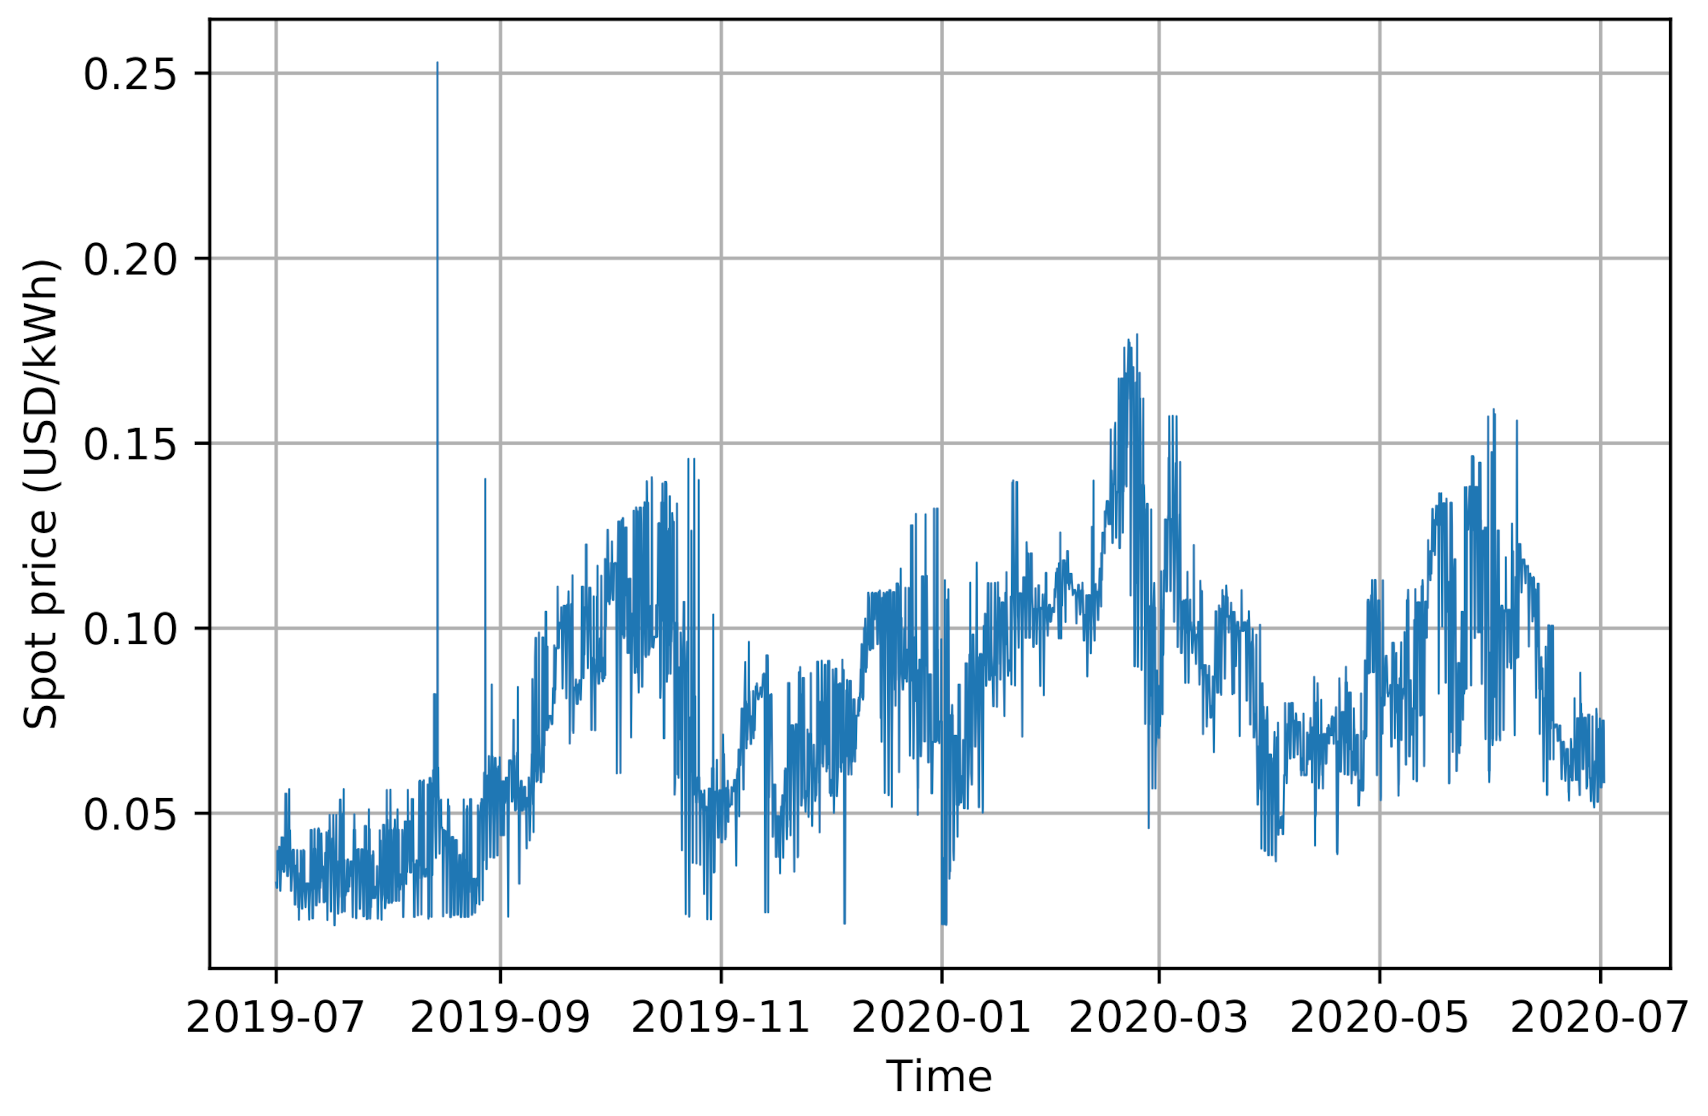
To evaluate the maximum economic benefit that a BESS would have using different arbitrage strategies in the Colombian electricity market, historical energy prices on the stock market for the period between 1 July 2019–1 July 2020 were considered, as shown in Figure 4. Simulations were carried out for a 100 MWh lithium-ion battery system with different power capacities, in the range from 10 to 100 MW (in steps of 10 MW), in order to determine the optimal C-rate, i.e., the relationship between power and energy capacity, of the BESS.
The technical characteristics of the BESS used for the evaluation of the model are presented in Table 1, and the BESS degradation curve used in this paper was presented in Figure 2. Regarding the economic characteristics, Table 2 shows the used economical parameters that were taken into account for the investment, operation, and maintenance costs of an ESS based on Li-ion batteries [27,28].
The following case studies were proposed to study the effect of different operating strategies in the incomes from BESS operation.
3.1. Optimal Case (Case A)
In this case, it is assumed that the prices of the entire simulation horizon (8760 h) are known—in other words, that a perfect energy price forecast is available. This theoretical case is used here as the “ideal” solution for comparison purposes.
3.2. Day-Ahead Forecast Case (Case B)
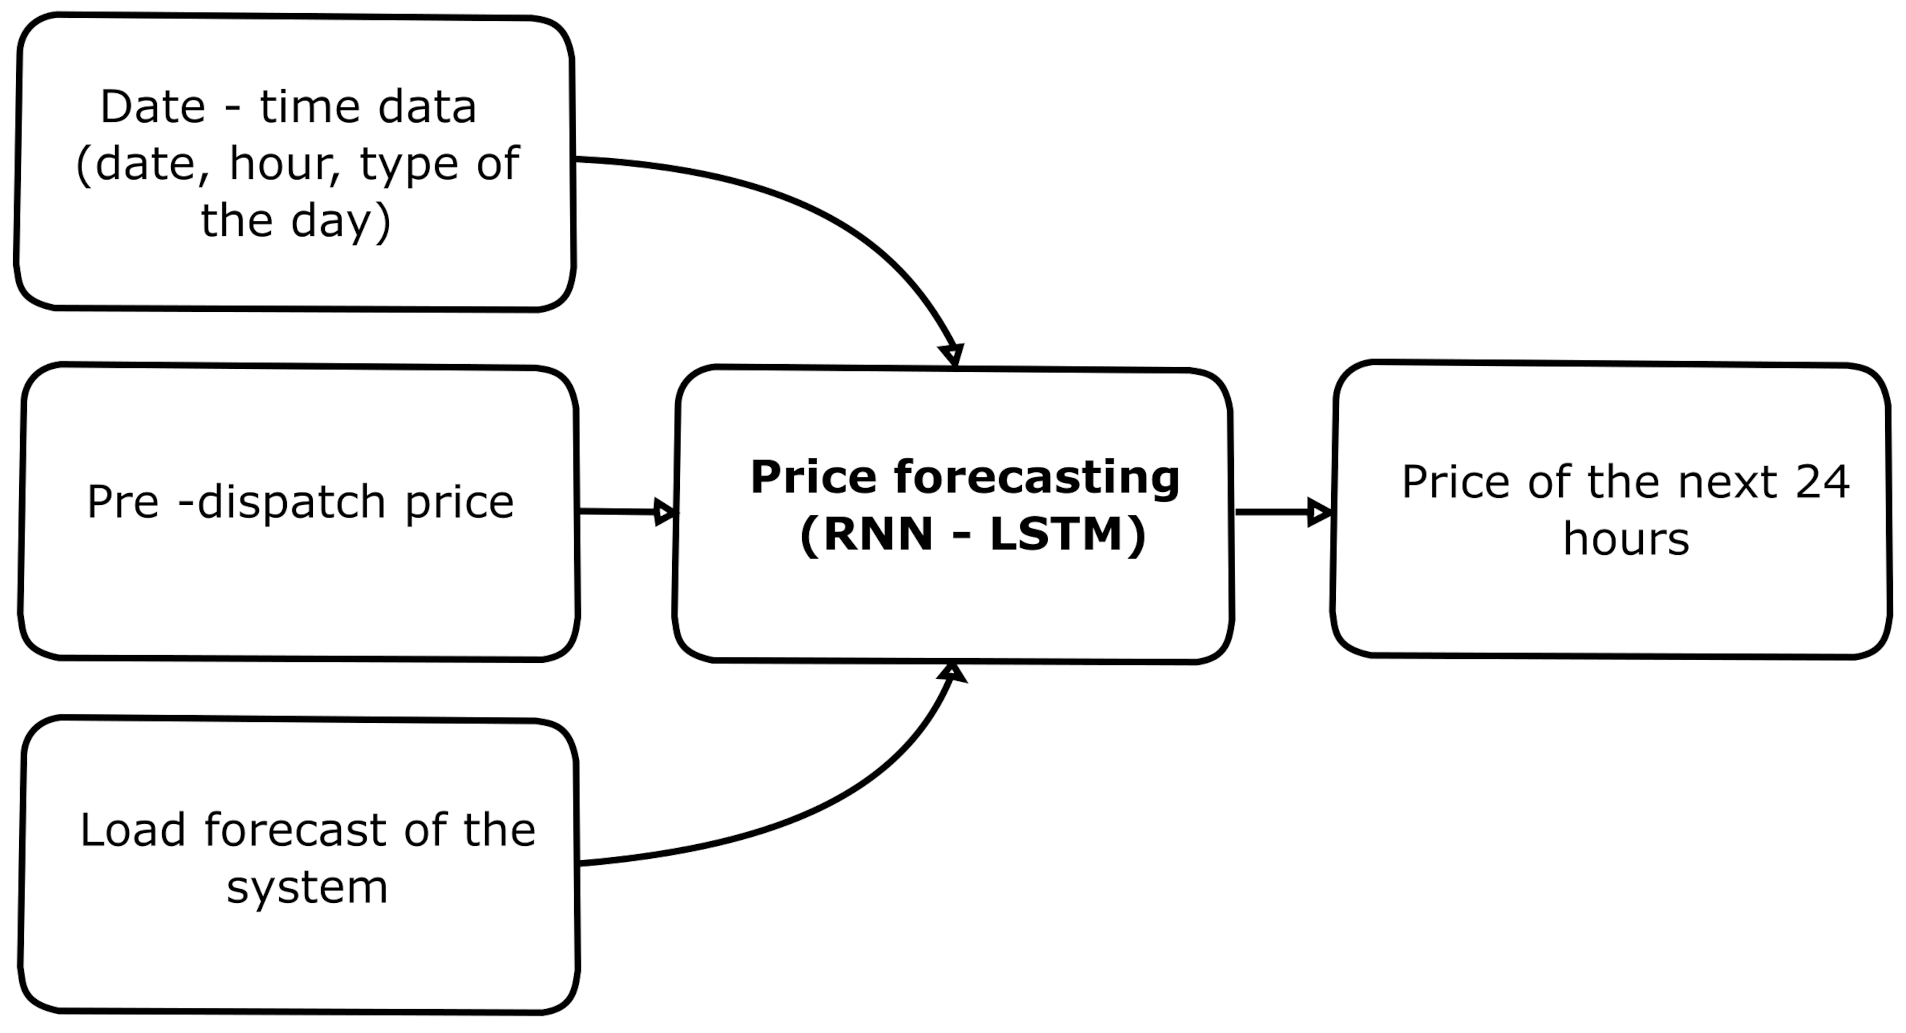
In this case, the arbitrage strategy is based on the day-ahead price forecast (with 1 h resolution). This price forecast is obtained from a Recurrent Neural Network (RNN) using a Long Short-Term Memory (LSTM) architecture. As in [8], the RNN was trained using the date-time data, the system load forecast, and the pre-dispatch price data of the previous day, as can be seen in Figure 5.
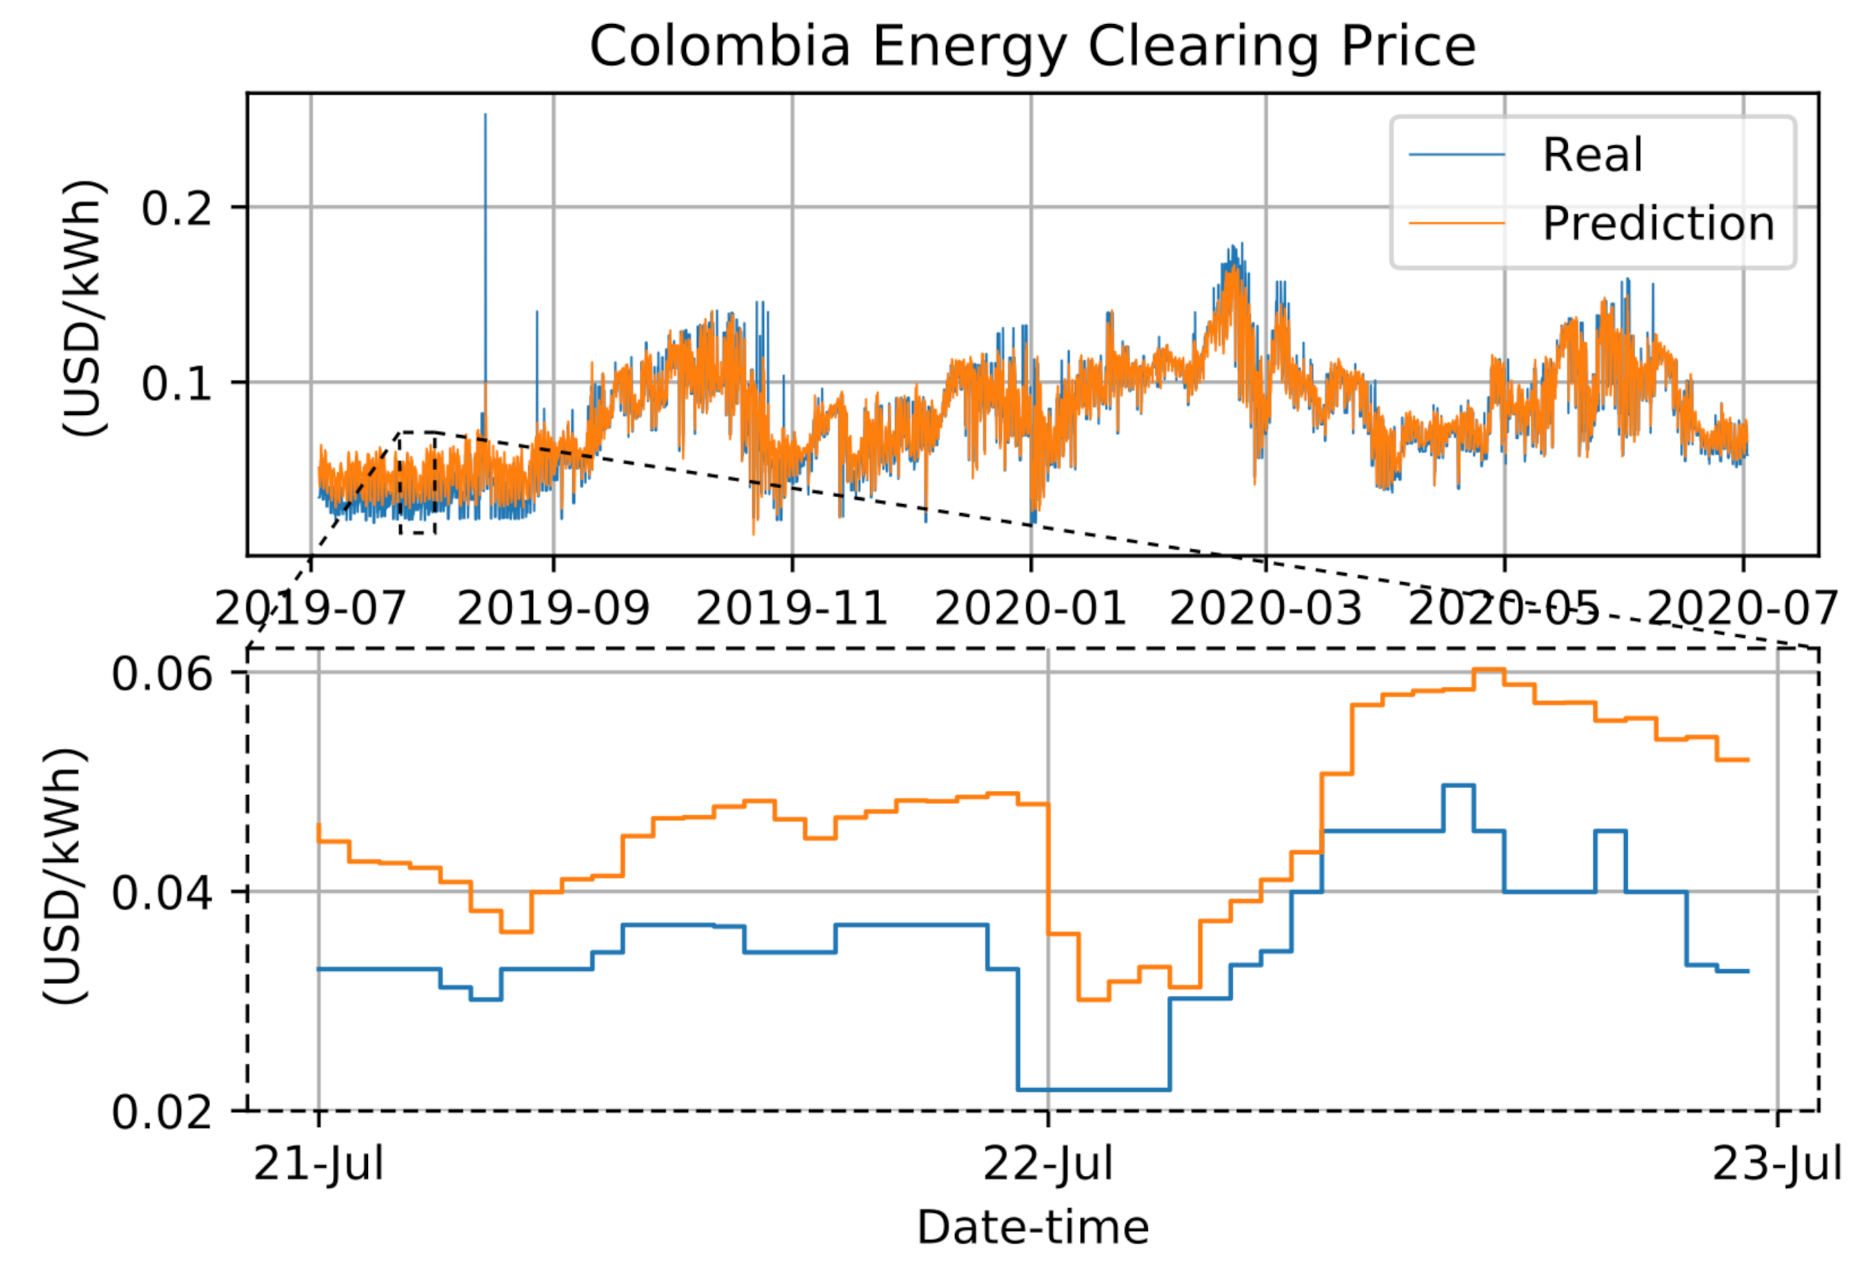
This arbitrage strategy limits the knowledge of prices to the next 24 h; however, in order to compare this case with the other case studies, the simulation was iteratively carried out until reaching a horizon of 365 days. The results of the price forecast during the entire simulation horizon can be seen in Figure 6, where the blue line is the actual price of energy and the orange line is the forecasted price. In general, it can be seen that the prediction gives a good approximation to the real behavior of the energy price; however, as can be seen in Figure 6, if you zoom in on these results, it is observed that the model does not predict adequately the lowest and highest prices. This is notorious in the case of peaks during the dates July 2019–September 2019, which are caused by extreme hydrologies at those times that affect the energy costs, due to the high dependence of the Colombian system on hydroelectric plants.
3.3. Mirror Arbitrage Case (Case C)
This arbitrage strategy is based on the seasonality of electricity prices, which indicates that the general behavior of prices will not change with respect to the previous year [12]. For this reason, the exact prices of the same day of the previous year, e.g., 1 July 2018 for 1 July 2019, was used in this case to determine the arbitrage strategy.
3.4. Back to Back Case (Case D)
As in the previous case, this strategy is based on the seasonality of electricity prices; however, in this case, the current price is equal to the one of the same day of the immediately preceding week, with the purpose of having arbitrage signals that are better tuned to the behavior of the system [12].
3.5. Statistical-Based Operating Strategy (Case E)
In this case, charge and discharge time hours are defined seeking that the BESS operate one cycle per day. These time hours are defined by a statistical analysis using the historical prices of each of the hours for the previous 30 days. For each of the hours (e.g., 0, 1, 2, …, 23), the second quartile is used to determine the average behavior of energy prices. Finally, the hours with the lower and higher prices are determined and used to establish the charge and discharge hours for the next day. Figure 7 shows an illustrative example of this strategy. From the analyzed data, the obtained charging hours are mainly between 2:00 a.m. and 4:00 a.m. and the discharging hours are mainly between 6:00 p.m. and 8:00 p.m.
4. Results and Analysis
4.1. Results
This section presents a comparison of the different operation strategies and BESS C-rates studied, in terms of total incomes (objective function presented in Equation (1)), BESS degradation, and Net Present Value (NPV).
Figure 8 summarizes the results obtained with respect to the total incomes for each one of the case studies. Note that, due to the difficulty of predicting the electricity price, all the studied strategies deviate considerably from the gains obtained in the optimal case. For most of the C-rates, cases B and E have the bigger incomes, while cases C and D present the poorest economic performance compared with the optimal case (case A).
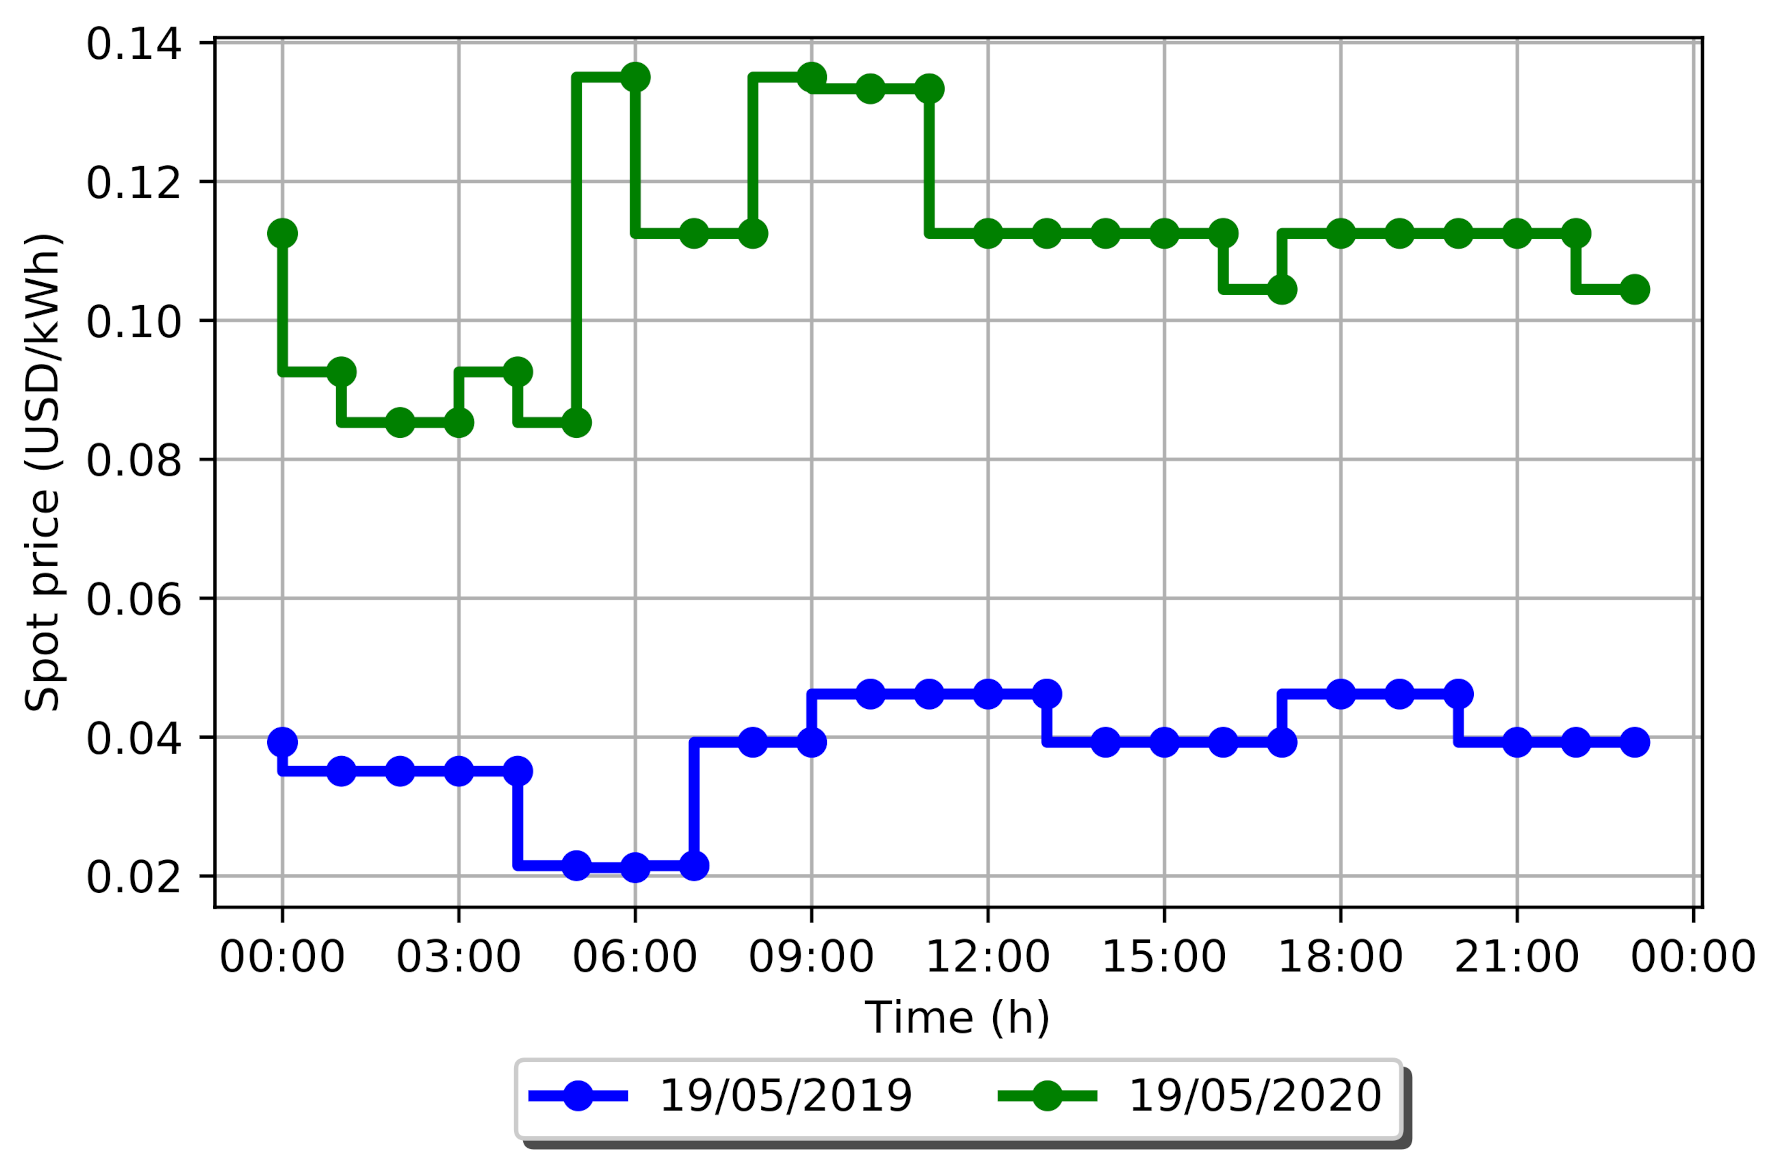
The aforementioned behavior is due to the fact that operation strategies in cases B and E are defined based on a greater amount and more updated information than in cases C and D. Thus, results allow for concluding that strategies based on seasonality, such as C and D, are not the most suitable for this type of application; in particular, the performance of strategy C was affected by non-seasonal factors such as COVID-19, which considerably changed electricity demand and prices in Colombia, from one year to the next, as shown in Figure 9.
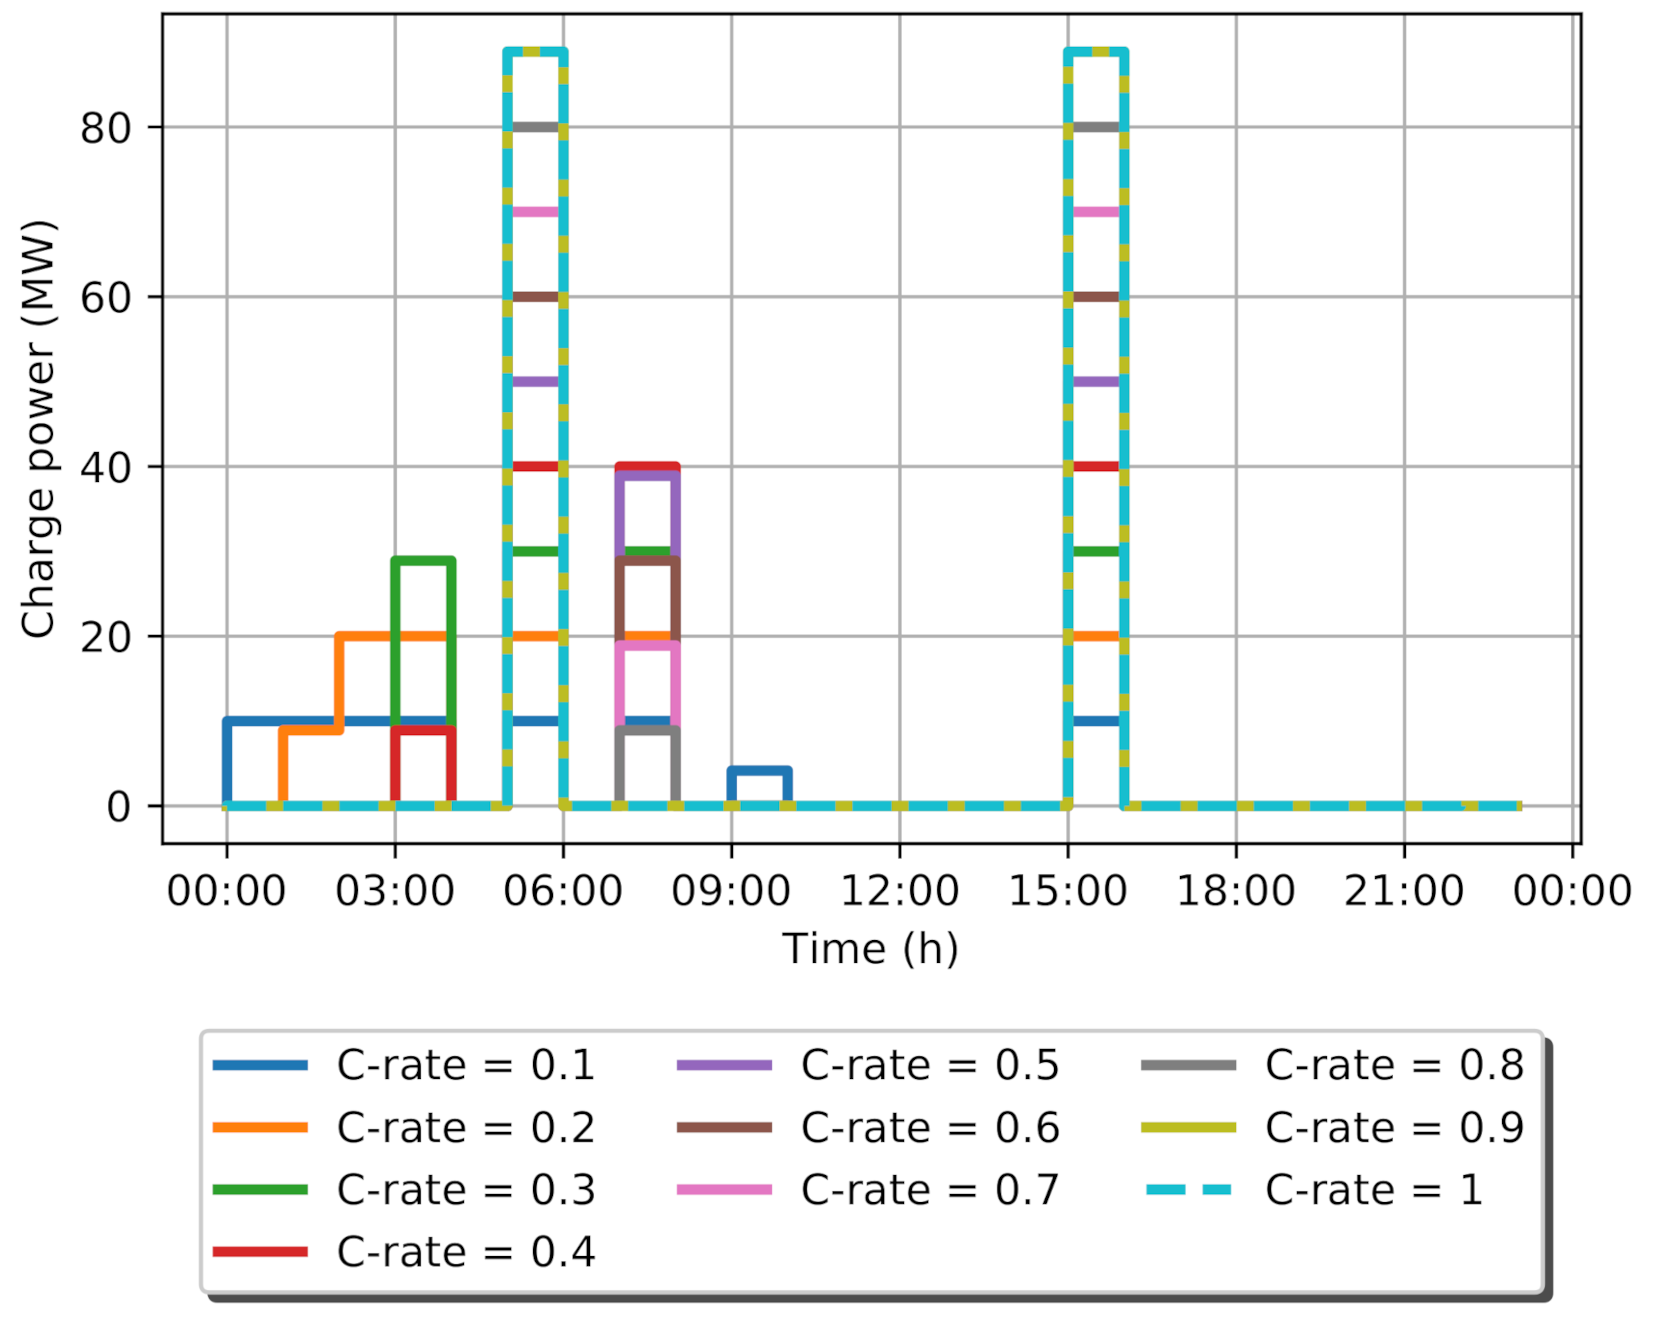
Another point to consider is the effect of C-rate on the total incomes of the different strategies. Note that, for cases A and E, there is a growth in total incomes as the C-rate increases due to a lower exposure to the market prices, since charging/discharging periods are shorter for BESS with high C-rates than for BESS with low c-rates, as shown in Figure 10.
However, note that, in cases C and D, an increase of the C-rate represents a decrease of the total incomes; this is probably due to the inability of these strategies to properly determine the optimal energy purchase/sale intervals, which in this case translates into greater economic losses as capacity increases. The main cause for this effect is the low accuracy of both strategies to properly define the hours for buying/selling energy, resulting in economic losses which will increase as the ability to transfer energy increases because of higher C-rates. It is important to note that, due to the minimum state of charge limit (0.2 p.u.) considered for the analysis, BESS with a C-rate greater than or equal to 0.8 do not differ much in their behavior.
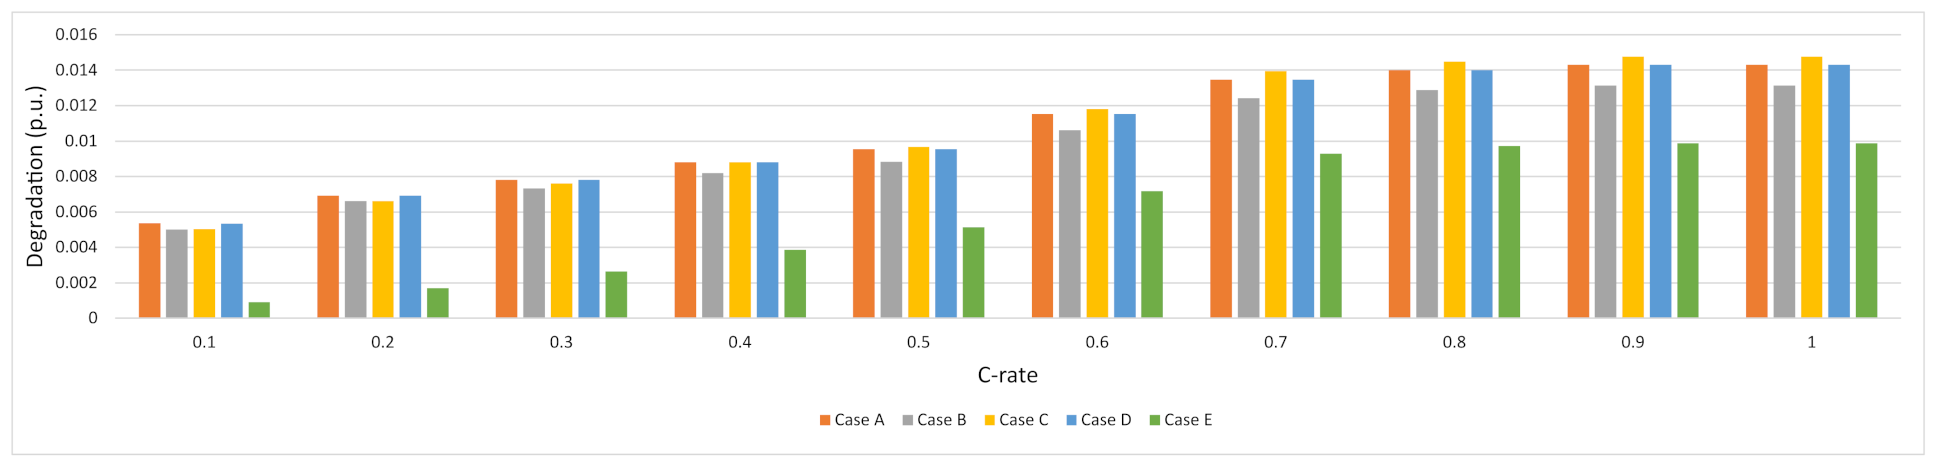
Figure 11 shows the BESS degradation for different operation strategies. All of them presented a very similar behavior, except for Case E, in which a significant reduction in the use of BESS, due to the imposed limitation of 1 cycle per day, results in less degradation. In the figure, it can also be observed that as the C-rate gets closer to 1 the degradation increases. This is because a greater C-rate implies a bigger DOD and therefore further degradation. Taking into account the degradation percentage as an element to measure the efficiency of the operation strategies, it can be determined that cases C and D present the lower efficiency, since, for a degradation percentage similar to the others cases, these strategies obtained lower incomes. On the other hand, Case E presents interesting results, since this has the lowest degradation and a good economic performance for most of the evaluated C-rates.
A fundamental part in the analysis of BESS projects is the economic evaluation. For this, different metrics are available, such as: installation costs, level cost of capacity, net present value of the useful life cost, and level cost of energy [29]. Here, net present value is used to evaluate the financial viability of the different case studies, taking an evaluation horizon of 15 years, as this is a typical useful life value for a BESS. In addition, it is assumed that the operating behavior of the BESS, which is found with the optimization process for the first year, will be the same for the subsequent years in the evaluation horizon.
The net present value method (NPV) considers all the expenses and incomes generated throughout the useful life of the project. The following equation represents the net present value for a BESS project:
where is the capital cost of BESS, is the operation and maintenance cost in year n, is the replacement cost of the batteries, is the total net profit obtained in year n, N refers to the number of years of evaluation, and r is the discount rate with which the project is evaluated, assumed here as 10% [27]. Capital cost of BESS comprises batteries cost, power conversion system cost, engineering costs, licenses, permits, among other costs. Here, the capital cost is computed with the values presented in Table 2. On the other hand, operation and maintenance costs are subject to how much the BESS is used; in this case, this is a variable cost depending on the energy traded, as established in the following equation:
where is the variable cost of operation and maintenance (assumed here to be 0.30 (USD/MWh)), and and are the total energy trade in the charge and discharge process in the year of simulation, respectively. Finally, the cost of replacing batteries is assumed as a proportional factor to the percentage of annual degradation obtained for each strategy. In addition, it is assumed that the cost of batteries is constant over the analyzed period.
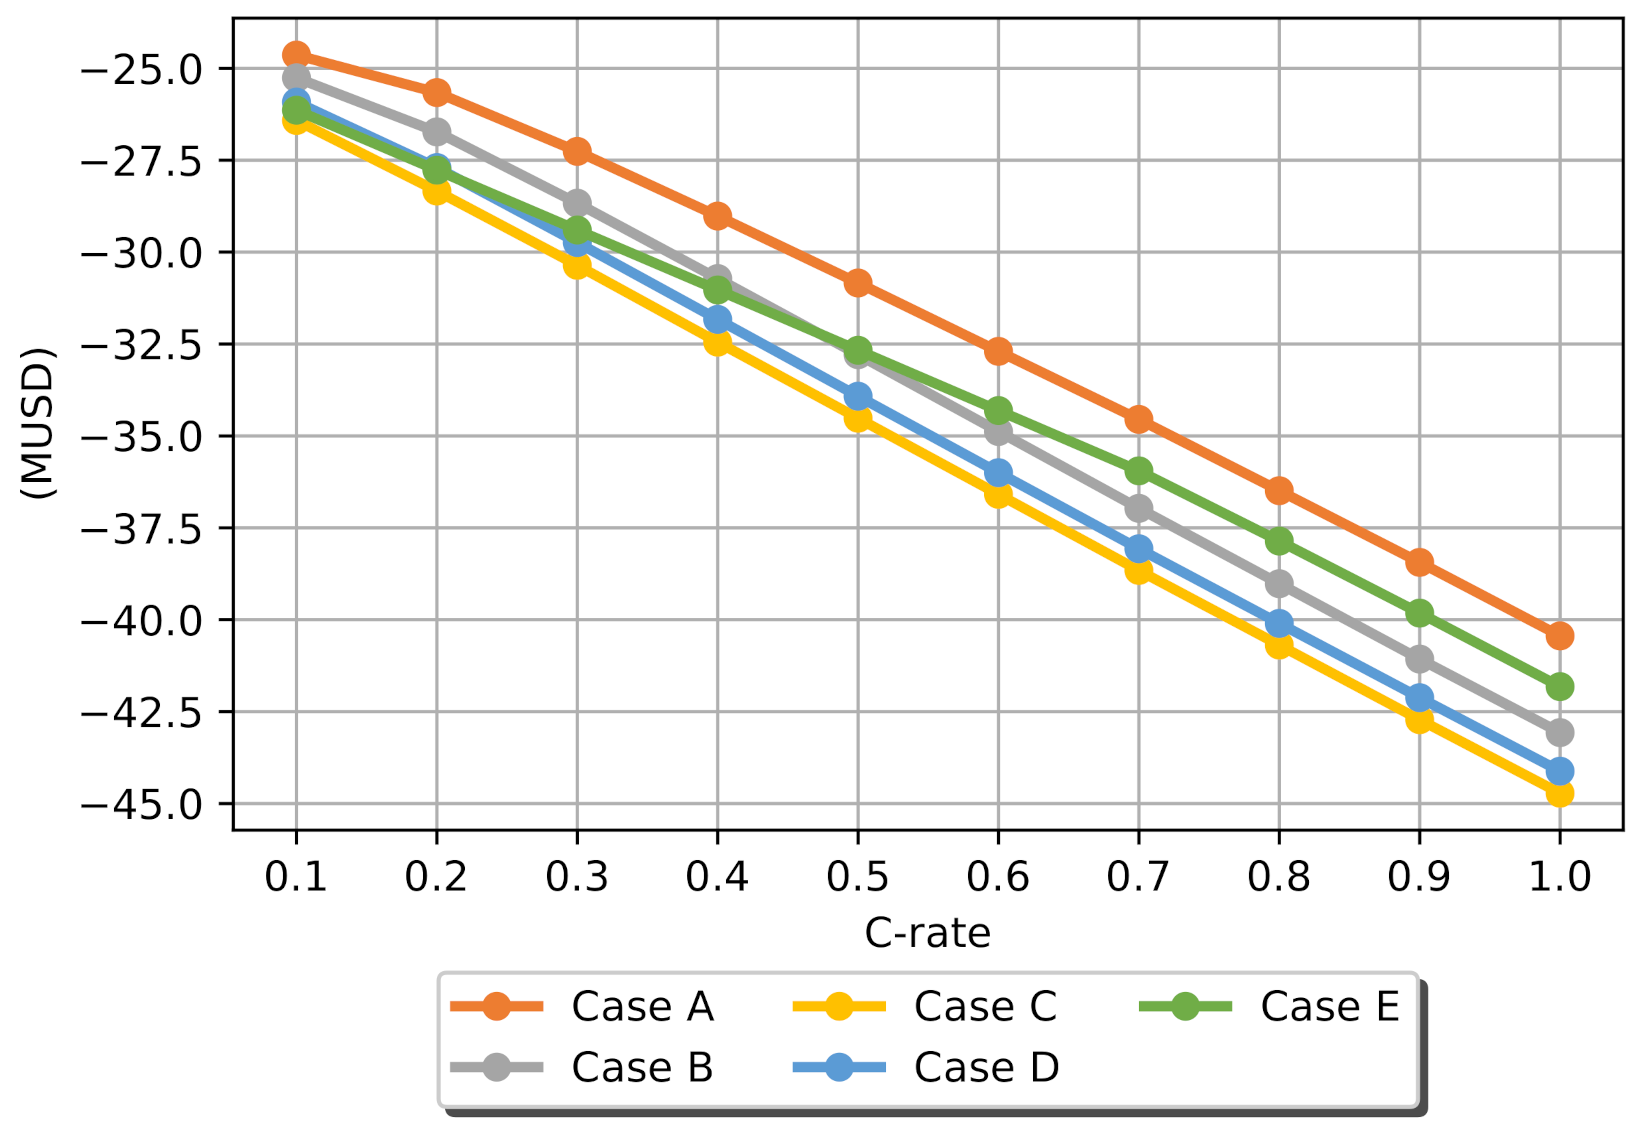
The results of the economic evaluation for each of the case studies are presented in Figure 12. Note that, for all the case studies, the NPV is negative, indicating that in none of them is it feasible to install a BESS in the Colombian electrical system to only perform energy arbitrage. Moreover, it is observed that the system with greater capacity does not necessarily represent the best financial option. In this study, the economic analysis indicates that the power-energy relationship with the highest cost/benefit ratio is the one obtained with a C-rate of 0.1.
It is also important to analyze the change of the NPV from one strategy to another. As shown in Figure 12, strategies C and D are the strategies with the NPV that is furthest from the optimum (case A), with an average NPV difference of 3.54 MUSD for case C and 2.95 MUSD for case D, i.e., around 10% of project’s CAPEX. In addition, note that cases B and E present the closest results to the optimal case, with case E showing better results than case B for c-rate values greater than 0.5. The foregoing is because, in case E, the BESS is only allowed to carry out one cycle per day, so, despite determining the selling/buying periods better than the other operating strategies, with low c-rates, it can not exchange all the necessary energy to obtain higher income. On the contrary, in Case B, the BESS can do several transactions per day, thus getting higher income despite the low c-rates.
4.2. Discussion
From the obtained results, it can be inferred that the performance of an energy arbitrage strategy will be affected by three main factors: the capacity of the BESS to be installed (C-rate), the volatility of the energy price of the market, and the amount of available data about the different market variables (historical price, weather, energy demand, etc.). These factors allow the BESS investor to estimate its exposure to the volatility of the market’s energy price. In fact, as Figure 12 shows for case B, if the participation capacity of the BESS increases, the risk of economic losses is bigger, if there is not an adequate prediction model. Furthermore, if a significant amount of data on the variables that control the energy price is available, the forecast models will have a better performance, thus reducing the risk of economic losses during the operation.
It is also important to highlight the behavior observed in the arbitrage strategies presented in cases B and E. First, strategy E is very conservative for C-rates less than 0.5, since it operates based on the average behavior of the system, thus failing to obtain better incomes. This is the opposite of the results observed in case B, where the strategy is less conservative, since it is based on a RNN, and better incomes are obtained. However, with C-rates greater than 0.5, where the volumes of energy bought and sold are higher, it is observed that the conservativeness of strategy E manages to offset the risk of exposure to market volatility generated by the increase in energy transaction capacity.
On the other hand, the importance of BESS degradation is of importance when evaluating the project feasibility. For instance, results have shown that degradation impacts the project’s NPV, by reducing it by 30%.
Finally, it is observed that, under the current conditions of the Colombian electricity market, energy arbitration through BESS is not profitable because the generated income is ten times less than the necessary CAPEX for the installation of these energy storage systems. This can be explained because in Colombia more than 70% of the generation units are hydroelectric units, and usually 85% of the annual energy is generated by those units; therefore, the large participation of these generation plants does not allow for a big gap between the peak and valley prices. However, Ref. [3] forecast an 83% drop in the installation prices of the BESS, which would represent a good business opportunity for markets as the Colombian electricity market.
5. Conclusions
In this paper, a comparison of four arbitrage strategies was conducted, using the Colombian’s energy market as a case study. The results have shown that strategies in which a market’s behavior forecast is performed with a greater amount of data, such as statistical (case E) and neural network-based (case B) strategies, have a better performance than seasonal strategies that only use a small amount of historical data (e.g., the same day of previous week) to define the BESS operation. Specifically, when there are external factors considerably affecting the average behavior of energy prices, e.g., changes in the demand due to COVID-19, seasonal strategies will not be able to identify new market patterns, thus obtaining less profit than the other strategies. Considering the average performance of the different strategies, it can be determined that the precision in the prediction of the spot energy market will directly affect the results of the strategy. For this reason, it is observed that, for the Colombian case, the arbitration strategy based on statistical analysis (case E) will present the best results because the error in the prediction of market behavior is lower compared to the other strategies evaluated in this document.
The performed financial analysis showed that, for all the studied strategies, a negative NPV is obtained, proving that it is not profitable to invest in BESS that only perform arbitrage in the Colombian’s energy market. The latter might be explained by the small price gaps that exist between valley and peak demand, mainly caused by the high participation of hydro generators.
Note that the results reported here should be considered in the light of some limitations, such as the simulation time horizon, the type of energy market, the BESS technology, and the battery cost. The reduction of BESS installation costs and the simultaneous participation of BESS in energy and ancillary services markets are factors that can make these kinds of projects economically viable in countries such as Colombia. Furthermore, the participation of the BESS in intra-hourly or real-time markets can increase the operation of these systems and therefore increase both their incomes and degradation. It is also important to mention that the results of this paper are limited only to the technical characteristics of Li-ion BESS; however, other types of energy storage technologies might be integrated into the proposed model and might be studied in future works.
Author Contributions
Conceptualization, A.F.P. and D.R.-Q.; Data curation, A.F.P.; Formal analysis, A.F.P., D.R.-Q., and C.A.C.; Investigation, A.F.P., D.R.-Q., and C.A.C.; Methodology, A.F.P. and D.R.-Q.; Project administration, C.A.C.; Supervision, C.A.C.; Validation, D.R.-Q. and C.A.C.; Visualization, C.A.C.; Writing—original draft, A.F.P. and D.R.-Q.; Writing—review and editing, D.R.-Q. and C.A.C. All authors have read and agreed to the published version of the manuscript.
Funding
This work was funded by the Grupo Energia Bogota (GEB), with the agreement 101858-2019 between GEB and CEIBA foundation, and by Minciencias, with the postdoctoral scholarship program 848-2019.
Institutional Review Board Statement
Not applicable.
Informed Consent Statement
Not applicable.
Data Availability Statement
The energy market data used in this document were extracted directly from the open-source database published by the network operator of the Colombian electrical system (XM) at: http://portalbissrs.xm.com.co/Paginas/Reportes/busmeta.aspx (accessed on 5 Feburary 2021).
Acknowledgments
This work was supported by the Grupo Energia Bogota (GEB), with the agreement 101858-2019 between GEB and CEIBA foundation, and by Minciencias, with the postdoctoral scholarship program 848-2019.
Conflicts of Interest
The authors declare no conflict of interest.
Nomenclature
| Symbols | Description |
| t | Steps of time (h) |
| T | Simulation horizon |
| d | Linear segment of BESS degradation curve |
| D | Group of linear segments of BESS degradation curve: (S1, S2, S3, S4, S5, S6) |
| Price of energy in t ($/MWh) | |
| Amount of power discharged in the system in t (MW) | |
| Amount of power charged for the system in t (MW) | |
| Market operation time segment, for this case is 1 (h) | |
| Power capacity of Energy Storage System (MW) | |
| Energy capacity of Energy Storage System at time t (MWh) | |
| Energy level of Energy Storage System at time t (MWh) | |
| Cost of power capacity in Energy Storage System with n technology ($/MW) | |
| Cost of energy capacity in Energy Storage System with n technology ($/MWh) | |
| Initial State of Charge of the Energy Storage System (p.u.) | |
| Minimum State of Charge of the Energy Storage System (p.u.) | |
| Maximum State of Charge of the Energy Storage System (p.u.) | |
| State of Charge of the Energy Storage System in t (p.u.) | |
| Charge efficiency of power conversion process of n technology of Energy Storage System (p.u.) | |
| Discharge efficiency of power conversion process of n technology of Energy Storage System (p.u.) | |
| Big number | |
| Signal of charge (Binary) | |
| Signal of discharge (Binary) | |
| Self discharge (p.u./h) | |
| Degradation rate of BESS (p.u./cycle) | |
| Degradation rate of BESS for segment d (p.u./cycle) | |
| Slope of linear segment d of BESS degradation curve (p.u./cycle) | |
| Constant of linear segment d of BESS degradation curve (p.u.) | |
| Depth of Discharge (p.u.) | |
| Depth of Discharge minimum of linear segment d (p.u.) | |
| Depth of Discharge maximum of linear segment d (p.u.) | |
| Integral variable signal of linear segment d at time t (Binary) |
References
- Department of Energy of United States of America. DOE Global Energy Storage Database Projects. 17 November 2020. Available online: https://www.sandia.gov/ess-ssl/global-energy-storage-database-home/ (accessed on 2 February 2021).
- BloombergNEF. Energy Storage Investments Boom as Battery Costs Halve the Next, Decade. (n.d.) Available online: https://about.bnef.com/blog-/energy-storage-investments-boom-battery-costs-halve-next-decade/ (accessed on 31 March 2021).
- BloombergNEF; Goldie-Scot, L. A Behind the Scenes Take on Lithium-Ion Battery Prices. BloombergNEF, 2019. Available online: https://about.bnef.com/blog/behind-scenes-take-lithium-ion-battery-prices/ (accessed on 25 April 2021).
- Li, L.; Liu, P.; Li, Z.; Wang, X. A multi-objective optimization approach for selection of energy storage systems. Comput. Chem. Eng. 2018, 115, 213–225. [Google Scholar] [CrossRef]
- Eyer, J.; Corey, G.P.; SANDIA. Energy Storage for the Electricity Grid: Benefits and Market Potential Assessment Guide. In a Study for the DOE Energy Storage Systems Program (Issues SAND2010-0815). 2010. Available online: http://www.ntis.gov/help/ordermethods.asp?loc=7-4-0#online (accessed on 13 May 2021).
- Rampersadh, N.; Davidson, I.E. Grid energy storage devices. In Proceedings of the 2017 IEEE PES-IAS PowerAfrica Conference: Harnessing Energy, Information and Communications Technology (ICT) for Affordable Electrification of Africa, Accra, Ghana, 27–30 June 2017; pp. 121–125. [Google Scholar] [CrossRef]
- Wu, F.-B.; Yang, B.; Ye, J.-L. Chapter 5-Integrated ESS application and economic analysis. In Grid-Scale Energy Storage Systems and Applications; Elsevier: Amsterdam, The Netherlands, 2019; pp. 153–201. [Google Scholar] [CrossRef]
- Zamani-Dehkordi, P.; Chitsaz, H.; Rakai, L.; Zareipour, H. A price signal prediction method for energy arbitrage scheduling of energy storage systems. Int. J. Electr. Power Energy Syst. 2020, 122, 106122. [Google Scholar] [CrossRef]
- Weron, R. Electricity price forecasting: A review of the state-of-the-art with a look into the future. Int. J. Forecast. 2014, 30, 1030–1081. [Google Scholar] [CrossRef] [Green Version]
- Lee, H.C.; Kim, H.; Yoon, Y.T. Optimal ESS investment strategies for energy arbitrage by market structures and participants. J. Electr. Eng. Technol. 2018, 13, 51–59. [Google Scholar] [CrossRef]
- Byrne, R.H.; Silva-Monroy, C.A. Estimating the Maximum Potential Revenue for Grid Connected Electricity Storage: Arbitrage and Regulation. 2012. Available online: http://www.sandia.gov/ess/publications/SAND2012-3863.pdf (accessed on 15 May 2021).
- Zafirakis, D.; Chalvatzis, K.J.; Baiocchi, G.; Daskalakis, G. The value of arbitrage for energy storage: Evidence from European electricity markets. Appl. Energy 2016, 184, 971–986. [Google Scholar] [CrossRef]
- Akbari-Dibavar, A.; Zare, K.; Nojavan, S. A hybrid stochastic-robust optimization approach for energy storage arbitrage in day-ahead and real-time markets. Sustain. Cities Soc. 2019, 49, 101600. [Google Scholar] [CrossRef]
- Salles, M.B.C.; Huang, J.; Aziz, M.J.; Hogan, W.W. Potential Arbitrage Revenue of Energy Storage Systems in PJM. Energies 2017, 10, 1100. [Google Scholar] [CrossRef] [Green Version]
- Krishnamurthy, D.; Uckun, C.; Zhou, Z.; Thimmapuram, P.R.; Botterud, A. Energy Storage Arbitrage Under Day-Ahead and Real-Time Price Uncertainty. IEEE Trans. Power Syst. 2018, 33, 84–93. [Google Scholar] [CrossRef]
- Fang, X.; Hodge, B.-M.S.; Bai, L.; Cui, H.; Li, F.F. Mean-Variance Optimization-Based Energy Storage Scheduling Considering Day-Ahead and Real-Time LMP Uncertainties. IEEE Trans. Power Syst. 2018, 33, 7292–7295. [Google Scholar] [CrossRef]
- Terlouw, T.; AlSkaif, T.; Bauer, C.; van Sark, W. Multi-objective optimization of energy arbitrage in community energy storage systems using different battery technologies. Appl. Energy 2019, 239, 356–372. [Google Scholar] [CrossRef]
- Martins, J.; Miles, J. A techno-economic assessment of battery business models in the UK electricity market. Energy Policy 2021, 148, 111938. [Google Scholar] [CrossRef]
- Wang, H.; Zhang, B. Energy Storage Arbitrage in Real-Time Markets via Reinforcement Learning. In Proceedings of the IEEE Power and Energy Society General Meeting, Portland, OR, USA, 5–9 August 2018; pp. 1–11. [Google Scholar] [CrossRef] [Green Version]
- Wankmüller, F.; Thimmapuram, P.R.; Gallagher, K.G.; Botterud, A. Impact of battery degradation on energy arbitrage revenue of grid-level energy storage. J. Energy Storage 2017, 10, 56–66. [Google Scholar] [CrossRef] [Green Version]
- Wang, Y.; Zhou, Z.; Botterud, A.; Zhang, K.; Ding, Q. Stochastic coordinated operation of wind and battery energy storage system considering battery degradation. J. Mod. Power Syst. Clean Energy 2016, 4, 581–592. [Google Scholar] [CrossRef] [Green Version]
- Bera, A.; Almasabi, S.; Tian, Y.; Byrne, R.H.; Chalamala, B.; Nguyen, T.A.; Mitra, J. Maximising the investment returns of a grid-connected battery considering degradation cost. IET Gener. Transm. Distrib. 2020, 14, 4711–4718. [Google Scholar] [CrossRef]
- Zhuo, W.; Savkin, A.V. Profit Maximizing Control of a Microgrid with Renewable Generation and BESS Based on a Battery Cycle Life Model and Energy Price Forecasting. Energies 2019, 12, 2904. [Google Scholar] [CrossRef] [Green Version]
- Mallon, K.R.; Assadian, F.; Fu, B. Analysis of On-Board Photovoltaics for a Battery Electric Bus and Their Impact on Battery Lifespan. Energies 2017, 10, 943. [Google Scholar] [CrossRef]
- Xu, Y.; Zhao, T.; Zhao, S.; Zhang, J.; Wang, Y.; Energy Research Institute @ Nanyang Technological University (ERI@N); State Grid Corporation of China. Multi-objective chance-constrained optimal day-ahead scheduling considering BESS degradation. CSEE J. Power Energy Syst. 2018, 4, 316–325. [Google Scholar] [CrossRef]
- Kadri, A.; Mohammadi, F. Energy storage optimization for global adjustment charge reduction in Ontario. J. Energy Storage 2020, 30, 101491. [Google Scholar] [CrossRef]
- Fu, R.; Remo, T.; Margolis, R.; Fu, R.; Remo, T.; Margolis, R. 2018 U.S. Utility-Scale Photovoltaics- Plus-Energy Storage System Costs Benchmark; National Renewable Energy Lab. (NREL): Golden, CO, USA, 2018. Available online: https://www.nrel.gov/docs/fy19osti/71714.pdf (accessed on 28 May 2021).
- Arcos-Vargas, Á.; Canca, D.; Núñez, F. Impact of battery technological progress on electricity arbitrage: An application to the Iberian market. Appl. Energy 2020, 260, 114273. [Google Scholar] [CrossRef]
- Damato, G.; Hoffman, S. Energy Storage Cost Summary for Utility Planning: Executive Summary; Electric Power Research Institute: Washington, DC, USA, 2016; Issue November. [Google Scholar]
Figure 1.
Degradation curve of Li-ion BESS, based on [24].
Figure 1.
Degradation curve of Li-ion BESS, based on [24].

Figure 2.
Linear segments of the Li-ion BESS degradation curve.

Figure 3.
Linear segments of the Li-ion BESS degradation rate curve.

Figure 4.
Clearing energy prices of the Colombia market (2019–2020).

Figure 5.
Price forecasting structure.

Figure 6.
Results of the price forecasting model throughout the simulation horizon.

Figure 7.
Operating hours for the statistical-based operating strategy.

Figure 8.
Total BESS income results for each case study.

Figure 9.
Colombian energy price difference between 19 May 2019 and 19 May 2020.

Figure 10.
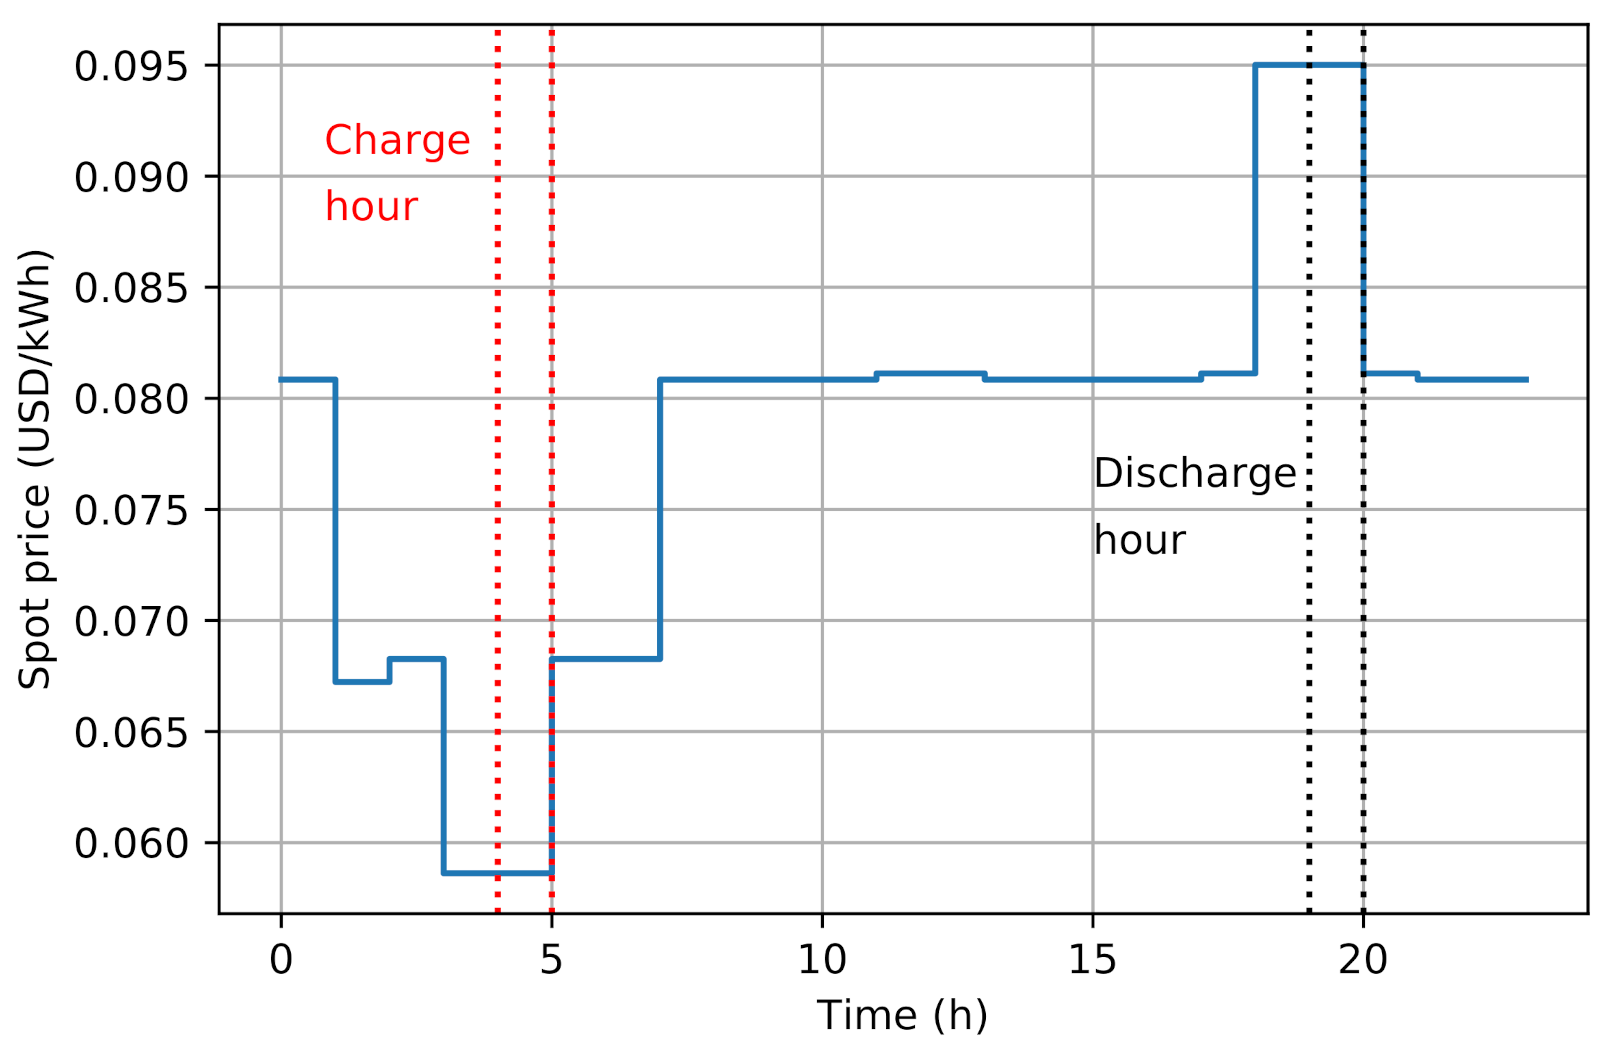
Energy storage charge operation for 10 May 2020, Study case A.

Figure 11.
BESS Degradation results for each case study.

Figure 12.
Net present value for each case study.


Table 1.
Technical characteristics of Li-ion batteries used.
| Item | Value |
|---|---|
| Charge efficiency (%) | 90 |
| Discharge efficiency (%) | 90 |
| Self-discharge (%/h) | 0.00625 |
| Minimum State of Charge (p.u.) | 0.2 |
| Maximum State of Charge (p.u.) | 1.0 |
Table 2.
Cost breakdown of ESS based on Li-ion batteries.
| Item | Value |
|---|---|
| Li-ion Battery (USD/MWh) | 209,000.00 |
| Power conversion system (USD/MW) | 70,000.00 |
| Structural Balance Of System (USD/MW) | 20,000.00 |
| Electrical Balance Of System (USD/MW) | 80,000.00 |
| Engineering, Procurement, and Construction (USD/MWh) | 35,000.00 |
| Land acquisition (USD/MWh) | 1000.00 |
| Interconnection fee (USD/MW) | 30,000.00 |
Publisher’s Note: MDPI stays neutral with regard to jurisdictional claims in published maps and institutional affiliations. |
© 2021 by the authors. Licensee MDPI, Basel, Switzerland. This article is an open access article distributed under the terms and conditions of the Creative Commons Attribution (CC BY) license (https://creativecommons.org/licenses/by/4.0/).
Share and Cite
MDPI and ACS Style
Peñaranda, A.F.; Romero-Quete, D.; Cortés, C.A. Grid-Scale Battery Energy Storage for Arbitrage Purposes: A Colombian Case. Batteries 2021, 7, 59. https://0-doi-org.brum.beds.ac.uk/10.3390/batteries7030059
AMA Style
Peñaranda AF, Romero-Quete D, Cortés CA. Grid-Scale Battery Energy Storage for Arbitrage Purposes: A Colombian Case. Batteries. 2021; 7(3):59. https://0-doi-org.brum.beds.ac.uk/10.3390/batteries7030059
Chicago/Turabian StylePeñaranda, Andrés F., David Romero-Quete, and Camilo A. Cortés. 2021. "Grid-Scale Battery Energy Storage for Arbitrage Purposes: A Colombian Case" Batteries 7, no. 3: 59. https://0-doi-org.brum.beds.ac.uk/10.3390/batteries7030059
Note that from the first issue of 2016, this journal uses article numbers instead of page numbers. See further details here.