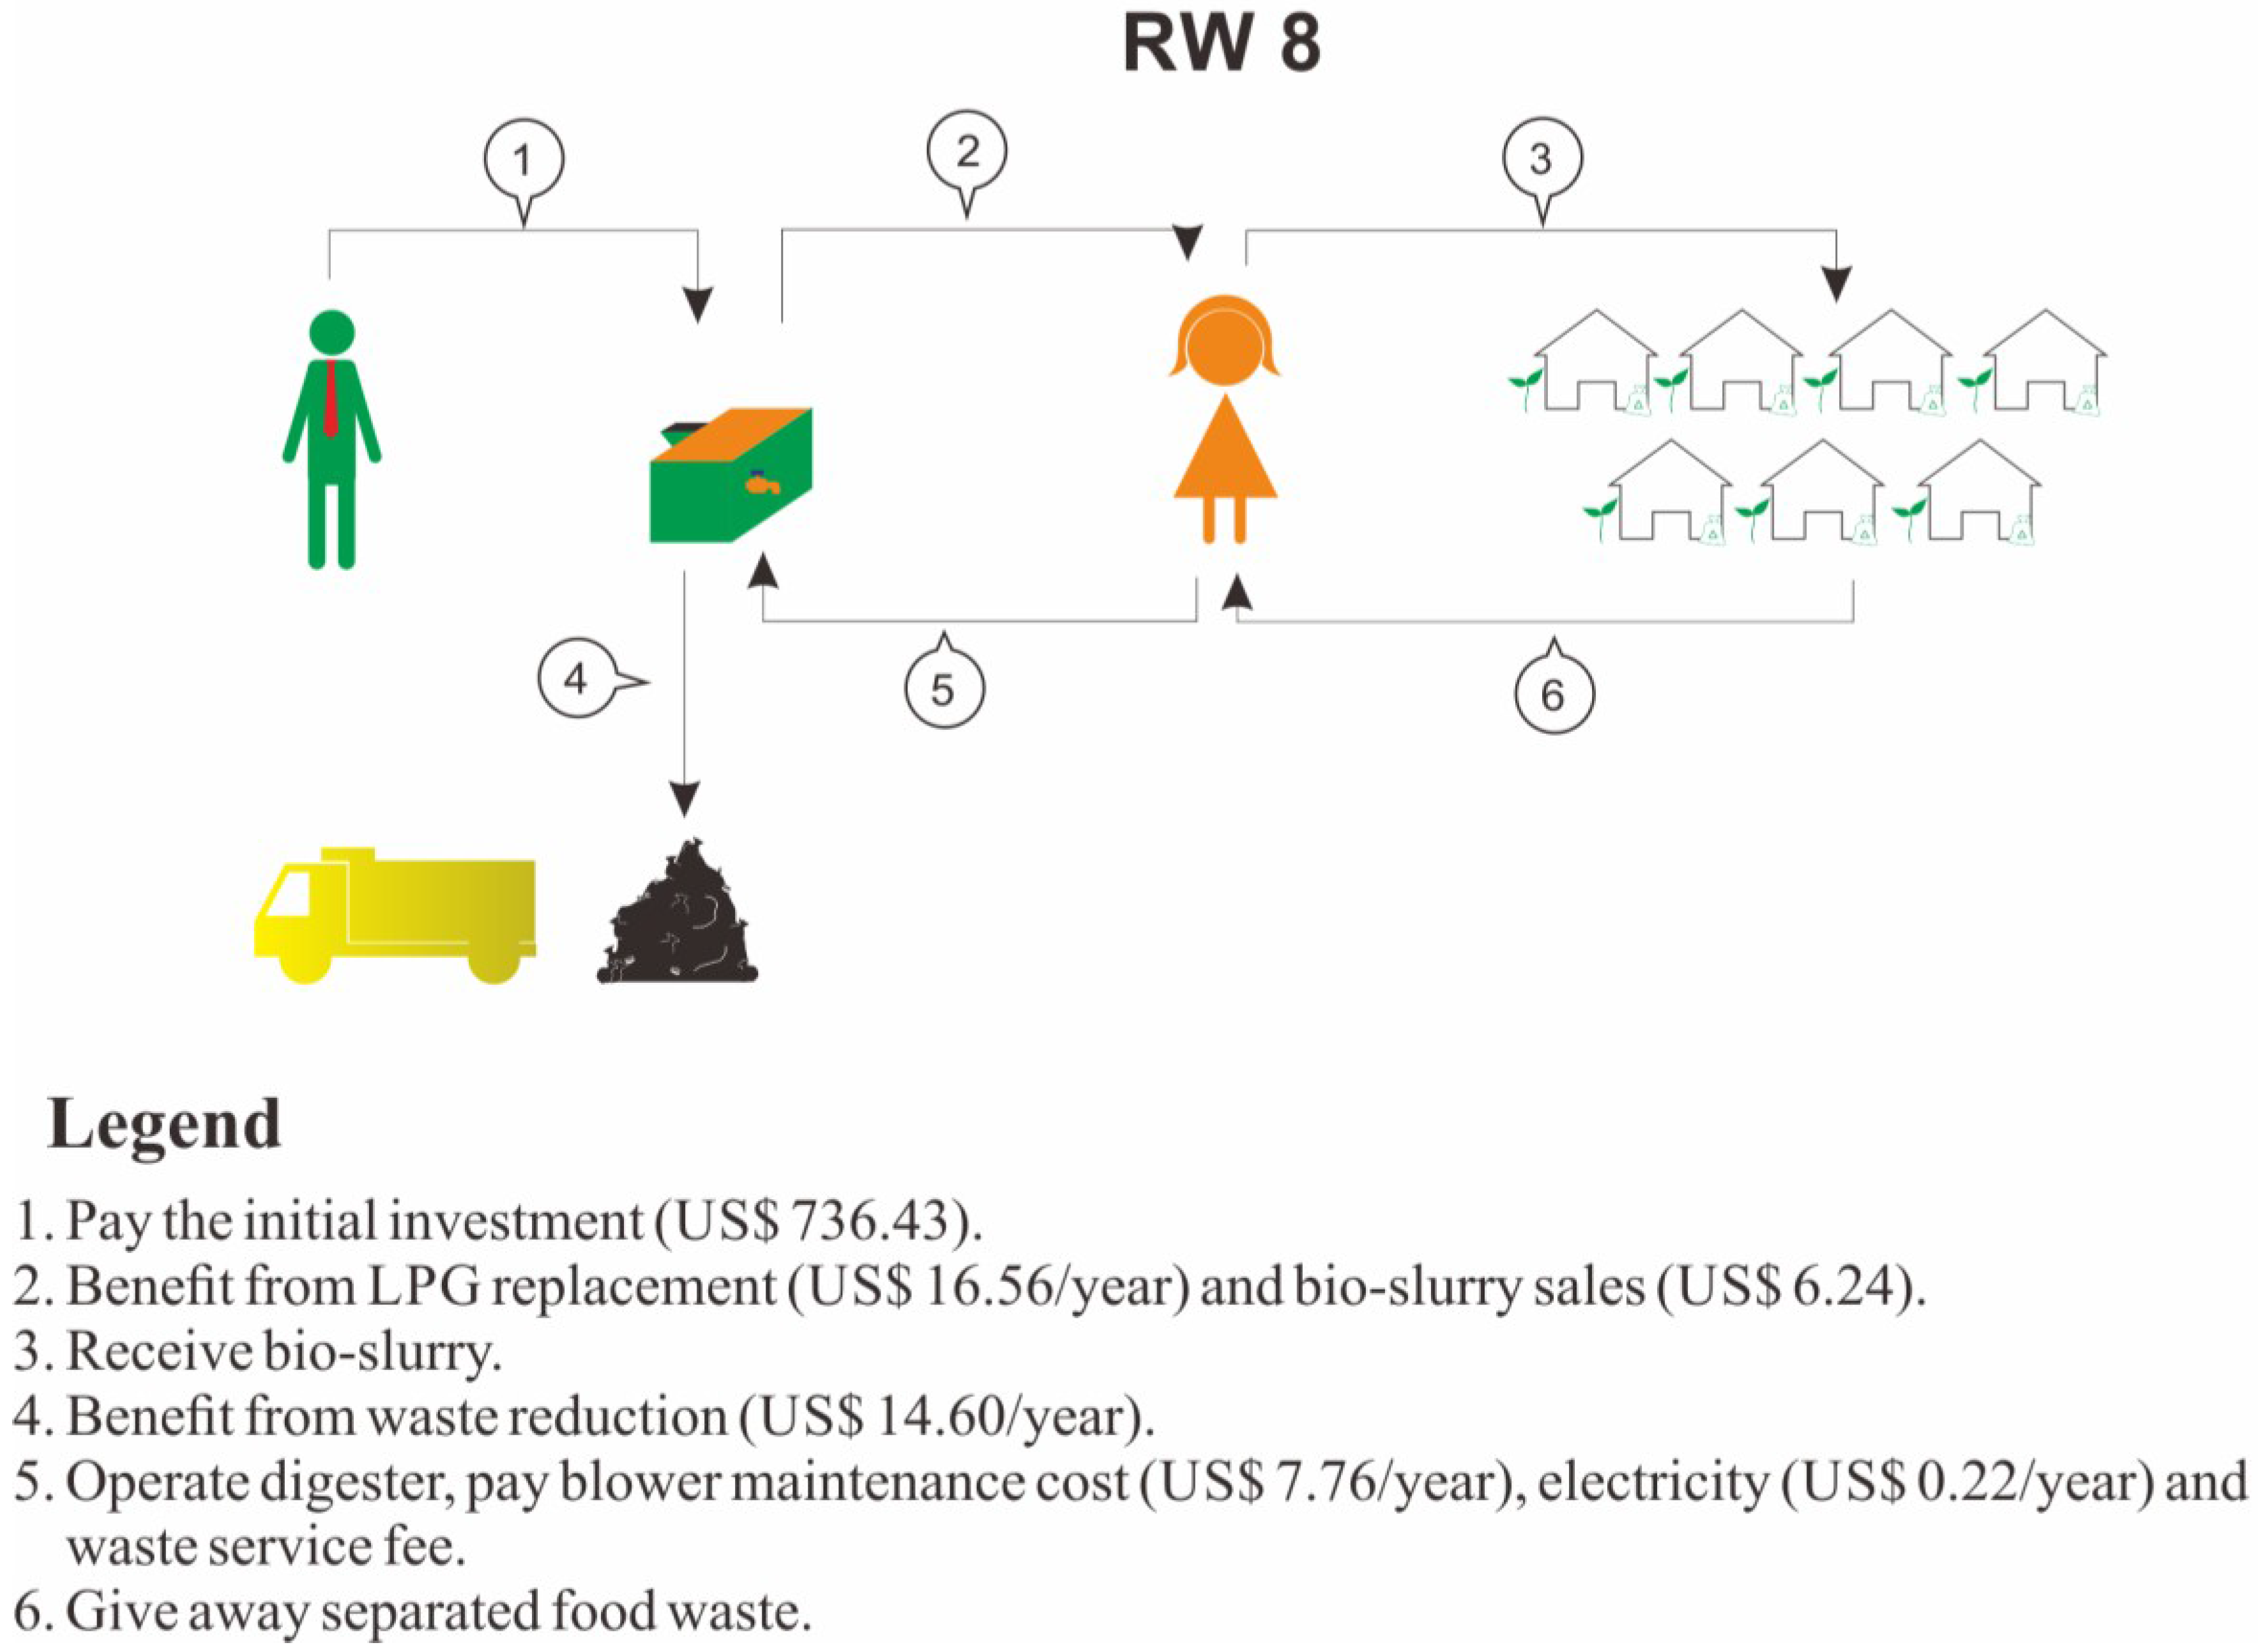
Article

Socio-Economic Considerations of Converting Food Waste into Biogas on a Household Level in Indonesia: The Case of the City of Bandung

by
Encep Amir
1,*,
Sharon Hophmayer-Tokich
2 and
Tubagus Benito Achmad Kurnani
3,4
1
Mata Garuda Institute, AA Maramis II, Kompleks Departemen Keuangan Jalan Lapangan Banteng Timur No. 1, Jakarta 10710, Indonesia
2
The Department of Governance and Technology for Sustainability (CSTM), University of Twente, PO box 217, Enschede 7500AE, The Netherlands
3
Environmental Science Master Program, Universitas Padjadjaran, Jalan Sekeloa Selatan I, Bandung 40132, Indonesia
4
Faculty of Animal Husbandry, Universitas Padjadjaran, Jalan Raya Bandung—Sumedang Km 21. Cikeruh. Sumedang, Jatinangor 45363, Indonesia
*
Author to whom correspondence should be addressed.
Submission received: 10 September 2015 / Revised: 7 October 2015 / Accepted: 10 November 2015 / Published: 24 November 2015
(This article belongs to the Special Issue Organic Waste Management)

Abstract

:
Household waste is a serious environmental problem in Indonesia, especially in urban areas. Since 2010, biogas production from food waste has been introduced to reduce waste and provided an alternative to liquid petroleum gas (LPG) as cooking fuel in a pilot project in Bandung. Although the produced biogas is sufficient, the socio-economic aspects can hinder application. This study assesses the socio-economic feasibility of the project in Cibangkong, a typical urban area in Bandung, which includes four bio-digesters. The results show that the conversion of food waste into biogas is currently not economically feasible, mainly due to the low penetration of bio-slurry—a by-product commonly used for fertilizer—into local fertilizer supply-chains. From a social perspective, community acceptance is mainly influenced by procedural justice. Furthermore, while the produced biogas is perceived to be quite useful in substituting LPG, it has not yet been fully utilized due to low bio gas pressure and several technical failures, which in turn influence community acceptance of the digesters. It is thus concluded that introducing biogas production from waste to improve waste management and reduce LPG consumption can be feasible when efforts to support the market uptake of bio-slurry, enhance biogas utilization, and improve procedural justice performance, are taken.

1. Introduction

Many big cities in Indonesia, especially on the Java Islands, are now struggling to cope with high volumes of waste. There are 1.12 kilograms of waste/capita produced daily that must be managed [1]. In Bandung City alone, for example, 875 tons of waste is produced every day [2]. To remedy the negative impact of waste accumulation a variety of measures have been introduced, such as central landfills and other recycling programs. These, however, only cover 56% of generated waste and thus do not attain significant results [3]. The current waste management is lacking in both collection services and treatment facilities.
The waste collection service does not cover the entire urban area, with the highly dense populated areas being most affected, as the roads in these residential areas are very narrow, preventing collection trucks from passing through [4]. As a consequence, nationwide, the official sanitation department collects only 16.7 million tons of waste annually (in the household sector), while an additional 169 million tons are separately managed by local inhabitants in areas not covered by the waste collection service. A considerable amount of the waste is irresponsibly disposed of in the rivers (ca. 8 million tons/year) and burnt (ca. 6 million tons a year) [3]. Furthermore, in Bandung, the situation is adversely amplified by the fact that many waste collection trucks have exceeded their operating life span, further reducing the efficiency of the collection service [5].
Regarding treatment facilities, 47% of the landfills do not have appropriate supporting facilities and where supporting facilities do exist, 10% of them do not work properly. Some of the landfills are not equipped with a leachate treatment system, potentially releasing dangerous pollutants into the environment [3]. The current waste management system can have a more immediate devastating effect, as was the case in Bandung in 2004, when the landfill in Leuwigajah slid and buried local residences, resulting in 141 casualties and costing approximately US $434 million in losses [2]. Implementing waste reduction at the source as a waste management strategy is of great importance for reducing environmental pollution as well as the risk it poses to the local population. Since the household sector is the largest waste producer in Indonesia, targeting this sector is very relevant. Household waste is dominated by organic waste (ca. 67% of the total) [6], more specifically food waste originating in the kitchen (ca. 58% of the total) [3]. Thus, food waste should receive sufficient attention. Owing to its high water and moisture content, food waste from the household sector can take a great portion of waste transport loads. It is not surprising then that the sanitation department allocates 42.8% of the total budget for waste transportation [5]. In Bandung, the total allocation for waste transport could reach US $1.90/ton of waste in comparison to only US $0.30/ton for waste treatment in landfills [7]. Reducing the amount of food waste at the source can thus be more beneficial from a financial perspective as well.
Composting technology is currently applied as the most popular means to recycle organic waste into bio-fertilizer. However, due to the lack of market support, bio-fertilizer quality assurance, and the high cost of solid fertilizer transport, the composting technology shows insignificant progress [8]. A new alternative is now being explored consisting of converting organic waste, such as food waste, into biogas using bio-digesters. A bio-digester is built to provide a completely or almost anaerobic condition for some specific bacteria to grow and eventually digest the organic waste. This alternative is considered more beneficial, because in addition to the production of liquid bio-slurry used for fertilizer it also yields biogas as an energy source, which can substitute the commonly used Liquid Petroleum Gas (LPG). The substitution of LPG is seen as a big advantage as LPG security is another problem faced by the household sector.
LPG consumption in Indonesia has rapidly increased and is expected to rise further in the future, mainly due to the National Energy Policy, which encourages households to shift their cooking fuel from kerosene to LPG. On average, the demand for LPG rises annually by 20%, with the highest increment being recorded between 2007 and 2008, at 62%. It is estimated that 9 million tons of LPG will be required to meet the national demand by the year 2030. The increase in LPG consumption raises several concerns as the domestic production capacity is no longer able to meet the growing demands, resulting in the need to import more LPG from abroad [9]. Additionally, the high LPG consumption at the household level also results in a further increase of the price and scarcity of subsidized LPG [10]. Regarding this matter, utilizing local renewable resources to produce energy may offer a more resilient energy supply [11].
Introducing the conversion of food waste into biogas on the household level to substitute LPG usage then becomes the nexus of solving the waste problem at the source and providing alternative energy to local residents as an incentive. Biogas production in Indonesia as in other developing countries, however, has so far been largely concentrated on cattle farms in rural areas with the common feedstock used being cow dung, not household waste [12]. On the other hand, the urban areas are the places where the waste management needs are acute and where such substitution of LPG by biogas would make the most impact in the energy sector as the urban sector consumes large quantities of LPG. Thus, investigating the potential and relevance of converting food waste into biogas on a household level is important if a broader development to reduce organic household waste in urban areas is to be promoted.
An initial study was conducted based on the experience from a pilot project in Cibangkong—the first location in Bandung city, where the provision of food waste conversion into biogas on a household level was introduced. The study addressed the technical, economic, and social aspects of food waste into biogas conversion in an urban setting in order to provide an initial indication of its relevance and potential. While the study reveals that biogas production in the location of study is sufficient both in the term of volume and methane compositions, in comparison to references that are found in the literature and are mentioned in Section 2.1 (biogas yields range from 156.40 L/kg to 227.62 L/kg; and methane composition falling in the ideal range with 55.76%–66.71%), this article focuses on the socio-economic aspects as these seem to be the areas in which barriers can be found and should be addressed. Some technical aspects of food waste to biogas conversion are briefly discussed, as they are relevant to the social and economic aspects. As such, this paper aims to highlight the potential and the barriers, as well as some suggestions to overcome them, of the conversion of food waste to biogas on household level in an urban setting in Indonesia from a socio-economic perspective. In Section 2, the theoretical and contextual framework is reviewed. In Section 3, the location of study and the methodology are presented. In Section 4, the findings are presented and discussed, while Section 5 includes conclusions and recommendations.

2. The Theoretical and Contextual Framework

2.1. Biogas Production from Food Waste

Biogas is considered as a mixture of gases produced from an anaerobic degradation of organic materials by the consortium of microorganisms. Methane is the most common gas found in biogas and acts as an energy source. The concentration of methane may range from 50% to 70% [13]. It is followed by carbon dioxide, which has no energy content, and thus, decreases the total calorific value of biogas [14].
The feedstock of the biogas production may come from different sources including food waste. Food waste can be defined as organic waste, which results from unprocessed raw foods and leftover foods. The biogas produced from food waste varies greatly as one mixture of food waste may contain different organic materials and composition compared to another [15]. As an approximate estimation, a mixture of food waste can produce biogas equivalent to roughly 204 L/kg of the feedstock [16].
Food waste is usually mixed with cow rumen as it is needed to provide methanogens bacteria, which transform acetate acids, hydrogen, and carbon dioxides into methane [17]. The biogas production mechanism is likely to be a series of reactions in which a product from one reaction step is a material for another [18]. Thus, the presence of methanogens bacteria in the methanogenesis step holds an important role to connect the entire chained reaction pathway.
This series of chemical reactions occurs in a container, the so-called bio-digester. The material and the construction of the bio-digester vary with feedstocks, geological and hydrological conditions, budget availability, and many other factors. In the context of developing countries, a relatively small low-tech bio-digester is mostly introduced. The smallest size of the household-based bio-digester may reach around 0.75–1 m3. A more sophisticated construction can be seen in the bio-digester that contains food waste obtained from markets and canteens [19]. In Indonesia, bricks, plastic, plastic drums, and concrete are the materials usually used to build bio-digesters, though other materials are also possible [20].
The bio-digesters have different life spans, which rely primarily on the construction materials. For instance, fixed dome bio-digesters (brick and cement) and floating dome bio-digesters (brick, cement, and metal) have different the life spans, roughly 15–20 years and 12–15 years respectively. A bio-digester from polyethylene, which is relatively cheap, lasts for only 2–5 years [21]. Generally speaking, there is as a correlation between the durability of the bio-digester and the price of the bio-digester; the more expensive the bio-digester, the more durable it is [22], though some studies suggest that the lower costs digesters, despite their low durability, can be more economically accessible to low income families [23].
In order to reach the maximum economic benefit, a great yield of biogas production is necessary. Biogas production done on a small-scale level in developing countries is normally optimized by applying simple mechanical pre-treatments. Usually the feedstock is chopped before it is fed into bio-digester. This is aimed to increase the surface area of the feedstock and as a consequence, the rate of biogas production increases. More importantly, smaller feedstock will assist in preventing the bio-digester from unwanted sedimentation or slow-degraded material accumulation in the bottom of the bio-digester [24].
Not only surface area but also the presence of contaminants must be taken into consideration to improve the biogas production. Examples of contaminants are metal, glass, plastic, and sands. Contaminants may form sediment in the bottom of the bio-digester and consequently reduce its performance [13]. The presence of the contaminants can be prevented by proper waste separation at the source. It thus implies that social acceptance of waste separation is very important.
Some management and financing aspects related to the developing country context should also be mentioned. Small-scale bio-digesters may belong to an individual household or to a community. Accordingly, it will affect how the costs and benefits are shared. Different ownership will in turn generate different management patterns. For instance, the challenges of ensuring proper operation and maintenance of the bio-digester between individual and communal digesters will not be the same. In fact, as the scale of the bio-digester increases, more complex regulation is required [25]. Furthermore, despite the simplicity of the bio-digester, the investment is still considerably high. Since most households in developing countries are generally middle to low income families, the fully self-funded investment mechanism is found to be rare. Many bio-digesters in Sub-Saharan African countries are subsidized [22]. Other common means to finance the investment are soft loans, such as in Bangladesh [26], and credit, which can be seen in Nepal [27].

2.2. Economic Feasibility

In this context, the economic factors of food waste conversion into biogas on a household level are highly relevant since they can become an inhibiting factor. The introduction of biogas production facilities (the bio-digesters) entails costs (investment) and economic benefits. Investment is generally divided into costs associated with the construction and placement of the bio-digester, and costs associated with operation and maintenance (O&M) [28]. The benefits include replacement of conventional energy (LPG), sales of bio-slurry (as bio-fertilizer), and waste reduction (reduction of waste management costs) [29]. Since, as mentioned above, economic factors can hinder the introduction of bio-digesters on household level as a decentralized waste management option, an economic feasibility analysis can assess their economic potential. Simply put, if the economic benefits are able to recover the costs, it may be concluded that bio-digesters are feasible in economic terms.
Many suitable economic parameters can be employed to assess the economic feasibility of the food waste into biogas conversion; one parameter is Net Present Value (NPV). NPV has been used as the measuring tool to evaluate economic feasibility of biogas production in several studies [18,30,31,32]. In comparison to other parameters such as Internal Rate [33] of Return or Payback Period [34], it is found to have more advantages. NPV is therefore used in this study to assess the economic feasibility of the bio-digesters in the location of study as presented in the methodology section.
In addition to the investment and economic benefit, two extra variables are involved in the measurement of NPV: the durability or life span of the bio-digester and the discount rate. The durability reflects the duration of benefits that can be generated. On the other hand, the discount rate is one of the key elements in viewing the projected cash flow in the current state [35]. This value is used to adjust the economic return, which is possibly gained in the future [36].

2.3. Social Acceptance

Though a project can be feasible from a technical and economic perspective, a socially unacceptable project may lead to severe problems and risk to the investment. Social acceptance of the introduction of energy innovation such as biogas from food waste is a very broad concept and involves many dimensions. It generally covers three dimensions: socio-political acceptance, market acceptance, and community acceptance [37]. Socio-political acceptance entails the key stakeholders’ and decision-makers’ acceptance. Market acceptance indicates to what extent the customers (users) and investors accept the projects. Community acceptance entails the acceptance of the local stakeholders who contribute to a particular project. In this case, the dimension of community acceptance is addressed.
When addressing the food waste to biogas conversion project on a household level in an urban setting, the households and the community have a central role in determining the success of the biogas production in practice, as they are required to actively participate as elaborated below. However, in some Asian countries, many households have no sufficient experience in sorting their waste [38]. In addition, placing such facilities in urban areas where land is constrained and population density is high may trigger social conflicts [39]. Community acceptance and involvement is thus considered necessary in order to overcome obstacles.
Furthermore, considerable attention must be paid to encouraging women to participate when promoting community acceptance as managing household waste, food waste included, is one of the primary tasks for women in developing countries [40]. Thus, targeting women’s involvement in food waste reduction may give better results in regards to improved waste treatment [41]. As such, the participation of the household members, especially the women, is crucial.
Bio-digesters in Cibangkong are, in fact, classified as communal bio-digesters. It is because they provide local products and services such as anaerobic waste treatment, biogas, and even bio-slurry for some community members. In return, community members are required to cooperate in order to implement the project and ensure that the biogas production runs properly. For example, some households invest their land or front/back yard to be occupied by the bio-digesters (they practically become the bio-digester owner) and feed them, while others separate their waste to feed the bio-digesters and make sure the biogas feedstock is free of contaminants. On the other hand, potential nuisances from the facilities, such as bad odors and flies can affect the community as a whole due to spillover effect. Thus, the most relevant aspect of social acceptance that was studied in this case is community acceptance. Other aspects can be addressed in follow-up research.
Community acceptance includes several aspects: procedural justice, distributional justice, and trust. Procedural justice is how fairly the processes of decision-making and decision implementation are being conducted by a community as a whole. Distributional justice is how fairly the benefits and burdens are shared in the community. Lastly, trust is defined as how much the community believes in the intention of the external actor, in this case, the project initiators (proponents).
Procedural justice was initially perceived as a fair decision-making process [42], but it goes beyond this by also covering a fair decision implementation [43]. It includes several parameters, such as sufficient participation, opportunity to be heard (voice), and sufficient access to relevant information [44]. Procedural justice is considerably important because it may reduce tensions caused by unfair distributional justice [45]. There is even an assumption that a fair procedure is likely to yield a fair outcome [46].
Distributional justice addresses two parameters: outcome fairness and outcome favorability. Outcome fairness, which in this context covers all burdens and benefits, can be simply described as how fairly the outcome is distributed. Creating a fair outcome, in a certain situation, may be difficult to obtain. For example, as Messick (1993) noted in the Vermunt and Tornblom (1996) states, when it is difficult to equally or proportionally distribute the benefit, establishing a fair distribution is not an easy task [47]. Due to the difficulty in guaranteeing a fair outcome, once again, procedural justice is strongly required to mitigate the negative reaction caused by unfavorable results. However, it is also stated that procedural justice not only influences distributional justice, but also the other way around [48]. Along with the fair outcome, outcome favorability can also be considered important. Outcome favorability means how favorable the outcome is, which in turn contributes to the extent to which people accept the outcome [49]. In other words, outcome fairness tends to be concerned with how fair the distribution of the outcome is, whereas outcome favorability focuses more on how the outcome is perceived as favorable.
Finally, the trust level is one aspect that refers to the degree of trust that the local inhabitants have in the proponents. When the project involves actors from outside the community as the facilitators or investors, as in the studied case, trust from local inhabitants becomes crucial [50]. Trust can basically be determined by the proponent’s attitude and capabilities as perceived by the local inhabitants [37]. These aspects and parameters are used in this paper to analyze and discuss the community acceptance in the location of study.
Figure 1 illustrates the above-mentioned parameters to reflect how community acceptance is built.
Figure 1. Parameters affecting community acceptance.
Recycling 01 00061 g001

3. Research Location and Methods

3.1. Location and Description of the Studied Case

Cibangkong is administratively located in the sub-district of Batununggal, Bandung. It covers an area of 63.87 hectares, with ca. 3600 households and ca. 16,500 inhabitants. Cibangkong is divided into 13 different administrative units, locally known as Rukun Warga (RW). The details are illustrated in Figure 2.
Figure 2. The map of the Cibangkong residential area.
Recycling 01 00061 g002
In total, four bio-digesters currently operate in Cibangkong. One fixed dome bio-digester (19.2 m3, the biggest among all the bio-digesters in Cibangkong) is located in RW 11 and is able to contain almost all food waste generated by roughly 100 households. This bio-digester went into operation in December 2010. The other three, which are smaller (1.8 m3, able to contain food waste from five to ten households) and constructed as a portable type, were built in RW 8 and went into operation in November 2013.
The (not-for-profit) project was initiated by an environmentally related consulting company (the proponents) seeking to create a pilot site to function as a role model for other urban areas in Bandung, especially in converting their household waste into energy. All 13 RWs were approached with this project idea, of which initially only RW 11 accepted the invitation to voluntary join the program. Three years later, RW 8 joined as well. The funds were donated by Bank Jabar and Banten—a local bank that operated mainly in West Java and the Banten Province, Indonesia—for the initial bio-digester in RW 11, and by Surveyor Indonesia (a consulting company in the energy sector) for the additional bio-digesters in RW 8, as part of their Corporate Social Responsibility (CSR) program. The CSR mainly aims at better local waste management and providing extra income from LPG replacement. Two women-based organizations are involved in the project: Pembinaan Kesejahteraan Keluarga abbreviated to PKK—an official women empowerment organization operated mainly from RW to a larger administrative area—and a separate organization called My Darling—it stands for Masyarakat Sadar Lingkungan, meaning the Environmentally Aware Society—consisting mainly of housewives, to promote waste management in the involved RWs. The role of these women-based organizations is to become the local agent, promoting the importance of waste separation and waste reduction programs through biogas production. At the same time, these women organizations educate the household members (mostly housewives) to manage their waste and to use biogas in practice. The potential benefits of this program are thus reduced amounts of waste at source and the LPG replacement with biogas. The RW leaders, nonetheless, still have a certain degree of responsibility in supporting the project.
For the sake of clarity, the managerial aspects of the bio-digesters are separately described per area where the bio-digester is located (per RW).

3.1.1. RW 8

RW 8 has three smaller portable bio-digesters, which are placed in the yard of three separate households and are operated by the housewives. The households that volunteered their front or backyard for placing the bio-digesters became their owners. In return, the owners have the right to use biogas and bio-slurry that are produced in the bio-digester. They receive the food waste directly from their neighbors, normally 5–10 households within their vicinity, in exchange for access to using bio-slurry. Every afternoon, the housewives feed the bio-digester with already separated food waste. Food waste is dominated by inedible parts of raw vegetables (stems, rotten vegetable leaves) and fruit (pineapples, melon, orange, avocado, and many others) peels as one or two of their neighbors have a small business as juice sellers. The bio-digester is fed daily with ca. 7–10 kg of food waste. The biogas is only used by the bio-digester owners, while the bio-slurry is shared with the neighboring households. Compared to RW 11, more households in RW 8 have herbs and flower plantations close to their house, so the bio-slurry is quite useful. Figure 3 illustrates the distribution of the actors who are involved in the biogas production and utilization in RW 8.
Figure 3. Backward management model operated by women in RW 8.
Recycling 01 00061 g003

3.1.2. RW 11

The management model of biogas production from food waste in RW 11 is different than the one in RW 8. The bio-digester is, as mentioned above, bigger and is located close to the local waste landfill in RW 11 where it is managed and operated by the local communal waste collector. In return, the ownership is transferred to this waste collector.
The waste collector makes daily rounds to collect the waste from the households of RW 11. The collected waste is mostly a mixture of organic and inorganic waste. The mixed waste is put into a trolley and then brought to the landfill where it is separated. Recyclable waste (paper/boxes, recyclable metals, glass bottles and organic waste) is being separated and the rest is packed and loaded onto a waste truck to be sent by the local sanitation department to the central landfill. The food waste, ca. 30–35 kg a day, is fed into the bio-digester. On occasion, a higher amount of food waste is collected and fed. For example, after a wedding party, more than 100 kg of food waste can be obtained.
The waste collector receives a salary as the communal waste collector from an obligatory local waste service fee in the amount of US $558.14/year (the local currency is converted into US dollars at the 2015 rate, US $1.00 = IDR 12,900). In addition, due to the extra work related to the bio-digester, and as the only one who operates the bio-digester, he earns an extra US $27.96/year from the three households in the vicinity of the bio-digester, which use the produced biogas. He also has the right to sell bio-slurry and receive half of the revenue as his additional income, US $11.70/year. The rest is given to the proponents since they supply the labeled plastic jugs used to contain the bio-slurry. However, the price of bio-slurry is only determined by the proponents. Figure 4 illustrates the bio-digester setting in RW 11.
Figure 4. Communal management model operated by the waste collector in RW 11.
Recycling 01 00061 g004

3.2. Research Methods

Several tools are used to gather the data. With respect to the economic feasibility, open questionnaires were used to collect data regarding economic variables. The equation is modified from Kandpal [30] and was then used.
NVP = [ 1 ( 1 + i ) t i ] ( Ab Ac ) C
  • NPV = Net Present Value
  • Ab = Annual benefits
  • Ac = Annual operating costs
  • i = Interest rate
  • t = Life time of the plant
  • C = Cost of the bio-digester
To investigate the community’s acceptance, a semi-structured interview with some of the community representatives was held and several Likert-Scale questionnaires were distributed to all. Only neighboring households were omitted from the interview because it requires the participant to have a mutual interaction with the proponents, as it is intended to examine procedural justice and trust. They were; however, involved in the distributional justice analysis since they also contribute to the implementation of the project. Due to the larger number of neighboring households involved in RW 11, they were sampled based on random sampling using the Slopin formula.
S = N/(1 + Ne2)
S = Number of sample; N = Number of population; e = Margin of error (0.05).
According to the Slopin formula and considering that in RW 11 there are 109 neighboring households, the sample was calculated to be 86 households. In contrast, in RW 8 only 23 neighboring households are involved and thus a census was adequate. When the Slopin is applied to neighboring households in RW 8, the result is 22, which is not much different. One neighboring household is presented by one family member—which can be either male (M) or female (F)—who is mainly responsible for managing household waste. Lastly, the heads of several local institutions from both RWs were selected through a purposive sampling technique (only those who are involved in the biogas project). Table 1 describes the sampling procedure.
Table 1. The details of the sampling procedure.
RWTarget GroupNumber of PopulationSampling MethodNumber of Sample
8Bio-digester owners3 Census3 F
Neighboring households23Census23 F
Heads of several local institutions3Purposive sampling3 F
11Biogas users in RW 113Census3 F
Local waste officer in RW 111Census1 M
Neighboring households in RW 11109Random sampling86 (81 F + 5 M)
Heads of several local institutions3Purposive sampling2 F + 1 M
TOTAL115 F +7 M

4. Results and Discussion

The results are presented and discussed for both the economic feasibility and the community acceptance aspects. Reported barriers are presented and potential ways to overcome them are briefly suggested.

4.1. Economic Feasibility

In order to evaluate the economic feasibility, the business model for both RWs is presented. Despite the fact that it is a non-profit pilot project funded by a CSR program, the business model needs to be constructed to forecast the possibility of a self-funded option, and for the purpose of investigating the areas where the model can be improved. It basically elaborates the investment and financial scheme, money flows, and economic benefit disbursement. The variables involved can be simply categorized into two types: costs and benefits. The costs include both the initial investment and the annual expenditures. The initial investment is equal to the cost of purchasing or building the digester, which includes installation cost, labor cost and transportation cost. The initial investment in the project is currently paid by external parties (as part of a CSR program). Annual expenditures including maintenance cost, operational cost, and other costs like electricity for the blower are incurred by the digester’s owner (the biogas user). The benefits cover LPG reduction (saving in buying LPG), bio fertilizer sales, and the waste reduction, which is valued by considering the fuel saving gained by public waste service. Figure 5 shows the business model for both RWs.
Figure 5. The comparison of business model between RW 11 and RW 8.
Recycling 01 00061 g005aRecycling 01 00061 g005b

RW 11

In order to strengthen the monetary information, Table 2 is also presented. Table 2 lists the costs and economics benefits of biogas production from food waste in both RW 8 and RW 11 respectively. All values in the table, except for the initial investment, are in the form of an annual figure. Due to the fact that the bio-digesters’ capacity, as well as the costs and benefits, differ between the two types of bio-digesters, a differentiation is made between both systems. For the purpose of the analysis, two different situations are calculated: best-case scenario and actual situation. Best-case scenario refers to the situation when bio-slurry sales are in the maximum condition (all bio-slurry is sold). The actual situation means that the bio-slurry sales reflect the factual condition.
Several important notions may be drawn up. In the best-case scenario, the investment of the bio-digester can potentially be covered by the profits in the first year alone. The biggest source of income comes from the bio-slurry sales followed by the LPG reduction. However, in the actual situation, the sale of bio-slurry is very low, less than 50 L/year and 10 L/year for the fixed dome and portable bio-digester respectively, which lead to low financial income.
The NPV calculation for both bio-digesters is conducted by considering costs and benefits above and using several assumptions. The first assumption is that the discount rate refers to the index from the Indonesian Bank, which is 7.5%. The second assumption is the life span of each bio-digester: 20 years for the fixed dome bio-digester and 10 years for the portable bio-digester.
Table 2. Costs and benefits of a fixed dome digester in RW 11 and portable digester in RW 8.
RWVariableDetailsUnit PriceAmountTotal
11Initial investmentDigester costUS $ 3488.371 unitUS $ 3488.37
Installation cost
Transportation cost
Total Initial InvestmentUS $ 3488.37
Annual costMaintenance costUS $ 3.88/blower8 blowers/yearUS $ 31.04/year
Operational costUS $ 2.33/month12 months/yearUS $ 27.96/year
DepreciationUS $ 3488.37/digester1 digester/20 yearsUS $ 174.42/year
ElectricityUS $ 0.05/kWh17.52 kWh/yearUS $ 0.88/year
Total Annual CostUS $ 234.30/year
Annual benefits (best-case scenario)LPG replacementUS $ 0.46/kg144 kg/yearUS $ 66.24/year
Bio-slurry salesUS $ 0.78/L4800 L/yearUS $ 3744.00/year
Waste reductionUS $ 0.50/m329.2 m3/yearUS $ 14.60/year
Total Annual BenefitsUS $ 3824.84/year
Annual Benefits (actual situation)LPG replacementUS $ 0.46/kg144 kg/yearUS $ 66.24/year
Bio-slurry salesUS $ 0.78/L30 L/yearUS $ 23.40/year
Waste reductionUS $ 0.50/m329.2 m3/yearUS $ 14.60/year
Total Annual BenefitsUS $ 104.24/year
8Initial investmentDigester costUS $ 736.431 unitUS $ 736.43
Installation cost
Transportation cost
Total Initial InvestmentUS $ 736.43
Annual costMaintenance costUS $ 3.88/blower2 blowers/yearUS $ 7.76/year
Operational cost---
DepreciationUS $ 736.43/digester1 digester/10 yearsUS $ 73.64/year
ElectricityUS $ 0.05/kWh4.38 kWh/yearUS $ 0.22/year
Total Annual CostUS $ 81.62/year
Annual benefits (best-case scenario)LPG replacementUS $ 0.46/kg36 kg/yearUS $ 16.56/year
Bio-slurry salesUS $ 0.78/L1200 L/yearUS $ 936.00/year
Waste reductionUS $ 0.50/m37.7 m3/yearUS $ 3.85/year
Total Annual BenefitsUS $ 956.41/year
Annual Benefits (actual situation)LPG replacementUS $ 0.46/kg36 kg/yearUS $ 16.56/year
Bio-slurry salesUS $ 0.78/L8 L/yearUS $ 6.24/year
Waste reductionUS $ 0.50/m37.7 m3/yearUS $ 3.85/year
Total Annual BenefitsUS $ 26.65/year
In the best-case scenario, the NPV of the fixed dome bio-digester in RW 11 is US $33,115.36 and the NPV of the portable bio-digesters is US $5268.20 both are positive (above zero), meaning all are potentially feasible from an economic perspective. However, in actuality, the NPV of both bio-digesters is negative, −US $ 4814.27 and −US $ 1113.75 for fixed dome bio-digester and portable bio-digester respectively. It implies that the biogas production from food waste is currently not cost-effective.
Low bio-slurry sales are the main reason for the negative NVP. The low bio-slurry sales is caused by the lack of market support for bio-slurry and financial incentive to make the bio-slurry’s price acceptable in the market. Since it is produced from waste and does not require much time in the case of composting, it is often argued that the bio-slurry should be cheaper than its counterparts like compost, whereas it currently has a similar price (the price of compost per kilogram is currently the same as that of bio-slurry per liter, US $0.78). The significance of bio-slurry sales is also found in previous research [51].
Although biogas is produced in large amounts, LPG replacement is currently not the biggest economic added value. This is due to the current inefficient distribution caused by low biogas pressure (compared with LPG) and relatively cheap LPG prices due to subsidies. This can, of course, be changed by altering the policy of subsidizing LPG (e.g., reduce LPG subsidies or introduce similar subsidies to biogas use) or by applying some technical improvement.
While bio-slurry as an organic fertilizer is considered the largest source of income, the fact is that the sales are currently not sufficient to make the NPV positive. This finding can be seen as a barrier to the large-scale introductions of household level bio-digesters in Indonesia. Supporting the introduction and entry of the bio-slurry to the market by government or private sectors can become a powerful means to make biogas production from food waste economically feasible, and at the same time, attract more people to use biogas production as their waste treatment method. Additionally, reducing LPG subsidies or introducing technical improvements to increase biogas pressure may increase the added value of LPG substitution, making the economic relevance of biogas production higher.
In order to estimate the impact of the proposed improvements towards the NVP results, a sensitivity analysis is carried out. The new NPV after improvements is compared to the former value and the difference is then calculated. The percentage of change of the output (NPV) is divided by that of the change of the variable (improvement) to find the sensitivity value. The monetary value of LPG substitution and bio-slurry sales are chosen as the determining variables because they have a high potential contribution to the NPV. The economic value of the LPG replacement can be maximized if the LPG subsidy is withdrawn, increasing the current price, US $ 0.46/kg to US $ 1.00/kg and technical improvements such as increasing the biogas pressure and distribution are applied. According to the information obtained from the appointed biogas technician in Cibangkong, these technical improvements may lead to the higher rate of LPG replacement, 576 kg/year and 144 kg/year for RW 11 and RW 8 respectively. It is also assumed that with the government intervention to promote bio-slurry to the markets and provide the necessary incentives, for instance through partnerships with agricultural department, urban farming programs, and organic plantation companies, that the sales can achieve a half of the maximum, 2400 L/year and 600 L/year for RW 11 and RW 8 respectively. Table 3 below briefly shows the result of the sensitivity analysis.
Based on all figures presented above, several highlights may be generated. Technical improvements plus LPG policy reform and market supports for bio-slurry appear to have a stronger influence on NPV for the fixed dome digester in RW 11, as indicated by the higher sensitivity values. When comparing the two options of improving technical performances and supporting bio-slurry market penetration, the former tends to have a greater significance. Technical improvements, however, require higher capital investments, while policy reforms normally takes longer because of the numerous political interests.
It should be noted when discussing the benefits in relation to the economic feasibility, that the benefits are, in fact, distributed among different stakeholders. For example, LPG reduction is beneficial only for people who use the biogas; bio-slurry is only beneficial for the people who are able to sell it; waste reduction (related to the reduction of waste transport costs) is beneficial to the sanitation department. That means that the benefits are difficult to cultivate. A possible step forward can be to encourage other stakeholders, such as the sanitation department or the agricultural department to participate because they actually have or potentially will get the benefits.
Table 3. Costs and benefits of fixed dome digester in RW 11 and portable digester in RW 8.
RWScenarioVariableLPG PriceUnitAnnual BenefitNPVSensitivity
11Current situationLPG replacementUS $ 0.46/kg144 kg/yearUS $ 66.24/year−US $4814.27-
Bio-slurry salesUS $ 0.78/L30 L/yearUS $ 23.40/year
Technical improvement and LPG policy reformLPG replacementUS $ 1.00/kg576 kg/yearUS $ 576/yearUS $382.480.14
Market supportBio-slurry salesUS $ 0.78/L2400 L/yearUS $ 1872.00/yearUS $14,031.270.05
8Current situationLPG replacementUS $ 0.46/kg36 kg/yearUS $ 16.56/year−US $1113.75-
Bio-slurry salesUS $ 0.78/L8 L/yearUS $ 6.24/year
Technical improvement and LPG policy reformLPG replacementUS $ 1.00/kg144 kg/yearUS $ 144/year−US $238.990.1
Market supportBio-slurry salesUS $ 0.78/L600 L/yearUS $ 468.00/yearUS $2055.810.04

4.2. Social Acceptance

The continuity of a particular project does not necessarily depend on economic return only, but rather on social acceptance as well. Even though the NPV is currently negative, the pilot project still keeps running despite considerable obstacles in the field. Studying the social acceptance thus gives a valuable insight to the existing problems as well as the opportunities. It may eventually generate lessons that are indeed useful for any future actions. As such, the social acceptance is further addressed in the following sections. Since waste management is often one of the primary tasks for women in developing countries, a gender perspective is also offered.

4.2.1. Gender Disaggregated Data

As indicated earlier, gender-based social situations may affect the acceptance towards the project. In such cases, gender disaggregated data for both RWs may give preliminary backgrounds for further socially related investigations. The comparison of social conditions between men and women can indeed influence the management model and its success. Table 4 compares the gender-disaggregated data between RW 11 and RW 8. The gender aspects are selected from Singh et al. [52] as they are perceived to be relevant to represent the basic gender equality parameters. The analysis also follows the same method presented in that study. The data is obtained from interviews with local officials who work for a local administrative unit one level above RW called “Kelurahan”, direct observations, and complimentary estimation when needed.
Table 4. Comparison of the gender disaggregated data between RW 11 and RW 8.
NoGender AspectRW 8RW 11
NM (%)F (%)INM (%)F (%)I
1Population155252.4%47.6%-293850%50%-
2Illiteracy837.5%62.5%1.73655.6%44.4%0.8
3Not enrolled in primary education837.5%62.5%1.74062.5%37.5%0.6
4Inability to make decision 1-52.4%47.6%0.9-27.9%72.1%2.6
5Economic inactivity54321.6%78.4%3.6127110.0%90.0%9
6Income difference-91.4%8.6%--94.6%5.4%-
7Total aggregated index 2.0 3.2
N = number of population; M =Male; F = Female; I = Gender Index. 1 The table represents the percentage of the men and women who have no influence in the local decision making processes. The calculation is rooted in the percentage of men and women representatives in Cibangkong and its detailed method may be found in Singh et al [52].
As can be seen in Table 4, RW 11 has a higher total aggregated index compared to RW 8 (also supported by the fact that the income difference is a bit higher in RW 11). It indicates that women in RW 11 are less equal in the social viewpoint in comparison to men. It may also lead to the situation where women have fewer opportunities to participate, contribute, or take part in society as the domination of men can, to a certain extent, suppress female involvement. On the other hand, women’s involvement is necessary as they play important roles in their household and community—which are also relevant to the “waste-to-biogas” conversion project in Cibangkong—as shown in Table 5.
According to Table 5, women dominate the roles of managing waste, kitchens, food, and energy at the household level. Increasing women’s involvement can thus be beneficial for a waste conversion project, such as the one in Cibangkong, since it deals with food waste and cooking fuel. This fact also explains why most of the respondents in this study are women.
The gender roles on a community level seem to be similar to the household level whereby women are in charge of child health care and cleaning-associated tasks, while men are in charge of physically intense jobs. With respect to waste management, however, an interesting finding from a gender perspective is that the roles change from women at a household level to men at community level. This is due to the fact that managing waste at a community level requires extra physical work such as pulling the heavy waste trolley, compacting a huge amount of waste, and loading the waste truck, and thus men take over this task.
As described above, the management models in the RWs are different. While cooking fuel management in both RWs is similar (dominated by women), the waste management is not. In the centralized model that is implemented in RW 11, the waste management is dominated by men whereas in RW 8 where a household-oriented approach is applied, it is dominated by women. This is further expected to influence the community acceptance.
Table 5. Gender roles in household and community levels in Cibangkong.
Roles (Scoping Cibangkong Areas)Gender Domination
Household
  • Working to provide household income
Men
  • Managing household income
Women
  • Owing the house
Men
  • Regulating kitchen/food expenditure
Women
  • Managing front/backyard/plantations
Women
  • Responsible for health/child care (bringing the children to the local immunization program, routine health check, and having the children showered and dressed)
Women
  • Managing household waste
Women
  • Providing transportation (picking up children from school or women family members to the market)
Men
  • Owing the land
Men
  • Managing energy (paying electricity bill, buying LPG)
Women
  • Maintaining the physical properties of the house (fixing rooftop, painting house, fixing broken furniture and home appliances)
Men
  • Washing clothes
Women
  • Shopping for basic home basic necessities (foods, kitchen appliances, home decoration)
Women
  • Cooking foods
Women
Community
  • Cleaning the communal streets (cutting grasses, clean up the waste around them)
Women
  • Constructing several public facilities (building security guard post, gates normally from bamboo)
Men
  • Cleaning up public facilities such as mosque and meeting hall
Women
  • Providing and cooking foods for communal events such as local sports competitions, and religious-based events
Women
  • Managing communal waste (transferring waste from households to the local landfill and doing household waste separation)
Men
  • Organizing child health care program (immunization, vaccination)
Women
  • Participating in night security guard operations (normally every night several groups of men will walk around neighborhood to guarantee the citizens are safe from any unwanted events such as robbery and fires)
Men

4.2.2. Community Acceptance

As aforementioned, the community acceptance covers three different aspects: procedural justice, distributional justice, and trust. The procedural justice and trust aspects were investigated via interviews that were held with community representatives in both RWs as specified in the Table 1. The distributional justice was investigated using Likert-scale questionnaires due to the relatively larger number of subjects. The results are generalized in Table 6.
Table 6. Results of community acceptance analysis.
NoAspectParameterRW 8RW 11
1Procedural justiceParticipationAlmost all representatives participatedLack of participation from local officials
VoicePositive responsesA mix between, negative, neutral and positive responses
InformationPositive responsesPositive responses
2Distributional justiceOutcome fairnessPositive reviewsLack of willingness to share burden
Outcome favorabilityFavorable: biogas, bio-slurry, LPG saving. Not favorable: fluctuated biogas, bad smell from bio-digester. Easily broken blowerFavor toward: biogas, bio-slurry, LPG saving. Not favor: fluctuated biogas, easily broken blower, low salary, lack of support to promote bio-slurry to the markets, unseparated waste (mainly experienced by local waste collector)
3TrustCapabilitiesPositive responsesA mix between neutral and positive responses
AttitudePositive responsesPositive responses
ApproachPositive responsesPositive responses

RW 8

The procedural justice aspect in RW 8 seems to be well accepted and is supported by the fact that most community representatives contribute to the development of the biogas project and express positive remarks. Involved groups in RW 8 commit to participate. They are satisfied with how the proponents respond to their voices, and the information given by the proponent is found useful according to community representatives.
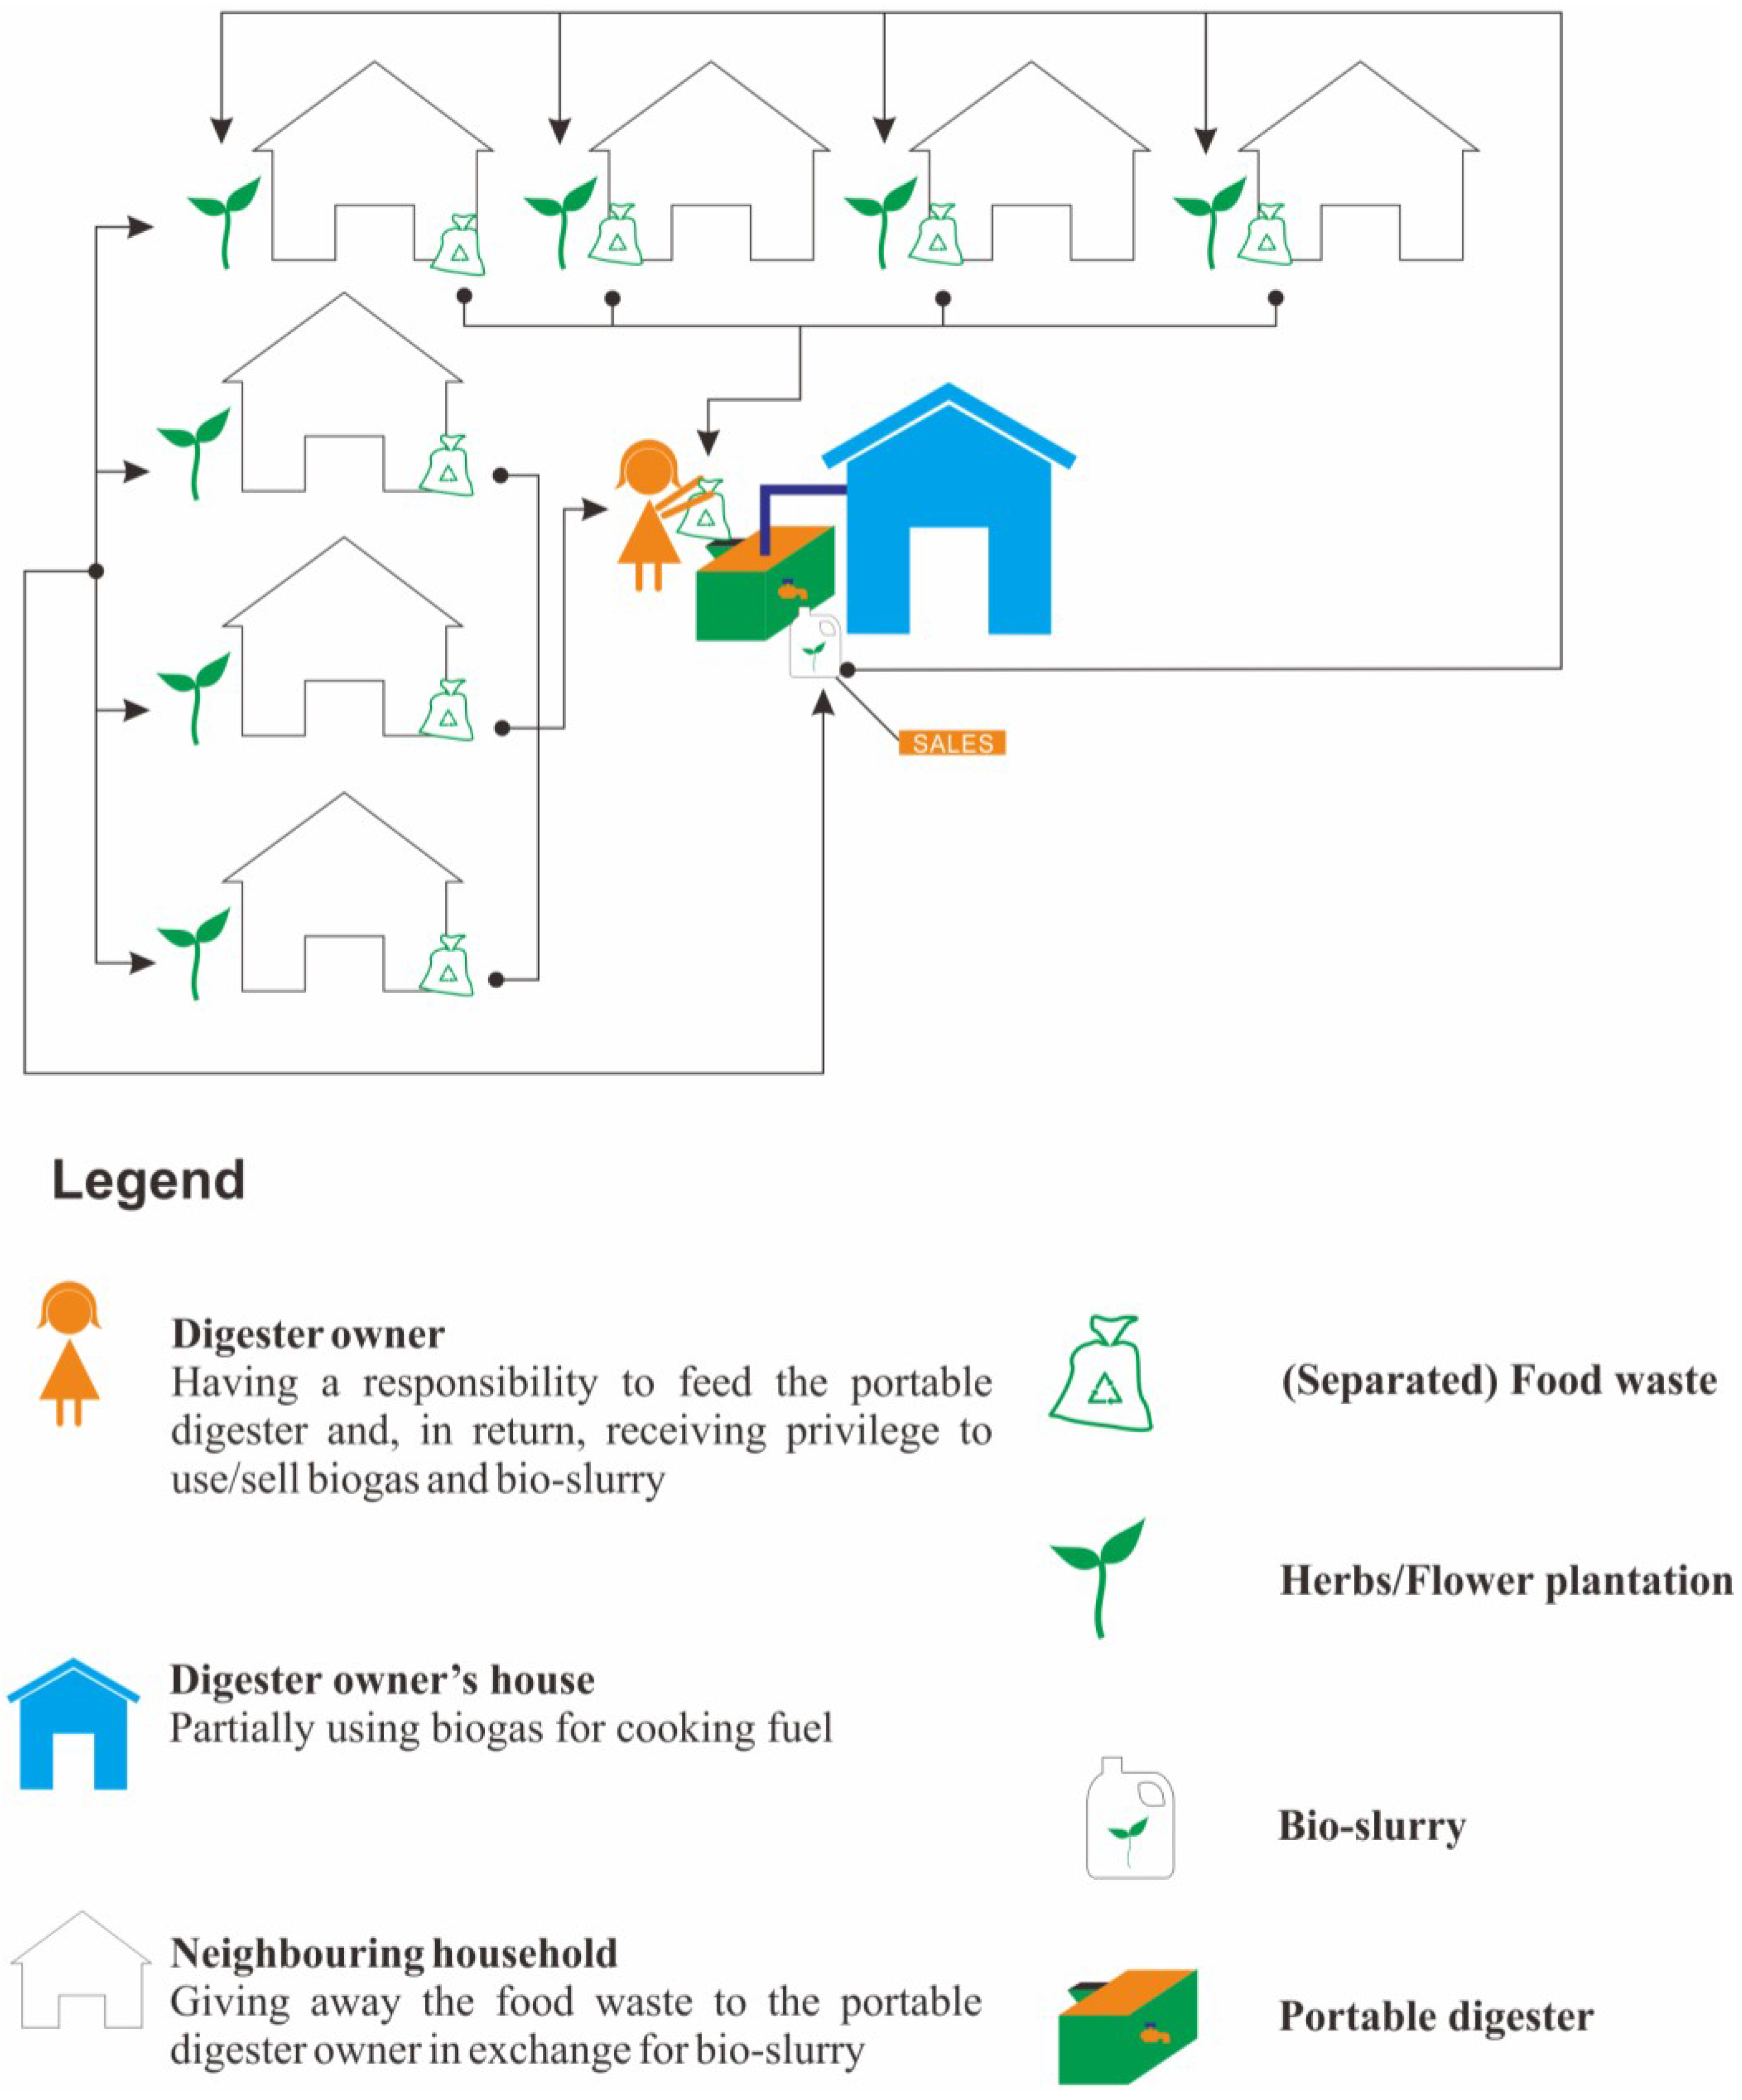
Outcome fairness is well established since the community representatives participate (part of procedural justice) to build good cooperation between the bio-digester owners and the neighbors around them. They are willing to share both benefits and burdens. For instance, the bio-digester owners are not reluctant to share the bio-slurry for free with neighbors (some neighbors like growing herbs, spices, and flowers in their back/front yard so bio-slurry is quite useful) since they provide and separate the waste for the bio-digesters. Generally, favorable outcomes are reported to be: biogas production, bio-slurry, and LPG saving. However, there are still concerns regarding the stench that rises from rotten feedstock inside the bio-digester and blowers that are not durable and often break down.
The trust aspect, which covers capability, attitude, and approach of the project’s proponents, shows many positive responses. The proponents are well accepted in the community. The Cibangkong residents were approached door-to-door (considered very polite in common Indonesian culture), and the information given (part of procedural justice) positively influenced how local residents perceive the proponent’s capability.
From a gender perspective, women’s involvement is very strong in RW 8. Regarding community leaders and organizations involved, all women organizations including PKK and My Darling work together in almost all stages of the project. They are committed to the project and make sure all households are aware of the program, thus the level of acceptance is found to be higher in RW 8. Furthermore, the Head of RW 8 who is also a woman, along the Head of PKK and My Darling—and their female members—frequently attend the religious activity in a local Mosque while discussing neighborhood-associated issues. These women groups have close ties with each other and have previously collaborated in organizing several women empowerment programs such as women health care program, urban farming, and a clean neighborhood competition.
On the household level, women are very involved in the operation of the digesters, both the owners and the neighboring households. Relevant activities such as waste separation, feeding the digester, using the biogas and the fertilizers are all done by local women. Since the total gender aggregated index in RW 8 is higher, it can potentially further explain the higher involvement level. The owners of the portable digesters in RW 8 also have a mutual interaction with the local women groups since they are the members of PKK and My Darling as well. They join the same religious activity in RW 8, giving them opportunities to make contacts and discuss the project. It is also found that the portable digester owners have a higher education level or welfare. The implication is that they receive much respect from the neighboring households and in return get the food waste already separated. Gardening activities seem to be common, thus sharing the bio-slurry is favorable and will be a good incentive to educate households in RW 8 about the importance and benefits of better waste management practices.
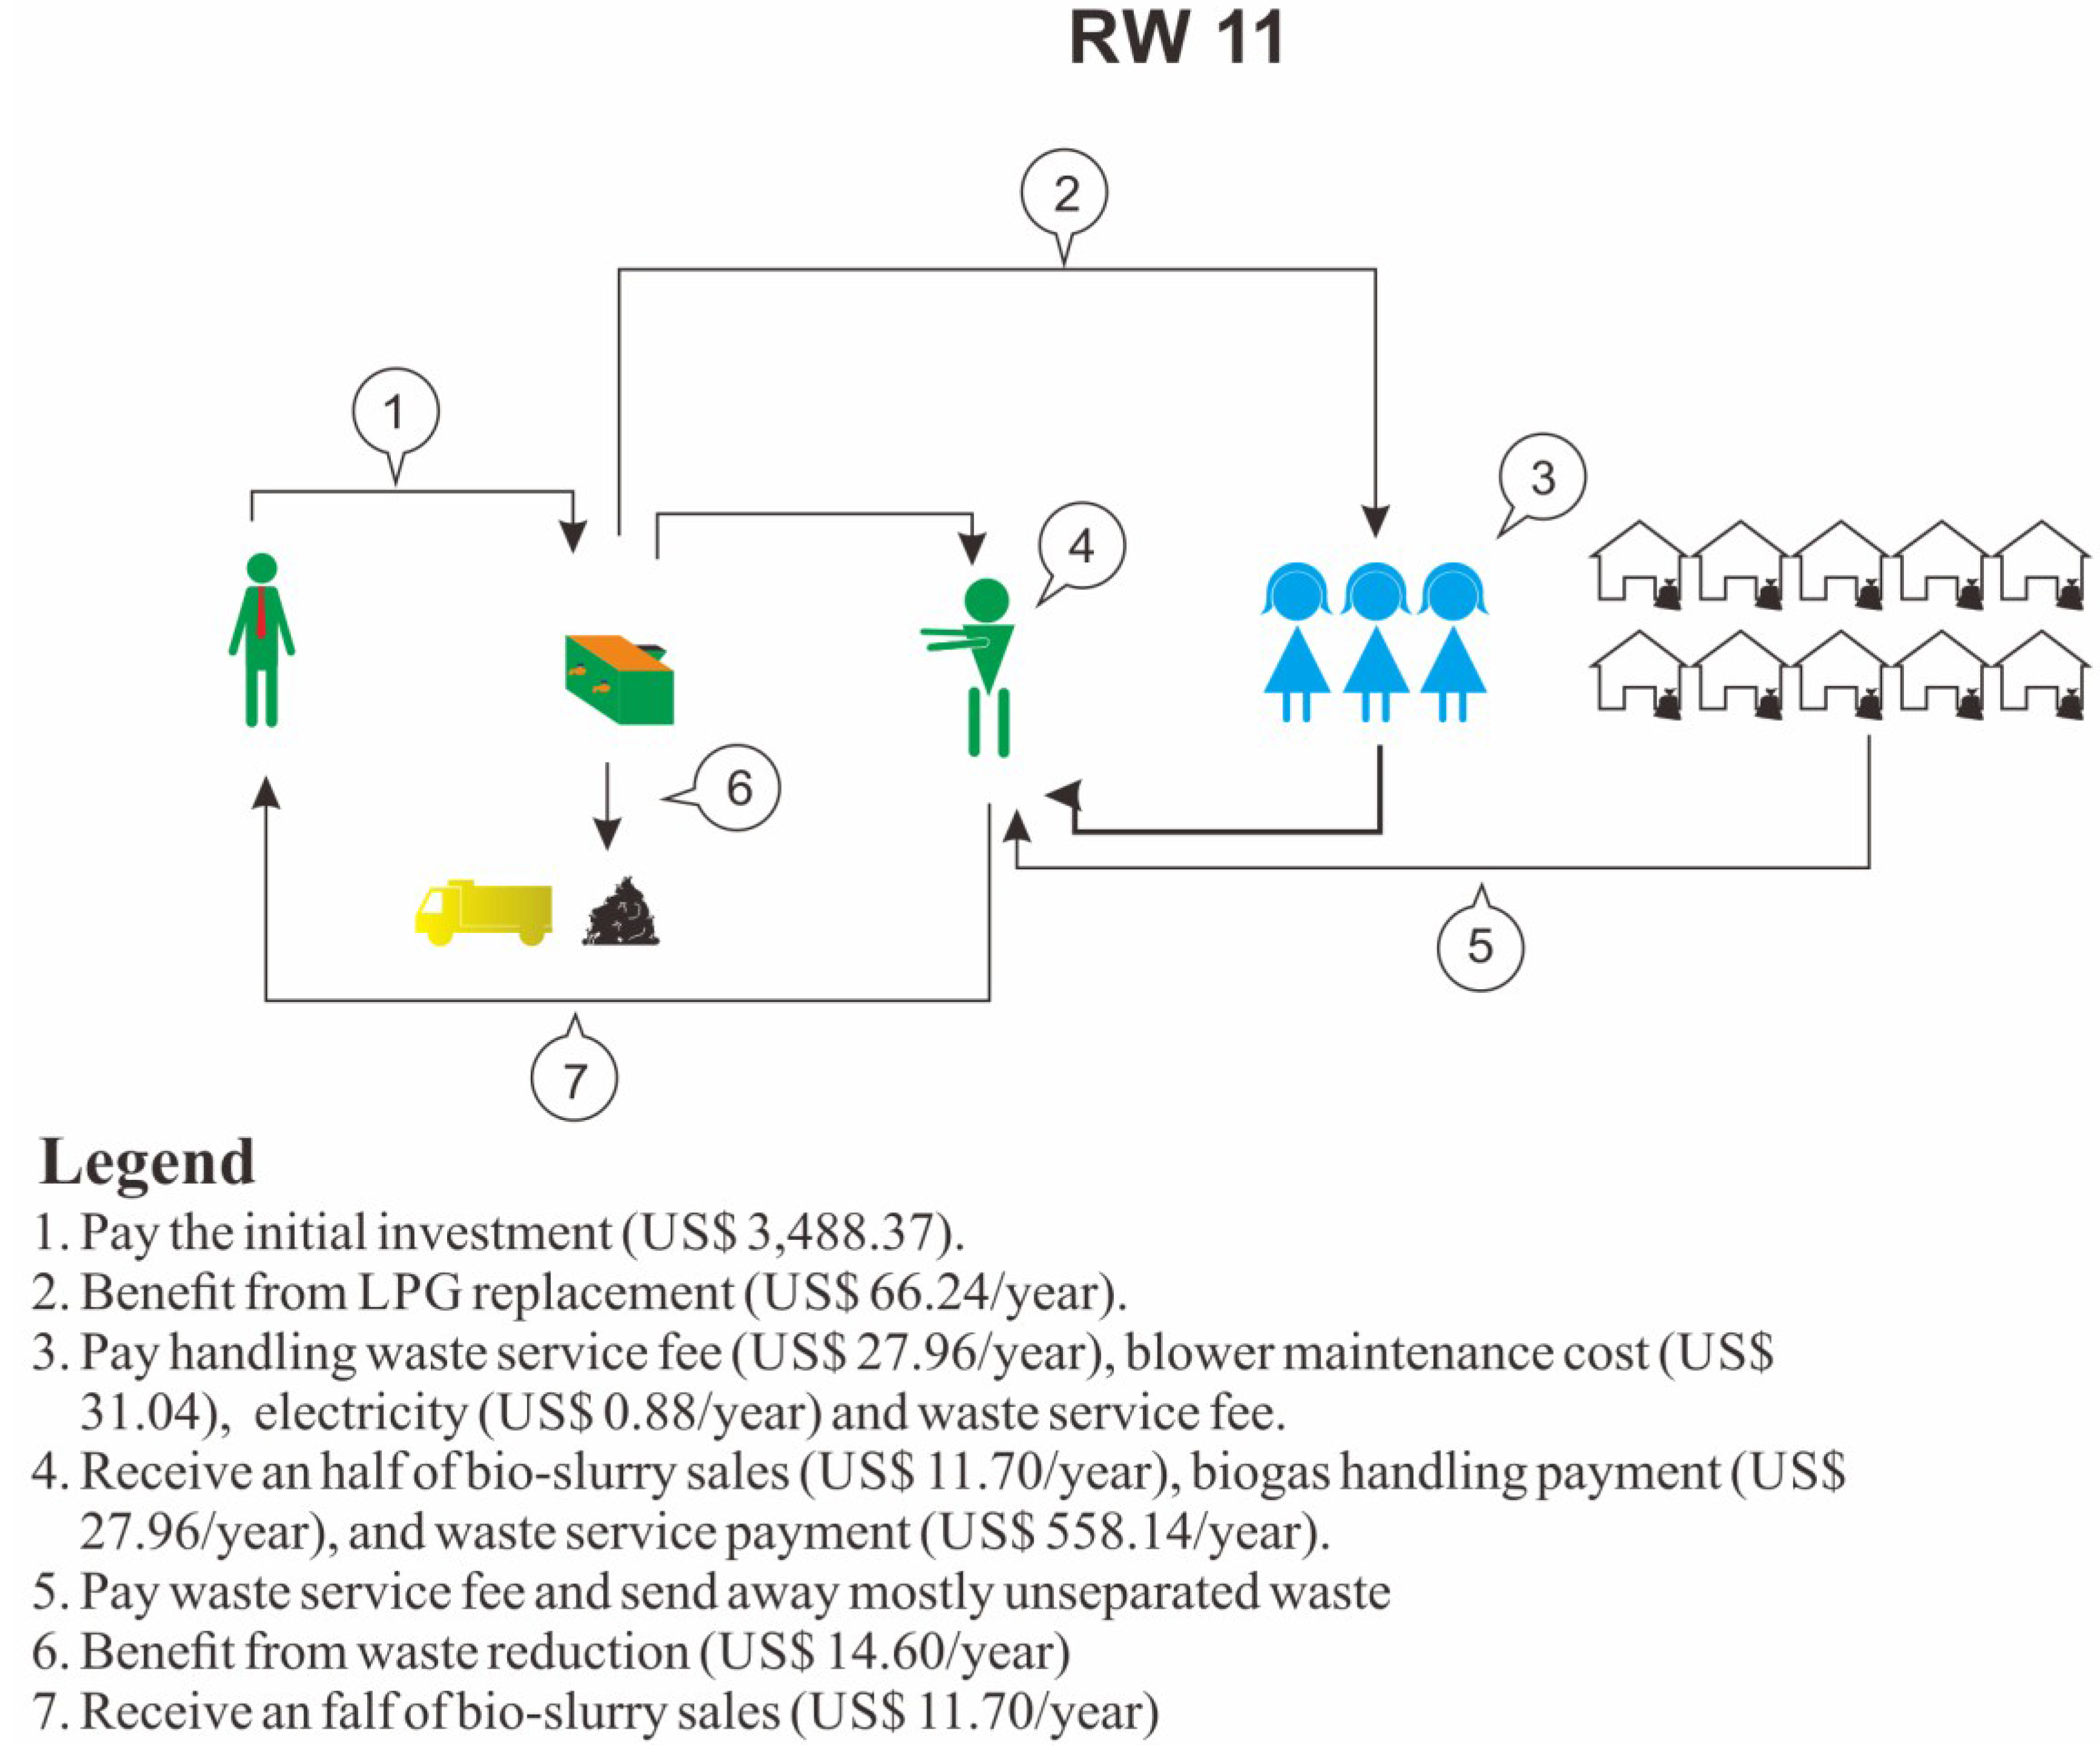
RW 11

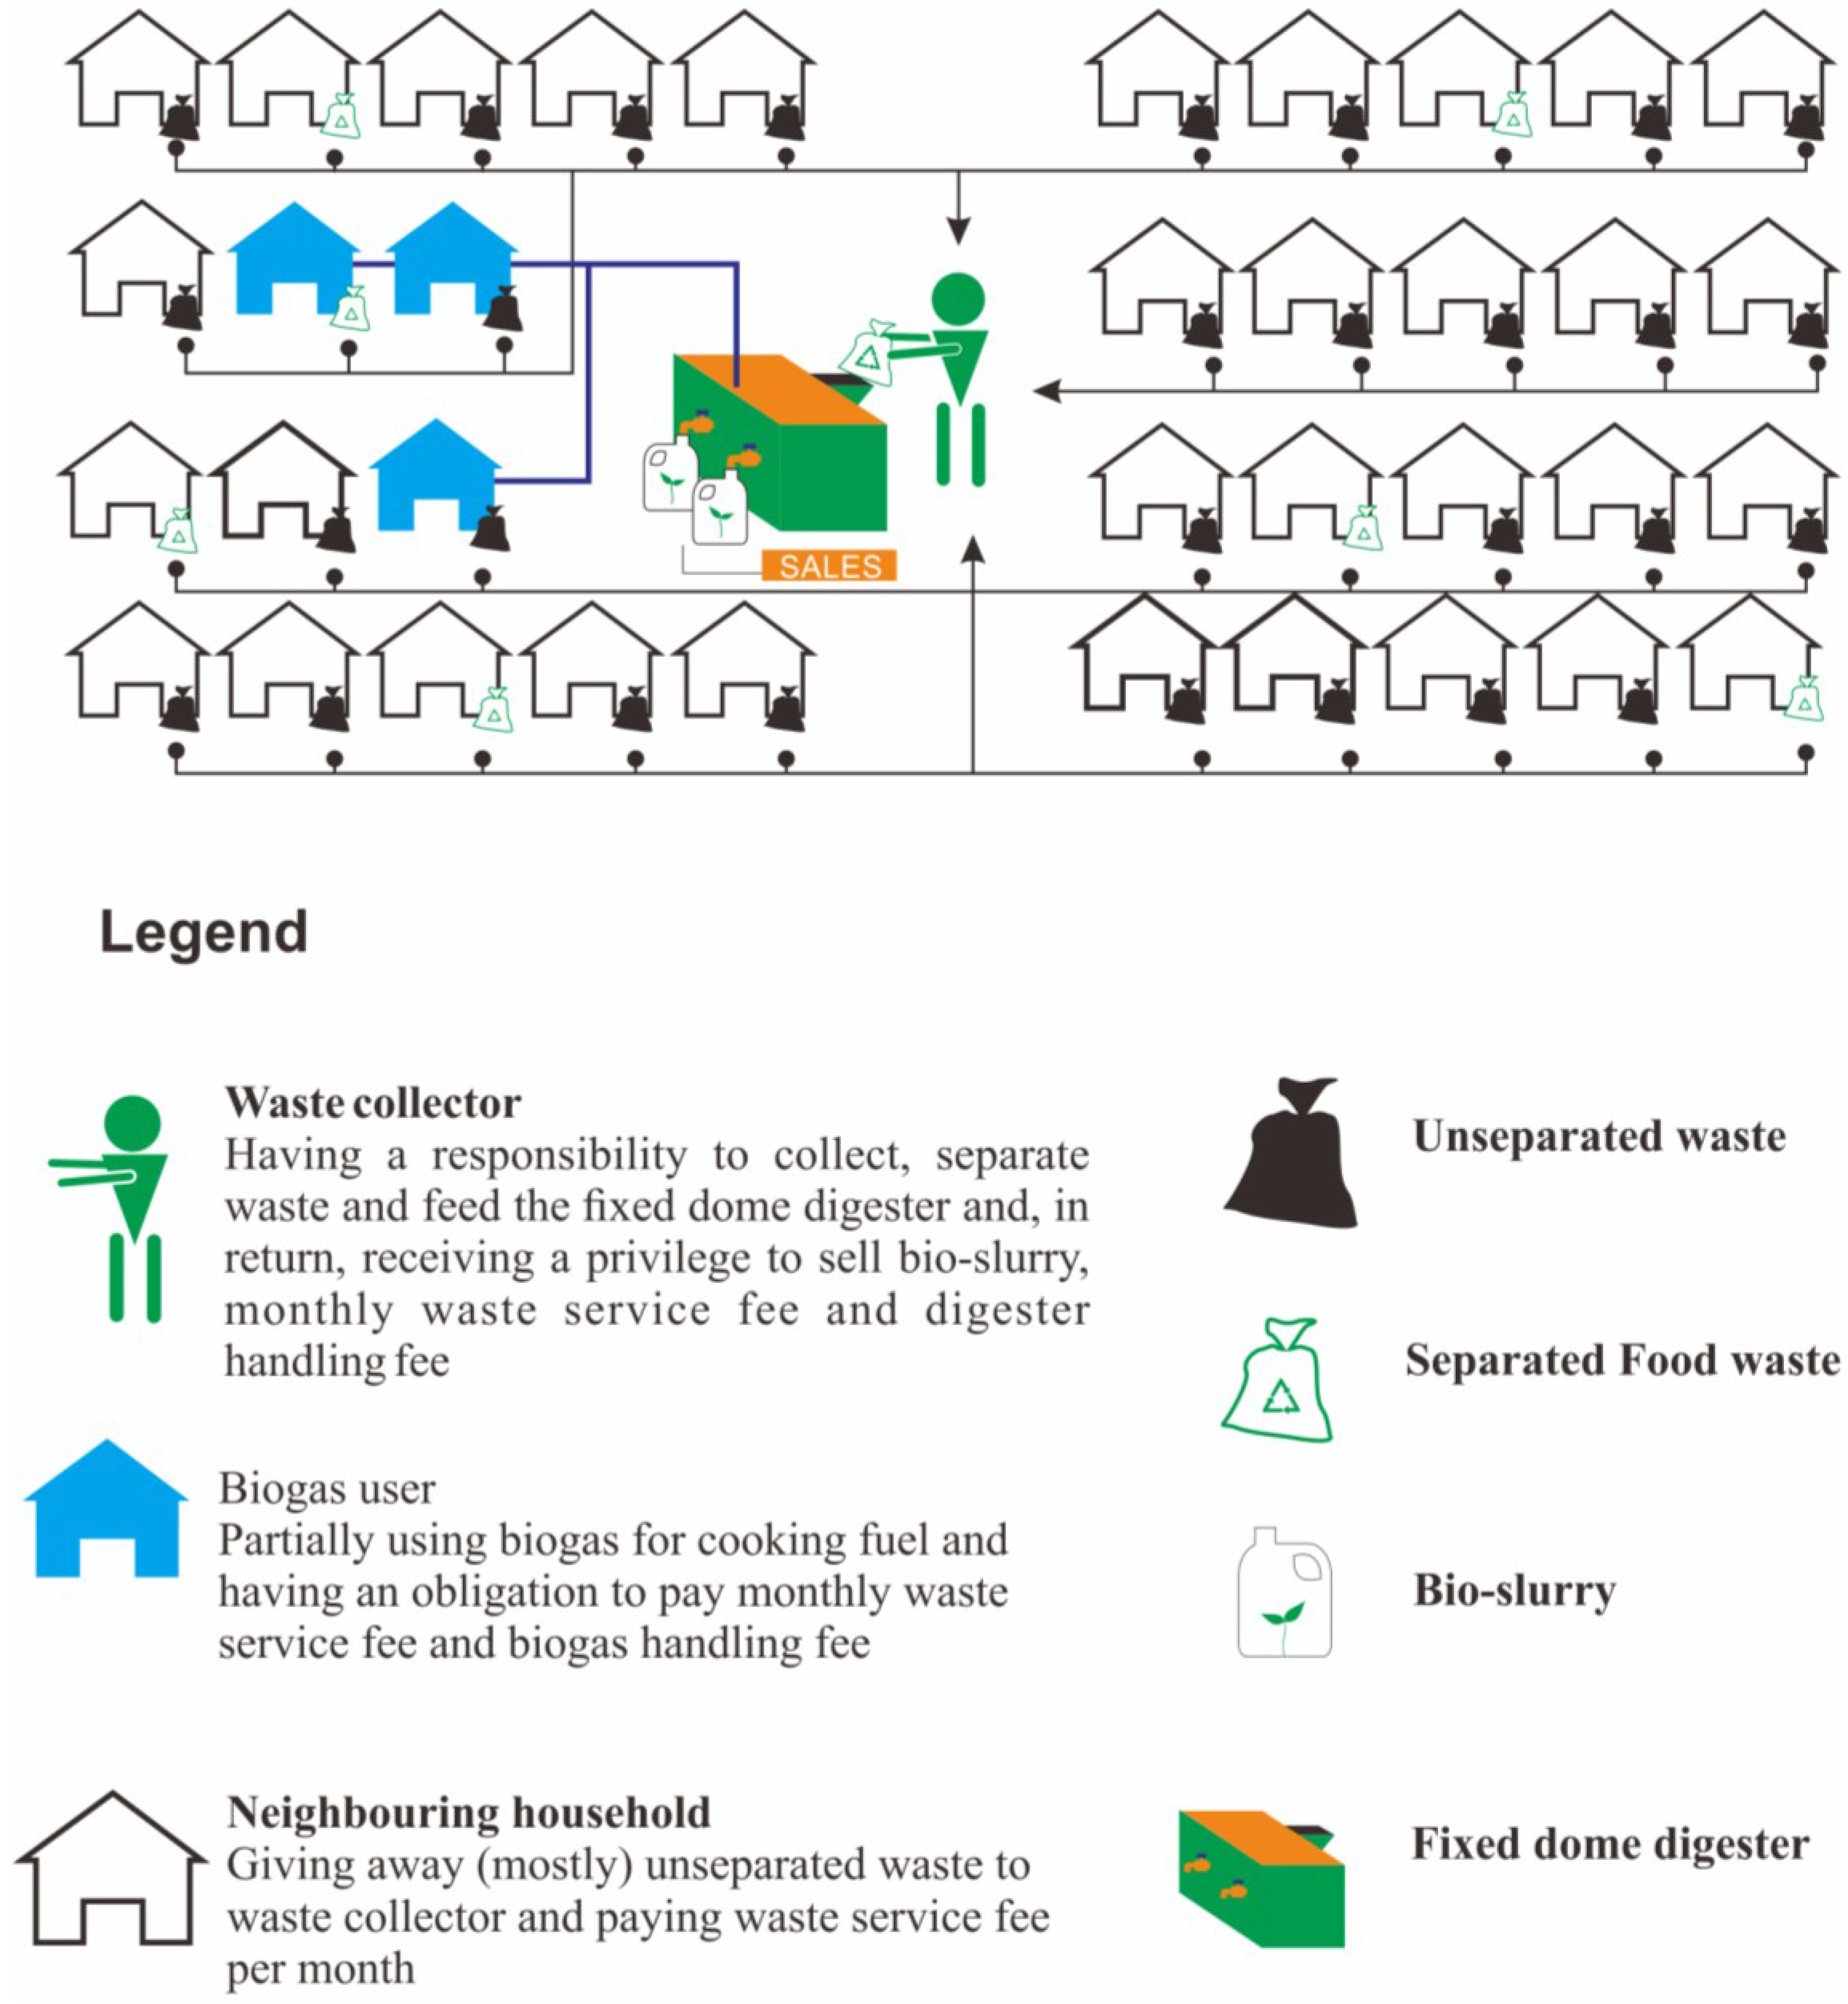
The results for RW11 show a slightly different picture, mainly regarding the level of participation of local officials and regarding the outcome fairness. In RW 11, community representatives like the head of the RW and the head of PKK are not active in the implementation stage. Although they attended the meetings in the planning stage, they remained in the background in the implementation stage and let the main activities be led and organized by the head of My Darling. Their position is that they are busy with their formal occupation, and that it is better to let the other organizations (referring to My Darling) that are in the field and have more time take the lead in the implementation stage. Their absence in the implementation stage leads to neutral reaction towards the “voice” parameter. However, the head of My Darling states that the proponents address the people’s voices really well. The negative responses regarding the “voice” are expressed by the local waste collector. He feels that his requests, such as one to lower the price of bio-slurry (as aforementioned, currently considered to be high in comparison to other products on the market), to increase his salary, and to add personnel to reduce his work load have never been seriously considered by the proponents and local authorities.
The negative results for the outcome fairness also originate from the local waste collector and are related to the lack of participation on the community representatives’ side (part of procedural justice). The local waste officer feels burdened with the huge task of separating waste from more than one hundred households and sees more involvement of the community representatives as crucial in raising awareness about the importance of waste separation by the households themselves. In terms of outcome favorability, though biogas and bio-slurry (benefit sides) are favorable, the local waste officer experienced many unfavorable outcomes such as inadequate salary, low bio-slurry sales, and unseparated waste. These unfavorable outcomes appear seemingly because he feels that his voice (part of procedural justice) has not been sufficiently addressed.
The trust level towards the proponents in RW 11 is not as high as in RW 8. Trust levels, especially the capability parameter is also determined by the outcome favorability. For example, unfavorable outcomes (part of distributional justice), such as dysfunctionality of the blower and fluctuating biogas yield led to the questioning of the proponent’s capability by some of the community representatives. In addition, it is also influenced by the information parameter (part of procedural justice). For example, when people feel they were well informed, they tend to feel that the proponents have good capability.
From a gender perspective, the situation in RW 11 is different in comparison to RW 8. Regarding community leaders and organizations involved, the Head of RW 11 is a man who works for almost 10–11 h a day, does not often communicate with the women organizations, and is less involved in the implementation of the project. Furthermore, the Head of PKK and My Darling in RW 11 (both are women) tend to have less interaction, partially because the Head of PKK has to work as a teacher in other area far from Cibangkong. There are also fewer joint ventures by PKK and My Darling groups in RW 11.
One reason could be the economic gap between PKK and My Darling groups in this RW. The Head of My Darling in RW 11 is, in fact, the wife of the waste collector and the initiator of My Darling in Cibangkong. She and other members of the group are considered below the poverty line (some of them are unemployed), and their incomes are less than US $100 a month. Due to their lower welfare, which leads to lower social status, they are mostly involved in sanitation activities (e.g., collecting waste from streets), while PKK members, who have a better social image, are more active in upper class-related activities such as child vaccination programs. In this RW, thus, My Darling has little influence over increasing participation in solving the waste issues due to their lower social status. On the other hand, PKK groups seem to be reluctant to be more involved despite their higher capacity in raising awareness. On a household level, since in this management model there is no direct involvement of households and in the absence of awareness regarding the importance of waste separation—a responsibility of the women in the households, most of the work is left to the community waste collector. Furthermore, the total gender aggregated index in RW 11 is higher than in RW 8 and may further explain the lack of participation in this RW. This, however, needs to be further studied.
To summarize, regarding community acceptance in the location of study, barriers that are reported include both technical (e.g., inefficient blowers, uneven biogas yield) and non-technical (e.g., lack of participation by women-based local officials, lack of voices being heard) elements. Both affect the different aspects of community acceptance. While the technical barriers are reported in both RWs, the non-technical barriers are found mainly in RW 11, especially the inadequate cooperation between women organizations, inadequate waste separation on a household level and the subsequent dissatisfaction of the waste collector. As such, an important finding is that differences in the level of community acceptance can be seen between the two RWs. This can be attributed to the different management models and the non-technical barriers evolved around both RWs. In RW 8 with smaller bio-digesters that are being operated on a smaller scale by few neighboring households, with strong involvement of women, the level of involvement in the operation of the digesters and satisfaction from the process is higher than in RW 11 with a bigger scale bio-digester and more centralized management model. For example, the waste collector’s dissatisfaction from his increased task of separating the waste and feeding the bio-digester while he is not being well compensated. This is caused by waste not being separated by the households themselves (thus increasing his work load) and by his feeling that his voice is not being heard with regards to his income. The unseparated waste is a manifestation of the lack of collaboration between relevant organizations, which in this case are women organizations, and as a result, lower awareness and active involvement of women in the households regarding waste separation. It is also found in this research that the bio-digester size/scale effects the management scheme which effects the level of acceptance thus, if and when bigger scale bio-digesters are introduced, further steps may be needed (such as more involvement of community leaders, more effort in getting households—meaning women within these households—to separate waste at the source, and better financial compensation for waste collectors) if the level of acceptance is to be higher.
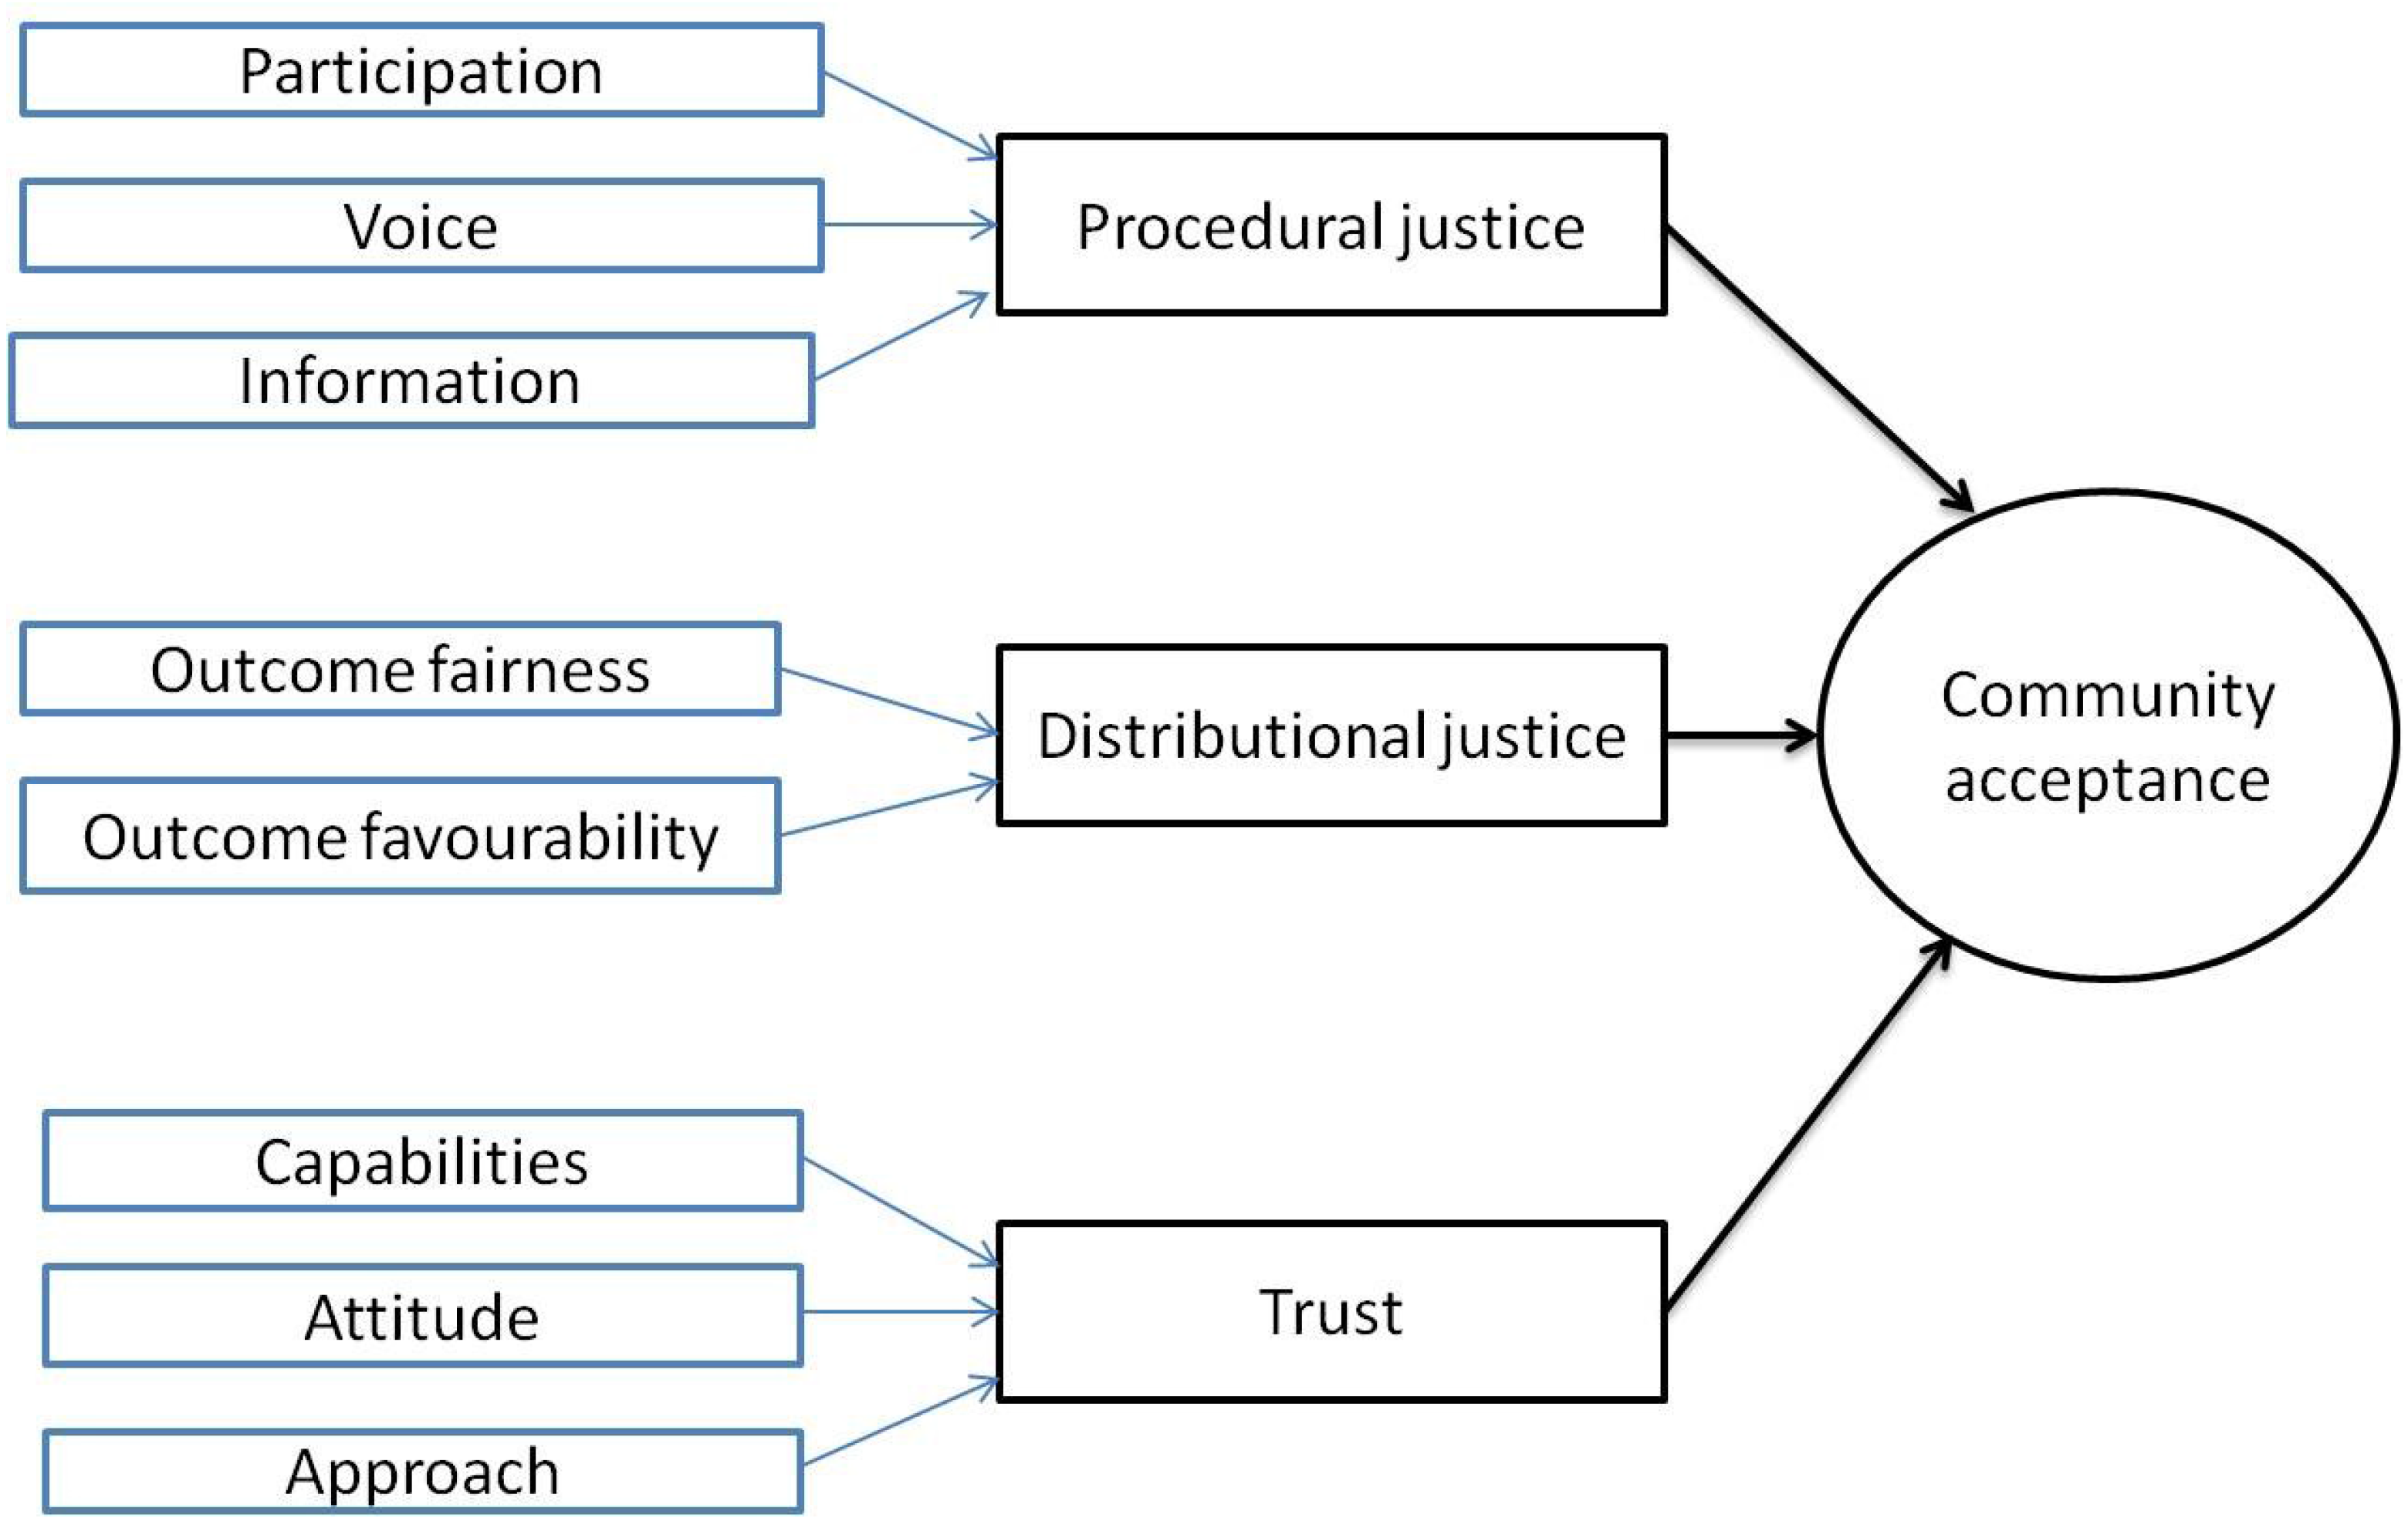
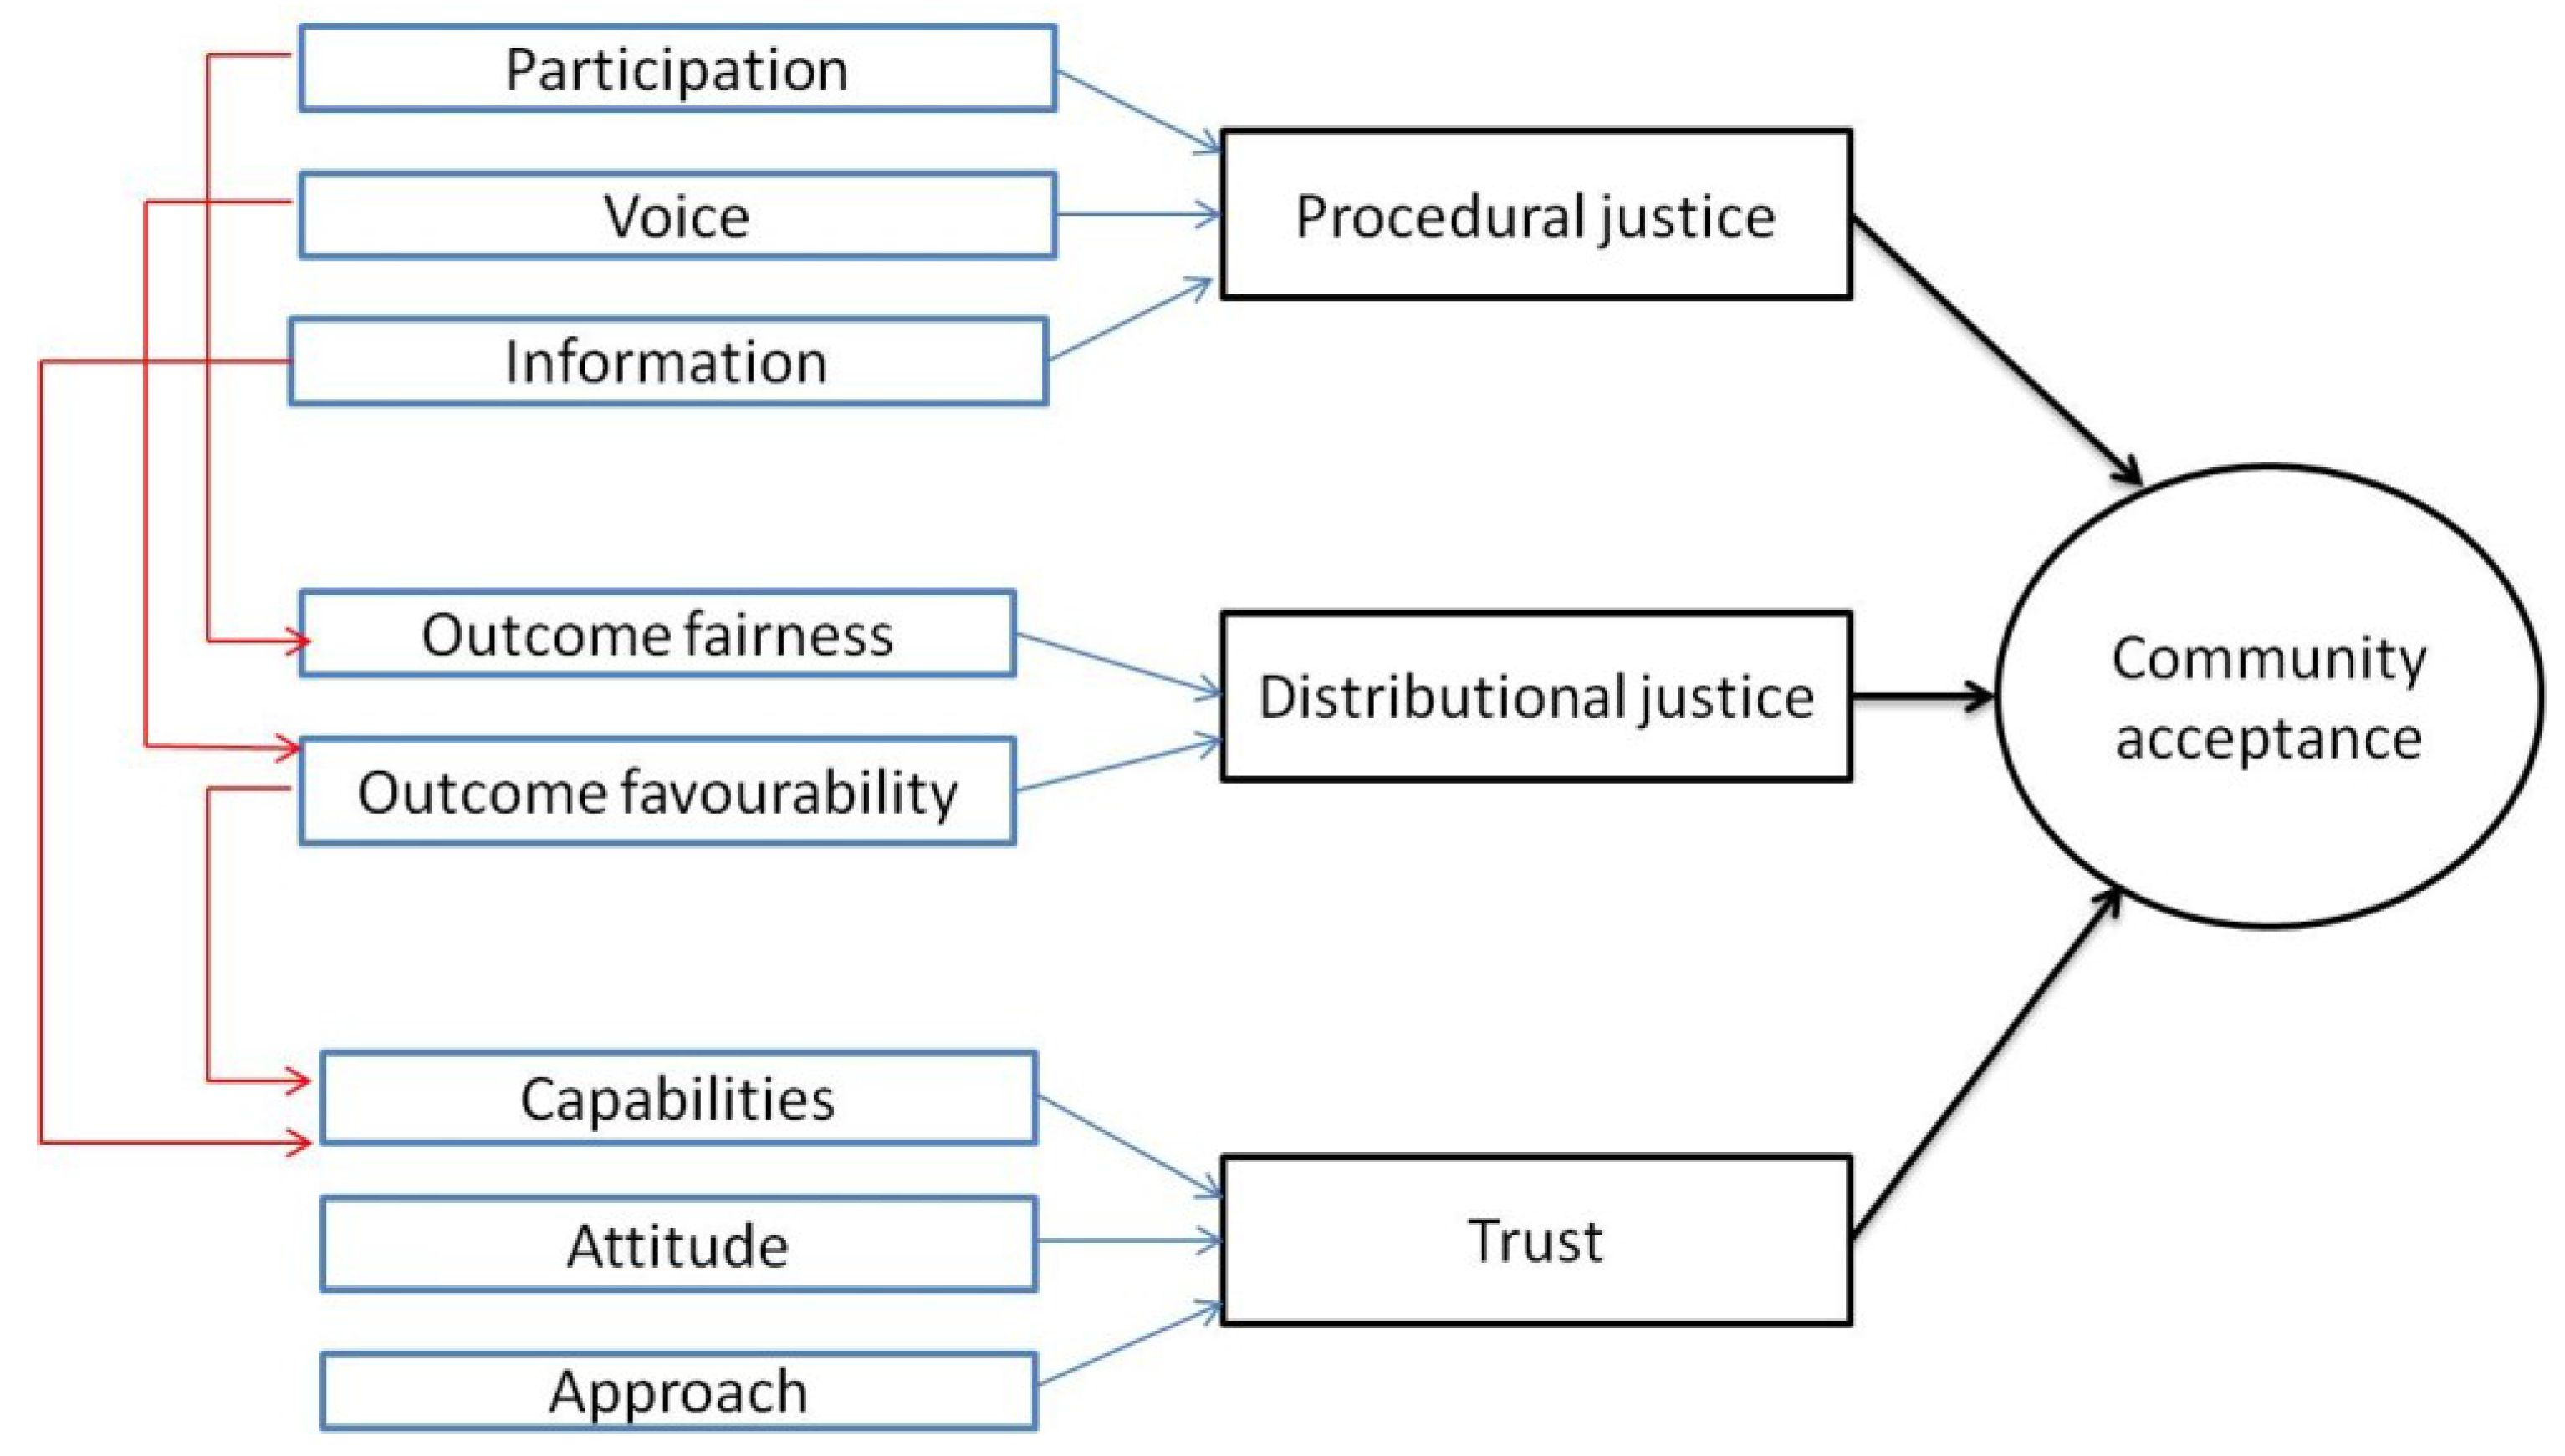
In Figure 6, the community acceptance and how it can be constructed from its components is illustrated. There are some important notes regarding this schematic diagram. All lines in the picture only represent the indication of influence, not its significance. The connections between the components are elaborated based on statements and opinions collected during the data collection. It needs more quantitatively statistical analysis to prove the correlation and its significance. Furthermore, the analysis only scopes the interaction between one component in one particular aspect to another component in a different domain area (for instance, participation in the procedural justice aspect may influence outcome fairness in the distributional justice aspect). An interaction between components in one particular aspect (for example, participation against voice) may possibly occur. However, it is out of the research boundaries and may be studied in any further research. This can thus be seen only as an indicative finding.
Regarding some of the barriers related to community acceptance which are found in this research, possible solutions may include strengthening the participation of officials from local women’s institutions (PKK and RW), giving better opportunities to all voices, especially the waste operator (RW 11), and sharing the incurred burdens as the communal entity to guarantee a fair distribution of outcomes. Along with non-technical solutions, improvement on the quality of the blower and the consistency of the biogas production may also bring positive impacts as these are currently connected to a lack of favorable outcomes, and in turn, reduced trust.
Figure 6. The construction of community acceptance in the studied case.
Recycling 01 00061 g006

5. Conclusions

The paper reflects on a pilot project for food waste reduction through biogas production on a household level in an urban setting in Indonesia. The indicative findings can be valuable both academically and practically. In an economic perspective, the conversion of food waste into biogas in Cibangkong is currently not feasible, although, the NVP value of both types of bio-digester has the potential to be highly positive (in the best-case scenario). The existing market condition of bio-slurry is the main factor that brings NPV of both bio-digesters into negative values. In the short term, putting effort into assisting market entry and increasing income from the bio-slurry is expected to increase the economic feasibility of the bio-digesters. In the long term, reducing subsidies for LPG and/or introducing similar subsidies to biogas may also increase the benefits, and thus relevance of biogas production from food waste on household level. Although the bio-digesters in the location of study were donated and not financed by the actual households, the findings regarding their economic feasibility can be relevant in any future application of similar bio-digesters in other financial schemes, such as soft loans and credits.
Regarding community acceptance, it is shown to be mostly determined by the procedural justice aspects. Distributional justice and trust also influence the community acceptance, though indicatively less than procedural justice. Gender roles and women’s involvement level in the managerial aspects are likely to play a key role in successful implementation. The participation of groups of women can further reinforce greater community acceptance.
The level of acceptance is also found to be related to the size of the bio-digester, which in turn determines its management scheme in relation to the procedural justice. While it cannot be concluded that the size itself results in lower acceptance, it does imply that more procedural justice aspects, such as more involvement of community leaders, more participation of the local community (women) in waste separation at the source, and more effort put into compensating the local waste officer, may be needed more in the case of larger bio-digesters than in the case of smaller ones in order to increase acceptance levels.
Based on the results of this study, several recommendations can be generated:
  • It will be beneficial to seek technical improvement regarding biogas production and utilization it to reach its potential application, especially in replacing LPG as a cooking fuel and increasing community acceptance for this waste management strategy.
  • Adequate support for bio-slurry to penetrate the market is recommended. It also opens an opportunity to further assess the demand and market condition of the bio-slurry to provide solutions to these problems.
  • Based on the study of community acceptance, establishing procedural justice seems to be very important. Thus, promoting better participation and considering minority voice to guarantee a fair outcome is advised.
  • Involvement of women—mainly in charge of waste management, seems to be very important in increasing successful implementation and social acceptance. Improving cooperation by local women is thus advised.
  • When introducing larger scale bio-digesters as the measures to reduce food waste, more effort may be needed to ensure higher levels of acceptance by local women in participating households, such as community education programs for waste separation at the source, more involvement by community leaders, and better compensation for the communal waste collectors.
It can be concluded that indeed at the moment the NVP is negative, but that looking at the digester as a “single product” model—that is only producing biogas—will make it less financially and economically sustainable. Implementing additional resource recovery such as nutrients by producing, sharing, and selling the bio slurry, is expected to further provide cost-recovery thus making it more financially and economically sustainable. For this, though, support in market penetration is crucial. Although the NVP as calculated in this study is currently negative, additional social benefits such as reducing pollution, improving health, etc., should also be taken into consideration and should be addressed in follow-up research.

Acknowledgments

The authors express their sincere gratitude to all the people who were involved directly in the field and to the residents of Cibangkong, especially in RW 8 and 11, for their hospitality and cooperation. Special credits are also given to Lembaga Pengelola Dana Pendidikan (LPDP) and the Indonesian Ministry of Education for the research and study grants that made this study possible.

Author Contributions

Encep Amir was the researcher of the reported research; Sharon Hophmayer-Tokich and Tubagus Benito Achmad Kurnani were his supervisors. With respect to the paper, Encep Amir as the researcher wrote the first draft, whereas Sharon Hophmayer-Tokich and Tubagus Benito Achmad Kurnani assisted in improvements and adaptations and co-authored the final version.

Conflict of Interest

The authors declare no conflict of interest. The founding sponsors had no role in the design of the study; in the collection, analyses, or interpretation of data; in the writing of the manuscript, and in the decision to publish the results.

References

  1. Indonesian Ministry of Environment. Environmental Status of Indonesia; Indonesian Ministry of Environment: Jakarta, Indonesia, 2008. [Google Scholar]
  2. Yachiyo Engineering Co., Ltd. Study For. Integrated Environmental Improvement of Leuwigajah. Disposal Site in West Java, Republic of Indonesia; Yachiyo Engineering Co., Ltd.: Bandung, Indonesia, 2009. [Google Scholar]
  3. Indonesian Ministry of Environment. Indonesian Domestic Solid Waste Statistics; Indonesian Ministry of Environment: Jakarta, Indonesia, 2008. [Google Scholar]
  4. Chaerul, M.; Tanaka, M.; Shekdar, A.V. Municipal Waste Management in Indonesia: Status and the Strategic Actions. J. Fac. Environ. Sci. Technol. 2007, 69, 41–49. [Google Scholar]
  5. Ismaria, R. Studi Mekanisme dan Interaksi Daur-Ulang Terhadap Sistem Pengelolaan Sampah Dengan Pengembangan Model Dinamik—Studi Kasus Kotamadya Bandung. Master’s Thesis, Institut Teknologi Bandung, Jawa Barat, Indonesia, 2000. [Google Scholar]
  6. Safitri, M.; Fujiwara, T.; Chaerul, M.; Damanhuri, E. The 25rd Annual Conference of Japan Society of Material Cycles and Waste Management; Japan Society of Material Cycles and Waste Management: Tokyo, Japan, 2014; pp. 579–580. [Google Scholar]
  7. Sundana, E.J. Solid Waste Management Services in Bandung Municipality: Status of Financial and Cost Recovery. In Proceedings of Financing and Cost Recovery for the Provision of Urban Environmental Infrastructure Services, Asian Institute of Technology, Bangkok, Thailand, 13–15 December 2004.
  8. Damanhuri, E.; Padmi, T. ISWA International Symposium on Waste Management in Asia Cities; International Solid Waste Association: Vienna, Austria, 2000. [Google Scholar]
  9. Indonesian Ministry of Energy and Mineral Resources. Indonesia Energy Outlook 2013; Indonesian Ministry of Energy and Mineral Resources: Jakarta, Indonesia, 2013. [Google Scholar]
  10. Business Competition Supervisory Commission of Indonesia. Background Paper: Policy Analysis on LPG Industry Competition in Indonesia; Business Competition Supervisory Commission of Indonesia: Jakarta, Indonesia, 2010. [Google Scholar]
  11. Paglia, T.K. Energy Improvement Districts and Local Energy Production. Master’s Thesis, Cornell University, Ithaca, NY, USA, 2011. [Google Scholar]
  12. Indonesia Domestic Biogas Programme. Biogas Rumah. Annual Report 2010; Indonesia Domestic Biogas Programme: Jakarta, Indonesia, 2010. [Google Scholar]
  13. Al Seadi, T.; Rutz, D.; Janssen, R.; Drosg, B. Biomass resources for biogas production. In The Biogas Handbook: Science, Production and Application; Wellinger, A., Murphy, J., Baxter, D., Eds.; Woodhead Publishing Limited: Cambridge, UK, 2013; pp. 19–51. [Google Scholar]
  14. Petersson, A. Biogas cleaning. In The Biogas Handbook: Science, Production and Application; Wellinger, A., Murphy, J., Baxter, D., Eds.; Woodhead Publishing Limited: Cambridge, UK, 2013; pp. 329–341. [Google Scholar]
  15. Kubaská, M.; Sedláˇcek, S.; Bodík, I.; Kissová, B. Proceedings of the 37th International Conference of Slovak Society of Chemical Engineering; Slovak Society of Chemical Engineering: Tatranské Matliare, Slovakia, 2010; pp. 1413–1418.
  16. Svenskt Gastekniskt Center. Basic Data on Biogas; Svenskt Gastekniskt Center: Malmo, Sweden, 2012. [Google Scholar]
  17. Murphy, J.D.; Thamsiriroj, T. Fundamental science and engineering of the anaerobic digestion process for biogas production. In The Biogas Handbook: Science, Production and Application; Wellinger, A., Murphy, J., Baxter, D., Eds.; Woodhead Publishing Limited: Cambridge, UK, 2013; pp. 104–130. [Google Scholar]
  18. Rajendran, K.; Aslanzadeh, S.; Johansson, F.; Taherzadeh, M.J. Experimental and economical evaluation of a novel biogas digester. Energy Convers. Manag. 2013, 74, 183–191. [Google Scholar] [CrossRef]
  19. Muller, C. Anaerobic Digestion of Biodegradable Solid Waste in Low- and Middle-Income Countries: Overview over Existing Technologies and Relevant Case Studies; Swiss Federal Institute of Aquatic Science and Technology: Dübendorf, Switzerland, 2007. [Google Scholar]
  20. Muryanto, A.H.; Muntoha, D.W. Indonesian Rekomendasi Teknologi Instalasi Biogas Drum Skala Rumah Tangga; Balai Pengkajian Teknologi Pertanian Jawa Tengah: Semarang, Indonesia, 2008. [Google Scholar]
  21. Nzila, C.; Dewulf, J.; Spanjers, H.; Tuigong, D.; Kiriamiti, H.; van Langenhove, H. Multi criteria sustainability assessment of biogas production in Kenya. Appl. Energy 2012, 93, 496–506. [Google Scholar] [CrossRef]
  22. Smith, J.U. The Potential of Small-Scale Biogas Digesters to Alleviate Poverty and Improve Long Term Sustainability of Ecosystem Services in Sub-Saharan Africa; Department for International Development: London, UK, 2011. [Google Scholar]
  23. Herero, J.M.; Chipana, M.; Cuevas, C.; Paco, G.; Serrano, V.; Zymla, B.; Heising, K.; Sologuren, J.; Gamara, A. Low cost tubular digesters as appropriate technology for widespread application: Results and lessons learned from Bolivia. Renew. Energy 2014, 71, 156–165. [Google Scholar] [CrossRef]
  24. Kayhanian, M.; Hardy, S. The impact of 4 design parameters on the performance of a high-solids anaerobic digestion process of municipal solid waste for fuel gas production. Environ. Technol. 1994, 15, 557–567. [Google Scholar] [CrossRef]
  25. Howard, P.; Pinel, S. Project 2: Engineers Without Borders Challenge; Engineers Without Borders Australia: North Melbourne, Australia, 2011. [Google Scholar]
  26. Haque, N. International Workshop on Financing of Domestic Biogas Plants; Stichting Nederlandse Vrijwilligers: Amsterdam, the Netherlands, 2008. [Google Scholar]
  27. Dhakal, H.N. Financing Domestic Biogas Plants in Nepal; Stichting Nederlandse Vrijwilligers: Kathmandu, Nepal, 2008. [Google Scholar]
  28. Estoppey, N. Evaluation of Small-Scale Biogas Systems for the Treatment of Feces and Kitchen Waste: Case Study Kochi, South India; Swiss Federal Institute of Aquatic Science and Technology: Dübendorf, Switzerland, 2010. [Google Scholar]
  29. Vij, S. Biogas Production From Kitchen Waste & to Test the Quality and Quantity of Biogas Produced from Kitchen Waste Under Suitable Conditions. Bachelor’s Thesis, National Institute of Technology Rourkela, Odisha, India, 2011. [Google Scholar]
  30. Bala, B.K.; Hossain, M.M. Economics of biogas digesters in Bangladesh. Energy 1991, 17, 939–944. [Google Scholar] [CrossRef]
  31. Kandpal, T.C.; Joshi, B.; Sinha, C.S. Economics of family sized biogas plants in India. Energy Convers. Manag. 1991, 32, 101–113. [Google Scholar] [CrossRef]
  32. Adeoti, O.; Ilori, M.O.; Oyebisi, T.O.; Adekoya, L.O. Engineering design and economic evaluation of a family-sized biogas project in Nigeria. Technovation 2000, 20, 103–108. [Google Scholar] [CrossRef]
  33. Brealey, R.; Myers, S.; Allen, F.; Geis, G. Principles of Corporate Finance, 10th ed.; The McGraw-Hill: Boston, MA, USA, 2011. [Google Scholar]
  34. Ross, S.A.; Westerfield, R.W.; Jaffe, J. Modern Financial Management, 8th ed.; The McGraw-Hill: New York, NY, USA, 2009. [Google Scholar]
  35. Mindlin, D. Present Values, Investment Returns and Discount Rates; CDI Advisors LLC: Oak Park, CA, USA, 2013. [Google Scholar]
  36. Young, L. Determining the Discount Rate for Government Projects; New Zealand Treasury: Wellington, New Zealand, 2002. [Google Scholar]
  37. Wustenhagen, R.; Wolsink, M.; Burer, M.J. Social acceptance of renewable energy innovation: An introduction to the concept. Energy Policy 2007, 34, 2683–2691. [Google Scholar] [CrossRef]
  38. United Nations Environment Programme. Municipal Waste Management Report: Status-Quo and Issues in Southeast and East Asian Countries; United Nations Environment Programme: Washington, New Zealand, 2010. [Google Scholar]
  39. Dowall, D.E.; Clark, G. A Framework for Reforming Urban Land Policies in Developing Countries; The International Bank for Reconstruction and Development of The World Bank: Washington, New Zealand, 1996. [Google Scholar]
  40. Schienberg, A.; Muller, M.; Tasheva, E.L. Gender and Waste; WASTE: Gouda, The Netherland, 1999. [Google Scholar]
  41. Lipinski, B.; Hanson, C.; Lomax, J.; Kitinoja, L.; Waite, R.; Searchinger, T. Reducing Food Loss and Waste; World Resources Institute: Washington, DC, USA, 2013. [Google Scholar]
  42. Lind, E.; Tyler, T. The Social Psychology of Procedural Justice; Plenum Press: New York, NY, USA, 1988. [Google Scholar]
  43. Deutsch, M. Justice and Conflict. In The Handbook of Conflict Resolution: Theory and Practice; Deutsch, M., Coleman, P.T., Eds.; Jossey-Bass: San Francisco, CA, USA, 2000; pp. 41–64. [Google Scholar]
  44. Gross, C. Community perspectives of wind energy in Australia: The application of a justice and community fairness framework to increase social acceptance. Energy Policy 2007, 35, 2727–2736. [Google Scholar] [CrossRef]
  45. Greenberg, J. Stealing in the name of justice: Informational and interpersonal moderators and theft reactions to underpayment inequity. Organ. Behav. Hum. Decis. Processes 1993, 54, 81–103. [Google Scholar] [CrossRef]
  46. MacCoun, R.J. Voice, control, and belonging: The double-edged sword of procedural fairness. Annu. Rev. Law Soc. Sci. 2005, 1, 171–201. [Google Scholar] [CrossRef]
  47. Vermunt, R.; Törnblom, K.Y. Introduction: Distributive and procedural justice. Soc. Justice Res. 1996, 9, 305–311. [Google Scholar] [CrossRef]
  48. Van der Horst, D. NIMBY or not? Exploring the relevance of location and the politics of voiced opinions in renewable energy siting controversies. Energy Policy 2007, 35, 2727–2736. [Google Scholar] [CrossRef]
  49. Skitka, L.J.; Winquist, J.; Hutchison, S. Are outcome fairness and outcome favorability distinguishable psychological constructs? A meta-analytic review. Soc. Justice Res. 2003, 16, 309–341. [Google Scholar] [CrossRef]
  50. Huijts, N.M.A.; Midden, C.J.H.; Meijnders, A.L. Public acceptance of carbon dioxide storage. Energy Policy 2007, 35, 2780–2789. [Google Scholar] [CrossRef]
  51. Gebreegziabher, Z.; Naik, L.; Melamu, R.; Balana, B.B. Prospects and challenges for urban application of biogas installations in Sub-Saharan Africa. Biomass Bioenergy 2014, 30, 1–11. [Google Scholar] [CrossRef]
  52. Singh, A.; Sevnsson, J.; Kaylanpur, A. The state of sex-disaggregated data for assessing the impact of climate change. Procedia Environ. Sci. 2010, 1, 395–404. [Google Scholar] [CrossRef]

