
The Herschel Heritage to Medical Thermography

Medical Imaging Research Unit, Faculty of Mathematics Computing and Science, University of South Wales, Pontypridd CF37 1DL, UK
J. Imaging 2016, 2(2), 13; https://0-doi-org.brum.beds.ac.uk/10.3390/jimaging2020013
Submission received: 23 September 2015
/
Revised: 9 March 2016
/
Accepted: 25 March 2016
/
Published: 14 April 2016
(This article belongs to the Special Issue The World in Infrared Imaging)
Abstract
:The discovery of infrared radiation by William Herschel in 1800 led to John Herschel’s study of solar radiation that he imaged by evaporography. This he termed a thermogram. The measurement of temperature in medicine advanced with Dr Carl Wunderlich, who showed the significance of the use of temperature measurements for diagnosis of fever and for monitoring the course of temperature in relation to disease. It was William and John Herschel’s discovery of infrared radiation that has ultimately opened up many applications for thermal imaging. Radiometric determination of human body (skin) temperature is now achievable. Remote sensing of infrared radiation first developed in the 1940s and has continued to develop steadily since 1960. Modern high speed and high resolution camera systems have now reached a dramatic level of performance at more modest costs, which medicine can now employ for non-invasive and quantifiable imaging. This has applications in many areas of medicine both for diagnostics and monitoring treatment. In recent years the acute threat of pandemic infection has increased, heightened by today’s ever expanding world travel. Special interest has been shown in the potential of thermal imaging for airport and travel screening. This is in effect where Dr Wunderlich’s studies began, and it has yet to be proven that the technique can be responsibly employed for efficient screening of large numbers of the travelling public.
1. Introduction
Thermology, the science of heat, is a very wide topic, and applies to many diverse processes of our modern life. In this paper, it is confined to one narrow but highly complex application, that of human body temperature. For many years contact thermometry was the only means of determining human temperature. Thermometry itself slowly developed from Galileo’s early thermoscope in 1592 to the more usable calibrated scales devised by Fahrenheit (1720) and the metric scale attributed to Celsius in 1742. It was the Danish scientist Linnaus, who in 1750 proposed that Celsius’ scale should be inverted; so that low temperature at zero and boiling water would be 100 degrees [1].
The great pioneer of clinical thermometry was Carl Reinhold August Wunderlich who was born in Germany in 1815 (http://www.kumc.edu/dc/pc/wunderlich.jpg). By 1850 he had become professor and medical director of the University Hospital at Leipzig. He was a gifted teacher, strong in physiology and methodology of diagnosis. Among his several significant publications was his treatise on “Temperature in Diseases, a manual of medical thermometry” in 1868. He set out numerous statements of clinical significance especially relating to fever, the course of temperature related to increases and decreases of fever, and the importance of regular and consistent measurement to provide objective evidence of the status of the patient [2]. His maximum clinical thermometer, and the daily records of temperature charts are still in evidence today despite the many changes in technology and computerized records.
The use of infrared radiation took many years to reach the level that is recognized today. An early record of “reflected heat” was made by Jean Batista Della Porta of Naplesin 1593. In his studies on the behaviour of light he also recognised that heat could be sensed by a human that must have come via reflection, something he proved by locating a candle in front of a silver plate. When the plate was removed the sensation of heat from the candle flame was reduced.
In 1800, some 200 years later, William Herschel, amateur astronomer in England, began to investigate the heating powers of the separate colours of the spectrum, in order to improve his optical eyepieces for telescopes. The Royal Society in London published his findings that increased temperature could be detected by thermometry beyond the visible red. In 1840, his son, John Herschel continued his father’s experiments, and made a simple image by evaporation of a carbon and alcohol mixture using focused sunlight. He named the image a “thermogram” [3]. It is interesting to note that John’s closest friend was Charles Babbage whom he had met at Cambridge University. Babbage is generally regarded as one of the pioneers of computing, having built a mathematical machine called a difference engine. So father, son and family friend can be regarded as true pioneers of today’s computerized thermal imaging.
Another important finding was in 1935, when JD Hardy, an American Physiologist showed that the human skin surface has the characteristics of a near perfect black body radiator, being highly efficient in irradiative heat exchange [4]. In the meantime physicists had been studying the ways to increase the sensitivity of thermometry especially by electrical conductors, and thermocouples. In America, Prof. Samuel Langley made a great contribution by developing a bolometer. This gave a means of remote sensing of temperature, and formed the basis for a whole new generation of heat sensor technology.
In Germany Marianus Czerny Professor of Physics at Goethe Institute Frankfurt University, became known in spectroscopy, and laid foundations for thermal sensors. He developed an Evaporograph in 1925. One of his students Bowling Barnes went to the USA and built the first thermal imager based on thermistors in the 1950s [5]. In the UK, a research physicist Dr Max Cade had built a scanning infrared thermograph using an electronic detector of indium antimonide. This had been built during World War 2 but was not fast enough for navigation compared to radar systems. This prototype was made available to the author in The Rheumatic Diseases Hospital in Bath in 1959, following the post war declassification of infrared imaging. Though the images were primitive, it was evident that inflammation due to arthritis in joints showed increased heat emission. This led to a more usable, large device being built that produced a better quality image of the human body, although a single hand thermogram took 5 min to record [6].
Much if this information came together in the early 1960s. In particular, there was a medical thermography conference held in New York in 1963 and in Strasbourg in France in 1966. Infrared imaging in medicine was in its infancy, but those early proceedings showed the variety and detail given to study the new technology. One author concluded “All that has been revealed by this technique is nothing compared with what is left to be discovered”. Sixty years have passed since this was written, and certainly more has been revealed, but we may well repeat the optimistic statement from 1963 today [7]! In Europe, a group of doctors and physicists came together and formed The European Thermographic Association in 1974. This subsequently renamed to the European Association of Thermology, which holds periodic international conferences across Europe, was most recently held in Madrid September 2015.
2. Infrared Imaging in Medicine
Dramatic progress has been made in infrared detector systems that have passed through several generations of technology. There are now infrared transmitting lenses that have made a major improvement in thermal imaging of the human subject.
Of major importance to medicine is not just the two dimensional expression of temperature in a thermal image, but the ability to record a large number of adjacent temperature measurements from the skin temperature distribution. For some time, this process was not straightforward, and uncertainties about the data obtained from a thermogram remained. Electronic assistance was possible through the use of isotherms, and in 1972, our group in Bath UK, developed a system called the Thermographic Index based on measuring the area of isotherms within a specified anatomical region [8]. At this time imaging was achieved by scanning optics using a single element detector. This was cooled by liquid nitrogen, added manually to the detector flask at regular intervals. Some years later, Leidenfrost transfer systems were developed. These did reduce the need for regular addition of nitrogen. It is now known that some of the variables encountered with the thermal imagers were due to inconsistent levels of the coolant on the detector. More advanced cooling systems for infrared detectors remove the need for liquid nitrogen handling, and present generation of un-cooled bolometers have much improved performance which is adequate for medical applications.
The need for measurement, and use of the thermal image as a non-invasive means of determining skin temperature was ever present in medical thermography. All this changed, as in so many other areas of medicine with the arrival of the computer. In the early days of medical thermography (1970s) a basic computer was linked to the infrared camera by an analogue to digital circuit. Rapid developments followed, in parallel to those continuing in the field of infrared radiation detection. Quantitative thermal imaging has now become a reality. However, despite the increasing sales of thermographic cameras with image processing computers, application progress has been slow.
The need for strict image capture protocols was highlighted in medical studies of certain new drugs. Some clinical trials have been published especially in the field of Rheumatic Diseases, where anti-inflammatory treatment were objectively compared in differing doses of the drug within groups of patients [9,10]. Such studies were only possible by rigorous protocols in technique to obtain reproducible results. It is now known that the earlier camera technology often had instrument variables that were not evident to the medical users. Factors such as offset drift (deviation from the true calibration level) and stabilization of the camera, influences of ambient temperature, etc., are all factors that can introduce large variables, often unrecognized by medical investigators.
3. Standardization of technique
The use of thermal imaging in clinical trials, especially those used to evaluate treatments, physical, surgical or pharmaceutical, have highlighted the need for standard protocols in clinical practice. The first principles of clinical thermographic technique were part of a series of training courses at the University of Glamorgan in the UK. Ring and Ammer published the outline of these requirements in 2000 [11]. The addition of an external temperature reference source can greatly improve consistent technique, and provide the user with valuable early warning of calibration drift or lack of stability in the camera. Many of the modern thermal imaging cameras used in medicine are un-cooled bolometric systems. It is all the more important that these devices should be used with regular reference to an external and stable reference source. It has also been shown that a standard protocol should use definable fields of view of the human body regions examined. Regions of interest used for temperature measurements should also be similarly defined and reproduced, since unknown variables lead to inconsistent findings, thus lessening the clinical reliability of the investigation [12].
4. Applications in Clinical Medicine
Many varied applications of thermal imaging are found in the literature. The limitation that thermal imaging can only record skin (surface) temperature distribution remains. Many of the useful applications apply more readily to the extremities of arms and legs, and a number of diseases do have influences on skin temperature.
4.1. Raynauds Phenomenon
A condition known as Raynaud’s phenomenon affects hands and feet. Here lower than normal temperatures are found in the fingers and toes. This can be a painful and physically distressing condition in which hands in particular remain cold even in a warmer environment. Skin colour changes and decreased temperatures of the fingers due to contact or exposure to air can be triggered. This has been effectively monitored and quantified with thermal imaging techniques. Applying a controlled cold stress to the hands by water immersion for short periods can be sufficient to elicit a vasosopastic attack that prevents the hands from rewarming in the normal way. In a normal subject, 1 min immersion in water at 20 °C (with hands kept dry by the use of thin plastic gloves) is sufficient to cause the blood vessels in the fingers to expand, resulting in a reactive influx of blood flow described as reactive hyperaemia. Within a 10–20 min period, the temperature of the fingers and the hand will return to temperature, even exceeding the baseline levels [13]. This may be experienced when handling snow, producing an ”after glow” effect of warmth. With thermal imaging to record baseline temperatures prior to the cold stress and after the cooling when gloves are removed, a measure of that response has been of value, including the assessment of drug treatments for the condition over time.
4.2. Vibration Injury
The use of other types of stimulus to the hands also have applications especially in the detection of industrial injuries such as vibration exposure (viz.vibration white finger, hand arm vibration injury). Vardasca has shown that a combination of controlled vibration exposure, and a thermal challenge to hands can be used to show the extent of injurious effects on the circulation of the hand. This offers a means of objective measurement of a problem that is often difficult to study [14].
4.3. Diabetes Research
Renewed interest in the temperature regulation of the feet in Diabetic Disease is directing research into whether thermal imaging may provide an early warning of the breakdown of tissues leading to ulcers in Diabetes mellitus. This can be a serious consequence of this disease which is on the increase, and can lead to prolonged disability and even amputation of the lower limb. This is currently an active area of research in several countries, and it is not yet established if the future will lie in low cost patient operated devices that can be of clinical value in prevention of the progressive advances in peripheral circulation defects that lead to such severe consequences as amputation [15].
4.4. Malignant Diseases
The early years of thermal imaging in medicine were dominated by investigations into breast cancer in women. Although there was evidence that aggressive tumours can be hot, and large numbers of women were being screened by different imaging modalities, results of breast thermography studies failed to reach expectations.
It is now known that the resolution and stability of thermal cameras were much lower in the 1960s than that obtainable today. However, other technologies have been developed such as mammography and ultrasound that have found international acceptance in the medical fight for efficiency in cancer detection. However, malignancies that are on the skin surface can be readily examined with thermal imaging. Skin cancers including malignant melanomas have been studied [16]. The prime advantage of thermal imaging is that is non invasive and therefore suitable for frequent monitoring without any harmful effects.
4.5. Fever Screening
In recent years, the global threat of pandemic influenza has become evident. Beginning with the SARS outbreak (Severe Acute Respiratory Syndrome) in the Far East with rapid fatalities, infrared cameras were rapidly deployed for screening travellers. High temperatures on the face were used to exclude those with fever from travelling and infecting fellow passengers. There were, however, limitations with this strategy [17]. There was a lack of clinical data to provide a baseline for febrile subjects, and some of the camera systems deployed were non-radiometric, and therefore not designed for temperature measurement. The International Standards Organization set up an international committee to examine the essential criteria required for mass screening of fever in human subjects. It began with two excellent documents already prepared by the Singapore Standards for public screening for fever using thermographic imaging. Two new standard recommendations were ultimately published with International acceptance. The first described the necessary performance of a screening thermograph, and how it should be calibrated, and the second was written for those responsible organizations who purchase, install and operate thermal imaging for fever screening [18,19]. While not exclusive to airports, there was an emphasis given on the requirements for deployment of screening of air travellers, and the necessary training and monitoring of both the equipment and the operators [20].
During the SARS outbreak, the danger of the spread of fever was acute in Singapore, and in Tan Tok Seng Hospital, the Accident and Emergency Department had set up a special designated facility for acute fever. They studied data from 502 patients of whom 86 were later confirmed with fever and 416 were found to be normal. A thermal imager (uncooled microbolometer 320 × 240) was used as first line screening. Detailed studies were made of the frontal and lateral face thermograms. Temperature measurements were also made with a medical grade radiometer. They found that the normal temperatures ranged from 36.0 °C to 37.2 °C and in the fever group 37.2–39.8 °C was recorded. Ng examined these data in details applying neural network analysis and confirmed the statistical separation between the healthy and febrile data [21]. From this study the Singapore Standards information led the way to further development by the subsequent ISO committee.
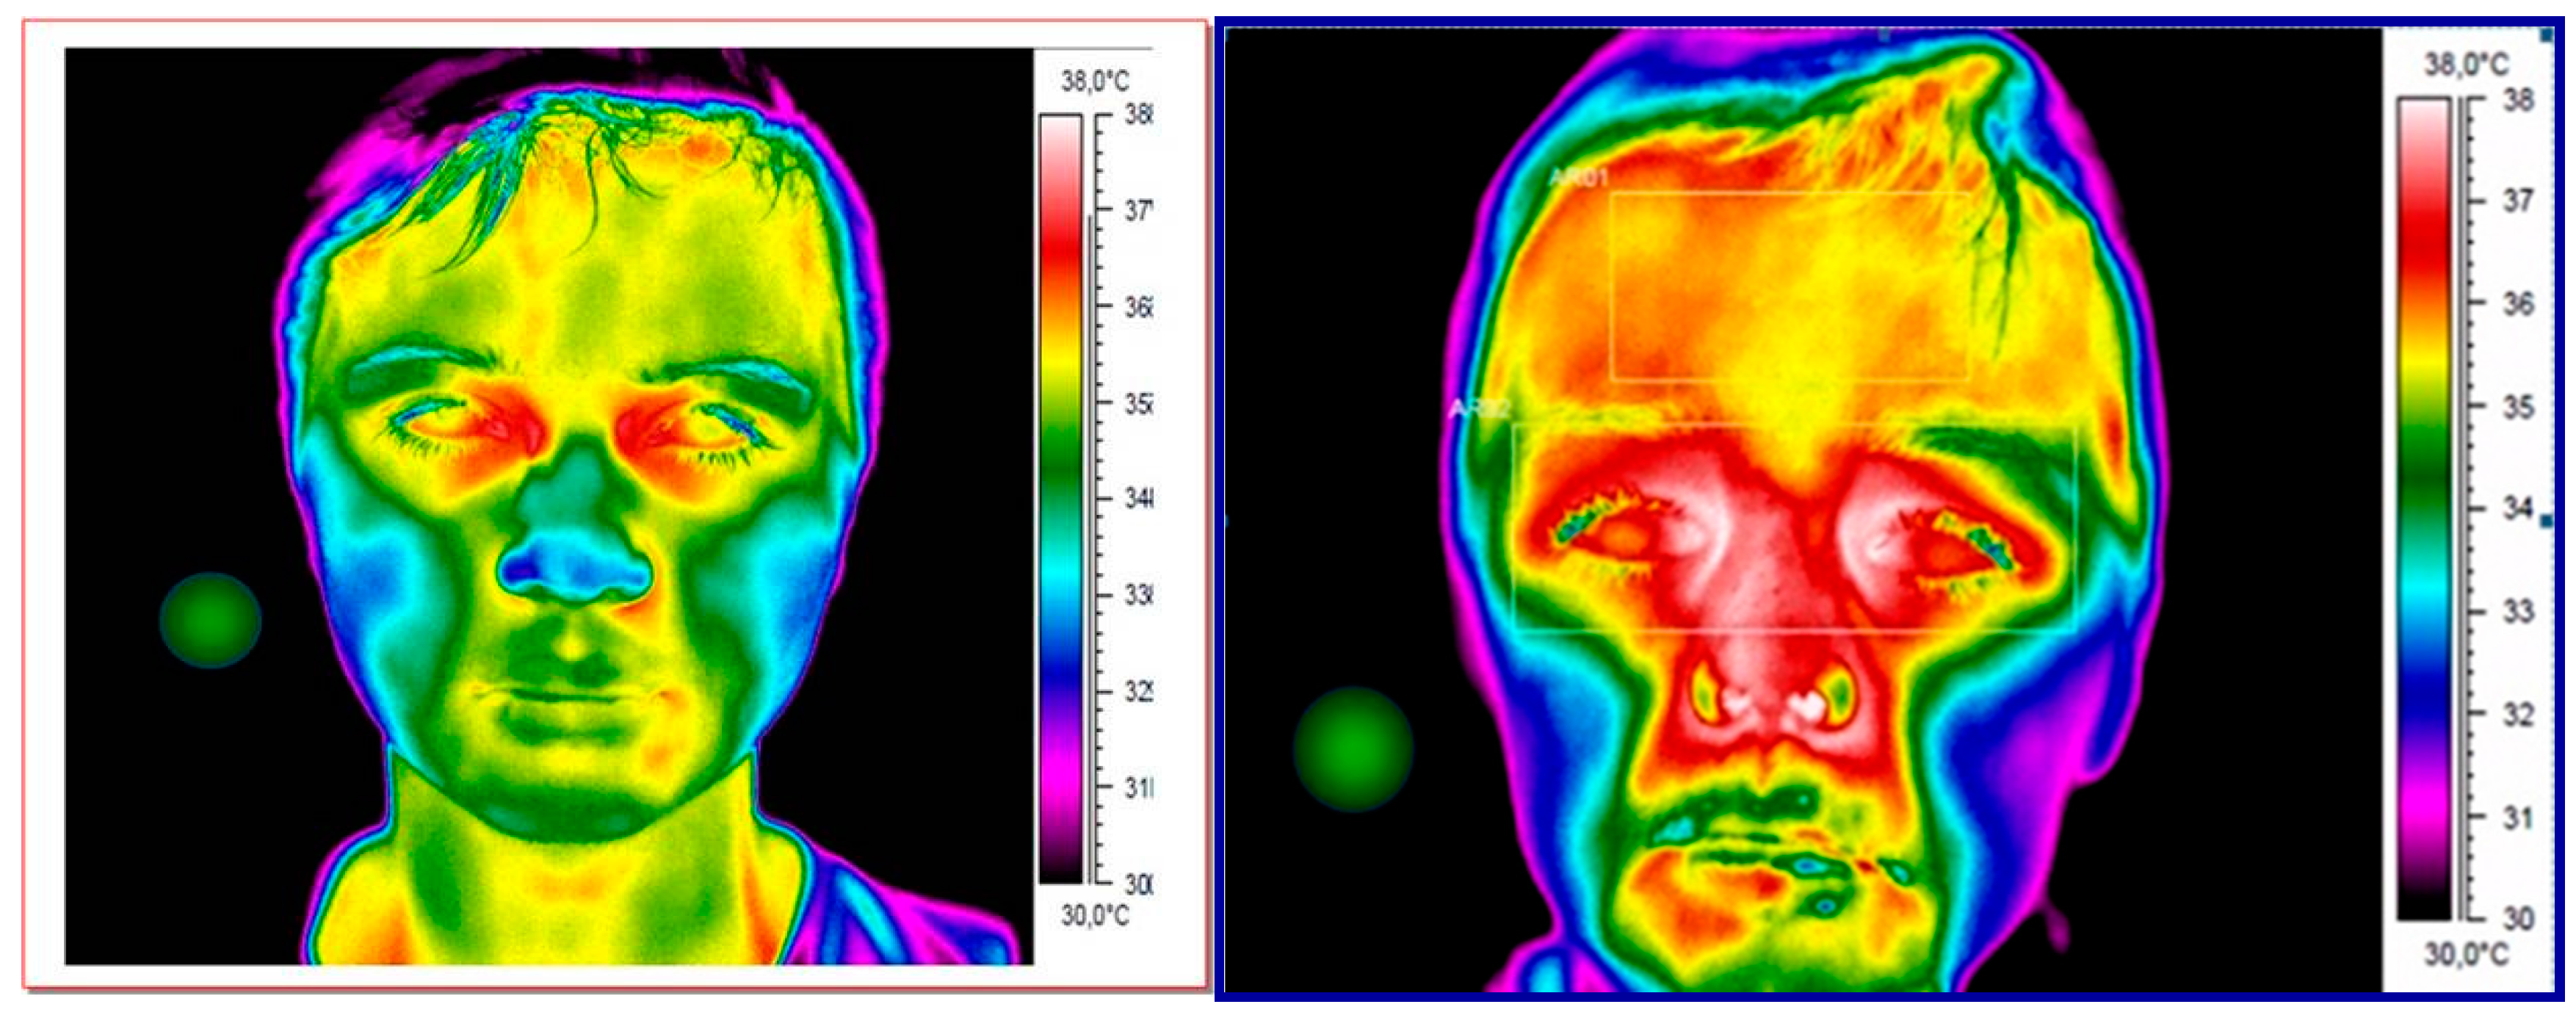
In serious influenza outbreaks, children and young families are usually at high risk, and few data had been found on the use of thermal imaging in febrile children. A study was set up in the Paediatric department of The Military Institute of Medicine in Warsaw using the ISO criteria for screening for fever with thermography. In a cohort of 406 children, 354 were afebrile and 52 were identified with fever using thermal imaging to measure the inner canthi of the eyes, and by clinical thermometry of the axilla (underarm) for 5 min. Measurements were also made at the tympanic membrane by ear radiometry and of the forehead from the thermogram of the frontal face. The inner canthus of the eye, as recommended by the ISO correlated well with clinical thermometry, with a mean of 36.48 °C (SD 0.49) in the afebrile children, and 38.9 °C (SD 0.84) in the febrile group (Figure 1). No correlation was found with sex or ages of the children in this study [22].
However, concerns remain, that where some installations have been made in airports, few have employed the strict recommendations of the ISO. For example, it is required that the subject to camera distance is minimal, to ensure that a minimum of 9 × 9 pixels will be available in the thermogram. Furthermore, it is impossible to obtain the correct positioning in moving subjects and particularly those at a distance of several meters from the camera. For this reason, the subject to be screened must be stationary and close to the IR camera lens, with the face filling at least 75% of the image field. It is difficult to find any published data on the uptake on the standard, even following the Ebola crisis. There is more evidence that hand held radiometers were used directed at unsuitable targets on the human body than correct use of thermal imaging. Such practice is bound to fail, but the travelling public are led to believe that they are being effectively screened at the airport.
5. Conclusions
From the important discovery of infrared radiation by William Herschel in 1800 to modern day medical imaging, radical changes in our understanding of human body temperature in health and disease have occurred. After a long period before electronic heat sensors came into being, the last 50 years has shown a rapid rise in technology and its different applications Modern infrared thermal imaging is currently more highly developed than at any time in its remarkable history. In industry, astronomy and many aspects of modern science infrared imaging has expanded and exceeded expectations. In medicine, the applications need to be cautiously and critically developed with a clear understanding of the underlying thermal physiology. Some applications as in rheumatic diseases and pain syndromes, evidence of inflammation is clear, and therefore response to successful treatments can be objectively measured (see Figure 2 and Figure 3). Careful interpretation of results is essential [23]. Medicine has embraced many other high performance image technologies such as ultrasound, radiography, magnetic resonance, etc. Medical thermography will only be more accepted, despite, the advantages of being non-contact, non-invasive and objective, if the published data is responsibly obtained, and open to others as reproducible findings.
Acknowledgments
Sincere thanks are due to the staff and patients at the Military Institute of Medicine Warsaw who participated in the Fever study, and to P. Rutkowski (IR Systems) in Warsaw.
Conflicts of Interest
The author declares no conflict of interest.
References
- Ring, E.F.J. The historical development of temperature measurement in medicine. Infrared Phys. Technol. 2007, 49, 297–301. [Google Scholar] [CrossRef]
- Wunderlich, C.A. On the Temperature in Diseases: A Manual of Medical Thermometry; The New Sydenham Society: London, UK, 1871. [Google Scholar]
- Ring, E.F.J. The discovery of infrared radiation in 1800. Imaging Sci. J. 2000, 48, 1–8. [Google Scholar]
- Hardy, J.D. The radiation of heat from the human body. III. The human skin as a black body radiator. J. Clin. Investig. 1934, 13, 615–620. [Google Scholar] [CrossRef] [PubMed]
- Barnes, R.B. Thermography and its Clinical Applications: Thermography. Ann. N. Y. Acad. Sci. 1964, 121, 34–48. [Google Scholar] [CrossRef]
- Cade, C.M. Thermography and its Clinical Applications: High Speed Thermography. Ann. N. Y. Acad. Sci. 1964, 121, 71–79. [Google Scholar] [CrossRef]
- Winsor, T.; Bendezu, J. Thermography and its Clinical Applications: Thermography and the Peripheral Circulation. Ann. N. Y. Acad. Sci. 1964, 121, 135–156. [Google Scholar] [CrossRef]
- Collins, A.J.; Ring, E.F.J.; Cosh, J.A.; Bacon, P.A. Quantitation of Thermography in arthritis using multi isothermal analyis.1. The Thermographic Index. Ann. Rheum. Dis. 1974, 33, 113–115. [Google Scholar] [CrossRef] [PubMed]
- Bacon, P.A.; Ring, E.F.J.; Collins, A.J. Thermography in the assessment of anti rheumatic agents. In Rheumatoid Arthritis; Gordon, J.L., Hazleman, B.L., Eds.; Elsevier: Amsterdam, The Netherlands; Biomedical Press: North Holland, The Netherlands, 1977. [Google Scholar]
- Bird, H.A.; Ring, E.F.J.; Bacon, P.A. A thermographic and clinical comparison of three intra-articular steroid preparations in rheumatoid arthritis. Ann. Rheum. Dis. 1979, 38, 36–39. [Google Scholar] [CrossRef] [PubMed]
- Ring, E.F.J.; Ammer, K. The technique of infrared imaging in medicine. Thermol. Int. 2000, 10, 7–14. [Google Scholar]
- Ammer, K. The Glamorgan protocol for recording and evaluation of thermal images of the human body. Thermol. Int. 2008, 18, 125–144. [Google Scholar]
- Ammer, K. Cold Challenge to provoke a vasospastic reaction in fingers determined by temperature measurements: A systematic review. Thermol. Int. 2009, 19, 109–118. [Google Scholar]
- Vardasca, R. The Effect of Work Related Mechanical Stress on the Peripheral Temperature of the Hand. Ph.D. Thesis, University of Glamorgan, Pontypridd, UK, 2010. [Google Scholar]
- Armstrong, D.G.; Holtz-Neiderer, K.; Wendell, C.; Mohler, M.J.; Kimbriel, H.R.; Lavery, L.A. Skin temperature monitoring reduces the risk of diabetic foot ulceration in high risk patients. Am. J. Med. 2007, 120, 1042–1046. [Google Scholar] [CrossRef] [PubMed]
- Cetingul, M.P.; Herman, C. Quantification of the thermal signature of a melanoma. Int. J. Therm. Sci. 2011, 50, 421–431. [Google Scholar] [CrossRef]
- Ring, E.F.J.; Ammer, K. Infrared thermal imaging in medicine. Physiol. Meas. 2012, 33, R33–R46. [Google Scholar] [CrossRef] [PubMed]
- International Electrotechnical Commission. Particular Requirements for the Basic Safety and Essential Performance of Screening Thermographs for Human Fever Detection; ISO/TC121/SC3-IEC SC62D; ISO: Geneva, Switzerland, 2010. [Google Scholar]
- International Organization for Standrdization. Medical Electrical Equipment-Deployment, Implementation and Operational Guidelines for Identifying Febrile Humans Using a Screening Thermograph; ISO/TR 13154:2009 ISO TR 80600; ISO: Geneva, Switzerland, 2009. [Google Scholar]
- Ring, E.F.J.; McEvoy, H.; Jung, A.; Zuber, J.; Machin, G. New standards for devices used for the measurement of human body temperature. J. Med. Eng. Technol. 2010, 34, 249–253. [Google Scholar] [CrossRef] [PubMed]
- Ng, E.Y.K. Thermal Imager as fever identification Tool for Infectious Diseases Outbreak. In Medical Infrared Imaging, Principles and Practices; Diakides, M., Bronzino, J.B., Peterson, D.R., Eds.; CRC Press: Boca Raton, FL, USA, 2013; Chapter 24. [Google Scholar]
- Ring, E.F.J.; Jung, A.; Kalicki, B.; Zuber, J.; Rustecka, A.; Vardasca, R. Infrared thermal imaging for fever detection in children. In Medical Infrared Imaging Principles and Practices; Diakides, M., Bronzino, J.B., Peterson, D.R., Eds.; CRC Press: Boca Raton, FL, USA, 2013; Chapter 23. [Google Scholar]
- Ring, E.F.J.; Jung, A.; Zuber, J. Infrared Imaging: A Casebook for Clinical Medicine; Institute of Physics Publishing: Bristol, UK, 2015. [Google Scholar]
Figure 1.
Thermograms of a child’s face (Left) normal healthy and (Right) with a fever showing raised temperature around the eyes and in the inner corner of each eye. (Courtesy of the Military Institute of Medicine Warsaw).
Figure 1.
Thermograms of a child’s face (Left) normal healthy and (Right) with a fever showing raised temperature around the eyes and in the inner corner of each eye. (Courtesy of the Military Institute of Medicine Warsaw).

Figure 2.
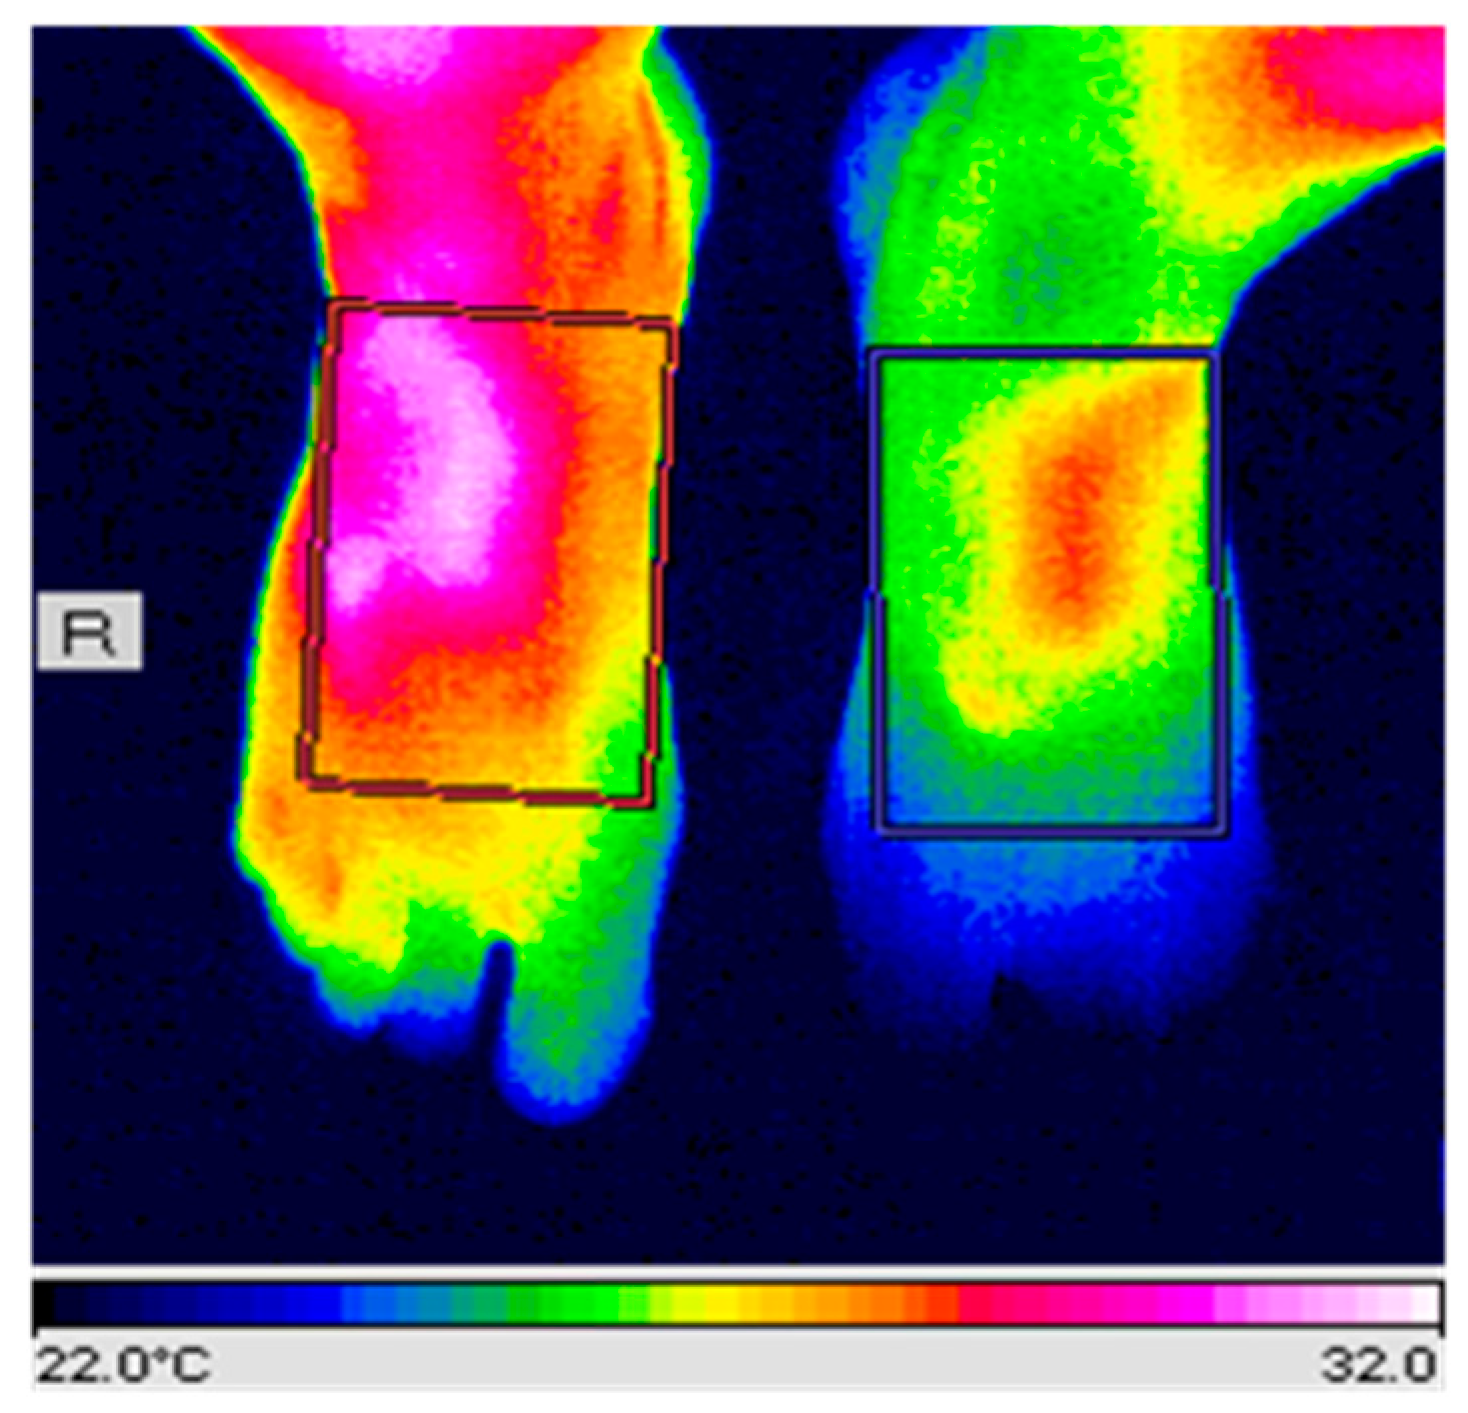
Thermograms of the dorsal feet, the image on the right is colder than the left due to a chronic pain syndrome. After successful treatment the feet returned to equal temperature distribution. (author’s thermogram).
Figure 2.
Thermograms of the dorsal feet, the image on the right is colder than the left due to a chronic pain syndrome. After successful treatment the feet returned to equal temperature distribution. (author’s thermogram).

Figure 3.
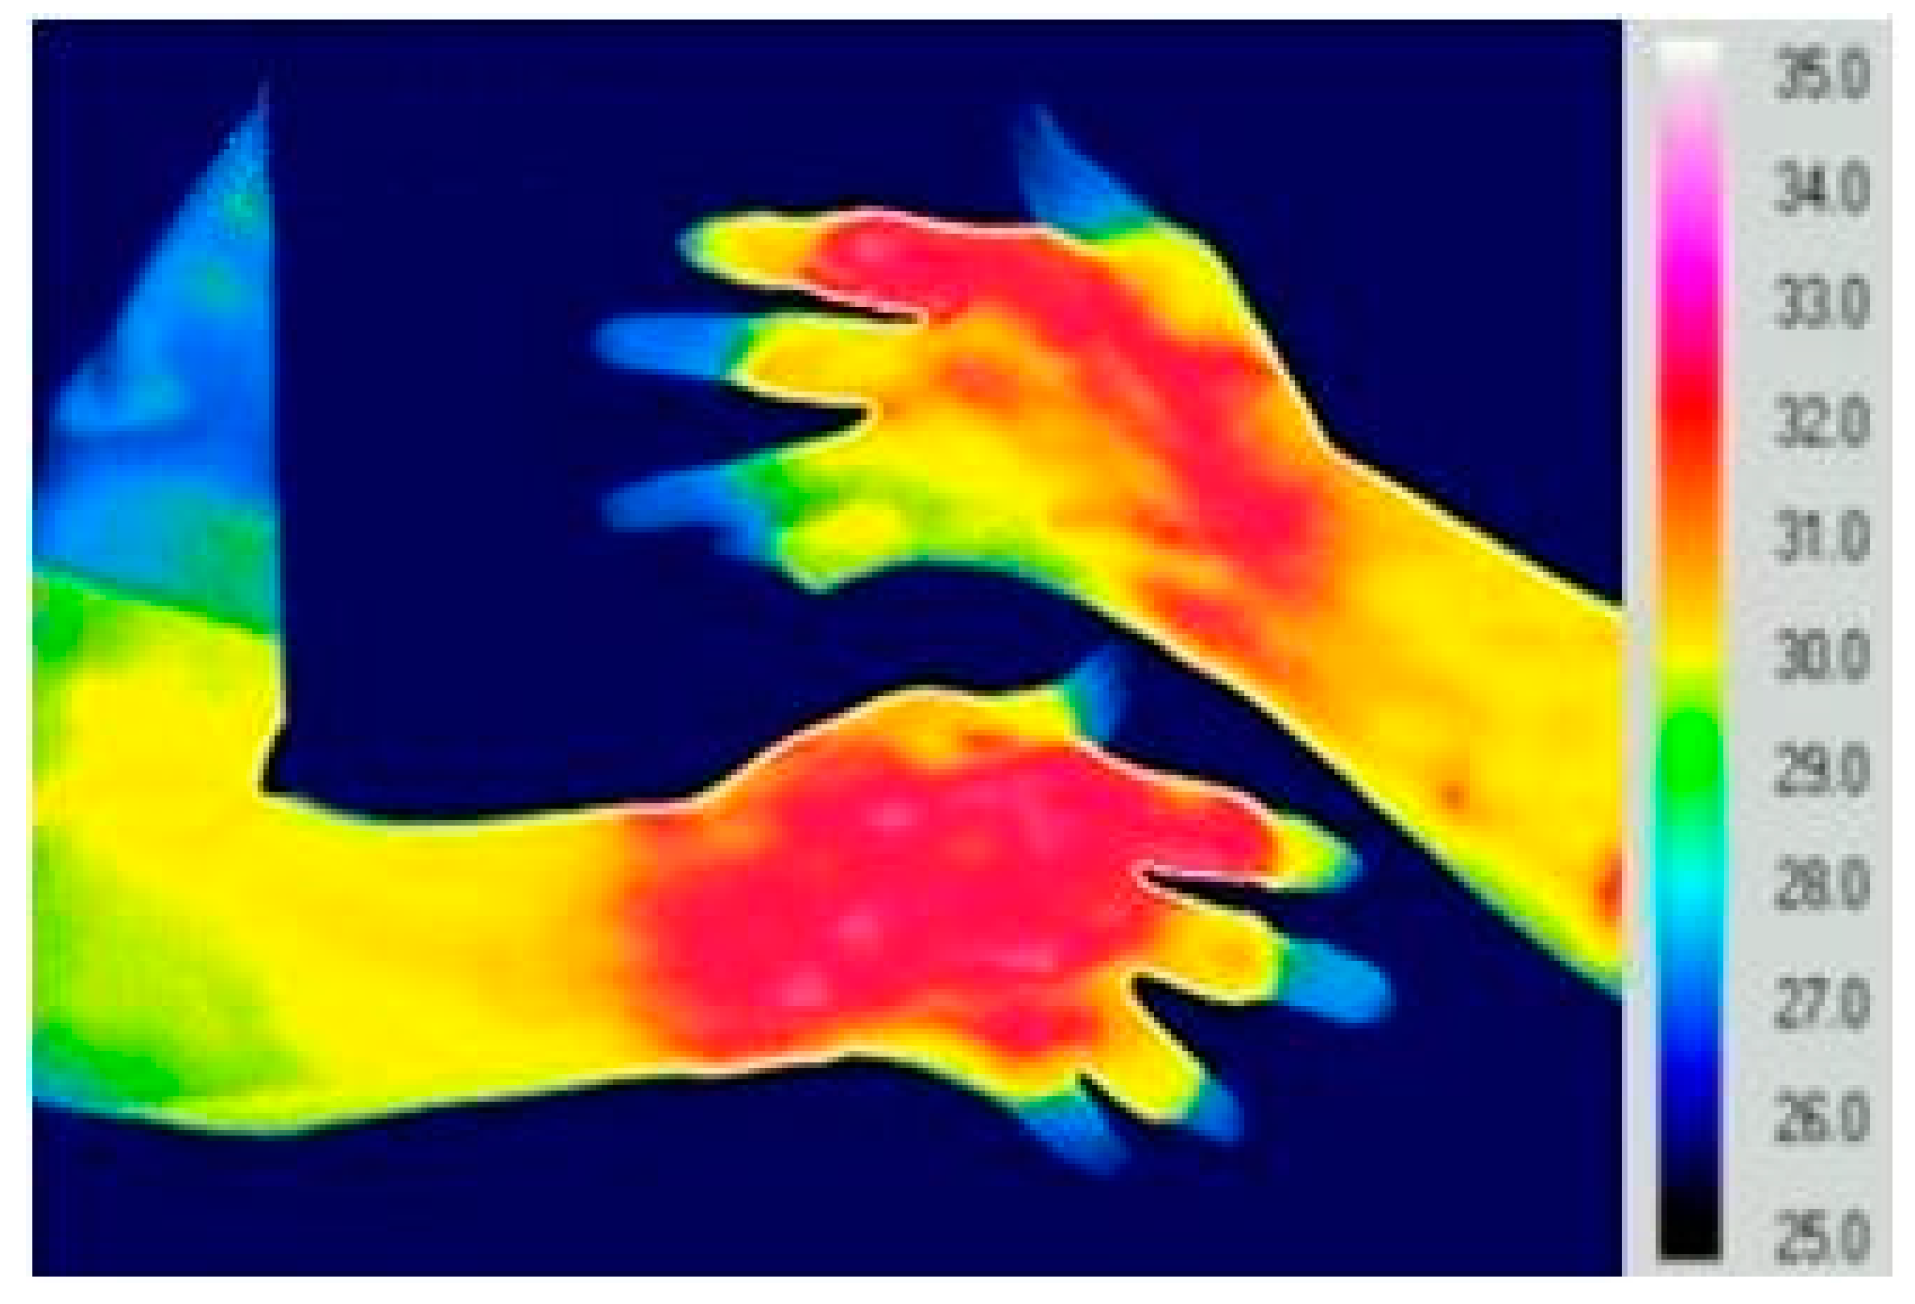
Thermograms of both hands showing inflammatory rheumatoid arthritis (red) and cold fingertips. (Author’s thermogram).
Figure 3.
Thermograms of both hands showing inflammatory rheumatoid arthritis (red) and cold fingertips. (Author’s thermogram).

© 2016 by the author; licensee MDPI, Basel, Switzerland. This article is an open access article distributed under the terms and conditions of the Creative Commons by Attribution (CC-BY) license (http://creativecommons.org/licenses/by/4.0/).
Share and Cite
MDPI and ACS Style
Ring, F. The Herschel Heritage to Medical Thermography. J. Imaging 2016, 2, 13. https://0-doi-org.brum.beds.ac.uk/10.3390/jimaging2020013
AMA Style
Ring F. The Herschel Heritage to Medical Thermography. Journal of Imaging. 2016; 2(2):13. https://0-doi-org.brum.beds.ac.uk/10.3390/jimaging2020013
Chicago/Turabian StyleRing, Francis. 2016. "The Herschel Heritage to Medical Thermography" Journal of Imaging 2, no. 2: 13. https://0-doi-org.brum.beds.ac.uk/10.3390/jimaging2020013
Note that from the first issue of 2016, this journal uses article numbers instead of page numbers. See further details here.