A Survey of Deep Learning for Lung Disease Detection on Medical Images: State-of-the-Art, Taxonomy, Issues and Future Directions


Abstract
:1. Introduction
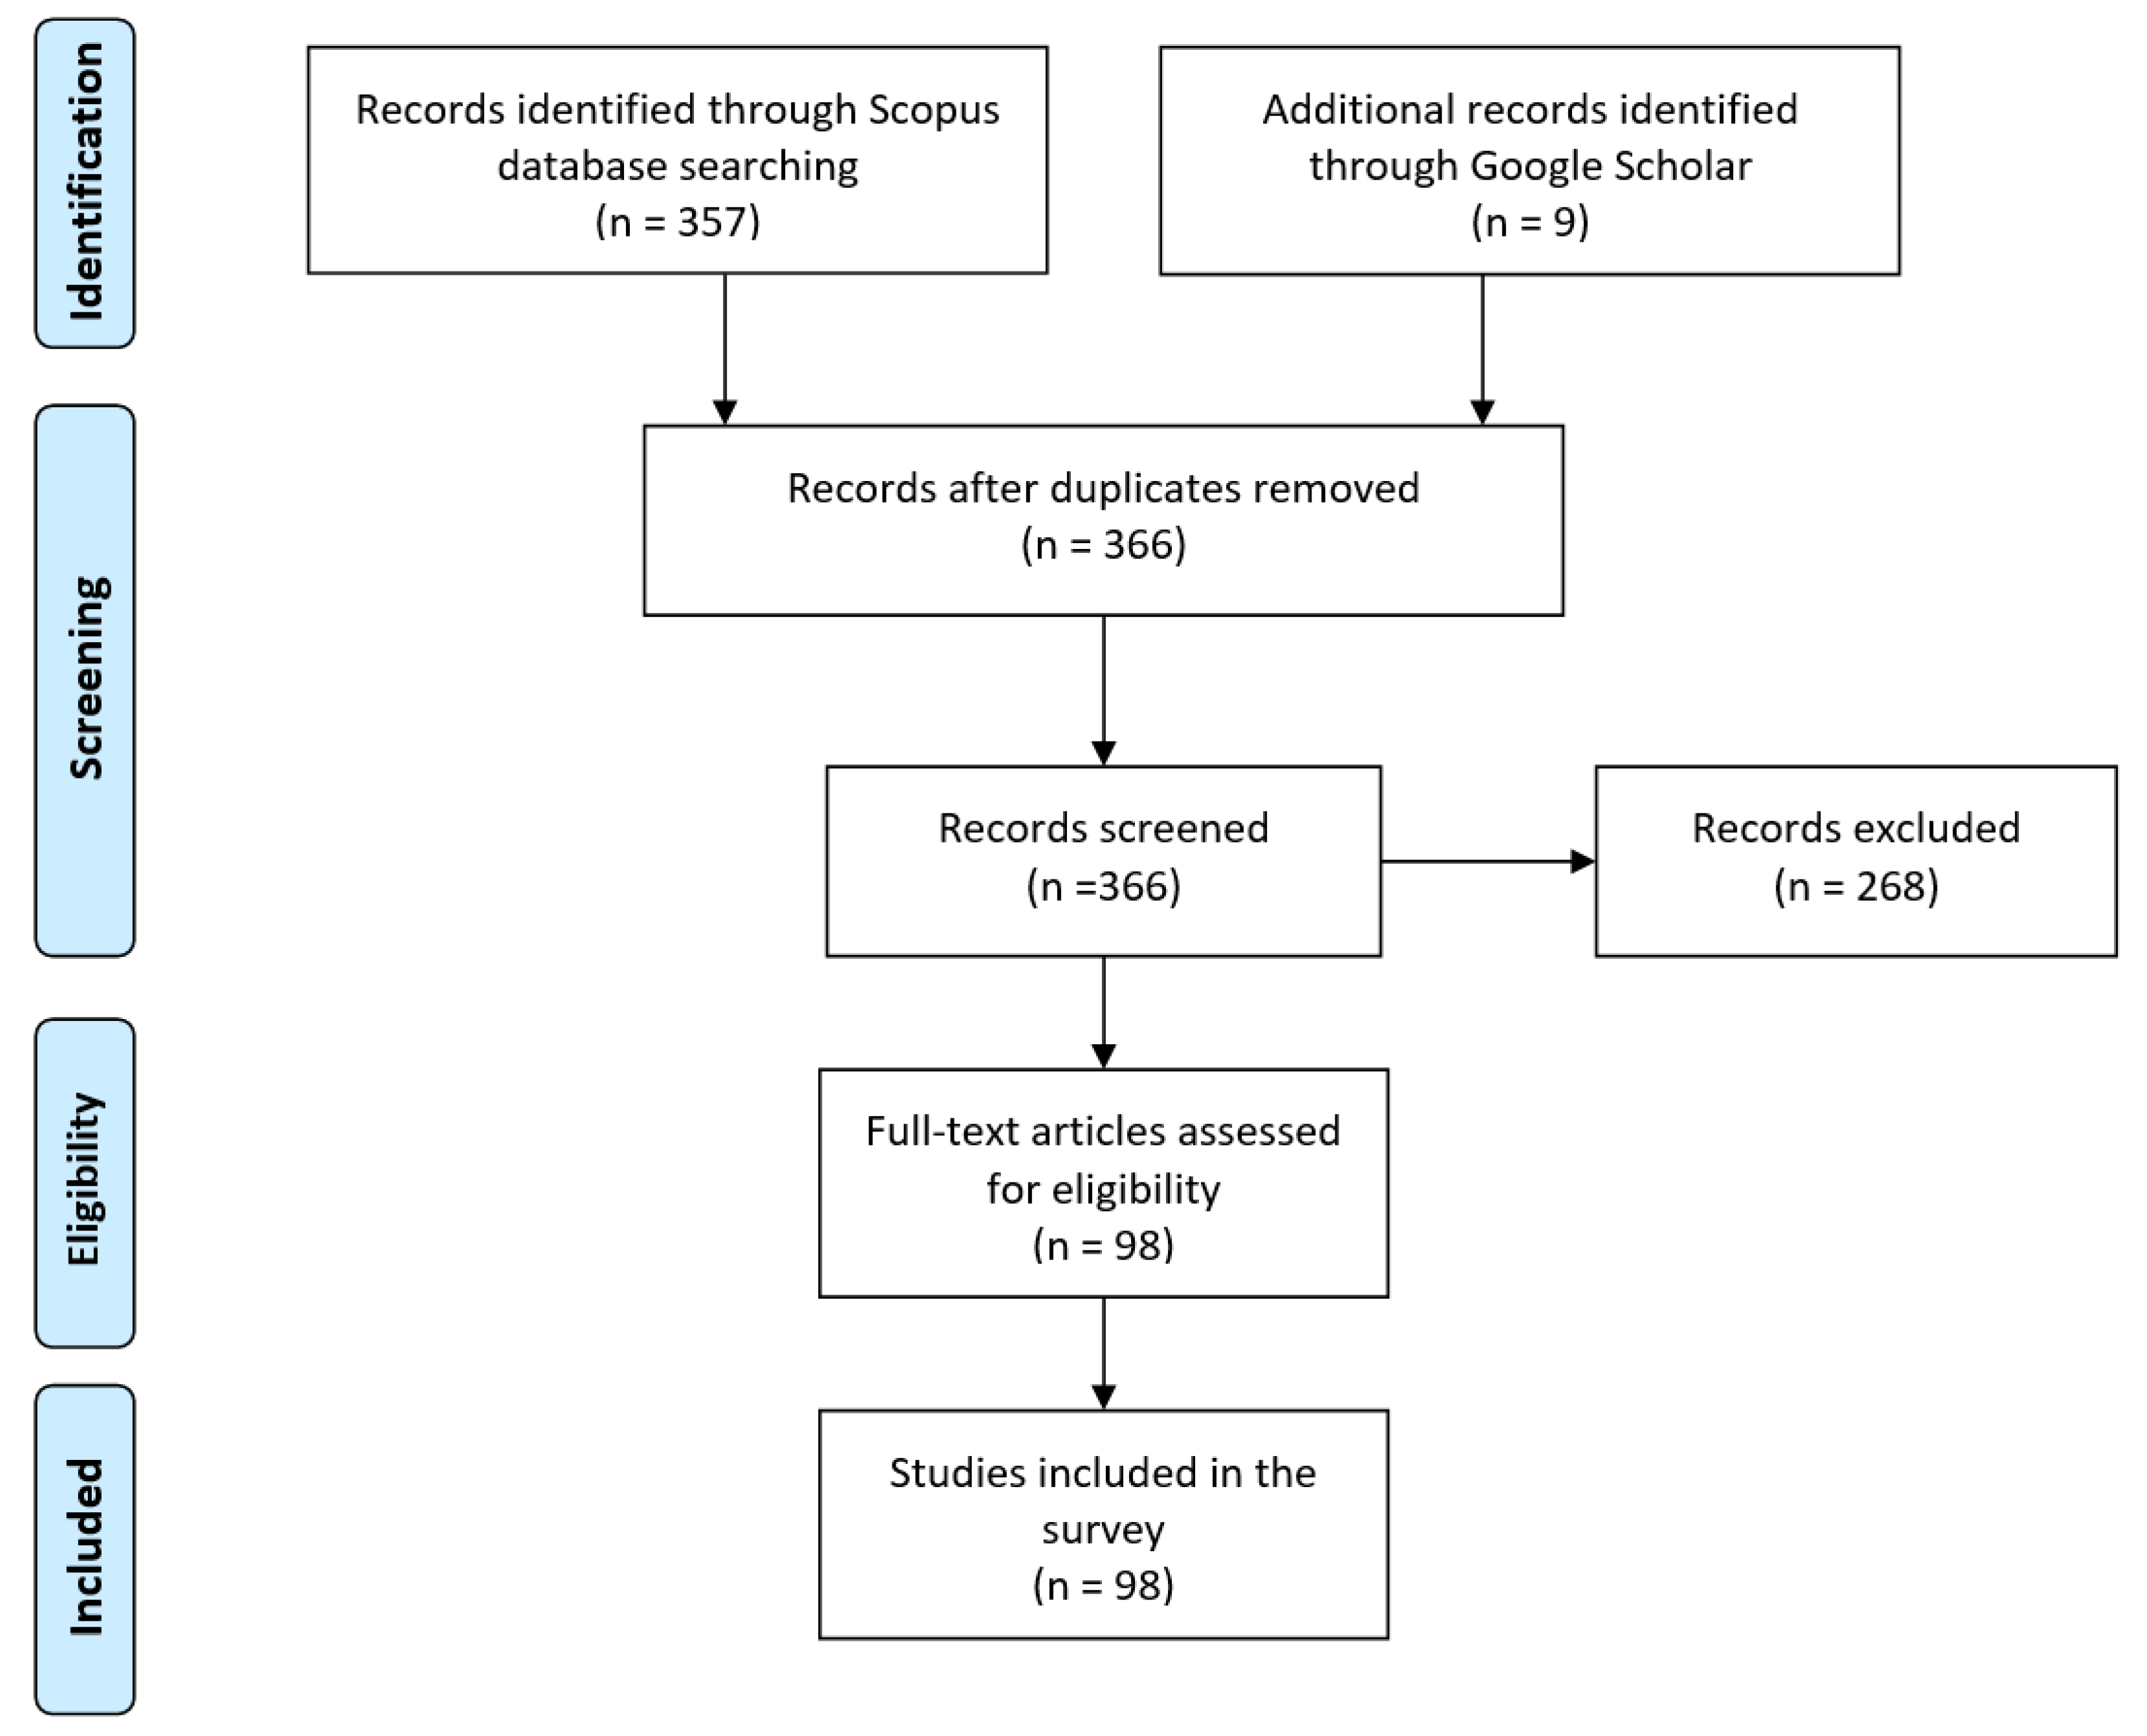
2. Methodology
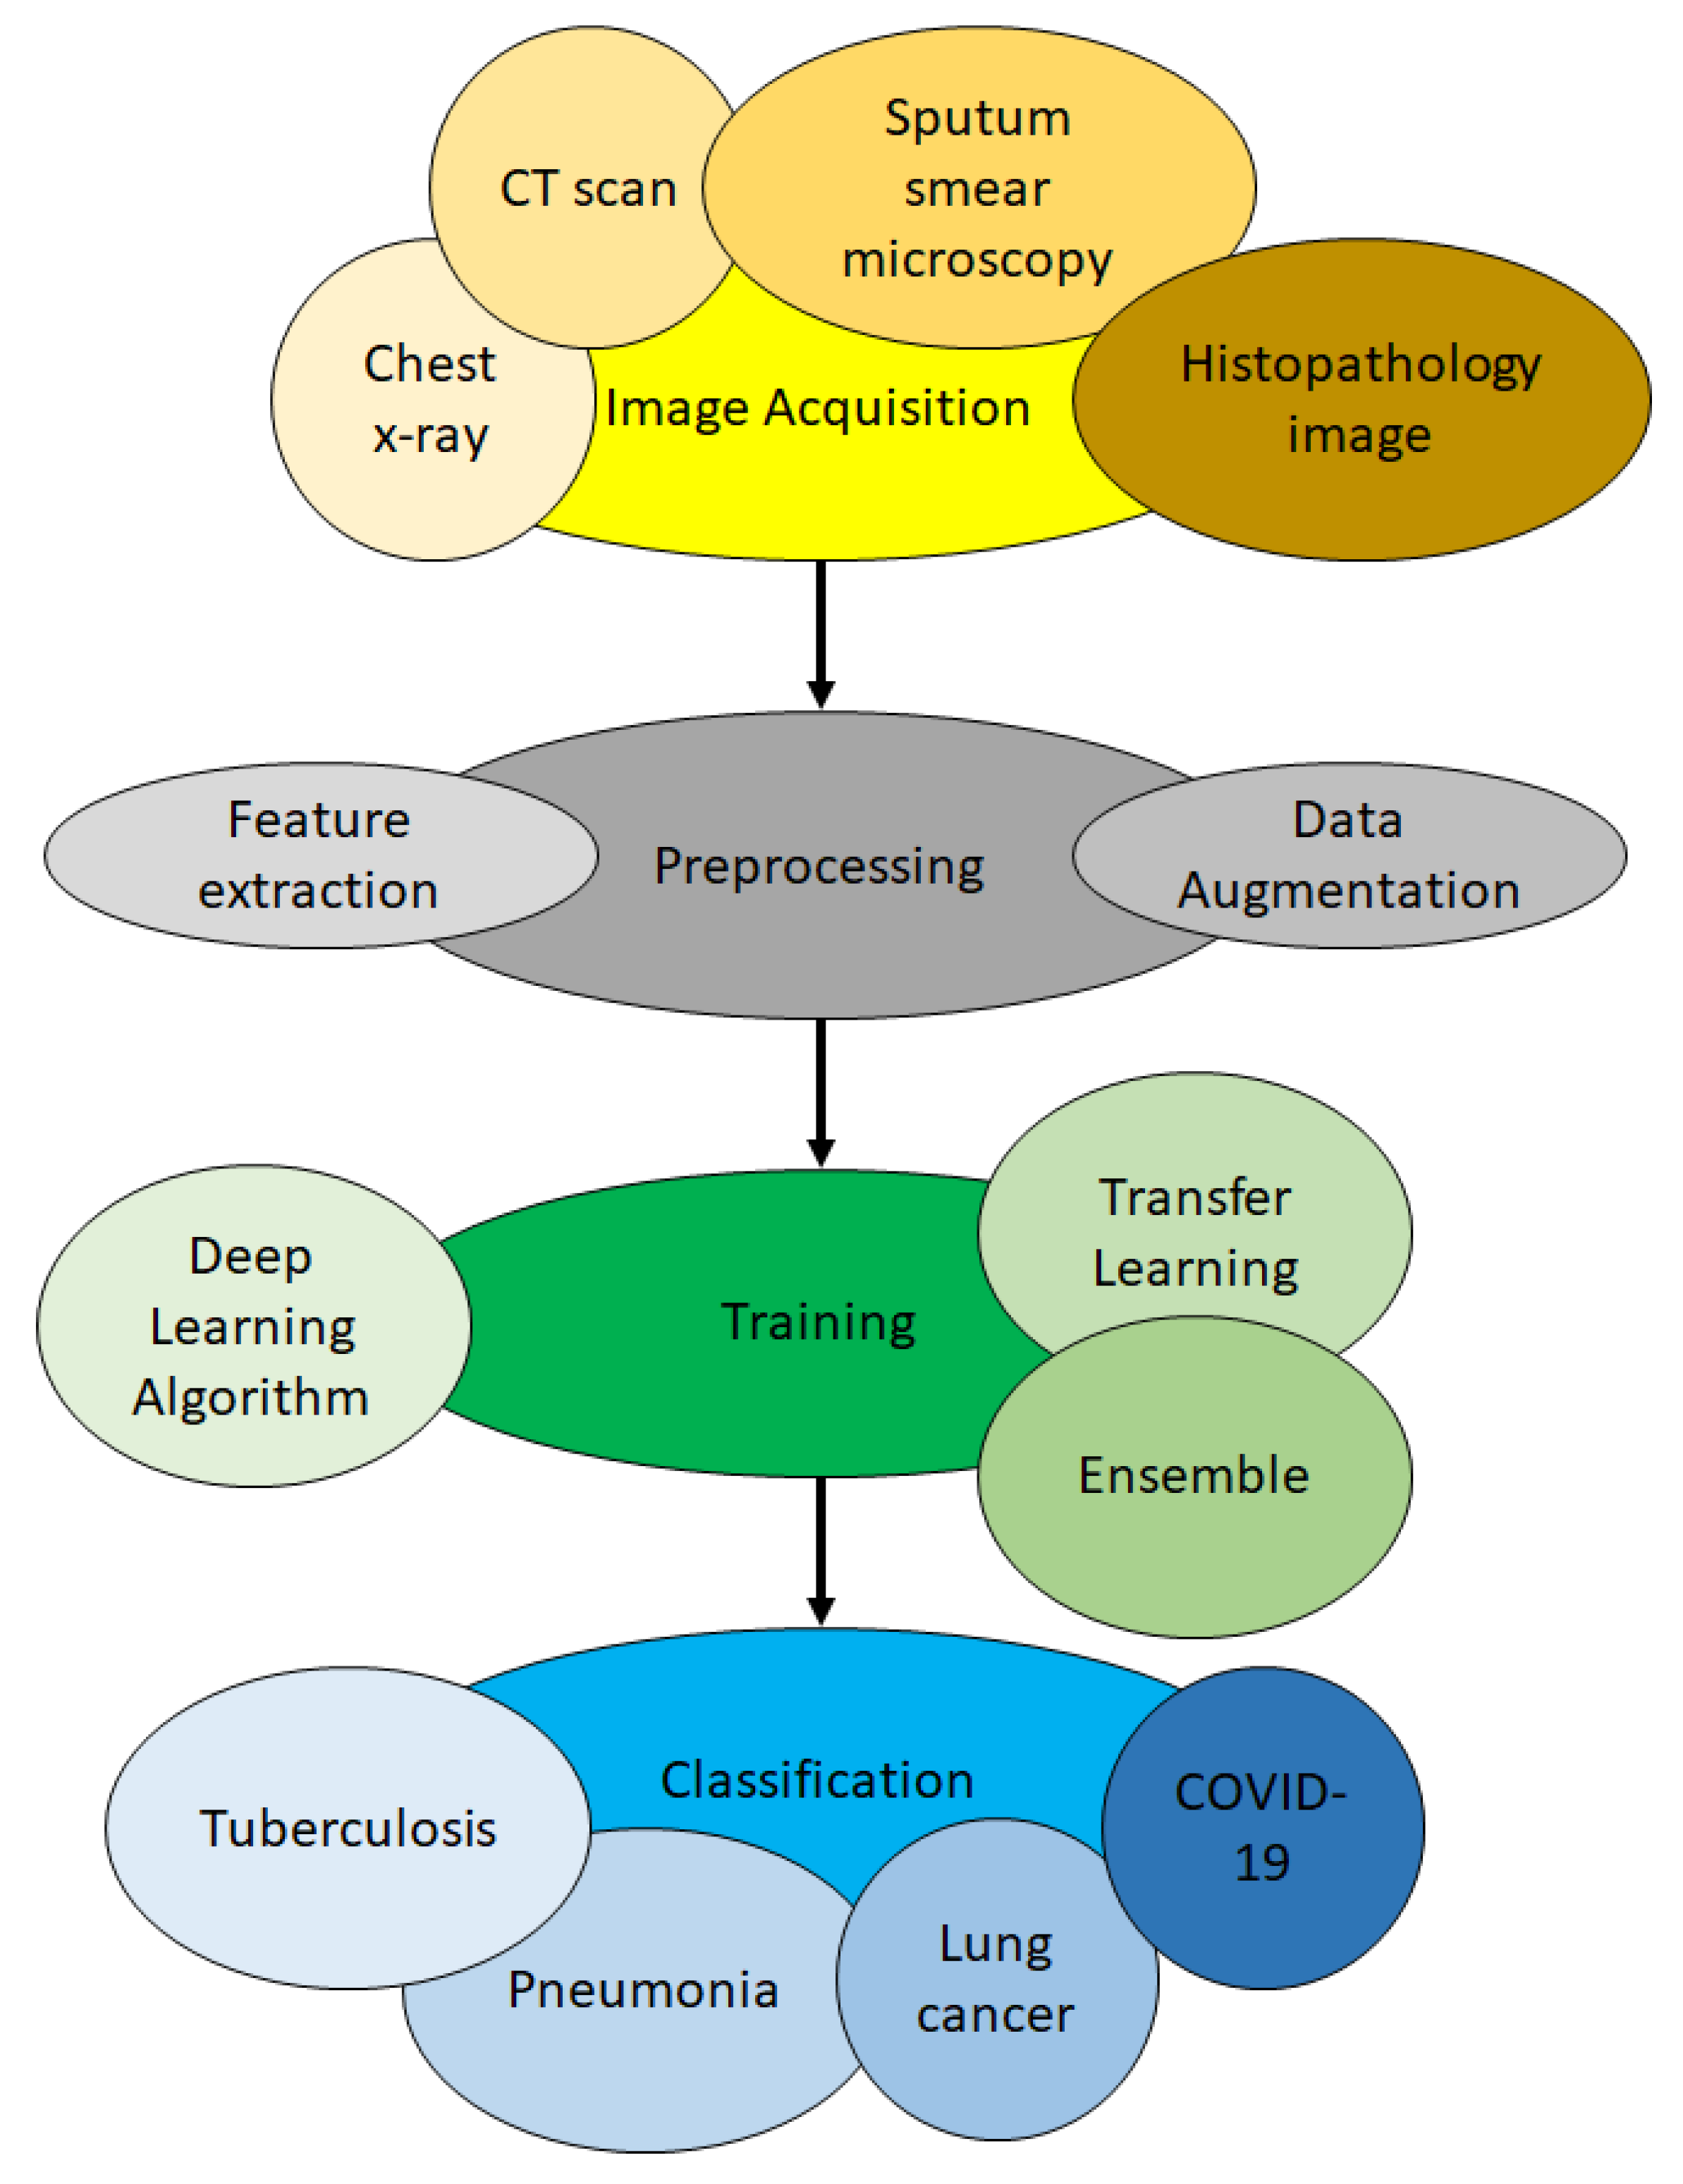
3. The Basic Process to Apply Deep Learning for Lung Disease Detection
3.1. Image Acquisition Phase
3.2. Preprocessing Phase
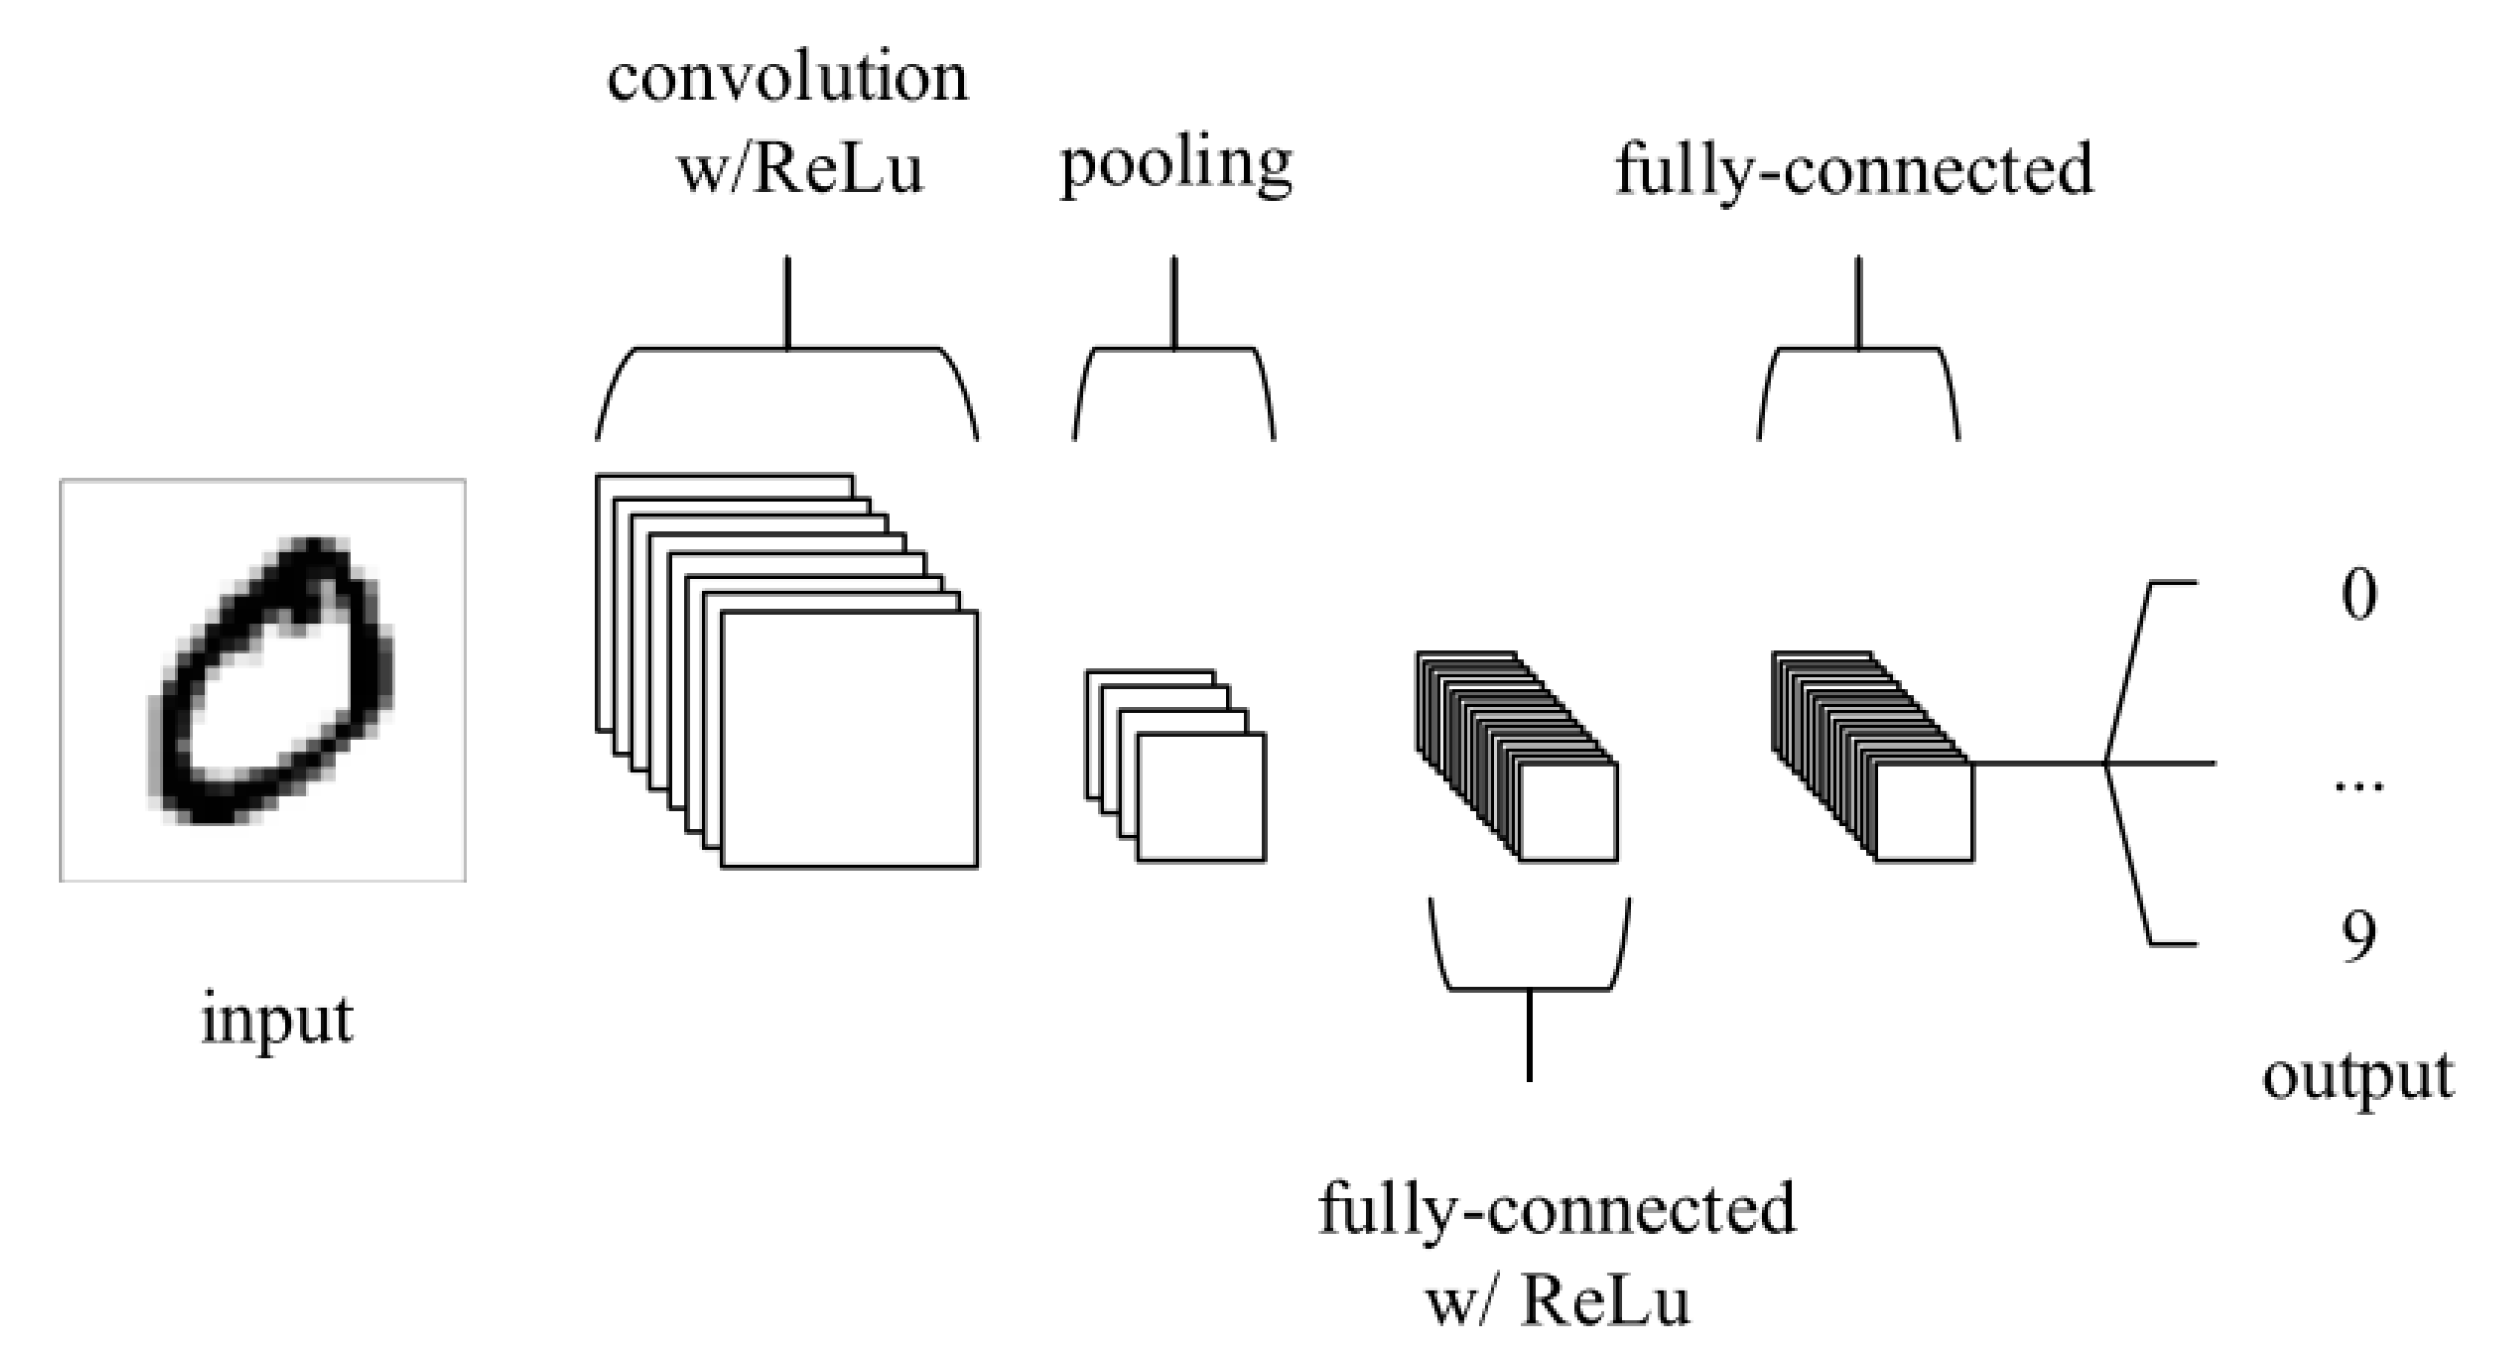
3.3. Training Phase
3.4. Classification Phase
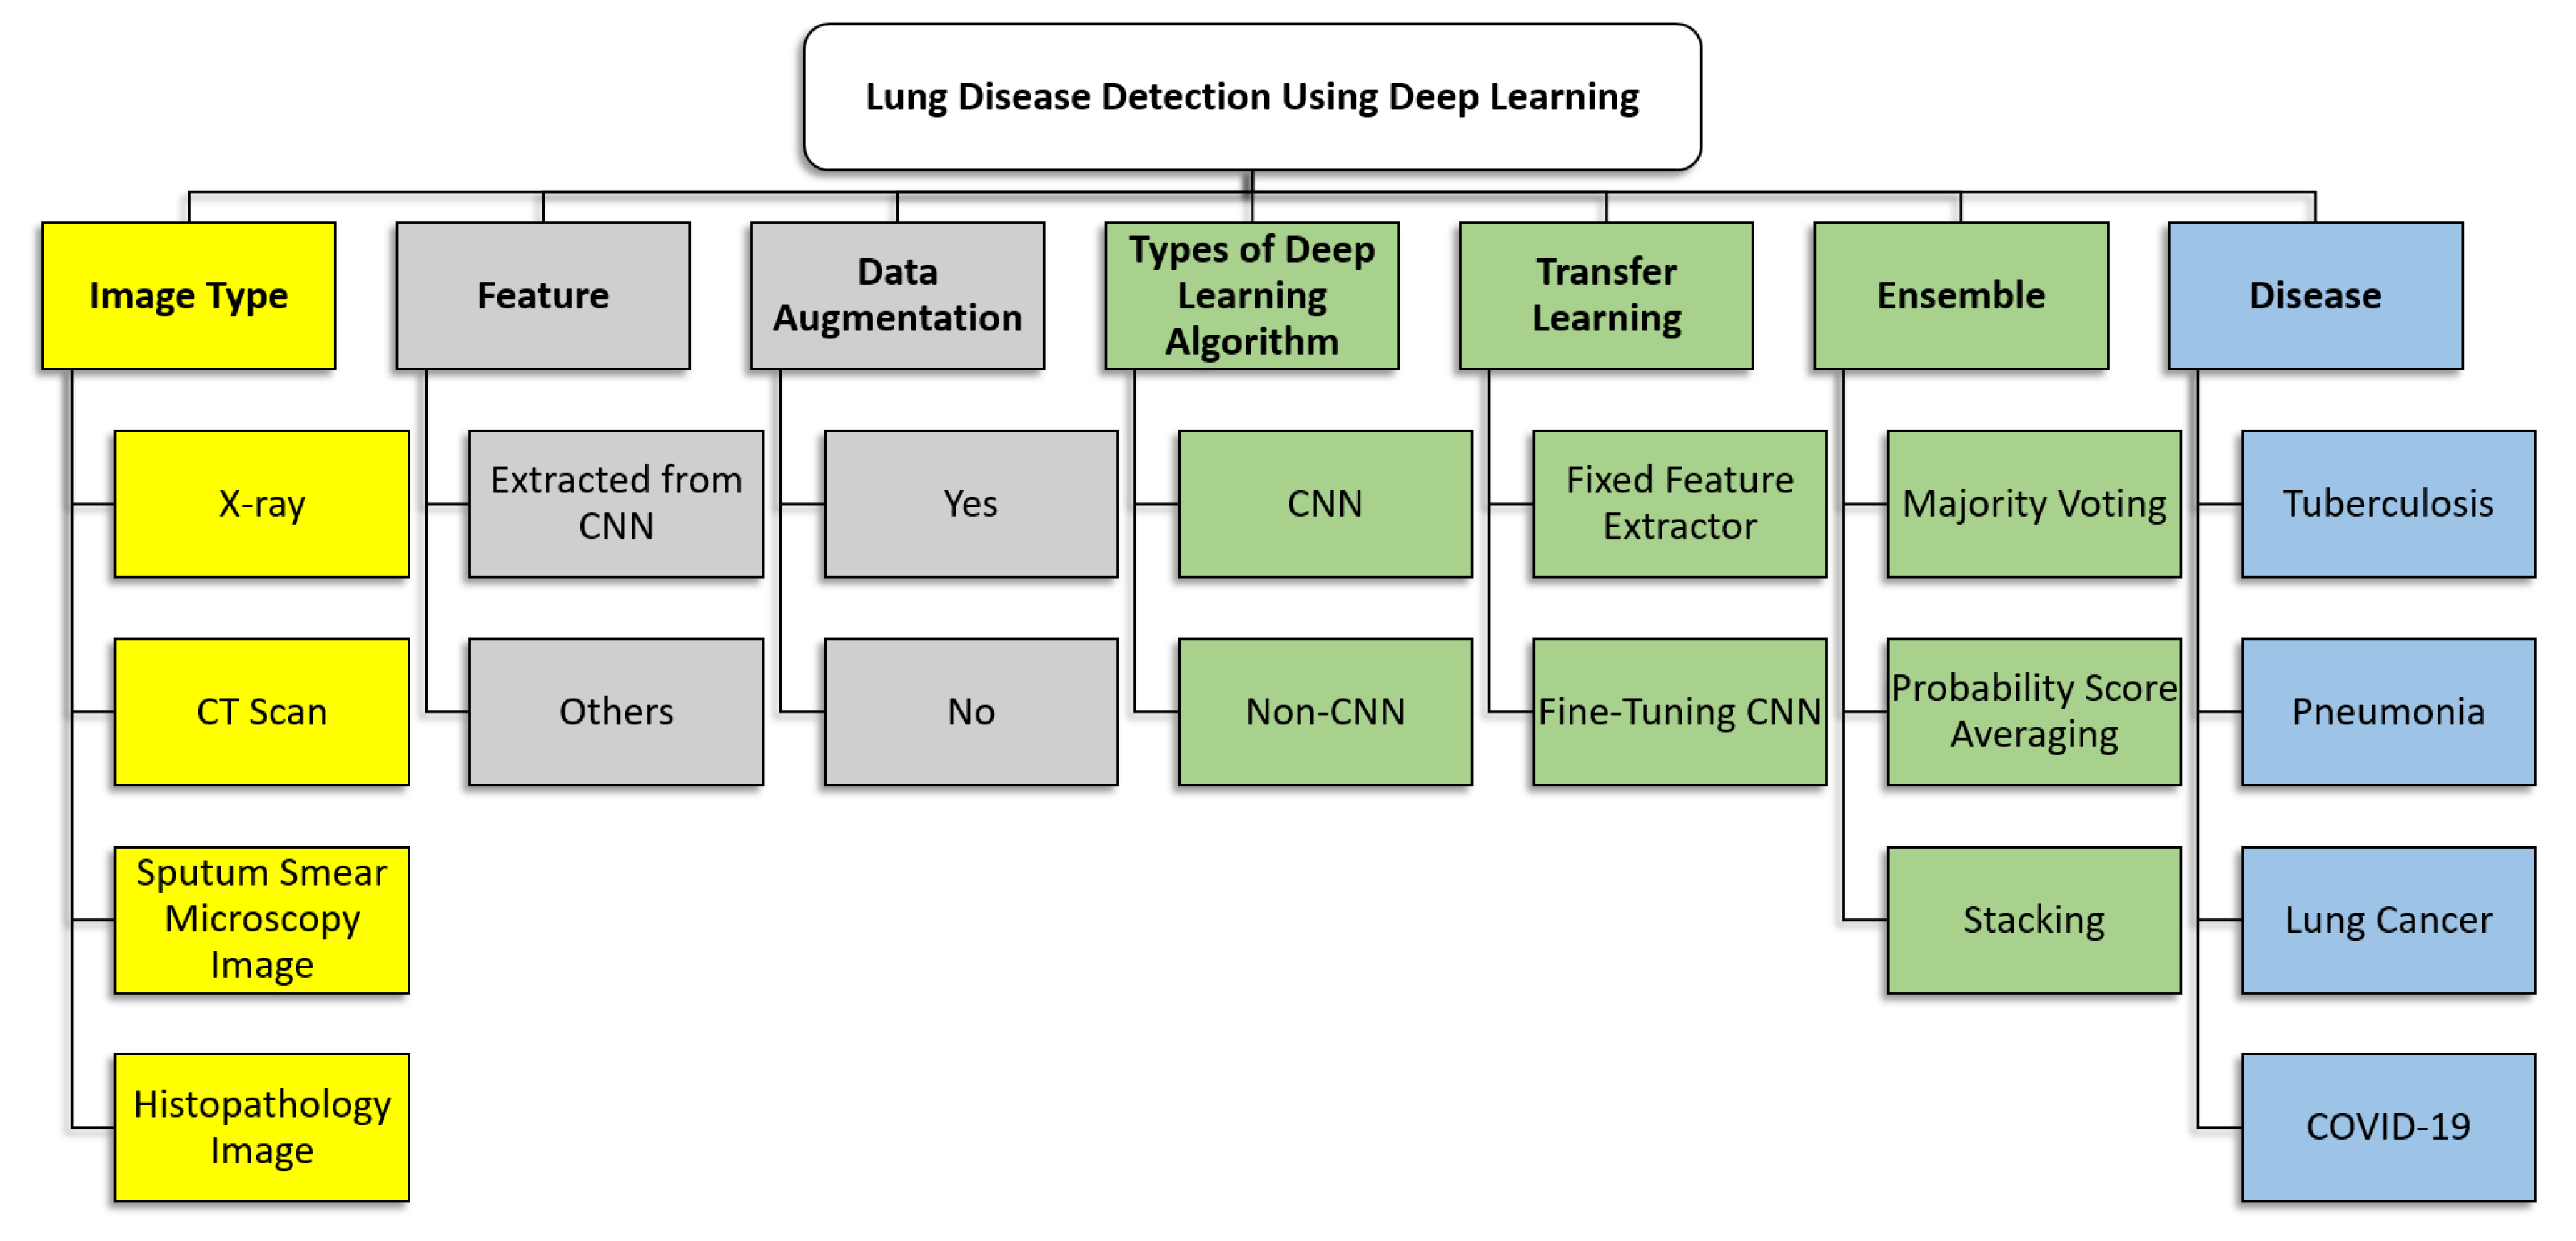
4. The Taxonomy of State-Of-The-Art Work on Lung Disease Detection Using Deep Learning
4.1. Image Type
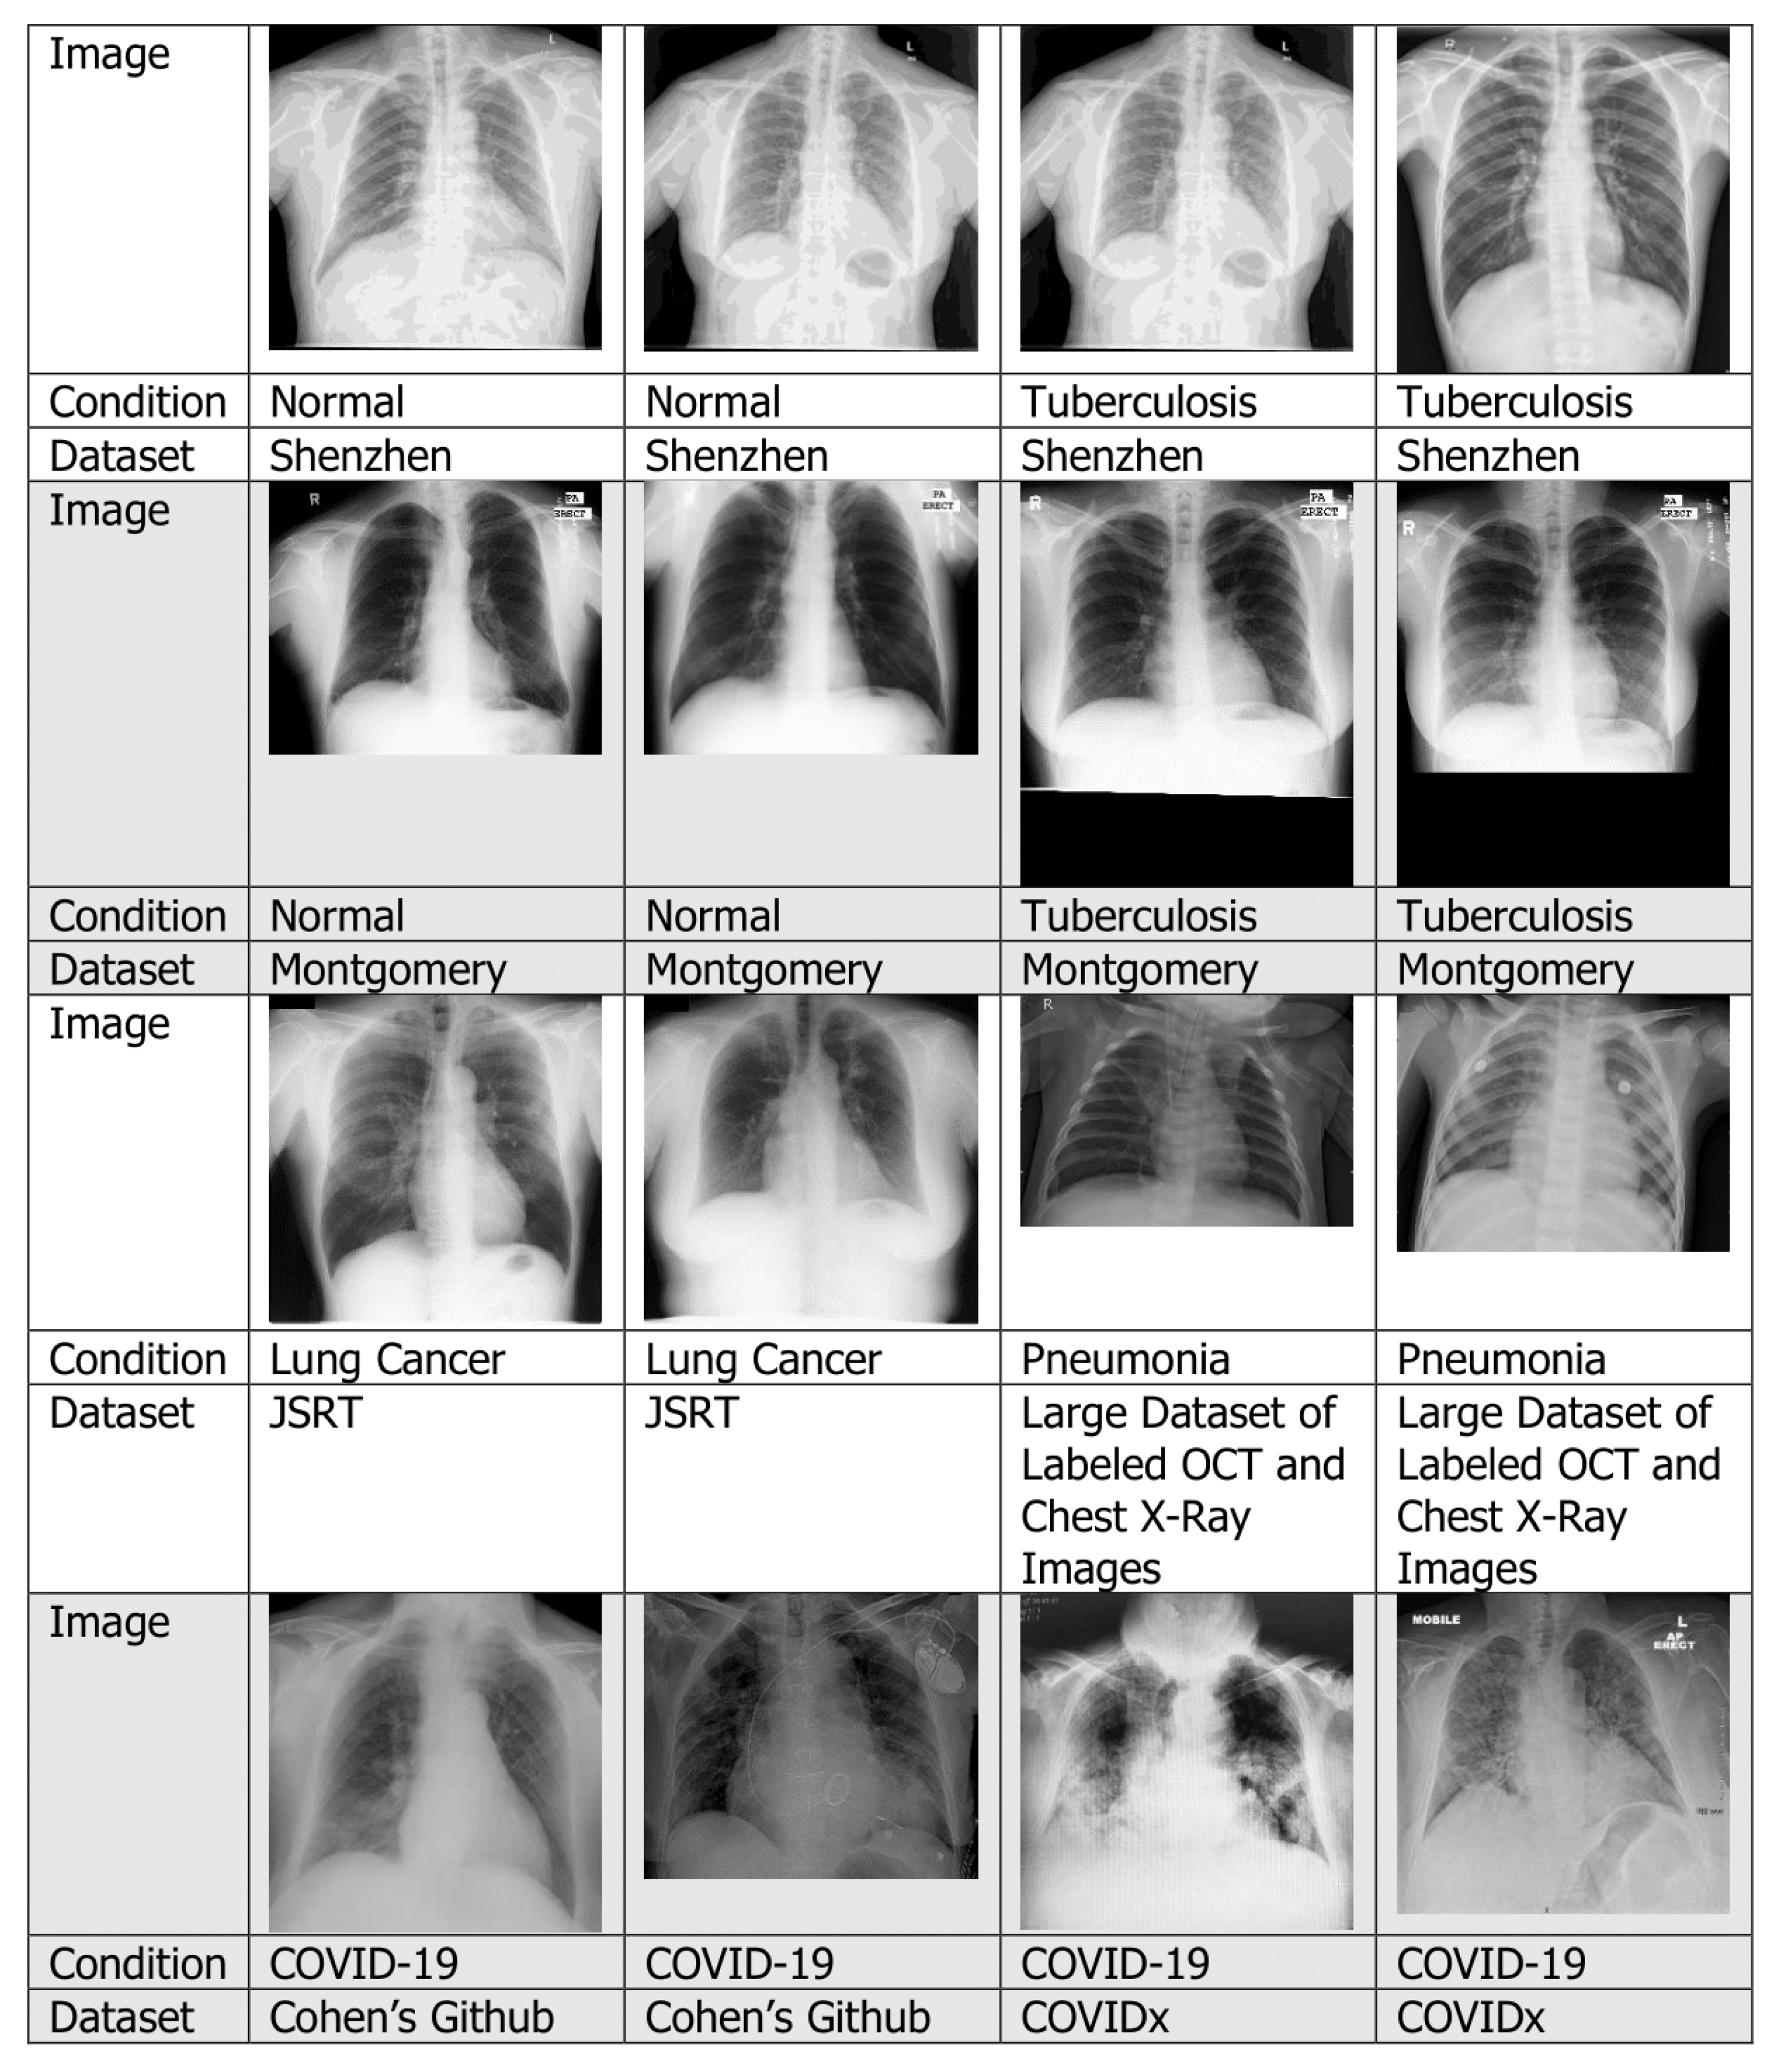
4.1.1. Chest X-rays
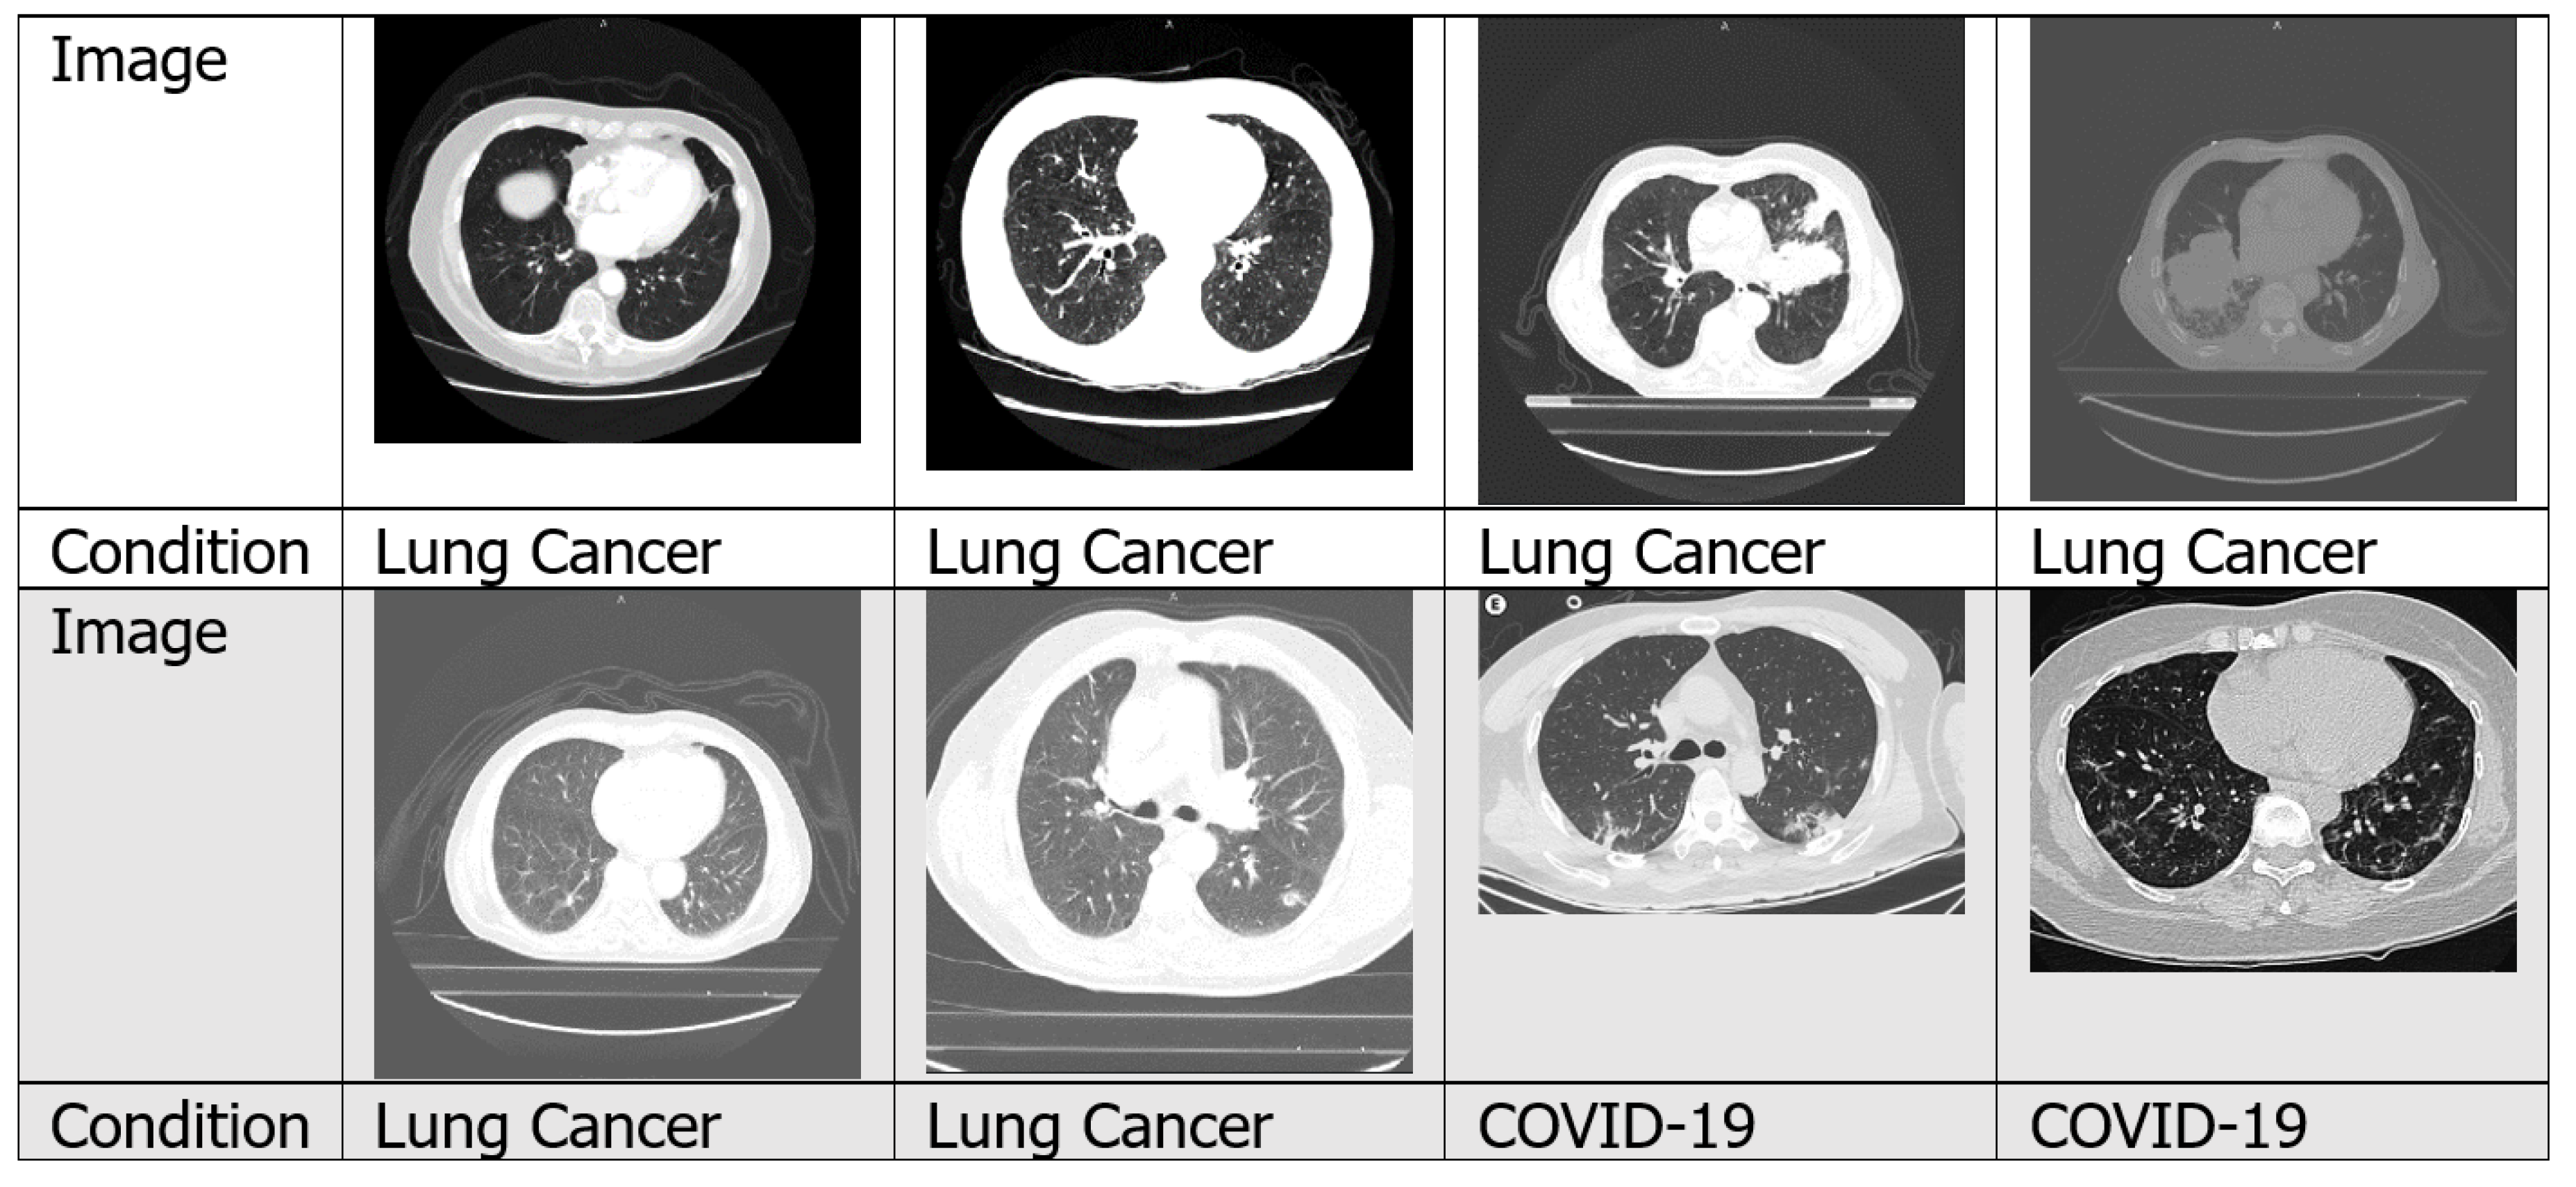
4.1.2. CT Scans
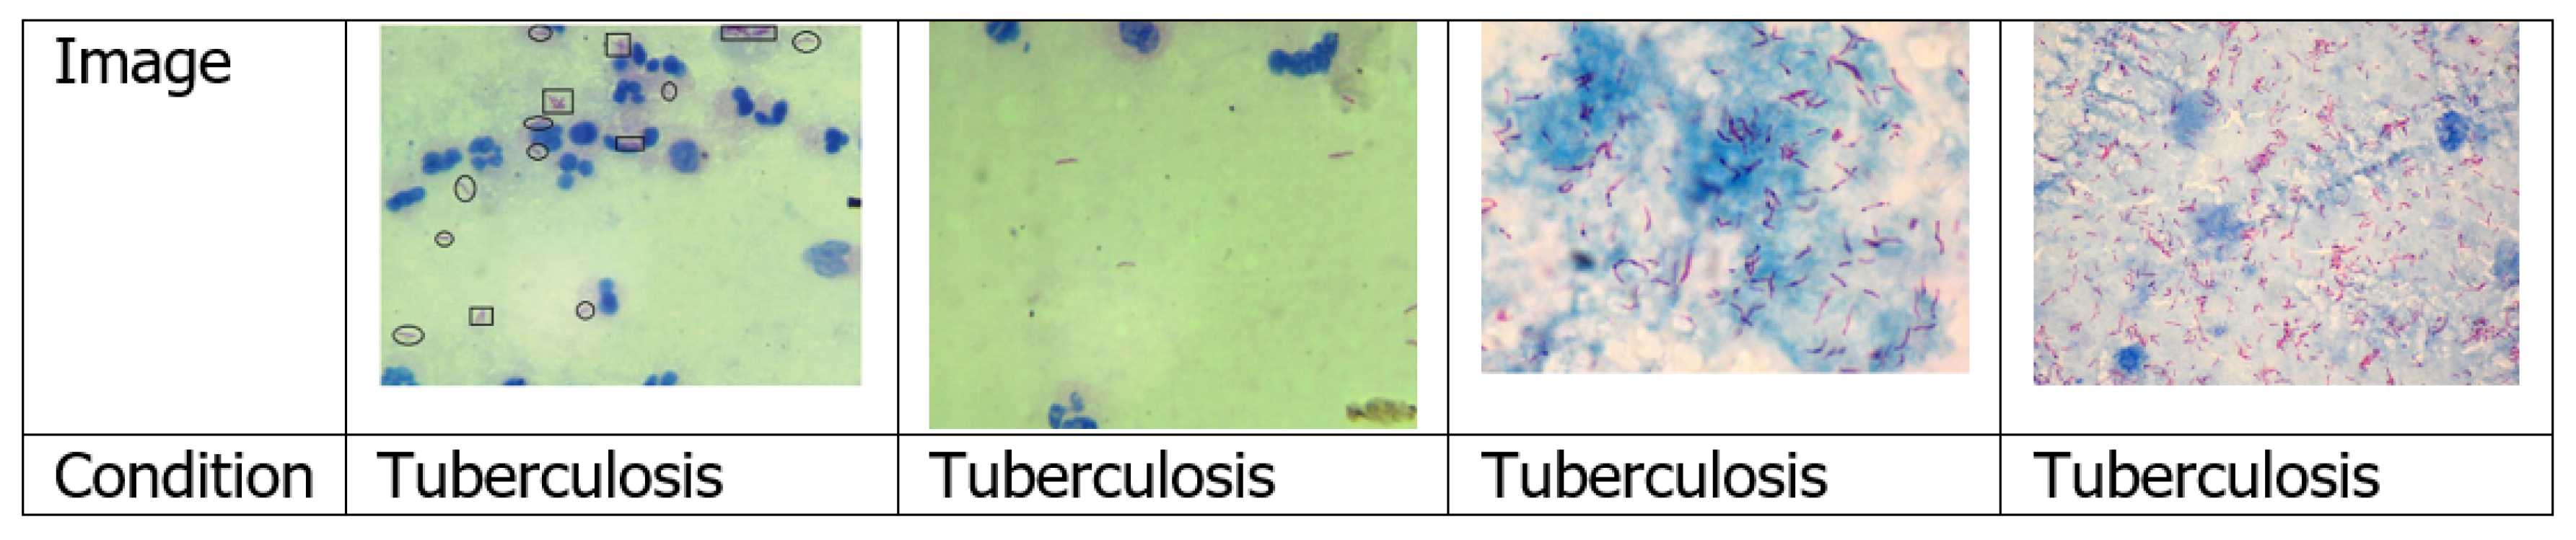
4.1.3. Sputum Smear Microscopy Images
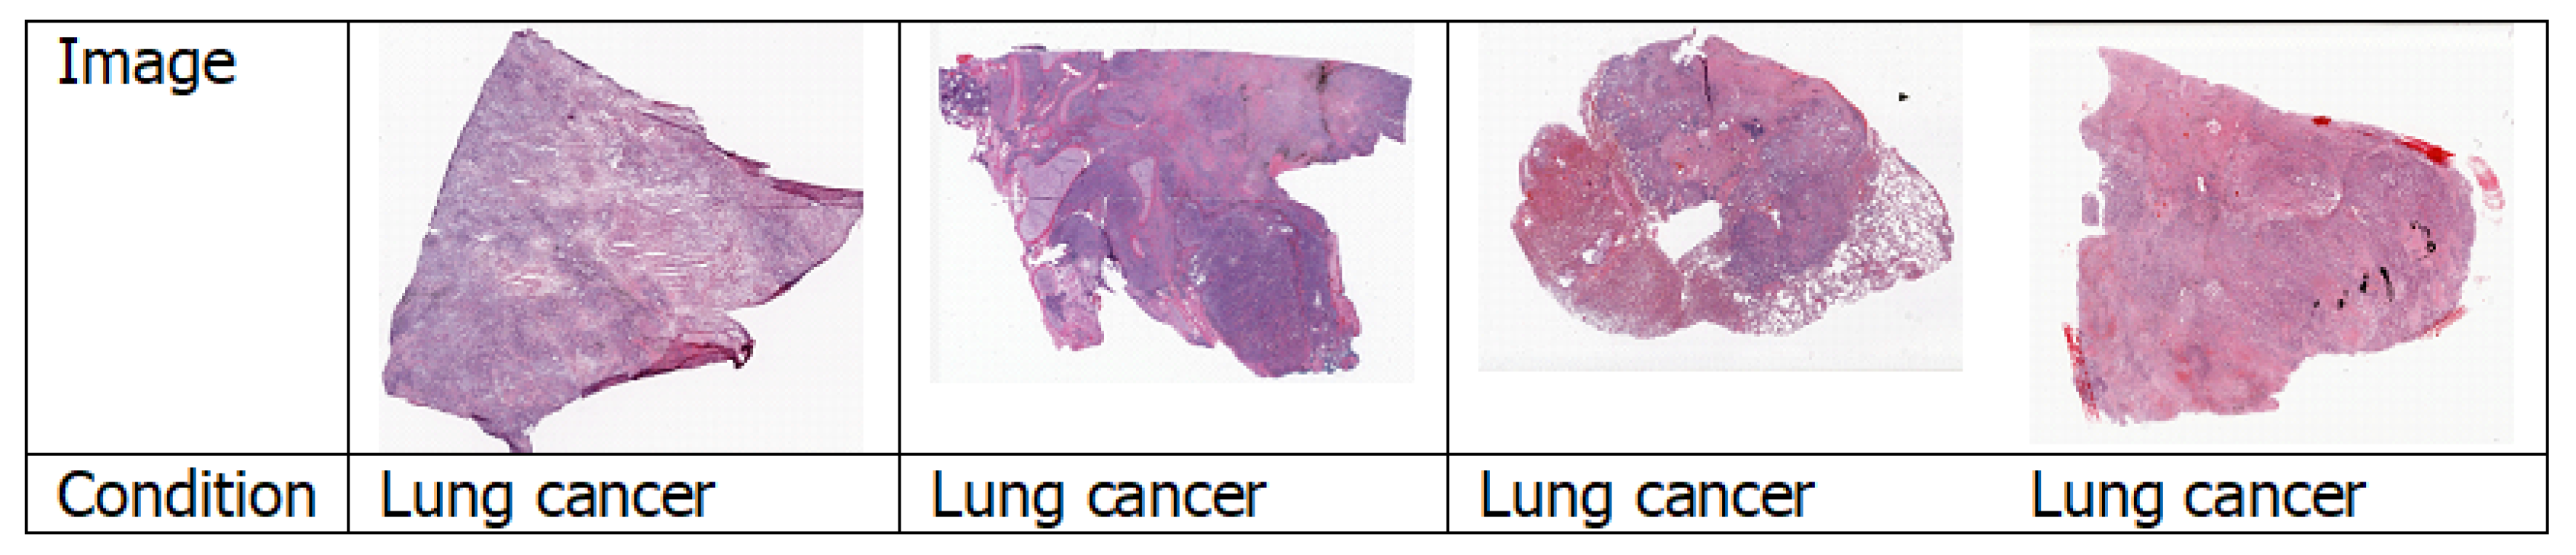
4.1.4. Histopathology Images
4.2. Features
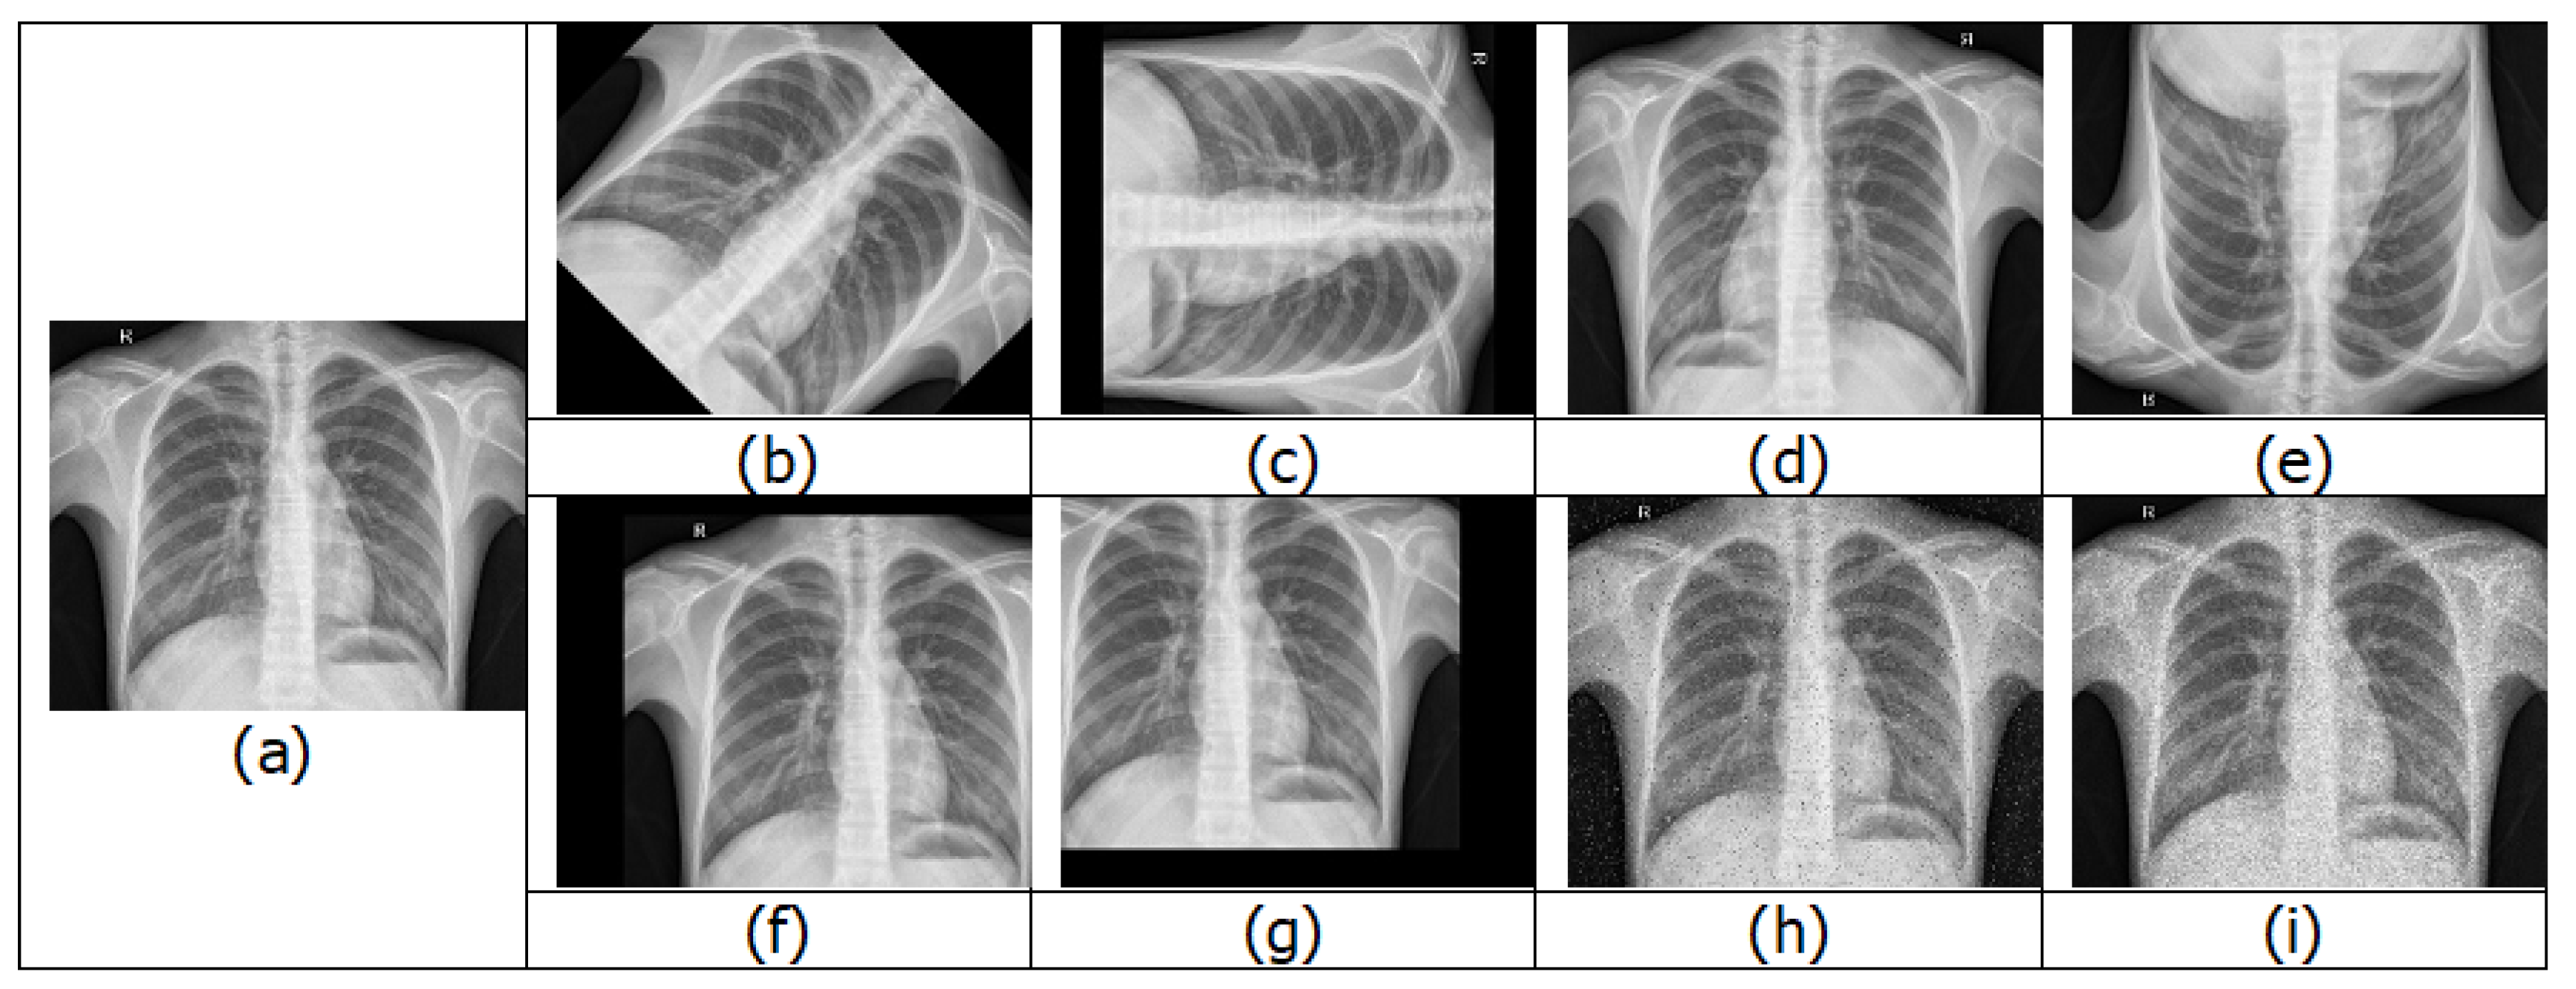
4.3. Data Augmentation
4.4. Types of Deep Learning Algorithm
4.5. Transfer Learning
4.6. Ensemble of Classifiers
4.7. Type of Disease
4.7.1. Tuberculosis
4.7.2. Pneumonia
4.7.3. Lung Cancer
4.7.4. COVID-19
4.8. Dataset
5. Analysis of Trend, Issues and Future Directions of Lung Disease Detection Using Deep Learning
5.1. An Analysis of the Trend of Lung Disease Detection in Recent Years
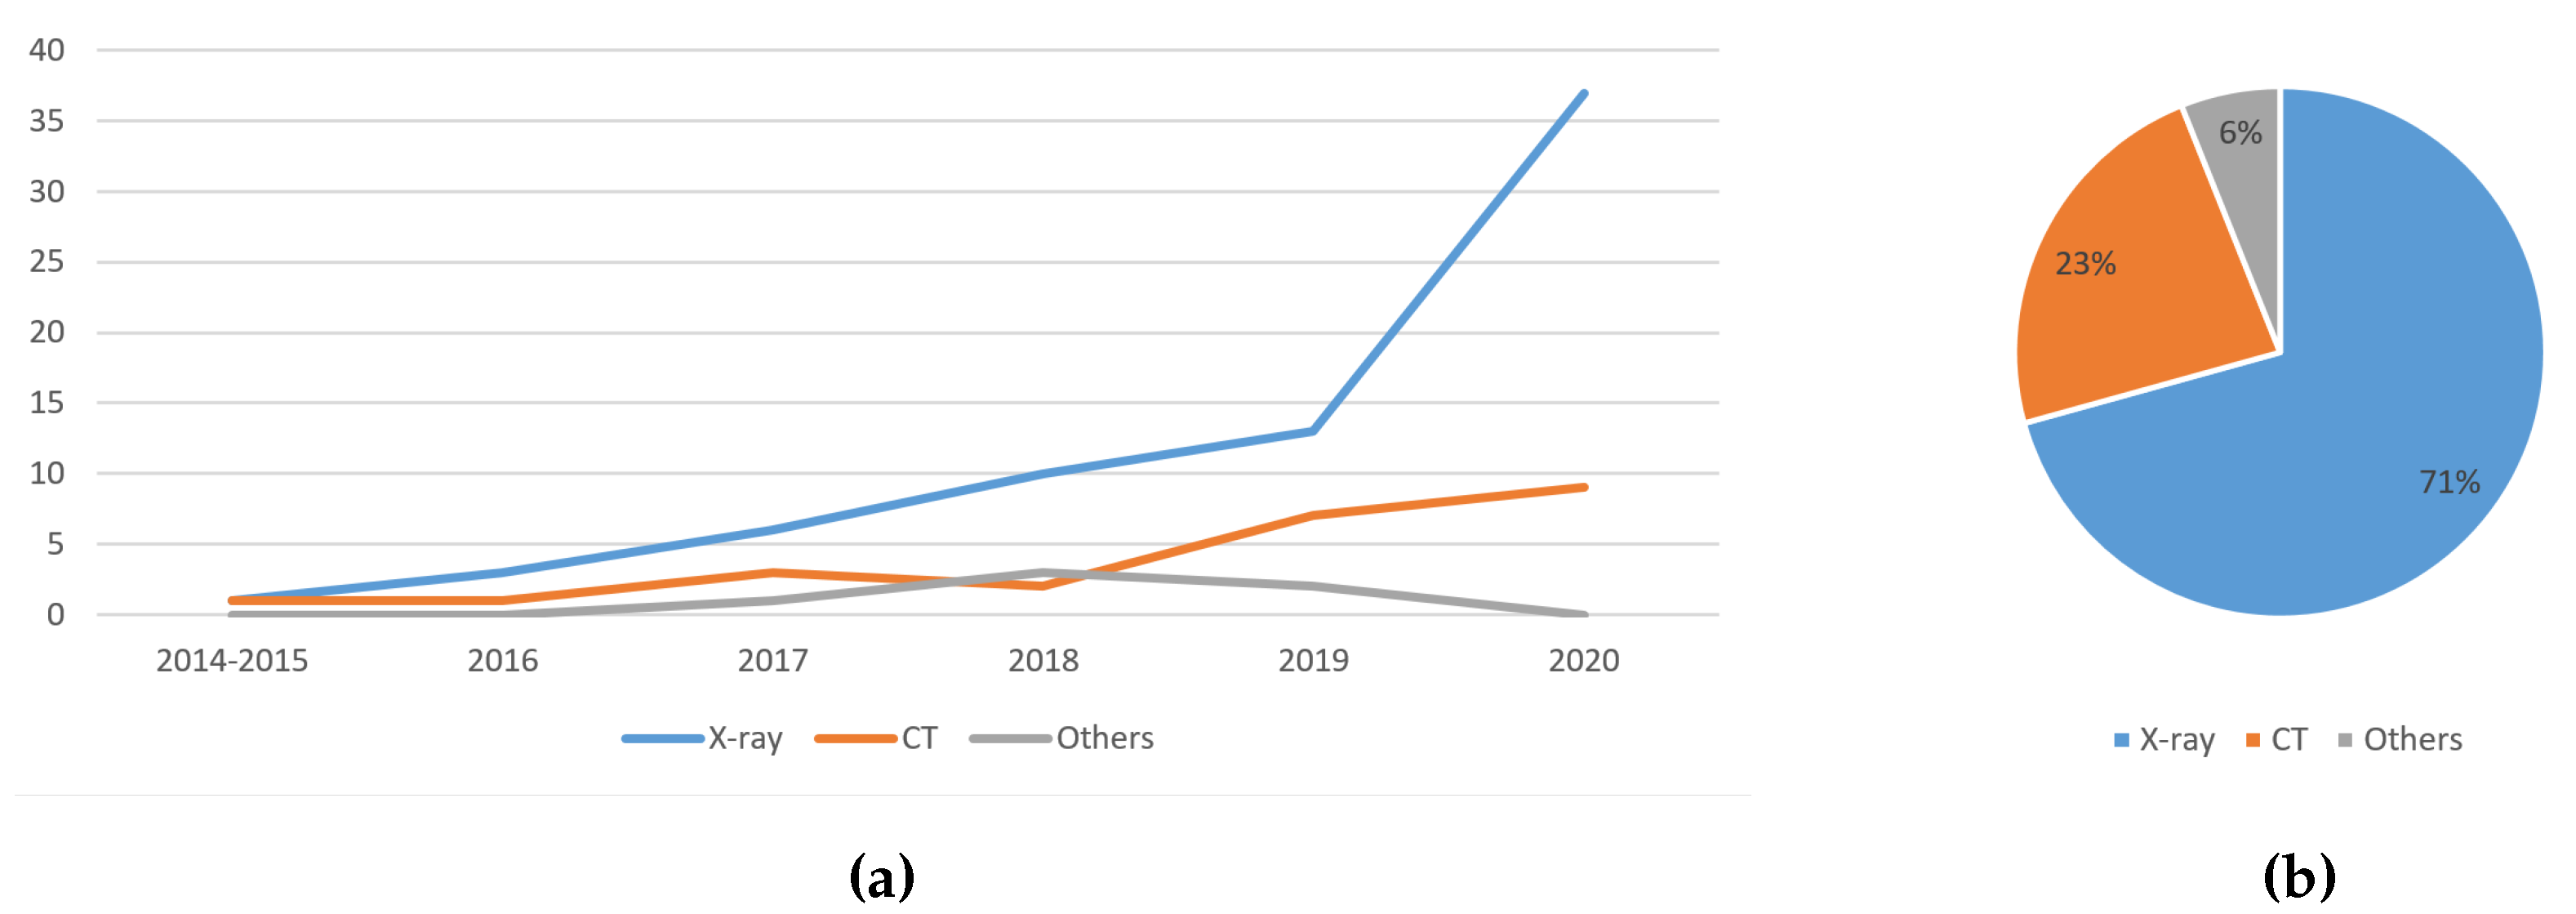
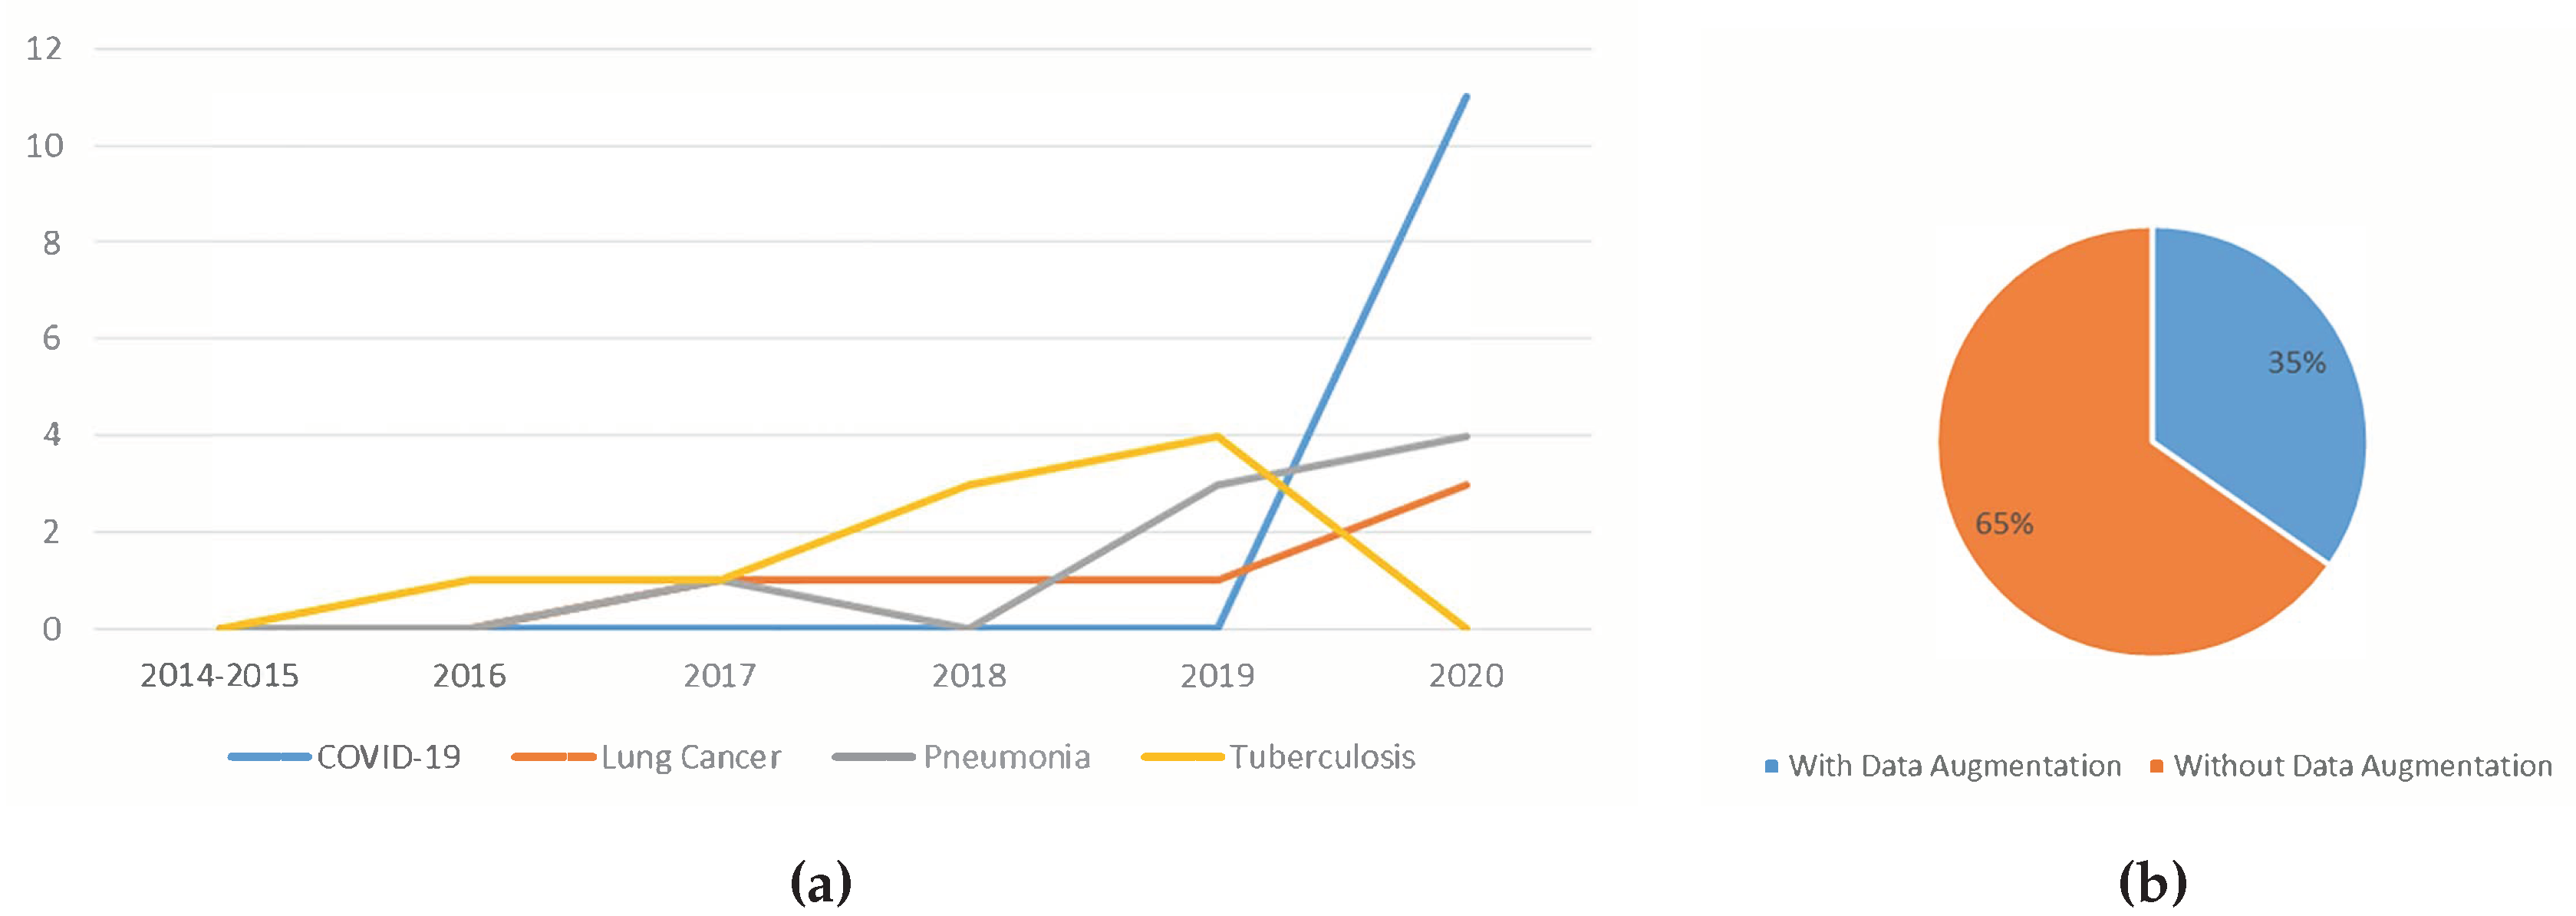
5.1.1. Trend Analysis of the Image Type Used
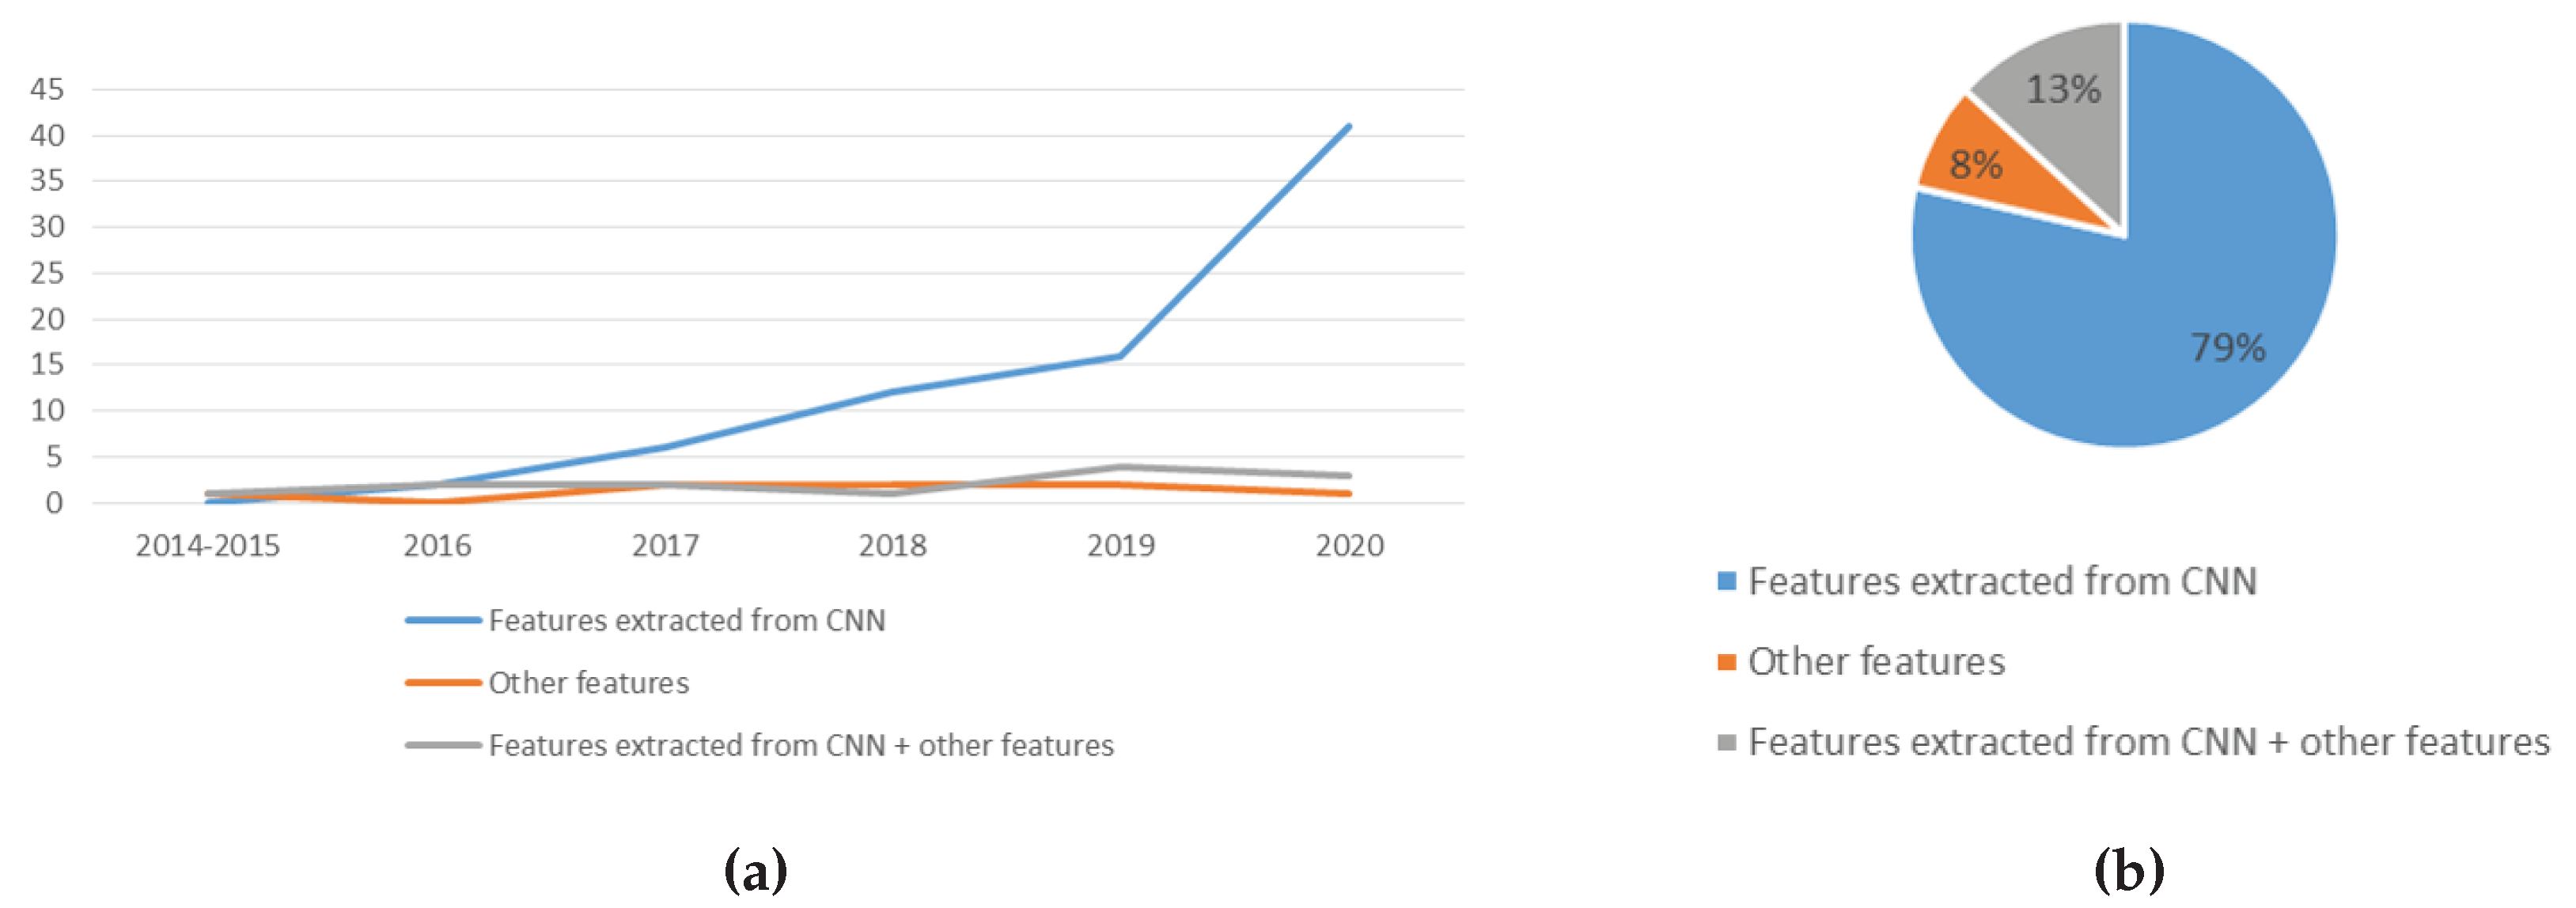
5.1.2. Trend Analysis of the Features Used
5.1.3. Trend Analysis of the Usage of Data Augmentation
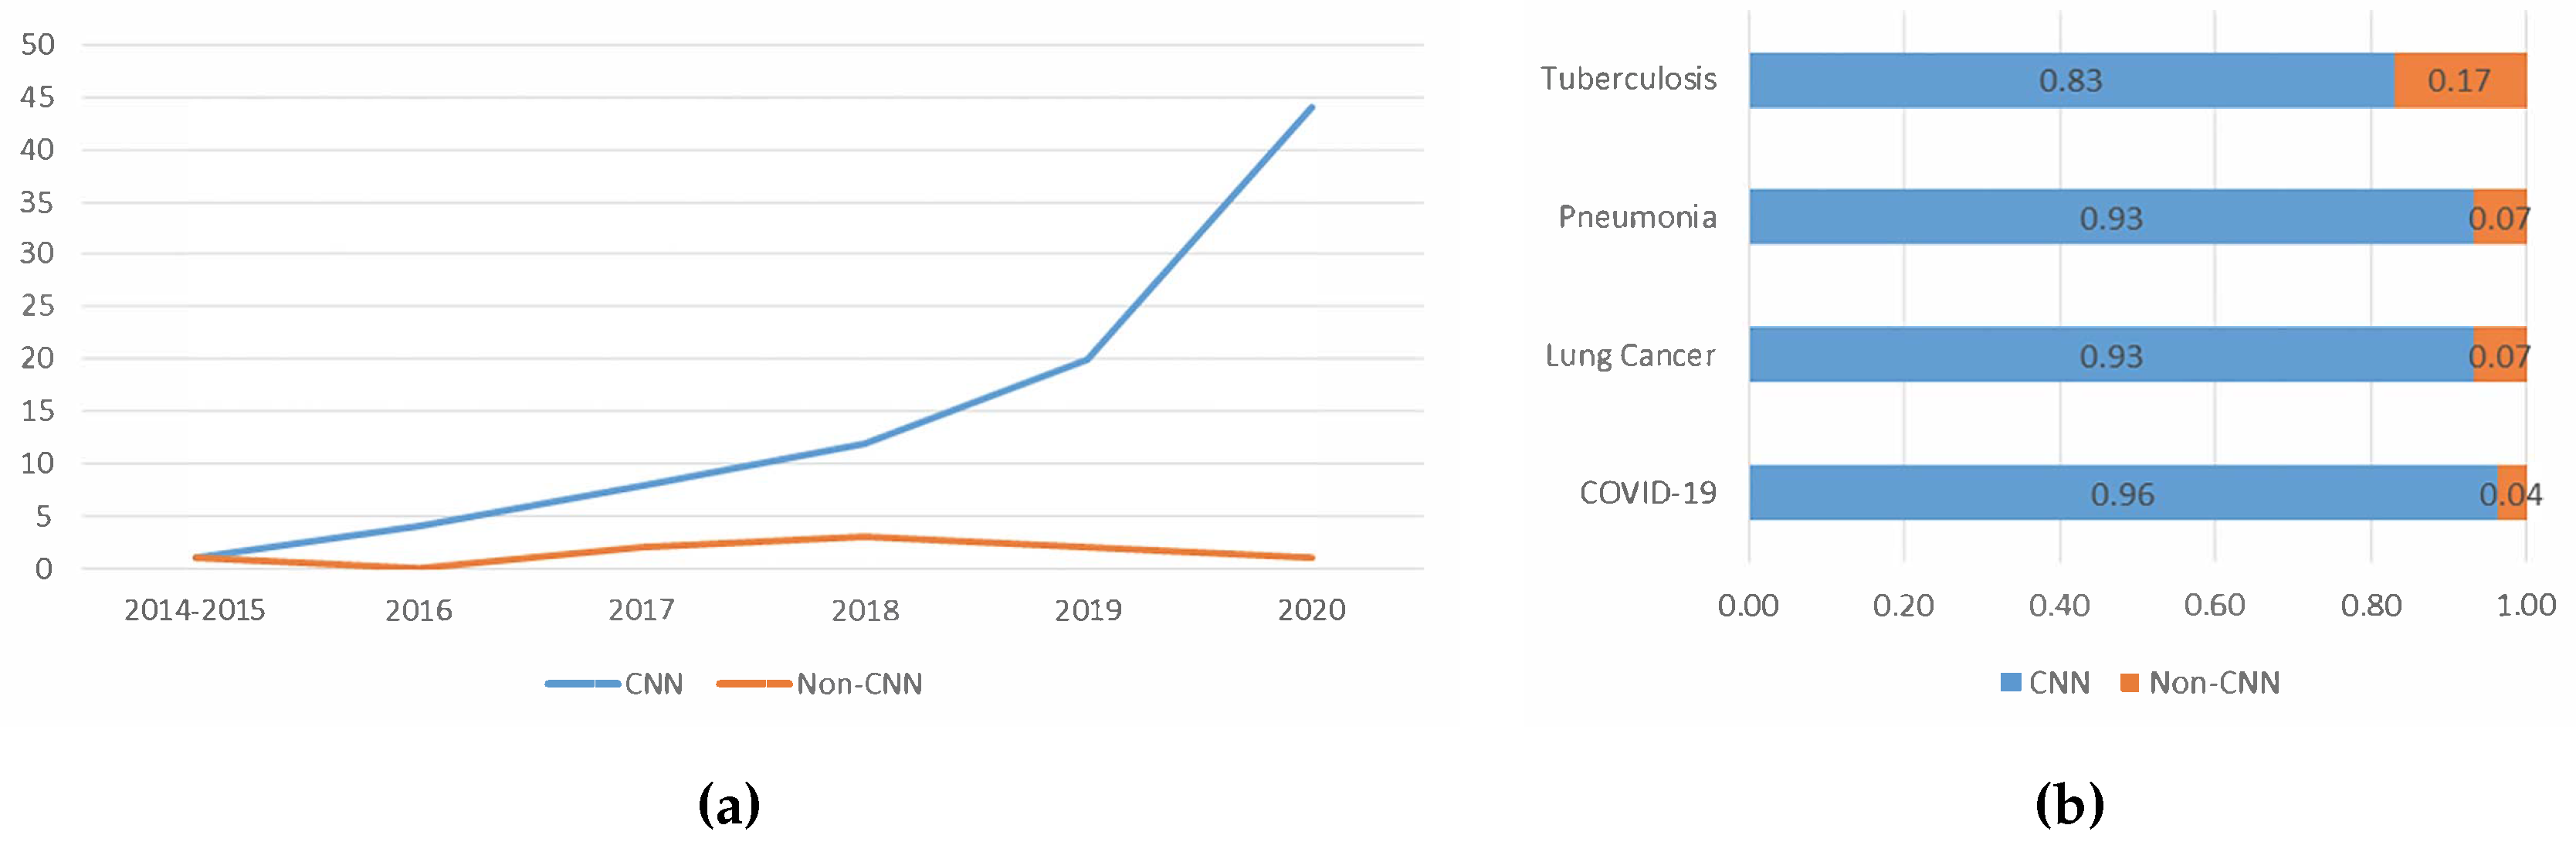
5.1.4. Trend Analysis of the Types of Deep Learning Algorithm Used
5.1.5. Trend Analysis of the Usage Of Transfer Learning
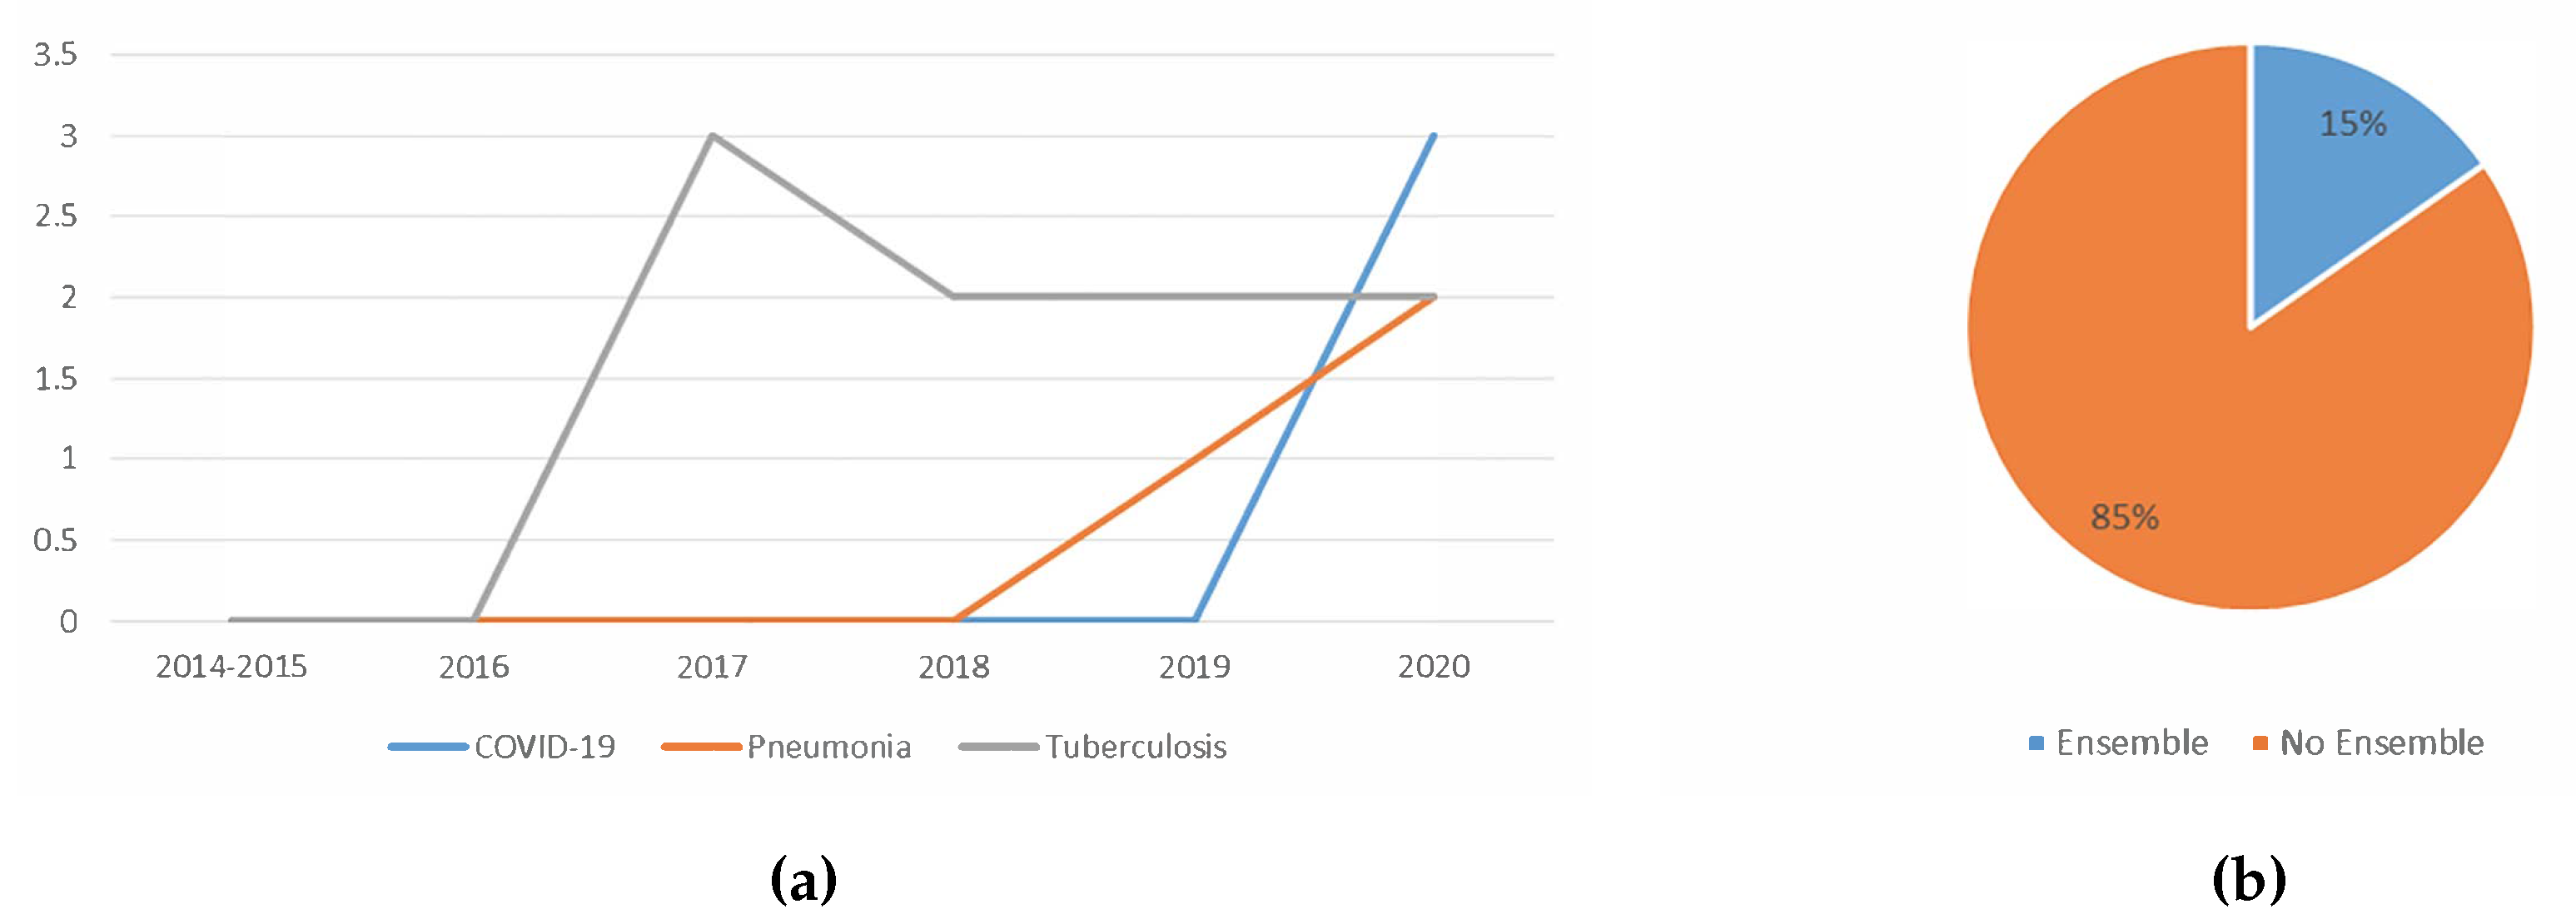
5.1.6. Trend Analysis of the Usage Of Ensemble
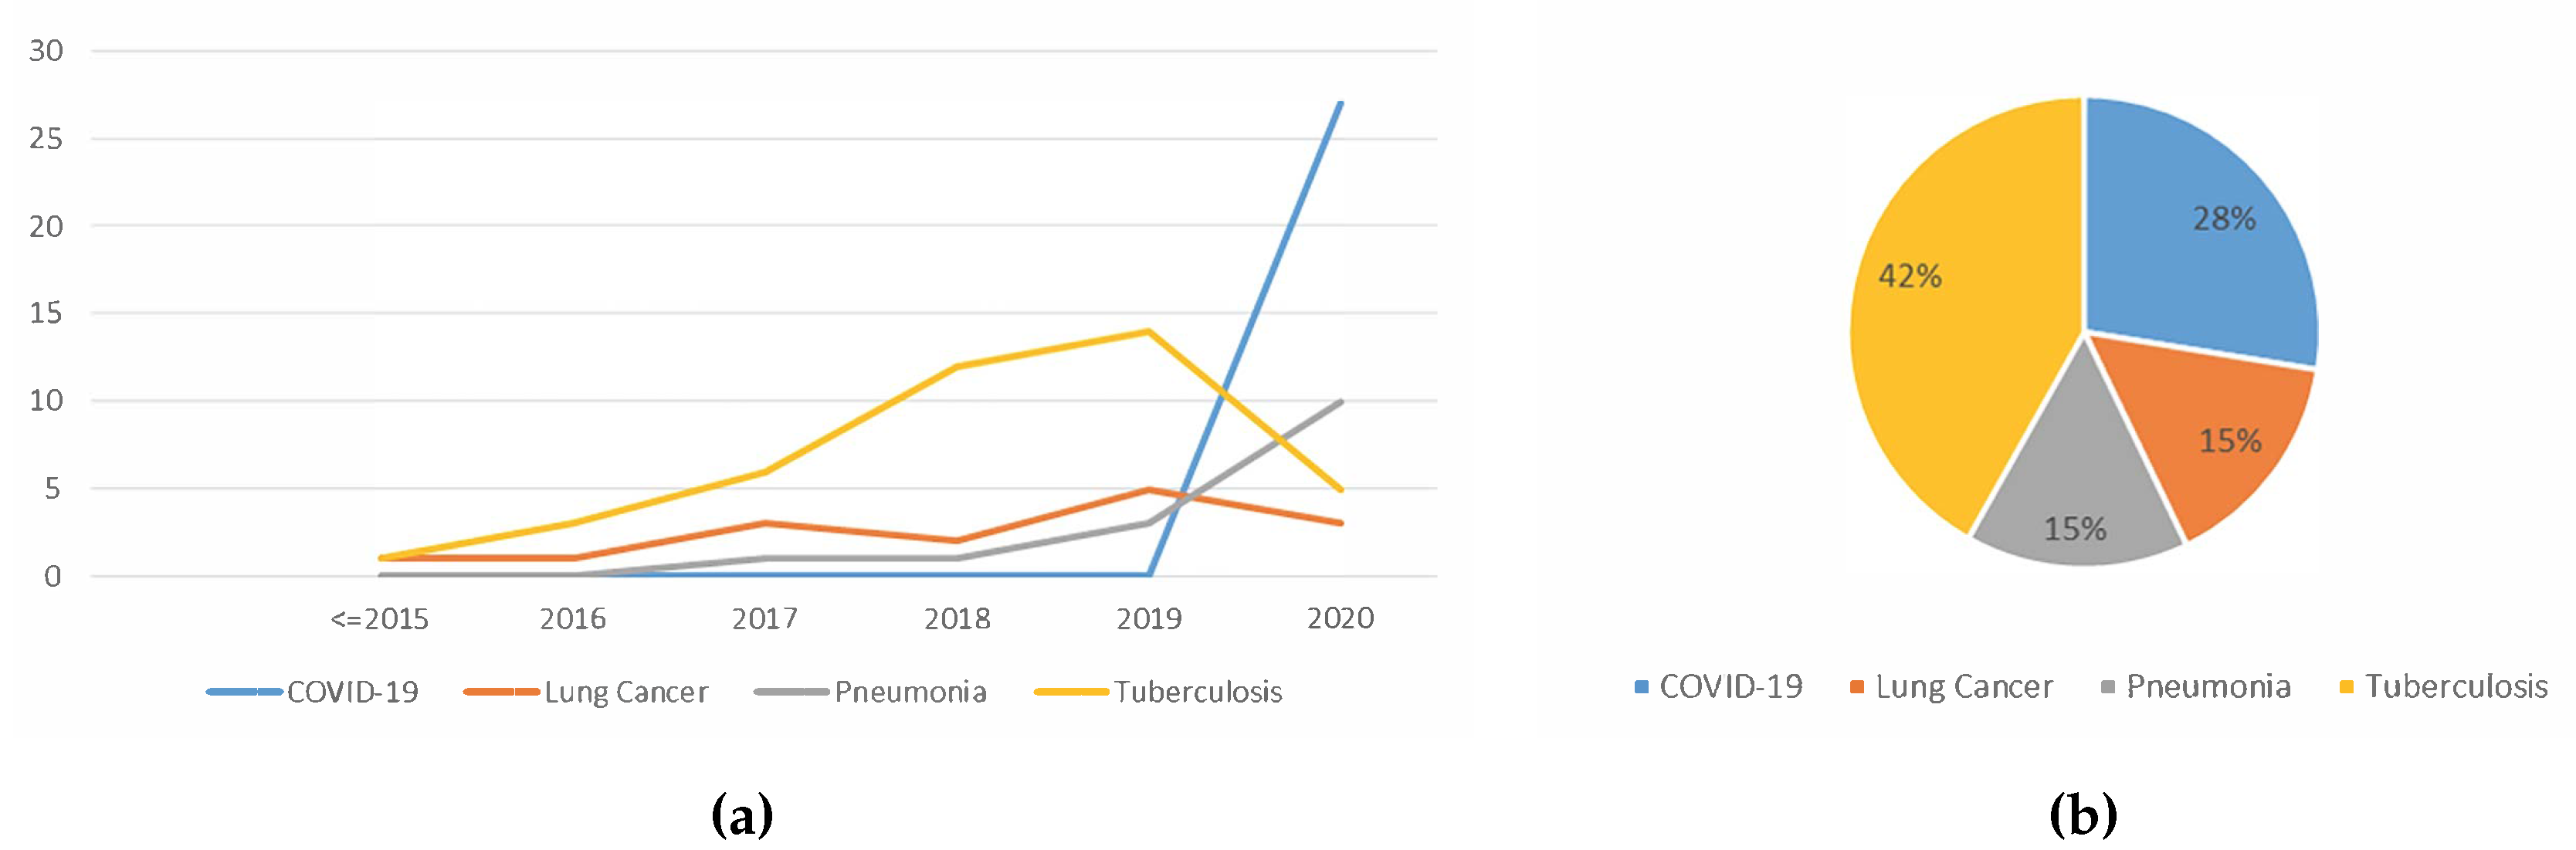
5.1.7. Trend Analysis of the Type Of Lung Disease Detected using Deep Learning
5.2. Issues and Future Direction of Lung Disease Detection Using Deep Learning
5.2.1. Issues
- (i)
- Data imbalance: When doing classification training, if the number of samples of one class is a lot higher than the other class, the resulting model would be biased. It is better to have the same number of images in each class. However, oftentimes that is not the case. For example, when performing a multiclass classification of COVID-19, pneumonia and normal lungs, the number of images for pneumonia far exceeds the number of images for COVID-19 [126].
- (ii)
- Handling of huge image size: Most researchers reduced the original image size during training to reduce computational cost. It is extremely computationally expensive to train with the original image size, and it is also time-consuming to train a deeply complex model even with the aid of the most powerful GPU hardware.
- (iii)
- Limited available datasets: Ideally, thousands of images of each class should be obtained for training. This is to produce a more accurate classifier. However, due to the limited number of datasets, the number of available training data is often less than ideal. This causes researchers to search for other alternatives to produce a good classifier.
- (iv)
- High correlation of errors when using ensemble techniques: It requires a variety of errors for an ensemble of classifiers to perform the best. The base classifiers used should have a very low correlation. This, in turn, will ensure the errors of those classifiers also will be varied. In other words, it is expected that the base classifiers will complement each other to produce better classification results. Most of the studies surveyed only combine classifiers that were trained on similar features. This causes the correlation error of the base classifiers to be high.
5.2.2. Potential Future Works
- (i)
- Make datasets available to the public: Some researchers used private hospital datasets. To obtain larger datasets, efforts such as de-identification of confidential patients’ information can be conducted to make the data public. With more data available, the produced classifiers would be more accurate. This is because, with more data comes more diversity. This decreases the generalisation error because the model becomes more general as it was trained on more examples. Medical data are hard to come by. Therefore, if the datasets were made public, more data would be available for researchers.
- (ii)
- Usage of cloud computing: Performing training using cloud computing might overcome the problem of handling of huge image size. On a local mid-range computer, training with large images will be slow. A high-end computer might speed up the process a little, but it might still be infeasible. However, by training the deep learning model using cloud computing, we can use multiple GPUs at a reasonable cost. This allows higher computational cost training to be conducted faster and cheaper.
- (iii)
- Usage of more variety of features: Most researchers use features automatically extracted by CNN. Some other features such as SIFT, GIST, Gabor, LBP and HOG were studied. However, many other features are still yet to be explored, for example quadtree and image histogram. Efforts can be directed to studying different types of features. This can address the issue of the high correlation of errors when using ensemble techniques. With more features comes more variation. When combining many variations, the results are often better [41]. Feature engineering allows the extraction of more information from present data. New information is extracted in terms of new features. These features might have a better ability to describe the variance in the training data, thus improving model accuracy.
- (iv)
- Usage of the ensemble learning: Ensemble techniques show great potentials. Ensemble methods often improve detection accuracy. An ensemble of several features might provide better detection results. An ensemble of different deep learning techniques could also be considered because ensembles perform better if the errors of the base classifiers have a low correlation.
6. Limitation of the Survey
7. Conclusions
Author Contributions
Funding
Conflicts of Interest
References
- Bousquet, J. Global Surveillance, Prevention and Control of Chronic Respiratory Diseases; World Health Organization: Geneva, Switzerland, 2007; pp. 12–36. [Google Scholar]
- Forum of International Respiratory Societies. The Global Impact of Respiratory Disease, 2nd ed.; European Respiratory Society: Sheffield, UK, 2017; pp. 5–42. [Google Scholar]
- World Health Organization. Coronavirus Disease 2019 (COVID-19) Situation Report; Technical Report March; World Health Organization: Geneva, Switzerland, 2020. [Google Scholar]
- Rahaman, M.M.; Li, C.; Yao, Y.; Kulwa, F.; Rahman, M.A.; Wang, Q.; Qi, S.; Kong, F.; Zhu, X.; Zhao, X. Identification of COVID-19 samples from chest X-Ray images using deep learning: A comparison of transfer learning approaches. J. X-Ray Sci. Technol. 2020, 28, 821–839. [Google Scholar] [CrossRef]
- Yahiaoui, A.; Er, O.; Yumusak, N. A new method of automatic recognition for tuberculosis disease diagnosis using support vector machines. Biomed. Res. 2017, 28, 4208–4212. [Google Scholar]
- Hu, Z.; Tang, J.; Wang, Z.; Zhang, K.; Zhang, L.; Sun, Q. Deep learning for image-based cancer detection and diagnosis-A survey. Pattern Recognit. 2018, 83, 134–149. [Google Scholar] [CrossRef]
- American Thoracic Society. Diagnostic Standards and Classification of Tuberculosis in Adults and Children. Am. J. Respir. Crit. Care Med. 2000, 161, 1376–1395. [Google Scholar] [CrossRef]
- Setio, A.A.A.; Traverso, A.; de Bel, T.; Berens, M.S.; van den Bogaard, C.; Cerello, P.; Chen, H.; Dou, Q.; Fantacci, M.E.; Geurts, B.; et al. Validation, comparison, and combination of algorithms for automatic detection of pulmonary nodules in computed tomography images: The LUNA16 challenge. Med. Image Anal. 2017, 42, 1–13. [Google Scholar] [CrossRef] [Green Version]
- Shen, D.; Wu, G.; Suk, H.I. Deep Learning in Medical Image Analysis. Annu. Rev. Biomed. Eng. 2017, 19, 221–248. [Google Scholar] [CrossRef] [Green Version]
- Wu, C.; Luo, C.; Xiong, N.; Zhang, W.; Kim, T.H. A Greedy Deep Learning Method for Medical Disease Analysis. IEEE Access 2018, 6, 20021–20030. [Google Scholar] [CrossRef]
- Ma, J.; Song, Y.; Tian, X.; Hua, Y.; Zhang, R.; Wu, J. Survey on deep learning for pulmonary medical imaging. Front. Med. 2019, 14, 450–469. [Google Scholar] [CrossRef] [Green Version]
- Rajaraman, S.; Candemir, S.; Xue, Z.; Alderson, P.O.; Kohli, M.; Abuya, J.; Thoma, G.R.; Antani, S.; Member, S. A novel stacked generalization of models for improved TB detection in chest radiographs. In Proceedings of the 2018 40th Annual International Conference the IEEE Engineering in Medicine and Biology Society (EMBC), Honolulu, HI, USA, 17–21 July 2018; pp. 718–721. [Google Scholar] [CrossRef]
- Ardila, D.; Kiraly, A.P.; Bharadwaj, S.; Choi, B.; Reicher, J.J.; Peng, L.; Tse, D.; Etemadi, M.; Ye, W.; Corrado, G.; et al. End-to-end lung cancer screening with three-dimensional deep learning on low-dose chest computed tomography. Nat. Med. 2019, 25, 954–961. [Google Scholar] [CrossRef]
- Gordienko, Y.; Gang, P.; Hui, J.; Zeng, W.; Kochura, Y.; Alienin, O.; Rokovyi, O.; Stirenko, S. Deep Learning with Lung Segmentation and Bone Shadow Exclusion Techniques for Chest X-Ray Analysis of Lung Cancer. Adv. Intell. Syst. Comput. 2019, 638–647. [Google Scholar] [CrossRef]
- Kieu, S.T.H.; Hijazi, M.H.A.; Bade, A.; Yaakob, R.; Jeffree, S. Ensemble deep learning for tuberculosis detection using chest X-Ray and canny edge detected images. IAES Int. J. Artif. Intell. 2019, 8, 429–435. [Google Scholar] [CrossRef]
- Dietterich, T.G. Ensemble Methods in Machine Learning. Int. Workshop Mult. Classif. Syst. 2000, 1–15. [Google Scholar] [CrossRef] [Green Version]
- Webb, A. Introduction To Biomedical Imaging; John Wiley & Sons, Inc.: Hoboken, NJ, USA, 2003. [Google Scholar] [CrossRef]
- Kwan-Hoong, N.; Madan M, R. X ray imaging goes digital. Br. Med J. 2006, 333, 765–766. [Google Scholar] [CrossRef] [Green Version]
- Lopes, U.K.; Valiati, J.F. Pre-trained convolutional neural networks as feature extractors for tuberculosis detection. Comput. Biol. Med. 2017, 89, 135–143. [Google Scholar] [CrossRef] [PubMed]
- Ayan, E.; Ünver, H.M. Diagnosis of Pneumonia from Chest X-Ray Images using Deep Learning. Sci. Meet. Electr.-Electron. Biomed. Eng. Comput. Sci 2019, 1–5. [Google Scholar] [CrossRef]
- Salman, F.M.; Abu-naser, S.S.; Alajrami, E.; Abu-nasser, B.S.; Ashqar, B.A.M. COVID-19 Detection using Artificial Intelligence. Int. J. Acad. Eng. Res. 2020, 4, 18–25. [Google Scholar]
- Herman, G.T. Fundamentals of Computerized Tomography; Springer: London, UK, 2009; Volume 224. [Google Scholar] [CrossRef]
- Song, Q.Z.; Zhao, L.; Luo, X.K.; Dou, X.C. Using Deep Learning for Classification of Lung Nodules on Computed Tomography Images. J. Healthc. Eng. 2017, 2017. [Google Scholar] [CrossRef] [Green Version]
- Gao, X.W.; James-reynolds, C.; Currie, E. Analysis of tuberculosis severity levels from CT pulmonary images based on enhanced residual deep learning architecture. Neurocomputing 2019, 392, 233–244. [Google Scholar] [CrossRef]
- Rao, P.; Pereira, N.A.; Srinivasan, R. Convolutional neural networks for lung cancer screening in computed tomography (CT) scans. In Proceedings of the 2016 2nd International Conference on Contemporary Computing and Informatics, IC3I 2016, Noida, India, 14–17 December 2016; pp. 489–493. [Google Scholar] [CrossRef]
- Gozes, O.; Frid, M.; Greenspan, H.; Patrick, D. Rapid AI Development Cycle for the Coronavirus (COVID-19) Pandemic: Initial Results for Automated Detection & Patient Monitoring using Deep Learning CT Image Analysis Article. arXiv 2020, arXiv:2003.05037. [Google Scholar]
- Shah, M.I.; Mishra, S.; Yadav, V.K.; Chauhan, A.; Sarkar, M.; Sharma, S.K.; Rout, C. Ziehl–Neelsen sputum smear microscopy image database: A resource to facilitate automated bacilli detection for tuberculosis diagnosis. J. Med. Imaging 2017, 4, 027503. [Google Scholar] [CrossRef]
- López, Y.P.; Filho, C.F.F.C.; Aguilera, L.M.R.; Costa, M.G.F. Automatic classification of light field smear microscopy patches using Convolutional Neural Networks for identifying Mycobacterium Tuberculosis. In Proceedings of the 2017 CHILEAN Conference on Electrical, Electronics Engineering, Information and Communication Technologies (CHILECON), Pucon, Chile, 18–20 October 2017. [Google Scholar]
- Kant, S.; Srivastava, M.M. Towards Automated Tuberculosis detection using Deep Learning. In Proceedings of the 2018 IEEE Symposium Series on Computational Intelligence (SSCI), Bengaluru, India, 18–21 November 2018; pp. 1250–1253. [Google Scholar] [CrossRef] [Green Version]
- Oomman, R.; Kalmady, K.S.; Rajan, J.; Sabu, M.K. Automatic detection of tuberculosis bacilli from microscopic sputum smear images using deep learning methods. Integr. Med. Res. 2018, 38, 691–699. [Google Scholar] [CrossRef]
- Mithra, K.S.; Emmanuel, W.R.S. Automated identification of mycobacterium bacillus from sputum images for tuberculosis diagnosis. Signal Image Video Process. 2019. [Google Scholar] [CrossRef]
- Samuel, R.D.J.; Kanna, B.R. Tuberculosis ( TB ) detection system using deep neural networks. Neural Comput. Appl. 2019, 31, 1533–1545. [Google Scholar] [CrossRef]
- Gurcan, M.N.; Boucheron, L.E.; Can, A.; Madabhushi, A.; Rajpoot, N.M.; Yener, B. Histopathological Image Analysis: A Review. IEEE Rev. Biomed. Eng. 2009, 2, 147–171. [Google Scholar] [CrossRef] [Green Version]
- Coudray, N.; Ocampo, P.S.; Sakellaropoulos, T.; Narula, N.; Snuderl, M.; Fenyö, D.; Moreira, A.L.; Razavian, N.; Tsirigos, A. Classification and mutation prediction from non–small cell lung cancer histopathology images using deep learning. Nat. Med. 2018, 24, 1559–1567. [Google Scholar] [CrossRef]
- O’Mahony, N.; Campbell, S.; Carvalho, A.; Harapanahalli, S.; Hernandez, G.V.; Krpalkova, L.; Riordan, D.; Walsh, J. Deep Learning vs. Traditional Computer Vision. Adv. Intell. Syst. Comput. 2020, 128–144. [Google Scholar] [CrossRef] [Green Version]
- Vajda, S.; Karargyris, A.; Jaeger, S.; Santosh, K.C.; Candemir, S.; Xue, Z.; Antani, S.; Thoma, G. Feature Selection for Automatic Tuberculosis Screening in Frontal Chest Radiographs. J. Med Syst. 2018, 42. [Google Scholar] [CrossRef]
- Jaeger, S.; Karargyris, A.; Candemir, S.; Folio, L.; Siegelman, J.; Callaghan, F.; Xue, Z.; Palaniappan, K.; Singh, R.K.; Antani, S.; et al. Automatic tuberculosis screening using chest radiographs. IEEE Trans. Med. Imaging 2014, 33, 233–245. [Google Scholar] [CrossRef]
- Antony, B.; Nizar Banu, P.K. Lung tuberculosis detection using x-ray images. Int. J. Appl. Eng. Res. 2017, 12, 15196–15201. [Google Scholar]
- Chauhan, A.; Chauhan, D.; Rout, C. Role of gist and PHOG features in computer-aided diagnosis of tuberculosis without segmentation. PLoS ONE 2014, 9, e112980. [Google Scholar] [CrossRef]
- Al-Ajlan, A.; Allali, A.E. CNN—MGP: Convolutional Neural Networks for Metagenomics Gene Prediction. Interdiscip. Sci. Comput. Life Sci. 2019, 11, 628–635. [Google Scholar] [CrossRef] [PubMed] [Green Version]
- Domingos, P. A Few Useful Things to Know About Machine Learning. Commun. ACM 2012, 55, 78–87. [Google Scholar] [CrossRef] [Green Version]
- Mikołajczyk, A.; Grochowski, M. Data augmentation for improving deep learning in image classification problem. In Proceedings of the 2018 International Interdisciplinary PhD Workshop, Swinoujscie, Poland, 9–12 May 2018; pp. 117–122. [Google Scholar] [CrossRef]
- Shorten, C.; Khoshgoftaar, T.M. A survey on Image Data Augmentation for Deep Learning. J. Big Data 2019, 6. [Google Scholar] [CrossRef]
- O’Shea, K.; Nash, R. An Introduction to Convolutional Neural Networks. arXiv 2015, arXiv:1511.08458v2. [Google Scholar]
- Ker, J.; Wang, L. Deep Learning Applications in Medical Image Analysis. IEEE Access 2018, 6, 9375–9389. [Google Scholar] [CrossRef]
- Pan, S.J.; Yang, Q. A Survey on Transfer Learning. IEEE Trans. Knowl. Data Eng. 2010, 22, 1345–1359. [Google Scholar] [CrossRef]
- Lanbouri, Z.; Achchab, S. A hybrid Deep belief network approach for Financial distress prediction. In Proceedings of the 2015 10th International Conference on Intelligent Systems: Theories and Applications (SITA), Rabat, Morocco, 20–21 October 2015; pp. 1–6. [Google Scholar] [CrossRef]
- Hinton, G.E.; Osindero, S. A fast learning algorithm for deep belief nets. Neural Comput. 2006, 18, 1527–1554. [Google Scholar] [CrossRef]
- Cao, X.; Wipf, D.; Wen, F.; Duan, G.; Sun, J. A practical transfer learning algorithm for face verification. In Proceedings of the IEEE International Conference on Computer Vision, Sydney, Australia, 1–8 December 2013; pp. 3208–3215. [Google Scholar] [CrossRef]
- Wang, C.; Chen, D.; Hao, L.; Liu, X.; Zeng, Y.; Chen, J.; Zhang, G. Pulmonary Image Classification Based on Inception-v3 Transfer Learning Model. IEEE Access 2019, 7, 146533–146541. [Google Scholar] [CrossRef]
- Krizhevsky, A.; Sutskeve, I.; Hinton, G.E. ImageNet Classification with Deep Convolutional Neural Networks. Adv. Neural Inf. Process. Syst. 2012. [Google Scholar] [CrossRef]
- Tajbakhsh, N.; Shin, J.Y.; Gurudu, S.R.; Hurst, R.T.; Kendall, C.B.; Gotway, M.B.; Liang, J. Convolutional Neural Networks for Medical Image Analysis: Full Training or Fine Tuning? IEEE Trans. Med. Imaging 2016, 35, 1299–1312. [Google Scholar] [CrossRef] [Green Version]
- Nogueira, K.; Penatti, O.A.; dos Santos, J.A. Towards better exploiting convolutional neural networks for remote sensing scene classification. Pattern Recognit. 2017, 61, 539–556. [Google Scholar] [CrossRef] [Green Version]
- Kabari, L.G.; Onwuka, U. Comparison of Bagging and Voting Ensemble Machine Learning Algorithm as a Classifier. Int. J. Adv. Res. Comput. Sci. Softw. Eng. 2019, 9, 1–6. [Google Scholar]
- Chouhan, V.; Singh, S.K.; Khamparia, A.; Gupta, D.; Albuquerque, V.H.C.D. A Novel Transfer Learning Based Approach for Pneumonia Detection in Chest X-ray Images. Appl. Sci. 2020, 10, 559. [Google Scholar] [CrossRef] [Green Version]
- Lincoln, W.P.; Skrzypekt, J. Synergy of Clustering Multiple Back Propagation Networks. Adv. Neural Inf. Process. Syst. 1990, 2, 650–659. [Google Scholar]
- Lakhani, P.; Sundaram, B. Deep Learning at Chest Radiography: Automated Classification of Pulmonary Tuberculosis by Using Convolutional Neural Networks. Radiology 2017, 284, 574–582. [Google Scholar] [CrossRef]
- Divina, F.; Gilson, A.; Goméz-Vela, F.; Torres, M.G.; Torres, J.F. Stacking Ensemble Learning for Short-Term Electricity Consumption Forecasting. Energies 2018, 11, 949. [Google Scholar] [CrossRef] [Green Version]
- World Health Organisation. Global Health TB Report; World Health Organisation: Geneva, Switzerland, 2018; p. 277. [Google Scholar]
- Murphy, K.; Habib, S.S.; Zaidi, S.M.A.; Khowaja, S.; Khan, A.; Melendez, J.; Scholten, E.T.; Amad, F.; Schalekamp, S.; Verhagen, M.; et al. Computer aided detection of tuberculosis on chest radiographs: An evaluation of the CAD4TB v6 system. Sci. Rep. 2019, 10, 1–11. [Google Scholar] [CrossRef]
- Melendez, J.; Sánchez, C.I.; Philipsen, R.H.; Maduskar, P.; Dawson, R.; Theron, G.; Dheda, K.; Van Ginneken, B. An automated tuberculosis screening strategy combining X-ray-based computer-aided detection and clinical information. Sci. Rep. 2016, 6, 1–8. [Google Scholar] [CrossRef]
- Heo, S.J.; Kim, Y.; Yun, S.; Lim, S.S.; Kim, J.; Nam, C.M.; Park, E.C.; Jung, I.; Yoon, J.H. Deep Learning Algorithms with Demographic Information Help to Detect Tuberculosis in Chest Radiographs in Annual Workers’ Health Examination Data. Int. J. Environ. Res. Public Health 2019, 16, 250. [Google Scholar] [CrossRef] [Green Version]
- Pasa, F.; Golkov, V.; Pfeiffer, F.; Cremers, D.; Pfeiffer, D. Efficient Deep Network Architectures for Fast Chest X-Ray Tuberculosis Screening and Visualization. Sci. Rep. 2019, 9, 2–10. [Google Scholar] [CrossRef] [Green Version]
- Cao, Y.; Liu, C.; Liu, B.; Brunette, M.J.; Zhang, N.; Sun, T.; Zhang, P.; Peinado, J.; Garavito, E.S.; Garcia, L.L.; et al. Improving Tuberculosis Diagnostics Using Deep Learning and Mobile Health Technologies among Resource-Poor and Marginalized Communities. In Proceedings of the 2016 IEEE 1st International Conference on Connected Health: Applications, Systems and Engineering Technologies, CHASE, Washington, DC, USA, 27–29 June 2016; pp. 274–281. [Google Scholar] [CrossRef]
- Liu, J.; Liu, Y.; Wang, C.; Li, A.; Meng, B. An Original Neural Network for Pulmonary Tuberculosis Diagnosis in Radiographs. In Lecture Notes in Computer Science, Proceedings of the International Conference on Artificial Neural Networks, Rhodes, Greece, 4–7 October 2018; Springer: Berlin/Heidelberg, Germany, 2018; pp. 158–166. [Google Scholar] [CrossRef]
- Stirenko, S.; Kochura, Y.; Alienin, O. Chest X-Ray Analysis of Tuberculosis by Deep Learning with Segmentation and Augmentation. In Proceedings of the 2018 IEEE 38th International Conference on Electronics andNanotechnology (ELNANO), Kiev, Ukraine, 24–26 April 2018; pp. 422–428. [Google Scholar]
- Andika, L.A.; Pratiwi, H.; Sulistijowati Handajani, S. Convolutional neural network modeling for classification of pulmonary tuberculosis disease. J. Phys. Conf. Ser. 2020, 1490. [Google Scholar] [CrossRef]
- Ul Abideen, Z.; Ghafoor, M.; Munir, K.; Saqib, M.; Ullah, A.; Zia, T.; Tariq, S.A.; Ahmed, G.; Zahra, A. Uncertainty assisted robust tuberculosis identification with bayesian convolutional neural networks. IEEE Access 2020, 8, 22812–22825. [Google Scholar] [CrossRef] [PubMed]
- Hwang, E.J.; Park, S.; Jin, K.N.; Kim, J.I.; Choi, S.Y.; Lee, J.H.; Goo, J.M.; Aum, J.; Yim, J.J.; Park, C.M. Development and Validation of a Deep Learning—based Automatic Detection Algorithm for Active Pulmonary Tuberculosis on Chest Radiographs. Clin. Infect. Dis. 2019, 69, 739–747. [Google Scholar] [CrossRef]
- Hwang, S.; Kim, H.E.; Jeong, J.; Kim, H.J. A Novel Approach for Tuberculosis Screening Based on Deep Convolutional Neural Networks. Med. Imaging 2016, 9785, 1–8. [Google Scholar] [CrossRef]
- Islam, M.T.; Aowal, M.A.; Minhaz, A.T.; Ashraf, K. Abnormality Detection and Localization in Chest X-Rays using Deep Convolutional Neural Networks. arXiv 2017, arXiv:1705.09850v3. [Google Scholar]
- Nguyen, Q.H.; Nguyen, B.P.; Dao, S.D.; Unnikrishnan, B.; Dhingra, R.; Ravichandran, S.R.; Satpathy, S.; Raja, P.N.; Chua, M.C.H. Deep Learning Models for Tuberculosis Detection from Chest X-ray Images. In Proceedings of the 2019 26th International Conference on Telecommunications (ICT), Hanoi, Vietnam, 8–10 April 2019; pp. 381–385. [Google Scholar] [CrossRef]
- Kieu, T.; Ho, K.; Gwak, J.; Prakash, O. Utilizing Pretrained Deep Learning Models for Automated Pulmonary Tuberculosis Detection Using Chest Radiography. Intell. Inf. Database Syst. 2019, 4, 395–403. [Google Scholar] [CrossRef]
- Abbas, A.; Abdelsamea, M.M. Learning Transformations for Automated Classification of Manifestation of Tuberculosis using Convolutional Neural Network. In Proceedings of the 2018 13th International Conference on Computer Engineering andSystems (ICCES), Cairo, Egypt, 18–19 December 2018; IEEE: New York, NY, USA, 2018; pp. 122–126. [Google Scholar]
- Karnkawinpong, T.; Limpiyakorn, Y. Classification of pulmonary tuberculosis lesion with convolutional neural networks. J. Phys. Conf. Ser. 2018, 1195. [Google Scholar] [CrossRef]
- Liu, C.; Cao, Y.; Alcantara, M.; Liu, B.; Brunette, M.; Peinado, J.; Curioso, W. TX-CNN: Detecting Tuberculosis in Chest X-Ray Images Using Convolutional Neural Network. In Proceedings of the 2017 IEEE International Conference on Image Processing (ICIP), Beijing, China, 17–20 September 2017. [Google Scholar]
- Yadav, O.; Passi, K.; Jain, C.K. Using Deep Learning to Classify X-ray Images of Potential Tuberculosis Patients. In Proceedings of the 2018 IEEE International Conference on Bioinformatics and Biomedicine(BIBM), Madrid, Spain, 3–6 December 2018; IEEE: New York, NY, USA, 2018; pp. 2368–2375. [Google Scholar]
- Sahlol, A.T.; Elaziz, M.A.; Jamal, A.T.; Damaševičius, R.; Hassan, O.F. A novel method for detection of tuberculosis in chest radiographs using artificial ecosystem-based optimisation of deep neural network features. Symmetry 2020, 12, 1146. [Google Scholar] [CrossRef]
- Hooda, R.; Mittal, A.; Sofat, S. Automated TB classification using ensemble of deep architectures. Multimed. Tools Appl. 2019, 78, 31515–31532. [Google Scholar] [CrossRef]
- Rashid, R.; Khawaja, S.G.; Akram, M.U.; Khan, A.M. Hybrid RID Network for Efficient Diagnosis of Tuberculosis from Chest X-rays. In Proceedings of the 2018 9th Cairo International Biomedical Engineering Conference(CIBEC), Cairo, Egypt, 20–22 December 2018; IEEE: New York, NY, USA, 2018; pp. 167–170. [Google Scholar]
- Kieu, S.T.H.; Hijazi, M.H.A.; Bade, A.; Saffree Jeffree, M. Tuberculosis detection using deep learning and contrast-enhanced canny edge detected x-ray images. IAES Int. J. Artif. Intell. 2020, 9. [Google Scholar] [CrossRef]
- Rajaraman, S.; Antani, S.K. Modality-Specific Deep Learning Model Ensembles Toward Improving TB Detection in Chest Radiographs. IEEE Access 2020, 8, 27318–27326. [Google Scholar] [CrossRef] [PubMed]
- Melendez, J.; Ginneken, B.V.; Maduskar, P.; Philipsen, R.H.H.M.; Reither, K.; Breuninger, M.; Adetifa, I.M.O.; Maane, R.; Ayles, H.; Sánchez, C.I. A Novel Multiple-Instance Learning-Based Approach to Computer-Aided Detection of Tuberculosis on Chest X-Rays. IEEE Trans. Med. Imaging 2014, 34, 179–192. [Google Scholar] [CrossRef] [PubMed]
- Becker, A.S.; Bluthgen, C.; van Phi, V.D.; Sekaggya-Wiltshire, C.; Castelnuovo, B.; Kambugu, A.; Fehr, J.; Frauenfelder, T. Detection of tuberculosis patterns in digital photographs of chest X-ray images using Deep Learning: Feasibility study. Int. J. Tuberc. Lung Dis. 2018, 22, 328–335. [Google Scholar] [CrossRef] [PubMed]
- Li, L.; Huang, H.; Jin, X. AE-CNN Classification of Pulmonary Tuberculosis Based on CT images. In Proceedings of the 2018 9th International Conference on Information Technology inMedicine and Education (ITME), Hangzhou, China, 19–21 October 2018; IEEE: New York, NY, USA, 2018; pp. 39–42. [Google Scholar] [CrossRef]
- Pattnaik, A.; Kanodia, S.; Chowdhury, R.; Mohanty, S. Predicting Tuberculosis Related Lung Deformities from CT Scan Images Using 3D CNN; CEUR-WS: Lugano, Switzerland, 2019; pp. 9–12. [Google Scholar]
- Zunair, H.; Rahman, A.; Mohammed, N. Estimating Severity from CT Scans of Tuberculosis Patients using 3D Convolutional Nets and Slice Selection; CEUR-WS: Lugano, Switzerland, 2019; pp. 9–12. [Google Scholar]
- Llopis, F.; Fuster-Guillo, A.; Azorin-Lopez, J.; Llopis, I. Using improved optical flow model to detect Tuberculosis; CEUR-WS: Lugano, Switzerland, 2019; pp. 9–12. [Google Scholar]
- Wardlaw, T.; Johansson, E.W.; Hodge, M. Pneumonia: The Forgotten Killer of Children; United Nations Children’s Fund (UNICEF): New York, NY, USA, 2006; p. 44. [Google Scholar]
- Wunderink, R.G.; Waterer, G. Advances in the causes and management of community acquired pneumonia in adults. BMJ 2017, 1–13. [Google Scholar] [CrossRef]
- Tobias, R.R.; De Jesus, L.C.M.; Mital, M.E.G.; Lauguico, S.C.; Guillermo, M.A.; Sybingco, E.; Bandala, A.A.; Dadios, E.P. CNN-based Deep Learning Model for Chest X-ray Health Classification Using TensorFlow. In Proceedings of the 2020 RIVF International Conference on Computing and Communication Technologies, RIVF 2020, Ho Chi Minh, Vietnam, 14–15 October 2020. [Google Scholar]
- Stephen, O.; Sain, M.; Maduh, U.J.; Jeong, D.U. An Efficient Deep Learning Approach to Pneumonia Classification in Healthcare. J. Healthc. Eng. 2019, 2019. [Google Scholar] [CrossRef] [Green Version]
- Kermany, D.S.; Goldbaum, M.; Cai, W.; Lewis, M.A. Identifying Medical Diagnoses and Treatable Diseases by Image-Based Deep Learning. Cell 2018, 172, 1122–1131.e9. [Google Scholar] [CrossRef] [PubMed]
- Young, J.C.; Suryadibrata, A. Applicability of Various Pre-Trained Deep Convolutional Neural Networks for Pneumonia Classification based on X-Ray Images. Int. J. Adv. Trends Comput. Sci. Eng. 2020, 9, 2649–2654. [Google Scholar] [CrossRef]
- Moujahid, H.; Cherradi, B.; Gannour, O.E.; Bahatti, L.; Terrada, O.; Hamida, S. Convolutional Neural Network Based Classification of Patients with Pneumonia using X-ray Lung Images. Adv. Sci. Technol. Eng. Syst. 2020, 5, 167–175. [Google Scholar] [CrossRef]
- Rajpurkar, P.; Irvin, J.; Zhu, K.; Yang, B.; Mehta, H.; Duan, T.; Ding, D.; Bagul, A.; Ball, R.L.; Langlotz, C.; et al. CheXNet: Radiologist-Level Pneumonia Detection on Chest X-Rays with Deep Learning. arXiv 2017, arXiv:1711.05225v3. [Google Scholar]
- Rahman, T.; Chowdhury, M.E.H.; Khandakar, A.; Islam, K.R.; Islam, K.F.; Mahbub, Z.B.; Kadir, M.A.; Kashem, S. Transfer Learning with Deep Convolutional Neural Network (CNN) for Pneumonia Detection Using Chest X-ray. Appl. Sci. 2020, 10, 3233. [Google Scholar] [CrossRef]
- Hashmi, M.; Katiyar, S.; Keskar, A.; Bokde, N.; Geem, Z. Efficient Pneumonia Detection in Chest Xray Images Using Deep Transfer Learning. Diagnostics 2020, 10, 417. [Google Scholar] [CrossRef] [PubMed]
- Acharya, A.K.; Satapathy, R. A Deep Learning Based Approach towards the Automatic Diagnosis of Pneumonia from Chest Radio-Graphs. Biomed. Pharmacol. J. 2020, 13, 449–455. [Google Scholar] [CrossRef]
- Elshennawy, N.M.; Ibrahim, D.M. Deep-Pneumonia Framework Using Deep Learning Models Based on Chest X-Ray Images. Diagnostics 2020, 10, 649. [Google Scholar] [CrossRef] [PubMed]
- Emhamed, R.; Mamlook, A.; Chen, S. Investigation of the performance of Machine Learning Classifiers for Pneumonia Detection in Chest X-ray Images. In Proceedings of the 2020 IEEE International Conference on Electro Information Technology (EIT), Chicago, IL, USA, 31 July–1 August 2020; pp. 98–104. [Google Scholar]
- Kumar, A.; Tiwari, P.; Kumar, S.; Gupta, D.; Khanna, A. Identifying pneumonia in chest X-rays: A deep learning approach. Measurement 2019, 145, 511–518. [Google Scholar] [CrossRef]
- Hurt, B.; Yen, A.; Kligerman, S.; Hsiao, A. Augmenting Interpretation of Chest Radiographs with Deep Learning Probability Maps. J. Thorac. Imaging 2020, 35, 285–293. [Google Scholar] [CrossRef]
- Borczuk, A.C. Benign tumors and tumorlike conditions of the lung. Arch. Pathol. Lab. Med. 2008, 132, 1133–1148. [Google Scholar] [CrossRef]
- Hua, K.L.; Hsu, C.H.; Hidayati, S.C.; Cheng, W.H.; Chen, Y.J. Computer-aided classification of lung nodules on computed tomography images via deep learning technique. OncoTargets Ther. 2015, 8, 2015–2022. [Google Scholar] [CrossRef] [Green Version]
- Kurniawan, E.; Prajitno, P.; Soejoko, D.S. Computer-Aided Detection of Mediastinal Lymph Nodes using Simple Architectural Convolutional Neural Network. J. Phys. Conf. Ser. 2020, 1505. [Google Scholar] [CrossRef]
- Ciompi, F.; Chung, K.; Van Riel, S.J.; Setio, A.A.A.; Gerke, P.K.; Jacobs, C.; Th Scholten, E.; Schaefer-Prokop, C.; Wille, M.M.; Marchianò, A.; et al. Towards automatic pulmonary nodule management in lung cancer screening with deep learning. Sci. Rep. 2017, 7, 1–11. [Google Scholar] [CrossRef]
- Shakeel, P.M.; Burhanuddin, M.A.; Desa, M.I. Lung cancer detection from CT image using improved profuse clustering and deep learning instantaneously trained neural networks. Meas. J. Int. Meas. Confed. 2019, 145, 702–712. [Google Scholar] [CrossRef]
- Chen, S.; Han, Y.; Lin, J.; Zhao, X.; Kong, P. Pulmonary nodule detection on chest radiographs using balanced convolutional neural network and classic candidate detection. Artif. Intell. Med. 2020, 107, 101881. [Google Scholar] [CrossRef] [PubMed]
- Hosny, A.; Parmar, C.; Coroller, T.P.; Grossmann, P.; Zeleznik, R.; Kumar, A.; Bussink, J.; Gillies, R.J.; Mak, R.H.; Aerts, H.J. Deep learning for lung cancer prognostication: A retrospective multi-cohort radiomics study. PLoS Med. 2018, 15, 1–25. [Google Scholar] [CrossRef] [PubMed] [Green Version]
- Xu, Y.; Hosny, A.; Zeleznik, R.; Parmar, C.; Coroller, T.; Franco, I.; Mak, R.H.; Aerts, H.J. Deep learning predicts lung cancer treatment response from serial medical imaging. Clin. Cancer Res. 2019, 25, 3266–3275. [Google Scholar] [CrossRef] [PubMed] [Green Version]
- Kuan, K.; Ravaut, M.; Manek, G.; Chen, H.; Lin, J.; Nazir, B.; Chen, C.; Howe, T.C.; Zeng, Z.; Chandrasekhar, V. Deep Learning for Lung Cancer Detection: Tackling the Kaggle Data Science Bowl 2017 Challenge. arXiv 2017, arXiv:1705.09435. [Google Scholar]
- Ausawalaithong, W.; Thirach, A.; Marukatat, S.; Wilaiprasitporn, T. Automatic Lung Cancer Prediction from Chest X-ray Images Using the Deep Learning Approach. In Proceedings of the 2018 11th Biomedical Engineering International Conference (BMEiCON), Chiang Mai, Thailand, 21–24 November 2018. [Google Scholar]
- Xu, S.; Guo, J.; Zhang, G.; Bie, R. Automated detection of multiple lesions on chest X-ray images: Classification using a neural network technique with association-specific contexts. Appl. Sci. 2020, 10, 1742. [Google Scholar] [CrossRef] [Green Version]
- Huang, C.; Wang, Y.; Li, X.; Ren, L.; Zhao, J.; Hu, Y.; Zhang, L.; Fan, G.; Xu, J.; Gu, X. Clinical features of patients infected with 2019 novel coronavirus in Wuhan, China. Lancet 2020, 395, 497–506. [Google Scholar] [CrossRef] [Green Version]
- Velavan, T.P.; Meyer, C.G. The COVID-19 epidemic. Trop. Med. Int. Health 2020, 25, 278–280. [Google Scholar] [CrossRef] [Green Version]
- Shibly, K.H.; Dey, S.K.; Islam, M.T.U.; Rahman, M.M. COVID faster R–CNN: A novel framework to Diagnose Novel Coronavirus Disease (COVID-19) in X-Ray images. Inform. Med. Unlocked 2020, 20, 100405. [Google Scholar] [CrossRef]
- Alsharman, N.; Jawarneh, I. GoogleNet CNN neural network towards chest CT-coronavirus medical image classification. J. Comput. Sci. 2020, 16, 620–625. [Google Scholar] [CrossRef]
- Zhu, J.; Shen, B.; Abbasi, A.; Hoshmand-Kochi, M.; Li, H.; Duong, T.Q. Deep transfer learning artificial intelligence accurately stages COVID-19 lung disease severity on portable chest radiographs. PLoS ONE 2020, 15, e0236621. [Google Scholar] [CrossRef]
- Sethi, R.; Mehrotra, M.; Sethi, D. Deep Learning based Diagnosis Recommendation for COVID-19 using Chest X-Rays Images. In Proceedings of the 2020 Second International Conference on Inventive Research in Computing Applications (ICIRCA), Coimbatore, India, 15–17 July 2020. [Google Scholar]
- Das, D.; Santosh, K.C.; Pal, U. Truncated inception net: COVID-19 outbreak screening using chest X-rays. Phys. Eng. Sci. Med. 2020, 43, 915–925. [Google Scholar] [CrossRef] [PubMed]
- Panwar, H.; Gupta, P.K.; Siddiqui, M.K.; Morales-Menendez, R.; Singh, V. Application of deep learning for fast detection of COVID-19 in X-Rays using nCOVnet. Chaos Solitons Fractals 2020, 138, 109944. [Google Scholar] [CrossRef] [PubMed]
- Narin, A.; Kaya, C.; Pamuk, Z. Automatic Detection of Coronavirus Disease (COVID-19) Using X-ray Images and Deep Convolutional Neural Networks. arXiv 2020, arXiv:2003.10849. [Google Scholar]
- Apostolopoulos, I.D.; Mpesiana, T.A. Covid—19: Automatic detection from X-ray images utilizing transfer learning with convolutional neural networks. Phys. Eng. Sci. Med. 2020, 1–6. [Google Scholar] [CrossRef] [PubMed] [Green Version]
- Chowdhury, M.E.H.; Rahman, T.; Khandakar, A.; Mazhar, R.; Kadir, M.A.; Reaz, M.B.I.; Mahbub, Z.B.; Islam, K.R.; Salman, M.; Iqbal, A.; et al. Can AI help in screening Viral and COVID-19 pneumonia? arXiv 2020, arXiv:2003.13145. [Google Scholar] [CrossRef]
- Wang, L.; Lin, Z.Q.; Wong, A. COVID-Net: A Tailored Deep Convolutional Neural Network Design for Detection of COVID-19 Cases from Chest X-Ray Images. Sci. Rep. 2020, 10, 1–12. [Google Scholar] [CrossRef]
- Sethy, P.K.; Behera, S.K.; Ratha, P.K.; Biswas, P. Detection of coronavirus disease (COVID-19) based on deep features and support vector machine. Int. J. Math. Eng. Manag. Sci. 2020, 5, 643–651. [Google Scholar] [CrossRef]
- Islam, M.Z.; Islam, M.M.; Asraf, A. A combined deep CNN-LSTM network for the detection of novel coronavirus (COVID-19) using X-ray images. Inform. Med. Unlocked 2020, 20, 100412. [Google Scholar] [CrossRef]
- Shorfuzzaman, M.; Masud, M. On the detection of covid-19 from chest x-ray images using cnn-based transfer learning. Comput. Mater. Contin. 2020, 64, 1359–1381. [Google Scholar] [CrossRef]
- Li, L.; Qin, L.; Xu, Z.; Yin, Y.; Wang, X.; Kong, B.; Bai, J.; Lu, Y.; Fang, Z.; Song, Q.; et al. Using Artificial Intelligence to Detect COVID-19 and Community-acquired Pneumonia Based on Pulmonary CT: Evaluation of the Diagnostic Accuracy. Radiology 2020, 296, 65–71. [Google Scholar] [CrossRef]
- Alazab, M.; Awajan, A.; Mesleh, A.; Abraham, A.; Jatana, V.; Alhyari, S. COVID-19 prediction and detection using deep learning. Int. J. Comput. Inf. Syst. Ind. Manag. Appl. 2020, 12, 168–181. [Google Scholar]
- Waheed, A.; Goyal, M.; Gupta, D.; Khanna, A.; Al-Turjman, F.; Pinheiro, P.R. CovidGAN: Data Augmentation Using Auxiliary Classifier GAN for Improved Covid-19 Detection. IEEE Access 2020, 8, 91916–91923. [Google Scholar] [CrossRef]
- Ouyang, X.; Huo, J.; Xia, L.; Shan, F.; Liu, J.; Mo, Z.; Yan, F.; Ding, Z.; Yang, Q.; Song, B.; et al. Dual-Sampling Attention Network for Diagnosis of COVID-19 from Community Acquired Pneumonia. IEEE Trans. Med. Imaging 2020, 39, 2595–2605. [Google Scholar] [CrossRef]
- Mahmud, T.; Rahman, M.A.; Fattah, S.A. CovXNet: A multi-dilation convolutional neural network for automatic COVID-19 and other pneumonia detection from chest X-ray images with transferable multi-receptive feature optimization. Comput. Biol. Med. 2020, 122, 103869. [Google Scholar] [CrossRef] [PubMed]
- Shi, F.; Xia, L.; Shan, F.; Wu, D.; Wei, Y.; Yuan, H.; Jiang, H. Large-Scale Screening of COVID-19 from Community Acquired Pneumonia using Infection Size-Aware Classification. arXiv 2020, arXiv:2003.09860. [Google Scholar]
- Breiman, L. Random forests. Mach. Learn. 2001, 45, 5–32. [Google Scholar] [CrossRef] [Green Version]
- Xu, X.; Jiang, X.; Ma, C.; Du, P.; Li, X.; Ly, S.; Yu, L.; Chen, Y.; Su, J.; Lang, G.; et al. A Deep Learning System to Screen Novel Coronavirus Disease 2019 Pneumonia. Engineering 2020. [Google Scholar] [CrossRef]
- Singh, D.; Kumar, V.; Kaur, M. Classification of COVID-19 patients from chest CT images using multi-objective differential evolution–based convolutional neural networks. Eur. J. Clin. Microbiol. Infect. Dis. 2020, 39, 1379–1389. [Google Scholar] [CrossRef]
- Sedik, A.; Iliyasu, A.M.; El-Rahiem, B.A.; Abdel Samea, M.E.; Abdel-Raheem, A.; Hammad, M.; Peng, J.; Abd El-Samie, F.E.; Abd El-Latif, A.A. Deploying machine and deep learning models for efficient data-augmented detection of COVID-19 infections. Viruses 2020, 12, 769. [Google Scholar] [CrossRef]
- Ahsan, M.M.; Alam, T.E.; Trafalis, T.; Huebner, P. Deep MLP-CNN model using mixed-data to distinguish between COVID-19 and Non-COVID-19 patients. Symmetry 2020, 12, 1526. [Google Scholar] [CrossRef]
- Afshar, P.; Heidarian, S.; Naderkhani, F.; Oikonomou, A.; Plataniotis, K.N.; Mohammadi, A. COVID-CAPS: A capsule network-based framework for identification of COVID-19 cases from X-ray images. Pattern Recognit. Lett. 2020, 138, 638–643. [Google Scholar] [CrossRef] [PubMed]
- Rosenthal, A.; Gabrielian, A.; Engle, E.; Hurt, D.E.; Alexandru, S.; Crudu, V.; Sergueev, E.; Kirichenko, V.; Lapitskii, V.; Snezhko, E.; et al. The TB Portals: An Open-Access, Web- Based Platform for Global Drug-Resistant- Tuberculosis Data Sharing and Analysis. J. Clin. Microbiol. 2017, 55, 3267–3282. [Google Scholar] [CrossRef] [PubMed] [Green Version]
- Cid, Y.D.; Liauchuk, V.; Klimuk, D.; Tarasau, A. Overview of ImageCLEFtuberculosis 2019—Automatic CT—Based Report Generation and Tuberculosis Severity Assessment; CEUR-WS: Lugano, Switzerland, 2019; pp. 9–12. [Google Scholar]
- Demner-Fushman, D.; Kohli, M.D.; Rosenman, M.B.; Shooshan, S.E.; Rodriguez, L.; Antani, S.; Thoma, G.R.; McDonald, C.J. Preparing a collection of radiology examinations for distribution and retrieval. J. Am. Med. Inform. Assoc. 2016, 23, 304–310. [Google Scholar] [CrossRef]
- Shiraishi, J.; Katsuragawa, S.; Ikezoe, J.; Matsumoto, T.; Kobayashi, T.; Komatsu, K.I.; Matsui, M.; Fujita, H.; Kodera, Y.; Doi, K. Development of a digital image database for chest radiographs with and without a lung nodule: Receiver operating characteristic analysis of radiologists’ detection of pulmonary nodules. Am. J. Roentgenol. 2000, 174, 71–74. [Google Scholar] [CrossRef] [PubMed]
- Jaeger, S.; Candemir, S.; Antani, S.; Wáng, Y.x.J.; Lu, P.x.; Thoma, G. Two public chest X-ray datasets for computer-aided screening of pulmonary diseases. Quant. Imaging Med. Surg. 2014, 4, 475–477. [Google Scholar] [CrossRef]
- Xiaosong, W.; Yifan, P.; Le, L.; Lu, Z.; Mohammadhadi, B.; Summers, R.M. ChestX-ray8: Hospital-scale chest X-ray database and benchmarks on weakly-supervised classification and localization of common thorax diseases. In Proceedings of the IEEE conference on computer vision and pattern recognition, Honolulu, HI, USA, 21–26 July 2017; pp. 3462–3471. [Google Scholar]
- Costa, M.G.; Filho, C.F.; Kimura, A.; Levy, P.C.; Xavier, C.M.; Fujimoto, L.B. A sputum smear microscopy image database for automatic bacilli detection in conventional microscopy. In Proceedings of the 2014 36th Annual International Conference of the IEEE Engineering in Medicine and Biology ociety, EMBC, Chicago, IL, USA, 26–30 August 2014; pp. 2841–2844. [Google Scholar] [CrossRef]
- Armato, S.G.; McLennan, G.; Bidaut, L.; McNitt-Gray, M.F.; Meyer, C.R.; Reeves, A.P.; Zhao, B.; Aberle, D.R.; Henschke, C.I.; Hoffman, E.A.; et al. The Lung Image Database Consortium (LIDC) and Image Database Resource Initiative (IDRI): A completed reference database of lung nodules on CT scans. Med. Phys. 2011, 38, 915–931. [Google Scholar] [CrossRef]
- Grossman, R.L.; Allison, P.; Ferrentti, V.; Varmus, H.E.; Lowy, D.R.; Kibbe, W.A.; Staudt, L.M. Toward a Shared Vision for Cancer Genomic Data. N. Engl. J. Med. 2016, 375, 1109–1112. [Google Scholar] [CrossRef]
- Cohen, J.P.; Morrison, P.; Dao, L.; Roth, K.; Duong, T.Q.; Ghassemi, M. COVID-19 Image Data Collection: Prospective Predictions Are the Future. arXiv 2020, arXiv:2006.11988. [Google Scholar]


| Authors | Deep Learning Technique | Features | Dataset |
|---|---|---|---|
| [74] | CNN with transfer learning and data augmentation | Features extracted from CNN | Montgomery |
| [38] | K-nearest neighbour, Simple Linear Regression and Sequential Minimal Optimisation (SMO) Classification | Area, major axis, minor axis, eccentricity, mean, kurtosis, skewness and entropy | Shenzhen |
| [84] | ViDi | Features extracted from CNN | Unspecified |
| [64] | CNN | Gabor, LBP, SIFT, PHOG and Features extracted from CNN | Private dataset |
| [24] | CNN | Features extracted from CNN | ImageCLEF 2018 dataset |
| [62] | CNN with transfer learning, with demographic information | Features extracted from CNN + demographic information | Private dataset |
| [79] | CNN with data augmentation, and ensemble by weighted averages of probability scores | Features extracted from CNN | Montgomery, Shenzhen, Belarus, JSRT |
| [70] | CNN with transfer learning and data augmentation | Features extracted from CNN | Private dataset, Montgomery, Shenzhen |
| [69] | CNN | Features extracted from CNN | Private datasets, Montgomery, Shenzhen |
| [71] | CNN with transfer learning and ensemble by simple linear probabilities averaging | Features extracted from CNN + rule-based features | Indiana, JSRT, Shenzhen |
| [29] | CNN | HoG features | ZiehlNeelsen Sputum smear Microscopy image DataBase |
| [75] | CNN and shuffle sampling | Features extracted from CNN | Private datasets |
| [81] | CNN with transfer learning and ensemble by averaging | CNN extracted features from edge images | Montgomery, Shenzhen |
| [57] | CNN with transfer learning, data augmentation and ensemble by weighted probability scores average | Features extracted from CNN | Private dataset, Montgomery, Shenzhen, Belarus |
| [85] | AutoEncoder-CNN | Features extracted from CNN | Private dataset |
| [76] | CNN with transfer learning and shuffle sampling | Features extracted from CNN | Private dataset |
| [65] | End-to-end CNN | Features extracted from CNN | Montgomery, Shenzhen |
| [88] | Optical flow model | Activity Description Vector on optical flow of video sequences | ImageCLEF 2019 dataset |
| [28] | CNN | Colours | TBimages dataset |
| [83] | Modified maximum pattern margin support vector machine (modified miSVM) | First four moments of the intensity distributions | Private datasets |
| [61] | CAD4TB with clinical information | Features extracted from CNN + clinical features | Private dataset |
| [31] | DBN | LoH + SURF features | ZiehlNeelsen Sputum smear Microscopy image DataBase |
| [60] | CAD4TB | Features extracted from CNN | Private dataset |
| [72] | CNN with transfer learning and data augmentation | Features extracted from CNN | Montgomery, Shenzhen, NIH-14 dataset |
| [30] | CNN | Features extracted from CNN | TBimages dataset |
| [63] | CNN from scratch and data augmentation | Features extracted from CNN | Montgomery, Shenzhen, Belarus |
| [86] | 3D CNN | Features extracted from CNN + lung volume + patient attribute metadata | ImageCLEF 2019 dataset |
| [12] | CNN with transfer learning and ensemble by stacking | local and global feature descriptors + features extracted from CNN | Private dataset, Montgomery, Shenzhen, India |
| [80] | CNN with transfer learning and feature level ensemble | Features extracted from CNN | Shenzhen |
| [15] | CNN with transfer learning and ensemble by averaging | CNN extracted features from edge images | Montgomery, Shenzhen |
| [32] | CNN with transfer learning | Features extracted from CNN | ZiehlNeelsen Sputum smear Microscopy image DataBase |
| [66] | CNN with data augmentation | Features extracted from CNN | Shenzhen |
| [73] | CNN with transfer learning and data augmentation | Features extracted from CNN | NIH-14, Montgomery, Shenzhen |
| [19] | CNN with transfer learning, Bag of CNN Features and ensemble by a simple soft-voting scheme | Features extracted from CNN + BOW | Private dataset, Montgomery, Shenzhen |
| [36] | Neural network | Shape, curvature descriptor histograms, eigenvalues of Hessian matrix | Montgomery, Shenzhen |
| [77] | CNN with transfer learning and data augmentation | Features extracted from CNN | Montgomery, Shenzhen, NIH-14 |
| [87] | 3D CNN | Features extracted from CNN | ImageCLEF 2019 dataset |
| [78] | CNN and Artificial Ecosystem-based Optimisation algorithm | Features extracted from CNN | Shenzhen |
| [67] | CNN | Features extracted from CNN | Shenzhen |
| [68] | Bayesian based CNN | Features extracted from CNN | Montgomery, Shenzhen |
| [82] | CNN with transfer learning, and ensemble by majority voting, simple averaging, weighted averaging, and stacking | Features extracted from CNN | Montgomery, Shenzhen, LDOCTCXR, 2018 RSNA pneumonia challenge dataset, Indiana dataset |
| Reference | Deep Learning Technique | Features | Dataset |
|---|---|---|---|
| [99] | Deep Siamese based neural network | CNN extracted features from the left half and right half of the lungs | Unspecified Kaggle dataset |
| [20] | CNN with transfer learning and data augmentation | Features extracted from CNN | LDOCTCXR |
| [55] | CNN with transfer learning, data augmentation and ensemble by majority voting. | Features extracted from CNN | LDOCTCXR |
| [93] | CNN with transfer learning | Features extracted from CNN | LDOCTCXR |
| [102] | CNN with transfer learning, data augmentation and ensemble by combining confidence scores and bounding boxes. | Features extracted from CNN | Radiological Society of North America (RSNA) pneumonia dataset |
| [96] | CNN with transfer learning and data augmentation | Features extracted from CNN | NIH Chest X-ray Dataset |
| [92] | CNN from scratch and data augmentation | Features extracted from CNN | LDOCTCXR |
| [95] | CNN with transfer learning | Features extracted from CNN | LDOCTCXR |
| [91] | CNN | Features extracted from CNN | Mooney’s Kaggle dataset |
| [100] | CNN and LSTM-CNN, with transfer learning and data augmentation | Features extracted from CNN | Mooney’s Kaggle dataset |
| [103] | CNN with probabilistic map of pneumonia | Features extracted from CNN | 2018 RSNA pneumonia challenge dataset |
| [101] | Decision Tree, Random Forest, K-nearest neighbour, AdaBoost, Gradient Boost, XGBboost, CNN | Multiple features | Mooney’s Kaggle dataset |
| [98] | CNN with transfer learning, data augmentation and ensemble by weighted averaging | Features extracted from CNN | LDOCTCXR |
| [97] | CNN with transfer learning and data augmentation | Features extracted from CNN | Mooney’s Kaggle dataset |
| [94] | CNN with transfer learning | Features extracted from CNN | Private dataset |
| Reference | Deep Learning Technique | Features | Dataset |
|---|---|---|---|
| [13] | CNN | Features extracted from CNN | LUNA, LIDC, NLST |
| [113] | CNN with transfer learning | Features extracted from CNN | JSRT Dataset, NIH-14 dataset |
| [107] | Multi-stream multi-scale convolutional networks | Features extracted from CNN | MILD dataset DLCST dataset |
| [34] | CNN with transfer learning | Features extracted from CNN | NCI Genomic Data Commons |
| [110] | CNN with transfer learning and data augmentation | Features extracted from CNN | NSCLC-Radiomics, NSCLC-Radiomics-Genomics, RIDER Collections and several private datasets |
| [105] | CNN and DBN | Features extracted from CNN and DBN | LIDC-IDRI |
| [112] | CNN with transfer learning | Features extracted from CNN | Kaggle Data Science Bowl 2017 dataset, Lung Nodule Analysis 2016 (LUNA16) dataset |
| [25] | CNN | Features extracted from CNN | LIDC-IDRI |
| [108] | CNN | Features extracted from CNN | LIDC-IDRI |
| [23] | CNN with data augmentation | Features extracted from CNN | LIDC-IDRI database |
| [111] | CNN with transfer learning and data augmentation | Features extracted from CNN | Private dataset |
| [14] | Bone elimination and lung segmentation before training with CNN | Features extracted using CNN from bone eliminated lung images and segmented lung images | JSRT dataset |
| [114] | CNN-long short-term memory network | Features extracted from CNN | NIH-14 dataset |
| [109] | CNN with transfer learning and data augmentation | Features extracted from CNN | JSRT database |
| [106] | CNN with data augmentation | Features extracted from CNN | Cancer Imaging Archive |
| Authors | Deep Learning Technique | Features | Dataset |
|---|---|---|---|
| [137] | CNN with transfer learning and location-attention classification mechanism | Features extracted from CNN | Private dataset |
| [125] | CNN with transfer learning and data augmentation | Features extracted from CNN | SIRM database, Cohen’s Github dataset, Chowdhury’s Kaggle dataset |
| [26] | RADLogics Inc., CNN with transfer learning and data augmentation | Features extracted from RADLogics Inc and CNN | Chainz Dataset, A dataset from a hospital in Wenzhou, China, Dataset from El-Camino Hospital (CA) and Lung image database consortium (LIDC) |
| [123] | CNN with transfer learning | Features extracted from CNN | Cohen’s Github dataset and LDOCTCXR |
| [21] | CNN with transfer learning and data augmentation | Features extracted from CNN | Cohen’s Github dataset and unspecified Kaggle dataset |
| [135] | VB-Net and modified random decision forests method | 96 handcrafted image features | Dataset obtained from Tongji Hospital of Huazhong University of Science and Technology, Shanghai Public Health Clinical Center of Fudan University, and China-Japan Union Hospital of Jilin University. |
| [126] | CNN from scratch and data augmentation | Features extracted from CNN | COVIDx Dataset |
| [127] | CNN with transfer learning | Features extracted from CNN | Cohen’s Github dataset, Andrew’s Kaggle dataset, LDOCTCXR |
| [117] | CNN with transfer learning | Features extracted from CNN | Cohen’s Github dataset, RSNA pneumonia dataset, COVIDx |
| [131] | CNN with transfer learning and data augmentation | Features extracted from CNN | Sajid’s Kaggle dataset |
| [4] | CNN with transfer learning and data augmentation | Features extracted from CNN | Cohen’s Github dataset, Mooney’s Kaggle dataset |
| [118] | CNN with transfer learning | Features extracted from CNN | COVID-CT-Dataset |
| [128] | CNN as feature extractor and long short-term memory (LSTM) network as classifier | Features extracted from CNN | GitHub, Radiopaedia, The Cancer Imaging Archive, SIRM, Kaggle repository, NIH dataset, Mendeley dataset |
| [132] | CNN with transfer learning and synthetic data generation and augmentation | Features extracted from CNN | Cohen’s Github, Chowdhury’s Kaggle dataset, COVID-19 Chest X-ray Dataset, Initiative |
| [129] | CNN with transfer learning, data augmentation and ensemble by majority voting | Features extracted from CNN | Cohen’s Github, LDOCTCXR |
| [134] | CNN with transfer learning and stacking ensemble | Features extracted from CNN | Private dataset, LDOCTCXR |
| [130] | CNN | Features extracted from CNN | Private dataset |
| [138] | Multi-objective differential evolution-based CNN | Features extracted from CNN | Unspecified |
| [119] | CNN with transfer learning | Features extracted from CNN | Cohen’s Github |
| [139] | CNN and ConvLSTM with data augmentation | Features extracted from CNN | Cohen’s Github, COVID-CT-Dataset |
| [120] | CNN with transfer learning | Features extracted from CNN | Cohen’s Github |
| [133] | CNN with ensemble by weighted averaging | Features extracted from CNN | Private hospital datasets |
| [121] | CNN with transfer learning | Features extracted from CNN | Cohen’s Github, Mooney’s Kaggle dataset, Shenzhen and Montgomery datasets |
| [140] | MLP-CNN based model | Features extracted from CNN | Cohen’s Github |
| [122] | CNN with transfer learning | Features extracted from CNN | Cohen’s Github, unspecified Kaggle dataset |
| [141] | Capsule Network-based framework with transfer learning | Features extracted from CNN | Cohen’s Github, Mooney’s Kaggle dataset |
| Name | Disease | Image Type | Reference | Number of Images | Link |
|---|---|---|---|---|---|
| Belarus dataset | Tuberculosis | X-ray and CT | [142] | 1299 | http://tuberculosis.by |
| ImageCLEF 2018 dataset | Tuberculosis | CT | 2287 | https://www.imageclef.org/2018/tuberculosis | |
| ImageCLEF 2019 dataset | Tuberculosis | CT | [143] | 335 | https://www.imageclef.org/2019/medical/tuberculosis |
| India | Tuberculosis | X-ray | [39] | 78 tuberculosis and 78 normal | https://sourceforge.net/projects/tbxpredict/ |
| Indiana Dataset | Multiple diseases with annotations | X-ray | [144] | 7284 | https://openi.nlm.nih.gov |
| JSRT dataset | Lung nodules and normal | X-ray and CT | [145] | 154 nodule and 93 non-nodule | http://db.jsrt.or.jp/eng.php |
| Montgomery and Shenzhen datasets | Tuberculosis and normal | X-ray | [146] | 394 tuberculosis and 384 normal | https://lhncbc.nlm.nih.gov/publication/pub9931 |
| NIH-14 dataset | Pneumonia and 13 other diseases | X-ray | [147] | 112120 | https://www.kaggle.com/nih-chest-xrays/data |
| TBimages dataset | Tuberculosis | Sputum smear microscopy image | [148] | 1320 | http://www.tbimages.ufam.edu.br/ |
| ZiehlNeelsen Sputum smear Microscopy image DataBase | Tuberculosis | Sputum smear microscopy image | [27] | 620 tuberculosis and 622 normal | http://14.139.240.55/znsm/ |
| Large Dataset of Labeled Optical Coherence Tomography (OCT) and Chest X-Ray Images (LDOCTCXR) | Pneumonia and normal | X-ray | [93] | 3883 pneumonia and 1349 normal | https://data.mendeley.com/datasets/rscbjbr9sj/3 |
| Radiological Society of North America (RSNA) pneumonia dataset | Pneumonia and normal | X-ray | 5528 | https://www.kaggle.com/c/rsna-pneumonia-detection-challenge/data |
| Name | Disease | Image Type | Reference | Number of Images | Link |
|---|---|---|---|---|---|
| LDOCTCXR | X-ray | [93] | 3883 pneumonia and 1349 normal | https://data.mendeley.com/datasets/rscbjbr9sj/3 | |
| NIH Chest X-ray Dataset | Pneumonia and 13 other diseases | X-ray | [147] | 112,120 | https://www.kaggle.com/nih-chest-xrays/data |
| Radiological Society of North America (RSNA) pneumonia dataset | Pneumonia and normal | X-ray | 5528 | https://www.kaggle.com/c/rsna-pneumonia-detection-challenge/data | |
| Mooney’s Kaggle dataset | Pneumonia and normal | X-ray | 5863 | https://www.kaggle.com/paultimothymooney/chest-xray-pneumonia |
| Name | Disease | Image Type | Reference | Number of Images | Link |
|---|---|---|---|---|---|
| JSRT dataset | Lung nodules and normal lungs | X-ray and CT | [145] | 154 nodule and 93 non-nodule | http://db.jsrt.or.jp/eng.php |
| Kaggle Data Science Bowl 2017 dataset | Lung Cancer | CT scans | 601 | https://www.kaggle.com/c/data-science-bowl-2017/overview | |
| LIDC-IDRI | Lung Cancer | CT | [149] | 1018 | https://wiki.cancerimagingarchive.net/display/Public/LIDC-IDRI |
| Lung Nodule Analysis 2016 (LUNA16) dataset | Location and size of lung nodules | CT scans | [8] | 888 | https://luna16.grand-challenge.org/download/ |
| NCI Genomic Data Commons | Lung Cancer | histopa- thology images | [150] | More than 575,000 | https://portal.gdc.cancer.gov/ |
| NIH-14 dataset | 14 lung diseases | X-ray | [147] | 112,120 | https://www.kaggle.com/nih-chest-xrays/data |
| NLST | Lung Cancer | CT | Approximately 200,000 | https://biometry.nci.nih.gov/cdas/learn/nlst/images/ | |
| NSCLC-Radiomics | Lung Cancer | CT | 422 | https://wiki.cancerimagingarchive.net/display/Public/NSCLC-Radiomics | |
| NSCLC- Radiomics -Genomics | Lung Cancer | CT | 89 | https://wiki.cancerimagingarchive.net/display/Public/NSCLC-Radiomics-Genomics | |
| RIDER Collections | Lung Cancer | CT | Approximately 280,000 | https://wiki.cancerimagingarchive.net/display/Public/RIDER+Collections |
| Name | Disease | Image Type | Reference | Number of Images | Link |
|---|---|---|---|---|---|
| Andrew’s Kaggle dataset | COVID-19 | X-ray and CT | 79 | https://www.kaggle.com/andrewmvd/convid19-x-rays | |
| Chainz Dataset | COVID-19 and normal | CT | 50 COVID-19, 51 normal | www.ChainZ.cn | |
| Chowdhury’s Kaggle dataset | COVID-19, normal and pneumonia | X-ray | [125] | 219 COVID-19, 1341 normal and 1345 pneumonia | https://www.kaggle.com/tawsifurrahman/covid19-radiography-database |
| Cohen’s Github dataset | COVID-19 | X-ray and CT | [151] | 123 | https://github.com/ieee8023/covid-chestxray-dataset |
| COVIDx Dataset | COVID-19, normal and pneumonia | X-ray | [126] | 573 COVID-19, 8066 normal and 5559 pneumonia | https://github.com/lindawangg/COVID-Net/blob/master/docs/COVIDx.md |
| Italian Society Of Medical And Interventional Radiology (SIRM) COVID-19 Database | COVID-19 | X-ray and CT | 68 | https://www.sirm.org/category/senza-categoria/covid-19/ | |
| LDOCTCXR | Pneumonia and normal | X-ray | [93] | 3883 pneumonia and 1349 normal | https://data.mendeley.com/datasets/rscbjbr9sj/3 |
| Lung image database consortium (LIDC) | Lung Cancer | CT | [149] | 1018 | https://wiki.cancerimagingarchive.net/display/Public/LIDC-IDRI |
| Sajid’s Kaggle dataset | COVID-19 and normal | X-ray | 28 normal, 70 COVID-19 | https://www.kaggle.com/nabeelsajid917/covid-19-x-ray-10000-images | |
| Mooney’s Kaggle dataset | Pneumonia and normal | X-ray | 5863 | https://www.kaggle.com/paultimothymooney/chest-xray-pneumonia | |
| COVID-CT Dataset | COVID-19 and normal | CT | 349 COVID-19 and 463 non-COVID-19 | https://github.com/UCSD-AI4H/COVID-CT | |
| Mendeley Augmented COVID-19 X-ray Images Dataset | COVID-19 and normal | X-ray | 912 | https://data.mendeley.com/datasets/2fxz4px6d8/4 | |
| COVID-19 Chest X-Ray Dataset Initiative | COVID-19 | X-ray | 55 | https://github.com/agchung/Figure1-COVID-chestxray-dataset |
Publisher’s Note: MDPI stays neutral with regard to jurisdictional claims in published maps and institutional affiliations. |
© 2020 by the authors. Licensee MDPI, Basel, Switzerland. This article is an open access article distributed under the terms and conditions of the Creative Commons Attribution (CC BY) license (http://creativecommons.org/licenses/by/4.0/).
Share and Cite
Kieu, S.T.H.; Bade, A.; Hijazi, M.H.A.; Kolivand, H. A Survey of Deep Learning for Lung Disease Detection on Medical Images: State-of-the-Art, Taxonomy, Issues and Future Directions. J. Imaging 2020, 6, 131. https://0-doi-org.brum.beds.ac.uk/10.3390/jimaging6120131
Kieu STH, Bade A, Hijazi MHA, Kolivand H. A Survey of Deep Learning for Lung Disease Detection on Medical Images: State-of-the-Art, Taxonomy, Issues and Future Directions. Journal of Imaging. 2020; 6(12):131. https://0-doi-org.brum.beds.ac.uk/10.3390/jimaging6120131
Chicago/Turabian StyleKieu, Stefanus Tao Hwa, Abdullah Bade, Mohd Hanafi Ahmad Hijazi, and Hoshang Kolivand. 2020. "A Survey of Deep Learning for Lung Disease Detection on Medical Images: State-of-the-Art, Taxonomy, Issues and Future Directions" Journal of Imaging 6, no. 12: 131. https://0-doi-org.brum.beds.ac.uk/10.3390/jimaging6120131